Article

Measuring Eco-Efficiency of State-Owned Forestry Enterprises in Northeast China

1
Research Institute of Forestry Policy and Information, Chinese Academy of Forestry, Beijing 100091, China
2
School of Business, Nanjing Normal University, Nanjing 210023, China
3
School of Management Engineering, Xi’an University of Finance & Economics, Xi’an 710010, China
4
College of Economics and Management, Northwest A & F University, Yangling 712100, China
*
Author to whom correspondence should be addressed.
Forests 2018, 9(8), 455; https://doi.org/10.3390/f9080455
Submission received: 25 June 2018 / Revised: 18 July 2018 / Accepted: 24 July 2018 / Published: 27 July 2018

Abstract

:
State-owned forestry enterprises (SOFEs) play an important role in the forestry economy in China. Understanding the eco-efficiency of their production is beneficial for the development of sustainable forestry and for achieving Goal 8 of the United Nations’ Sustainable Development Goals (SDGs): Decent Work and Economic Growth. This paper assesses SOFEs’ overall eco-efficiency by analyzing various undesirable outputs using the Slacks-Based Measure of efficiency in Data Envelopment Analysis (SBM-DEA) model. Using basic data from 87 SOFEs in Northeast China from 2003 to 2016, this paper evaluated the eco-efficiency development level and spatial patterns of that region. The results show that SOFEs’ low eco-efficiency was caused by low pure-technical efficiency. Regional differences in eco-efficiency were very significant and became larger, but a market-oriented reform might help to improve such efficiency. The eco-efficiency of SOFEs was in decline from 2003 to 2016 due to the implementation of the Natural Forest Protection Project (NFPP). However, due to a relative lack of production factor inputs, most SOFEs’ scale returns are now increasing. In the future, efforts should be made to promote market-oriented reforms and take the path of large-scale development.

1. Introduction

In 2015, the UN resolution, “Transforming our World: The 2030 Agenda for Sustainable Development” provided 17 Sustainable Development Goals (SDGs) [1]. Goal 8 (Decent Work and Economic Growth) means that higher levels of productivity are achievable through technological upgrades paired with smart policies.
Sustainable development is a process which not only meets the needs of present-day people, but also meets the needs of generations to come. The essential features of sustainable development are resource conservation, pollution reduction, and output increases [2,3]. Eco-efficiency is an indicator of efficiency which includes and considers both economic development and environmental protection. Increasing eco-efficiency means saving resources, reducing pollution, and increasing output; therefore, improving eco-efficiency means promoting sustainable development, which is beneficial for achieving SDG 8.
Over the past decade, tremendous developmental achievements have been made in China’s forestry industry. According to the China Forestry Statistical Yearbook, the real total output value of the forestry industry increased from RMB 586.03 billion in 2003 to RMB 5490.86 billion in 2016, a rise of 836.95% based on 2003 constant prices. However, the historical development pattern of the forestry industry—the paper industry being a good example—relied too heavily on high input, high pollution, and high output models [4]. Most of the materials used by forestry enterprises were taken directly from forests, making them resource-based enterprises. Due to environmental pollution and an increasingly severe constraint on resources, an altering of the traditional forestry enterprise development pattern is called for.
State-owned forestry enterprises (SOFEs) are a unique type of forestry enterprise. Compared with other such enterprises, they have three major characteristics. One, their forestry resources are owned by and under the care of the government. Two, they control a large land area of forest, or one which is equivalent to the land area of one county in China. Three, as a complex industrial group, SOFEs include a primary industry, secondary industry, and tertiary industry. Table 1 shows the contents of each industry classification in China. Due to long-term deforestation, the ‘double crisis’ emerged in the SOFE industry from the late 1980s onward, characterized by forest resource shortages and financial difficulties [5,6]. To get rid of the ‘double crisis’, SOFEs are recommended to accelerate industrial transformation and improve ecological efficiency. It is thus very important to study the eco-efficiency of SOFEs. Although some studies only focused on the desirable outputs of SOFEs and measured the economic efficiency of them, very few studies have focused on both desirable and undesirable outputs and measured their eco-efficiency. This paper used the SBM-DEA model to evaluate the eco-efficiency of SOFEs in Northeast China from 2003 to 2016.

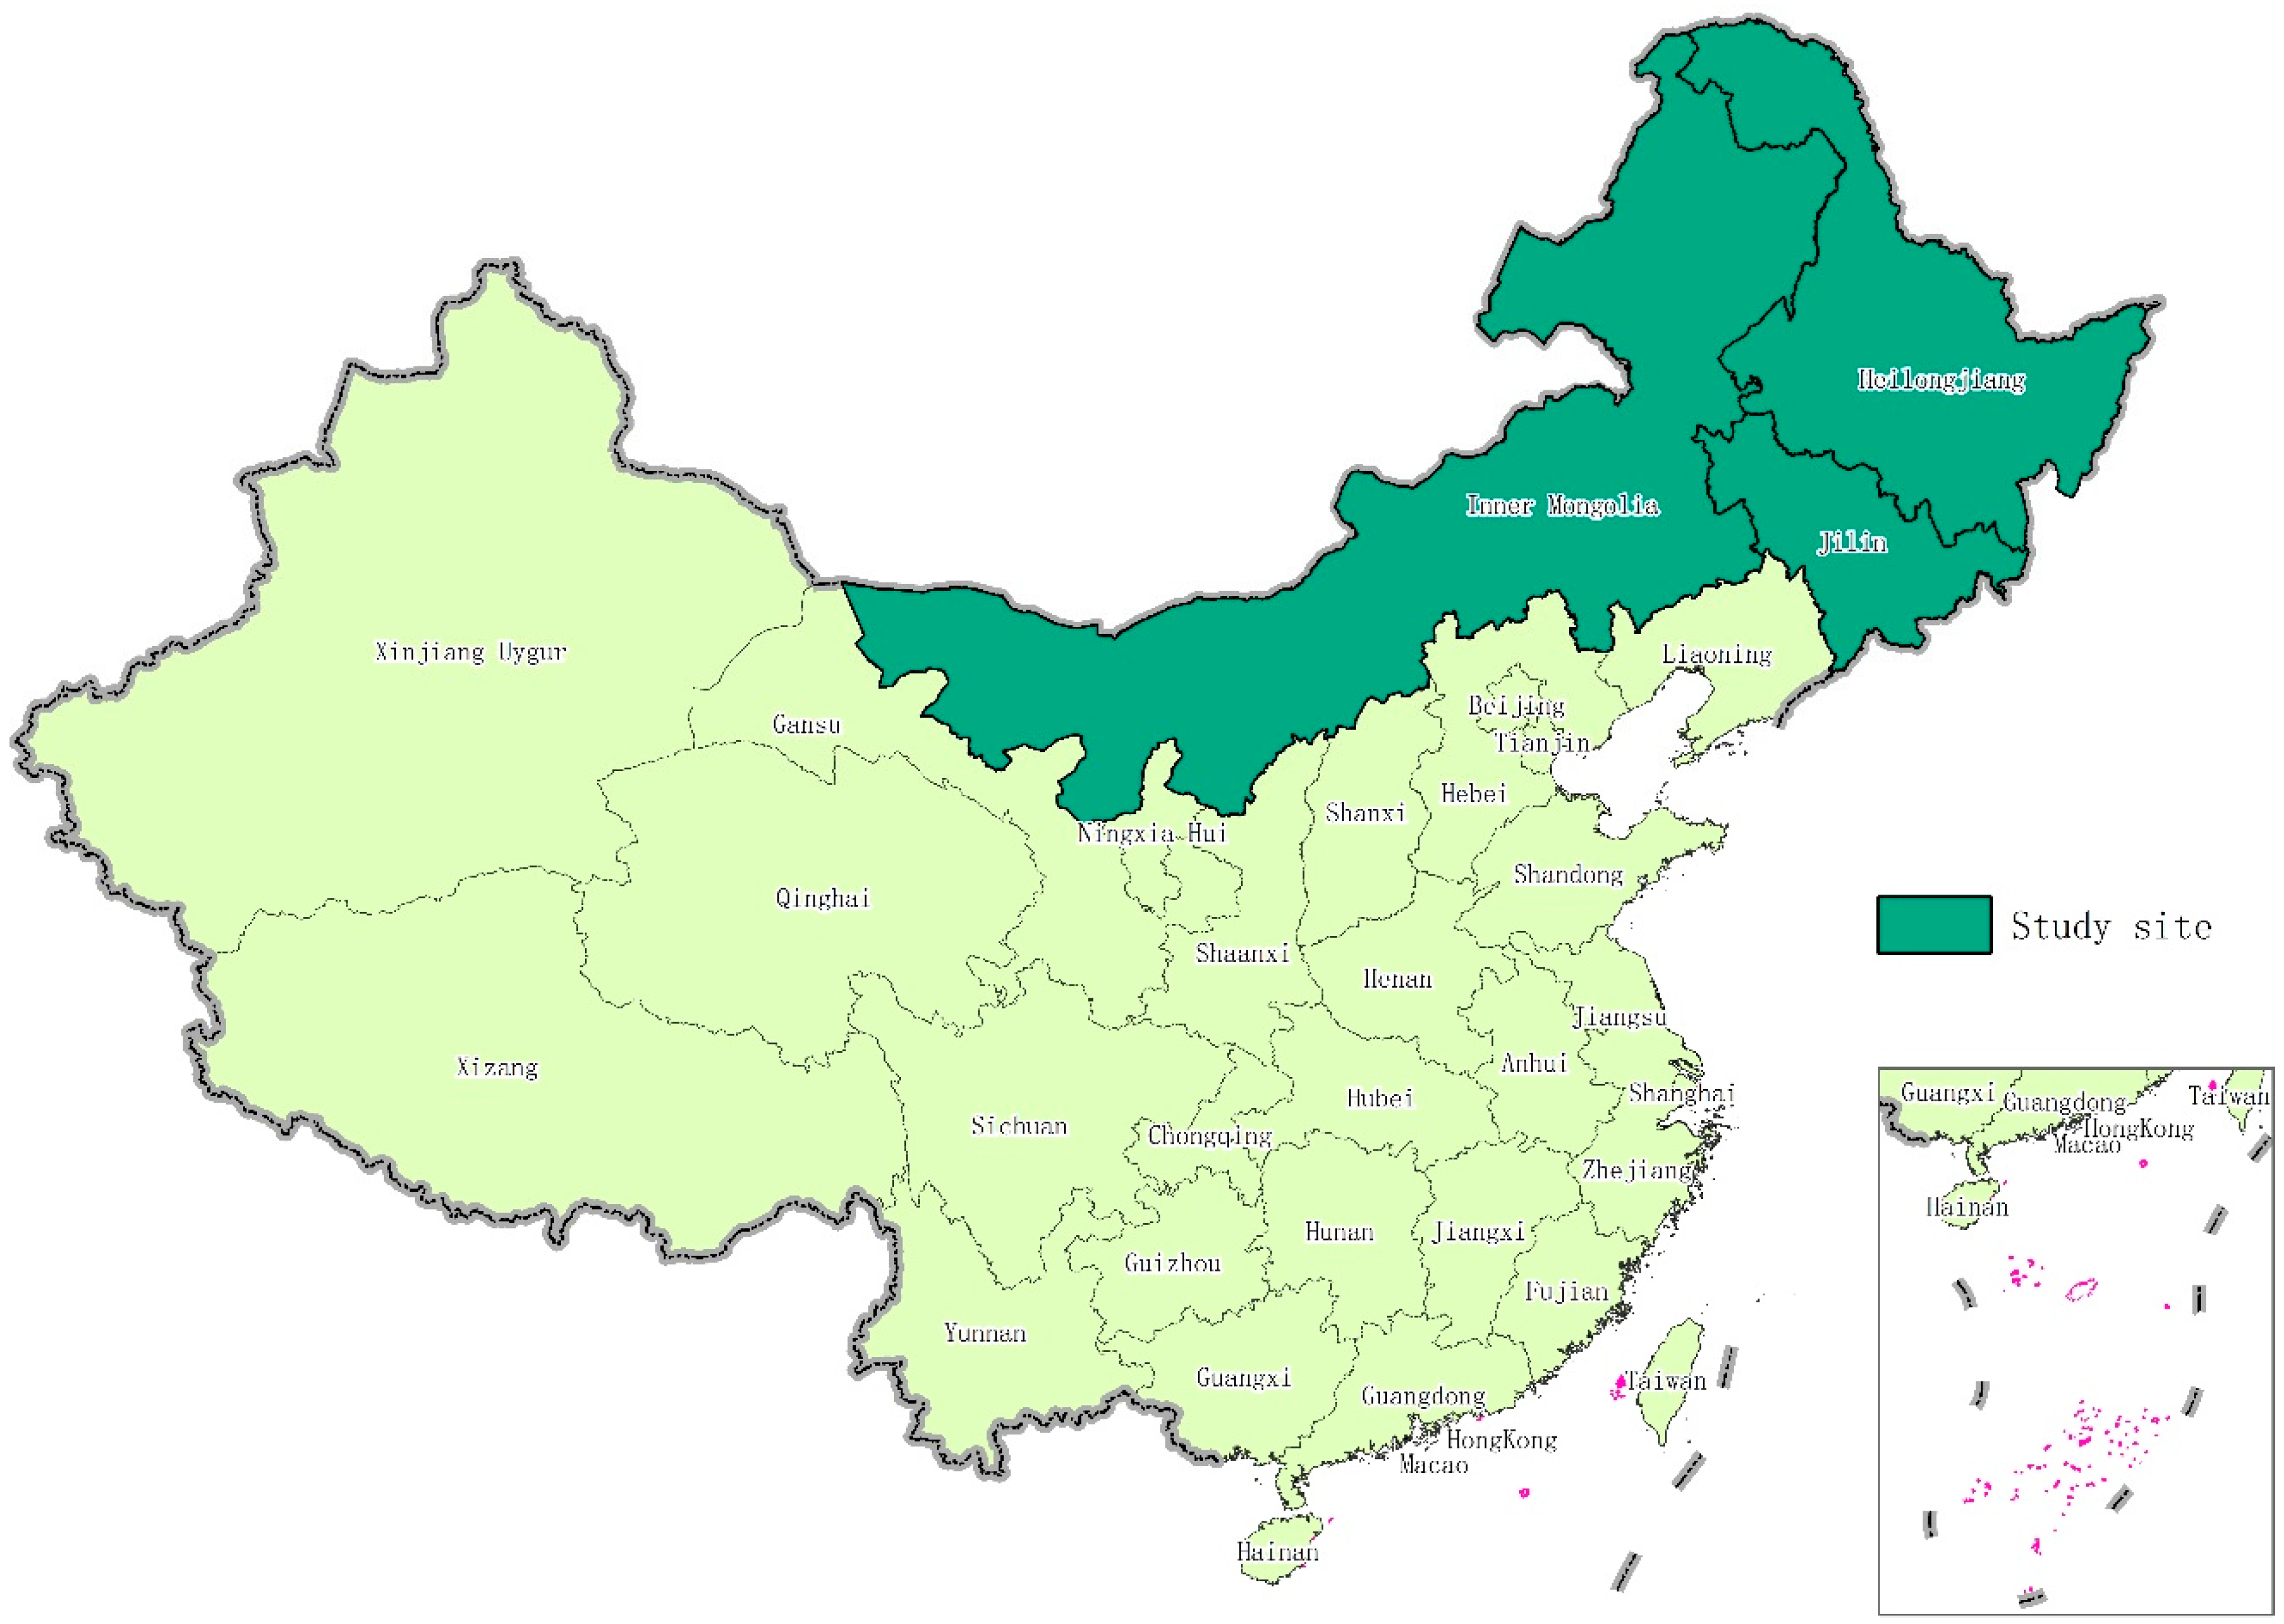
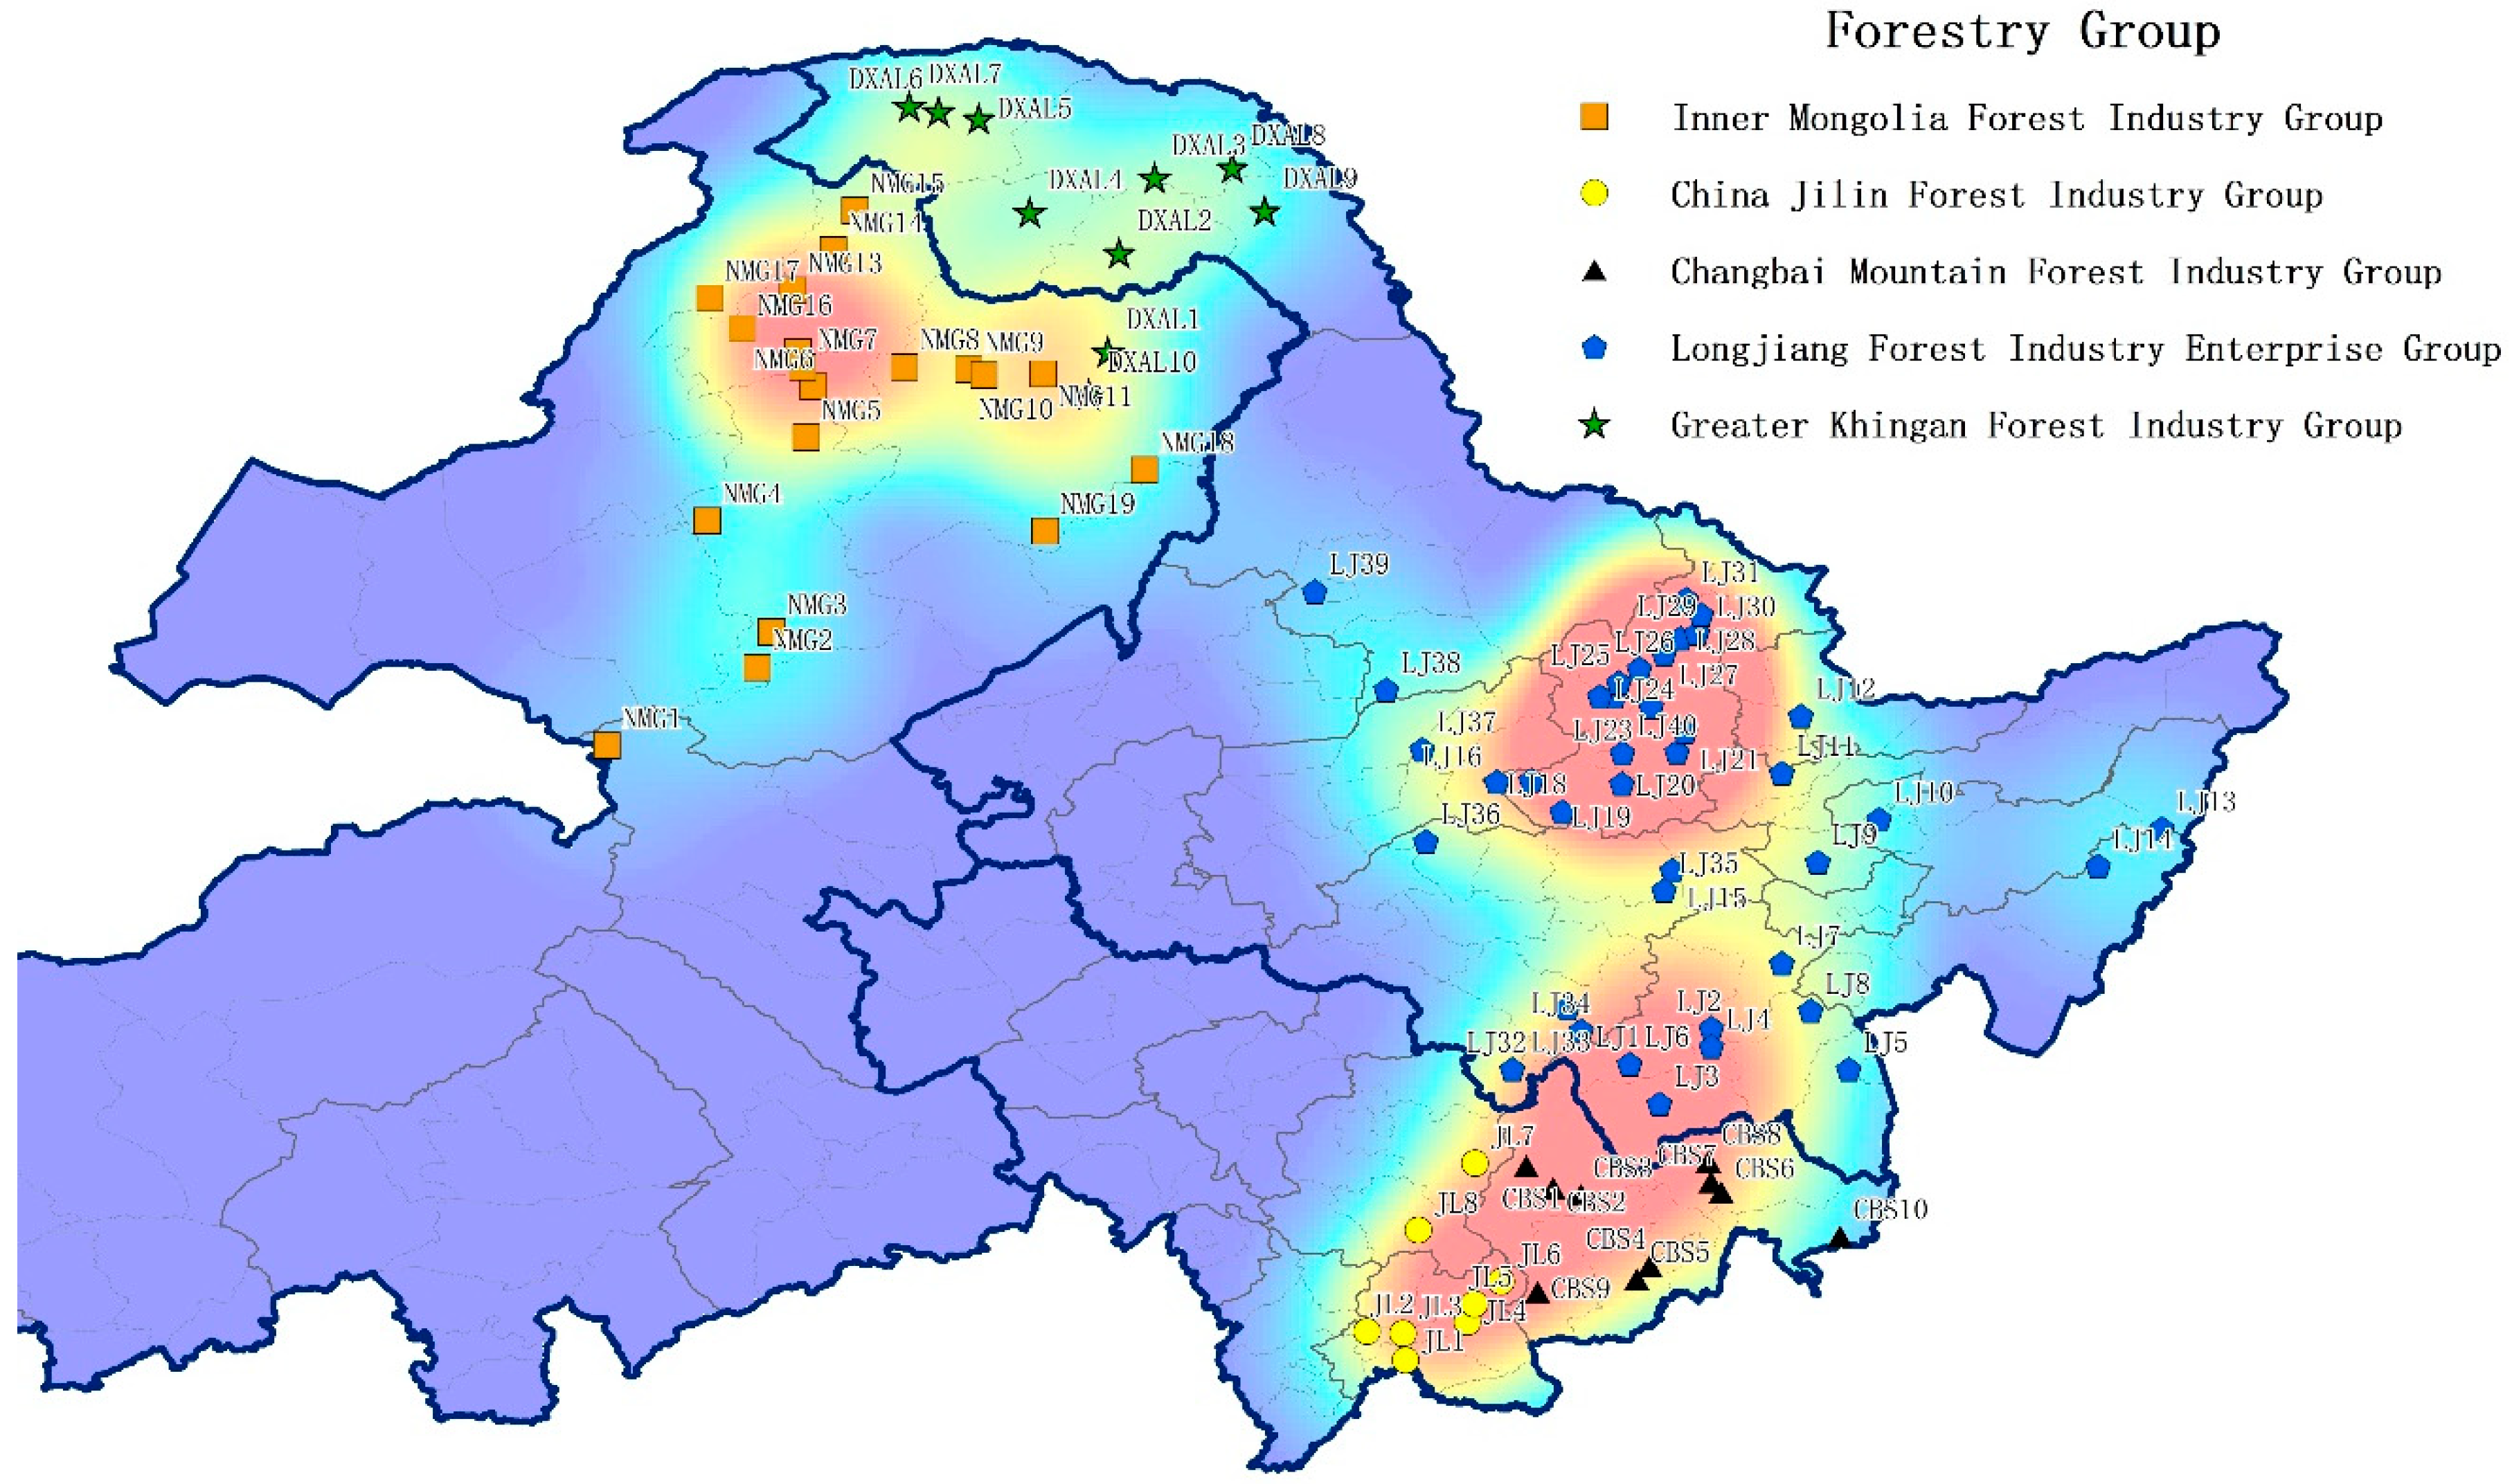
2. State-Owned Forestry Enterprises in Northeast China

The state-owned forestry enterprises (SOFEs) in China differ from the sawmills or timber enterprises found across Europe and in the USA in that they are not only engaged in forestry production activities, but also in conducting non-forestry-related production activities. It has been several decades since the governmental and enterprise functions were separated [9]. Now, there are 135 SOFEs in China. The total area of these enterprises is comparable to a county in China. The national regions in which the enterprises are located are originally divided into northeast, northwest, and southwest state-owned forestry regions.
Among them, the northeast state-owned forestry region has the largest area of forest resources, and there are 87 SOFEs therein. On average, each SOFE has 343.97 thousand hectares of forest in Northern China. SOFEs are divided into five forestry groups: Inner Mongolia Forest Industry Group (IM) has 17 SOFEs; China Jilin Forest Industry Group (JL) has 8 SOFEs; Changbai Mountain Forest Industry Group (CBM) has 10 SOFEs; Longjiang Forest Industry Enterprise Group (LJ) has 40 SOFEs; and Greater Khingan Forest Industry Group (GK) has 10 SOFEs (see Figure 1 and Figure 2.)

3. Literature Review

Past research regarding the evaluation of forestry production efficiency studied forestry-related industries and forestry enterprises and divided the analysis of production efficiency into economic efficiency and eco-efficiency.
The forestry efficiency research methods chosen by scholars included Data Envelopment Analysis (DEA), Stochastic Frontier Analysis (SFA), and the Efficiency or Productivity Index. Managi [10] adopted the ‘Luenberger productivity indicators’ based on DEA (Luenberger-DEA) to calculate the total factor productivity (TFP) index of Japan’s forestry industry from 1975 to 2000. The results of their research indicated that the average annual growth rate of TFP was 6.4%. Chen et al. [11] employed the ‘Malmquist Productivity Index-based DEA’ (Malmquist-DEA) to measure the TFP of the Chinese forestry industry from 1995 to 2011 and found that the average annual growth rate of TFP was 4.8%. Chen et al. [8] used SFA to calculate the technical efficiency of China’s forestry industry. The results of their analysis indicated that the average technical efficiency of forestry in China changed from 0.3 in 1998 to 0.7 in 2014. Jiang et al. [12] employed the Malmquist-DEA to measure the TFP of the Chinese forestry industry from 2004 to 2014 and found that there was a certain degree of fluctuation in China’s forestry TFP, but that such TFP held up to growth on the whole. In support of this relationship between TFP and growth, Helvoigt et al. [13] employed SFA to measure TFP growth in the sawmilling industry of the USA’s Pacific Northwest from 1968 to 2002, their results showing that due to accelerating technical progress, TFP growth was strong over the sample period. Xiong et al. [14] used SFA to calculate the technical efficiency of forestry activities in Northwest China. Their results showed that from 2005 to 2015, the technical efficiency of forestry in the six Northern provinces declined. Finally, using an Efficiency Index or Productivity Index not based on the DEA or SFA, Ahn et al. [15] employed the chain-type Fisher index to measure the TFP growth of the USA’s sawmill and planing mill industry from 1947 to 2000. Their research showed that the TFP growth had increased by 43% over the past 50 years. Zhang et al. [16] used the Tornqvist-Theil index to analyze TFP growth in the sawmill and wood preservation industries of Canada and the USA. The results of their research indicated that the TFP of the two countries grew at an average annual compound rate of 1.11% and 0.61% respectively, between 1958 and 2003. Ghebremichael et al. [17] employed a translog multilateral index number model to measure the TFP of the Canadian sawmilling industry from 1961 to 2000. They found that without tax incentives, the average annual growth rate of the TFP was 2%. This research paid attention to desirable outputs, but overlooked undesirable outputs, such as environmental pollution.
Regarding eco-efficiency research in the forestry industry, the methods chosen by scholars primarily include the eco-efficiency ratio, DEA, and distance function. Thant et al. [18] used the eco-efficiency ratio to assess the eco-efficiency of the pulp and paper industry in Myanmar. The assessment results indicated that eco-efficiency decreased between 2002 and 2004, but increased in 2005. Hseu et al. [19] employed the Malmquist-DEA approach to calculate the TFP of the pulp and paper industry in OECD countries over the period 1991–2000, finding that the TFP growth of the countries therein ranged from 0.9% in Switzerland to 2.4% in Japan. Yu et al. [20] used the SBM-DEA model and Malmquist-Luenberger index to assess the eco-efficiency of China’s pulp and paper industry at the national and provincial levels. Their results showed that the industry’s productivity was dominated by high growth efficiency between 2010 and 2013. Chen et al. [2] used the DEA model and the Malmquist index to measure forestry ecological efficiency and productivity in China from 2004 to 2013; they found the Chinese forestry eco-efficiency average to be 0.912, compared with the average TFP index of 1.307. Zheng et al. [3] chose the DEA model to calculate the eco-efficiency of 15 Chinese provincial forestry industries from 2004 to 2013. The results showed that secondary industry eco-efficiency was not high but on the rise. Finally, Hailu [21] used an input distance function to measure the technical efficiency and TFP of the regional Canadian pulp and paper industries. They found that from 1970 to 1993, the annual average technical efficiency was 0.86 and the average annual TFP growth rate was −0.26%.
For purposes of researching the production efficiency of forestry enterprises, the DEA was frequently chosen by scholars. Liu et al. [22] used the DEA approach to measure the TFP of 50 SOFEs in Northeast China during the period between 1992 and 2001. Their results indicated that, because of a reduction in technical innovation and change, TFP was reduced by 5%. Yang et al. [23] employed the Malmquist-DEA model to measure the TFP of 135 SOFEs in China from 2001 to 2011. During this sample period, the average technical improvement rate increased by 19.9% and thus increased the TFP by 19.8%. In the above literature, the input indicators were, for the most part, capital investment, fixed investment funds, and the number of on-the-job workers, whereas output indicators were the main product’s sales revenue and output.
When researching the eco-efficiency of forestry enterprises, scholars used the eco-efficiency ratio, DEA, and Efficiency or Productivity Index. Helminen et al. [24] used the economic/environmental ratio method to measure the eco-efficiency of pulp, paper, and board mills in Finland and Sweden from 1993 to 1996, finding that the Swedish mills were more eco-efficient than the Finnish ones. In 2001, Hua et al. [25] used a DEA approach to evaluate the eco-efficiency of 32 paper mills along the Huai River in China, finding that there was a considerable difference in eco-efficiency when undesirable outputs were considered, compared to when they were not. Koskela et al. [26] produced a comprehensive definition of eco-efficiency and proposed a conceptual framework concerning the relationship between the environmental and economic performance areas of enterprises. They argued that eco-efficiency could be regarded as either environmental performance or as one business strategy for sustainable development. Zhang et al. [27] used DEA to assess eco-efficiency in four forestry administrations in Heilongjiang province in 2011. The results showed that the eco-efficiency of Mudanjiang and Yichun was equal to 1, whereas for Hejiang and Songhuajiang it was less than 1. Finally, regarding the Efficiency Index or Productivity Index, Koskela [28] employed the Delphi method to identify the indicators of eco-efficiency among forest companies in Finland. The scholar argued that the economic performance of eco-efficiency should be measured using the ‘value added’ indicator; in environmental performance, however, they preferred using environmental impact or emissions groups.
To date, although there has been significant research into forestry production efficiency and the production efficiency of SOFEs, very few studies have focused on the eco-efficiency of SOFEs. This latter focus is of increasing importance, given that it is to form the basis for designing policies aimed at increasing such efficiency in SOFEs and promoting sustainable development in the forestry industry as a whole. This paper uses the SBM-DEA model to assess the eco-efficiency of 87 SOFEs from 2003 to 2016 by considering both desirable and undesirable outputs.

4. Methodology and Data

4.1. The SBM-DEA Model

In order to measure the technical efficiency of the decision-making unit (DMU) using multiple inputs and outputs, traditional DEA models such as the Charnes-Cooper-Rhodes (CCR) and Banker-Charnes-Cooper (BCC) were created in the 1970s and 80s [29,30]. However, the CCR and BCC models had a hard time dealing with slack variables and undesirable outputs. In 2001, a slacks-based measure (SBM) of DEA was proposed by Tone. After it (the SBM-DEA model) was developed, Tone revised and refined it [31,32]. Presently, the SBM-DEA model, which can consider undesirable outputs, is able to deal with the above two problems. It includes input-, output-, and non-oriented model forms. With a fixed quantity of resources, SOFEs can devote themselves to producing as much output as possible; therefore, an output-oriented model form is the most appropriate for measuring it. The next step was then to construct an output-oriented SBM-DEA model that could consider undesirable outputs.
This paper views SOFEs as DMUs. Each DMU uses M different inputs to produce N desirable and J undesirable outputs. The following model illustrates this:
1 ρ = max 1 + 1 N + J ( n = 1 N   s n g y n g + j = 1 J   s j b y j b ) s . t . k = 1 K λ k x k , m + s m i = x k , m ,   m = 1 , 2 , M k = 1 K λ k y k , n g s n g = y k , n g ,   n = 1 , 2 , N k = 1 K λ k y k , j b + s j b = y k , j b ,   j = 1 , 2 , J λ k , s m i , s n g , s j b 0 ;   k = 1 , 2 , K
The eco-efficiency of SOFEs is represented by ρ, ρ ∈ [0,1], and ρ = 1 indicates that the SOFE is completely efficient. The indices for inputs, desirable output, and undesirable output are m, n, and j, s m i , s n g , and s j b are the slacks of inputs and desirable and undesirable outputs. This paper defines x k , m as inputs and defines y k , n g and y k , j b as the desirable and undesirable outputs respectively. λ k represents the vector for projecting the SOFEs.

4.2. Data Sources and Indicator Selection

In order to measure the eco-efficiency of SOFEs, it is important to choose both input and output indicators. In the production process, some factors help produce both the end-product and various levels of waste and emissions. We have constructed our input and output indicators according to the eco-efficiency evaluation criteria of the WBCSD [33].
The research area is Northeast China and the DMUs are 87 SOFEs from five forestry groups. Because each SOFE is regarded as a DMU, land, labor, and capital are basic inputs. Data for land, labor, and the annual investment of SOFEs can be readily collected from the China Forestry Statistical Yearbook. The output indicators can be divided into desirable and undesirable outputs. According to Yang et al.’s research [23], desirable outputs include total output and the sale value, both of which can also be accessed from the China Forestry Statistical Yearbook. According to Zheng et al.’s research [3], undesirable outputs include effluent, exhaust, and solid-waste, all of which can be estimated using data from the China Statistical Yearbook on Environment and the China Forestry Statistical Yearbook.
The influence of price changes on the value indicators of the input and output indicator system was eliminated using the following steps. First, both fixed base-price indices (i.e., the fixed investment and production price indices) were calculated using the year 2003 as the base period. Second, capital investment was divided by the fixed investment fixed base-price index, and both the output value and sale were divided by the producer price fixed base-price index. Table 2 shows the descriptive statistics of the input and output indicators.

5. Results

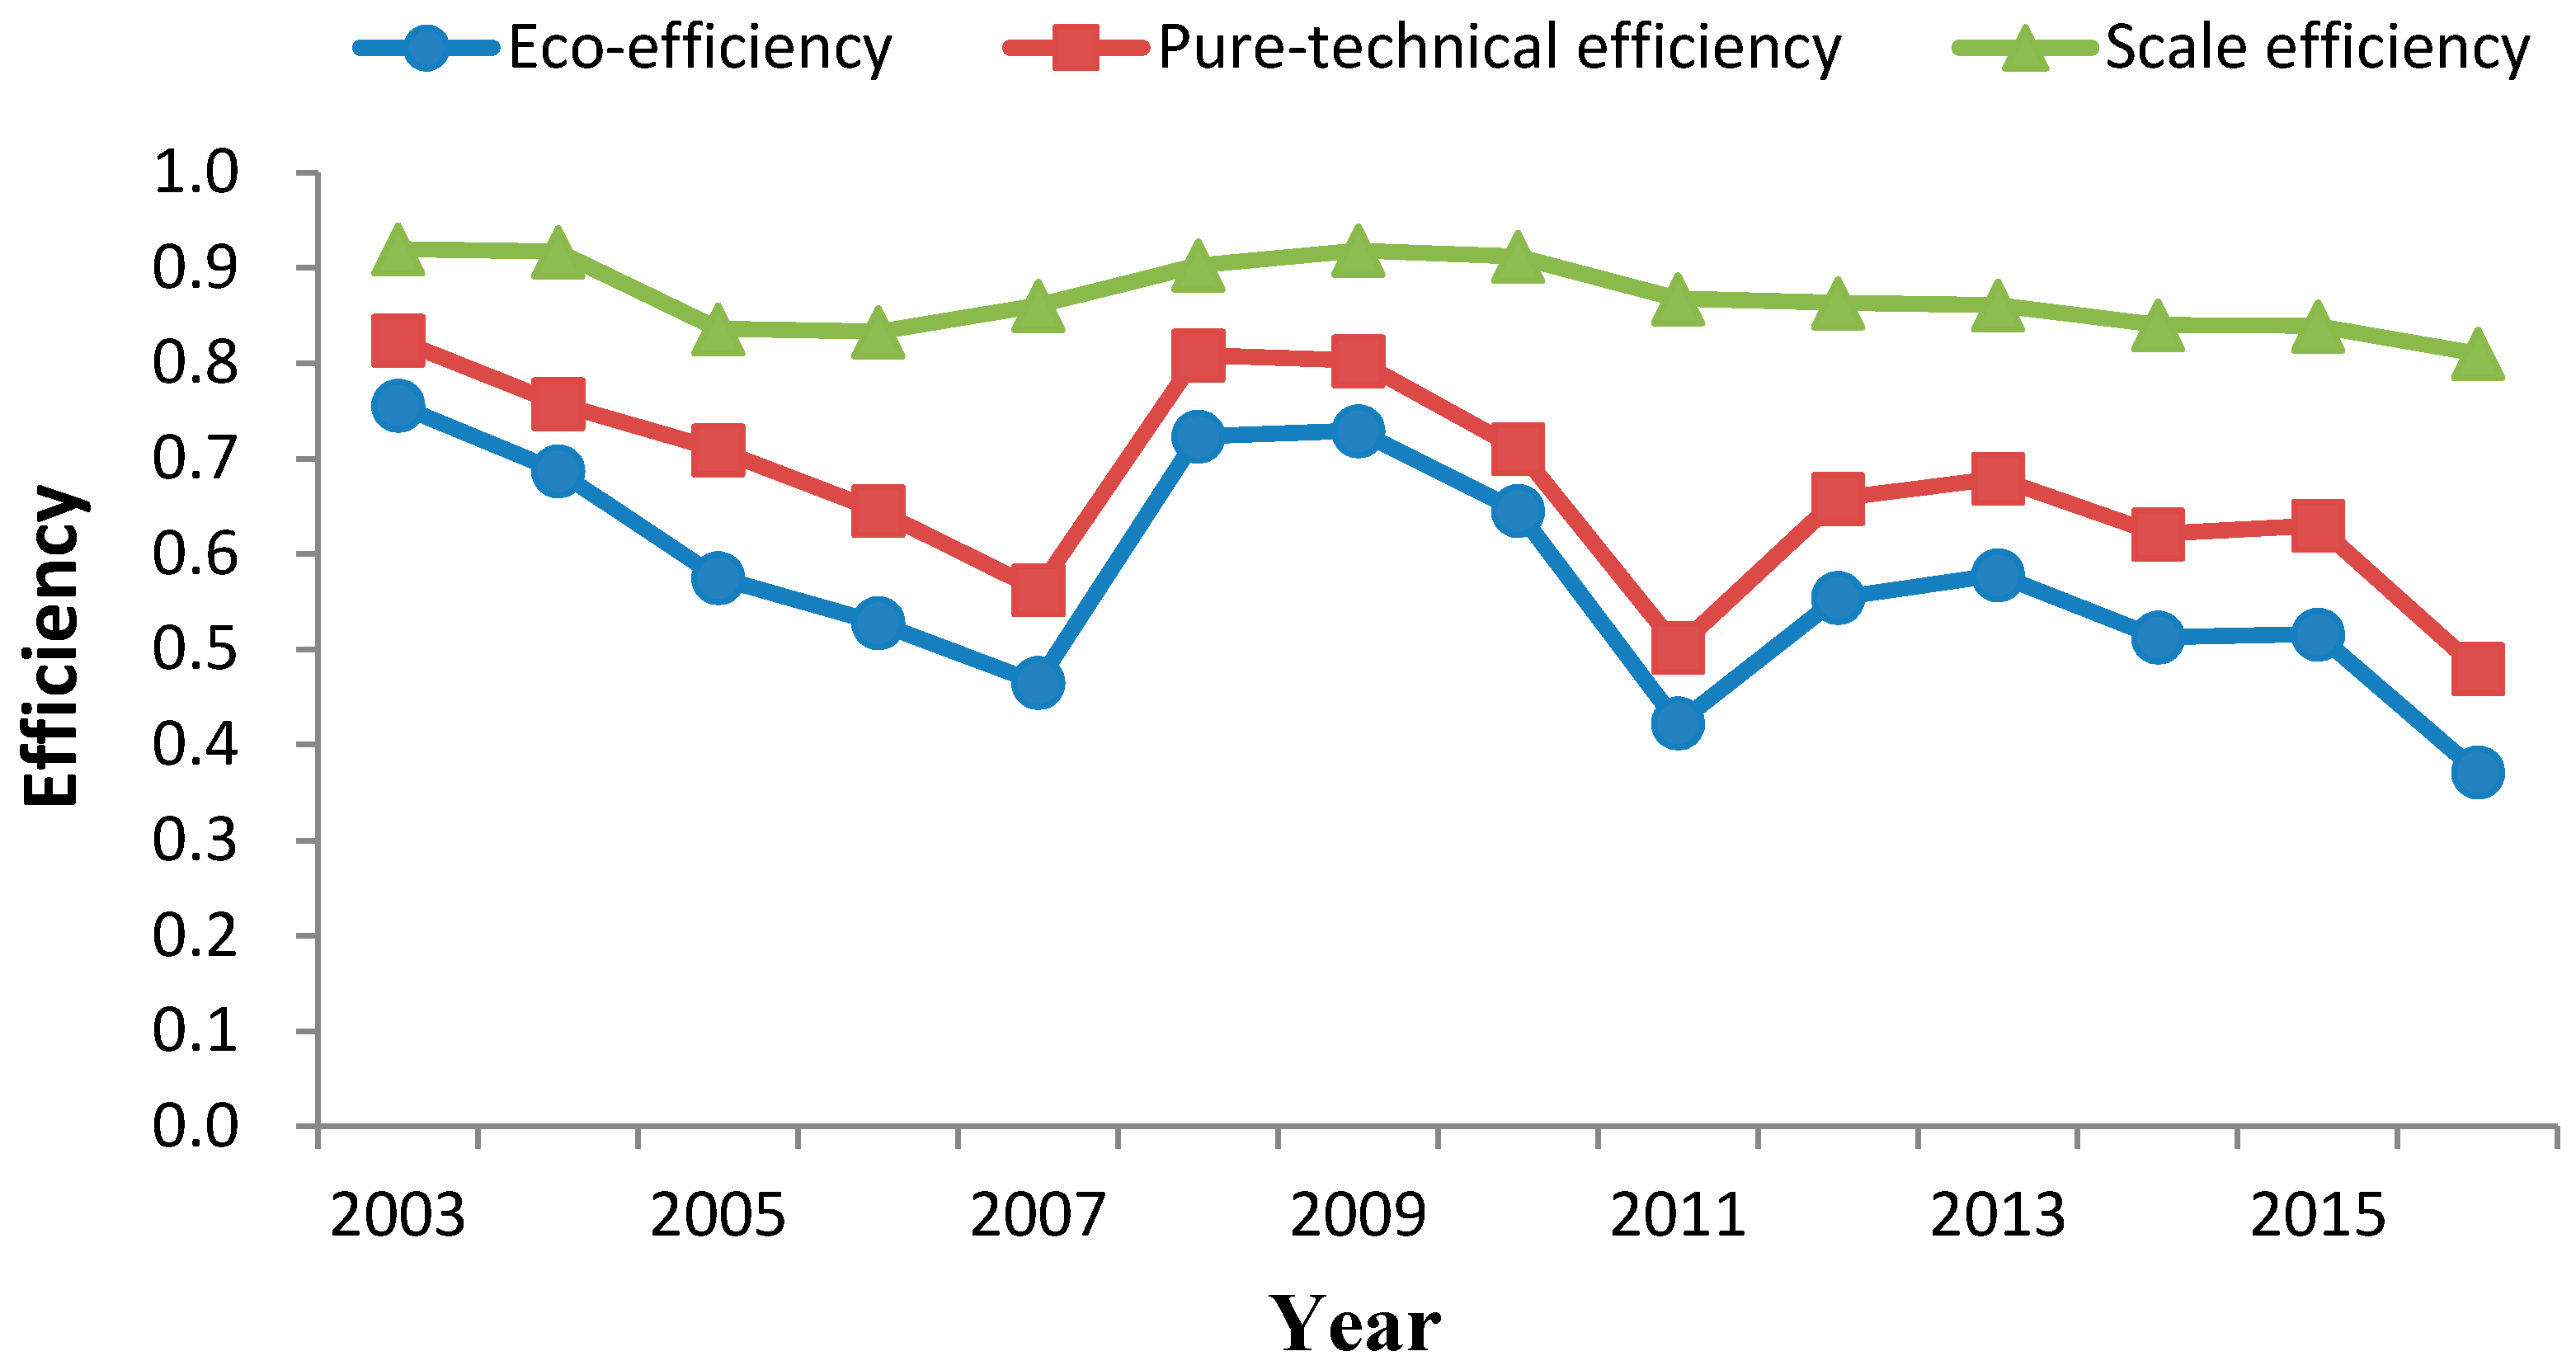
5.1. Analysis of the Eco-Efficiency of SOFEs from the Time Dimension

As shown in Figure 3, the eco-efficiency, pure-technical efficiency, and scale efficiency of SOFEs in Northeast China had volatile, increasing and decreasing trend intervals from 2003 to 2016. However, in total, the eco-efficiency, pure-technical efficiency, and scale efficiency showed a downward trend. The eco-efficiency decrease was due primarily to pure-technical efficiency. These trends can be divided into five stages. The first stage is from 2003 to 2007. This stage’s eco-efficiency, pure-technical efficiency, and scale efficiency showed a downward trend. The second stage is from 2008 to 2009, where eco-efficiency and scale efficiency showed an upward trend, but pure-technical efficiency showed a downward trend. The third stage is from 2010 to 2011. During this stage, eco-efficiency, pure-technical efficiency, and scale efficiency showed a downward trend. The fourth stage is from 2012 to 2013, where eco-efficiency and pure-technical efficiency showed an upward trend, but scale efficiency showed a downward trend. The fifth stage is from 2014 to 2016. This stage’s eco-efficiency, pure-technical efficiency, and scale efficiency showed a downward trend. Since 1998, China’s Natural Forest Protection Project (NFPP) undertook limited timber harvesting, strengthened forest tending, and protected natural forests. Since 2014, the Chinese government has been implementing a policy to stop the commercial logging of natural forests; this policy has had a significant impact on those SOFEs with a high proportion of secondary industry output value, and which were causing a substantial decline in both eco- and pure-technical efficiency. The average value of eco-efficiency, pure-technical efficiency, and scale efficiency was 0.576, 0.671, and 0.870, respectively. The distance to the efficient frontier within 42.4%, 32.9%, and 13% of the gap shows that the efficiency of SOFEs in Northeast China can improve dramatically. The eco-efficiency and pure-technical efficiency of SOFEs saw a downward trend because of the central government’s increasing focus on forest protection and their efforts to reduce the amount of timber felled in natural forests.
Figure 4 shows the classification of SOFEs’ returns to scale. The returns to scale were divided into ‘Increasing’, ‘Constant’, and ‘Decreasing’. In 2003, the numbers were mostly ‘Decreasing’, with some ‘Increasing’, and the least ‘Constant’. However, in 2016, the largest number of SOFEs was ‘Increasing’, the second-largest ‘Decreasing’, and the least amount ‘Constant’. This indicates that many SOFEs transitioned from ‘Decreasing’ to ‘Increasing’ in returns to scale from 2003–2016.

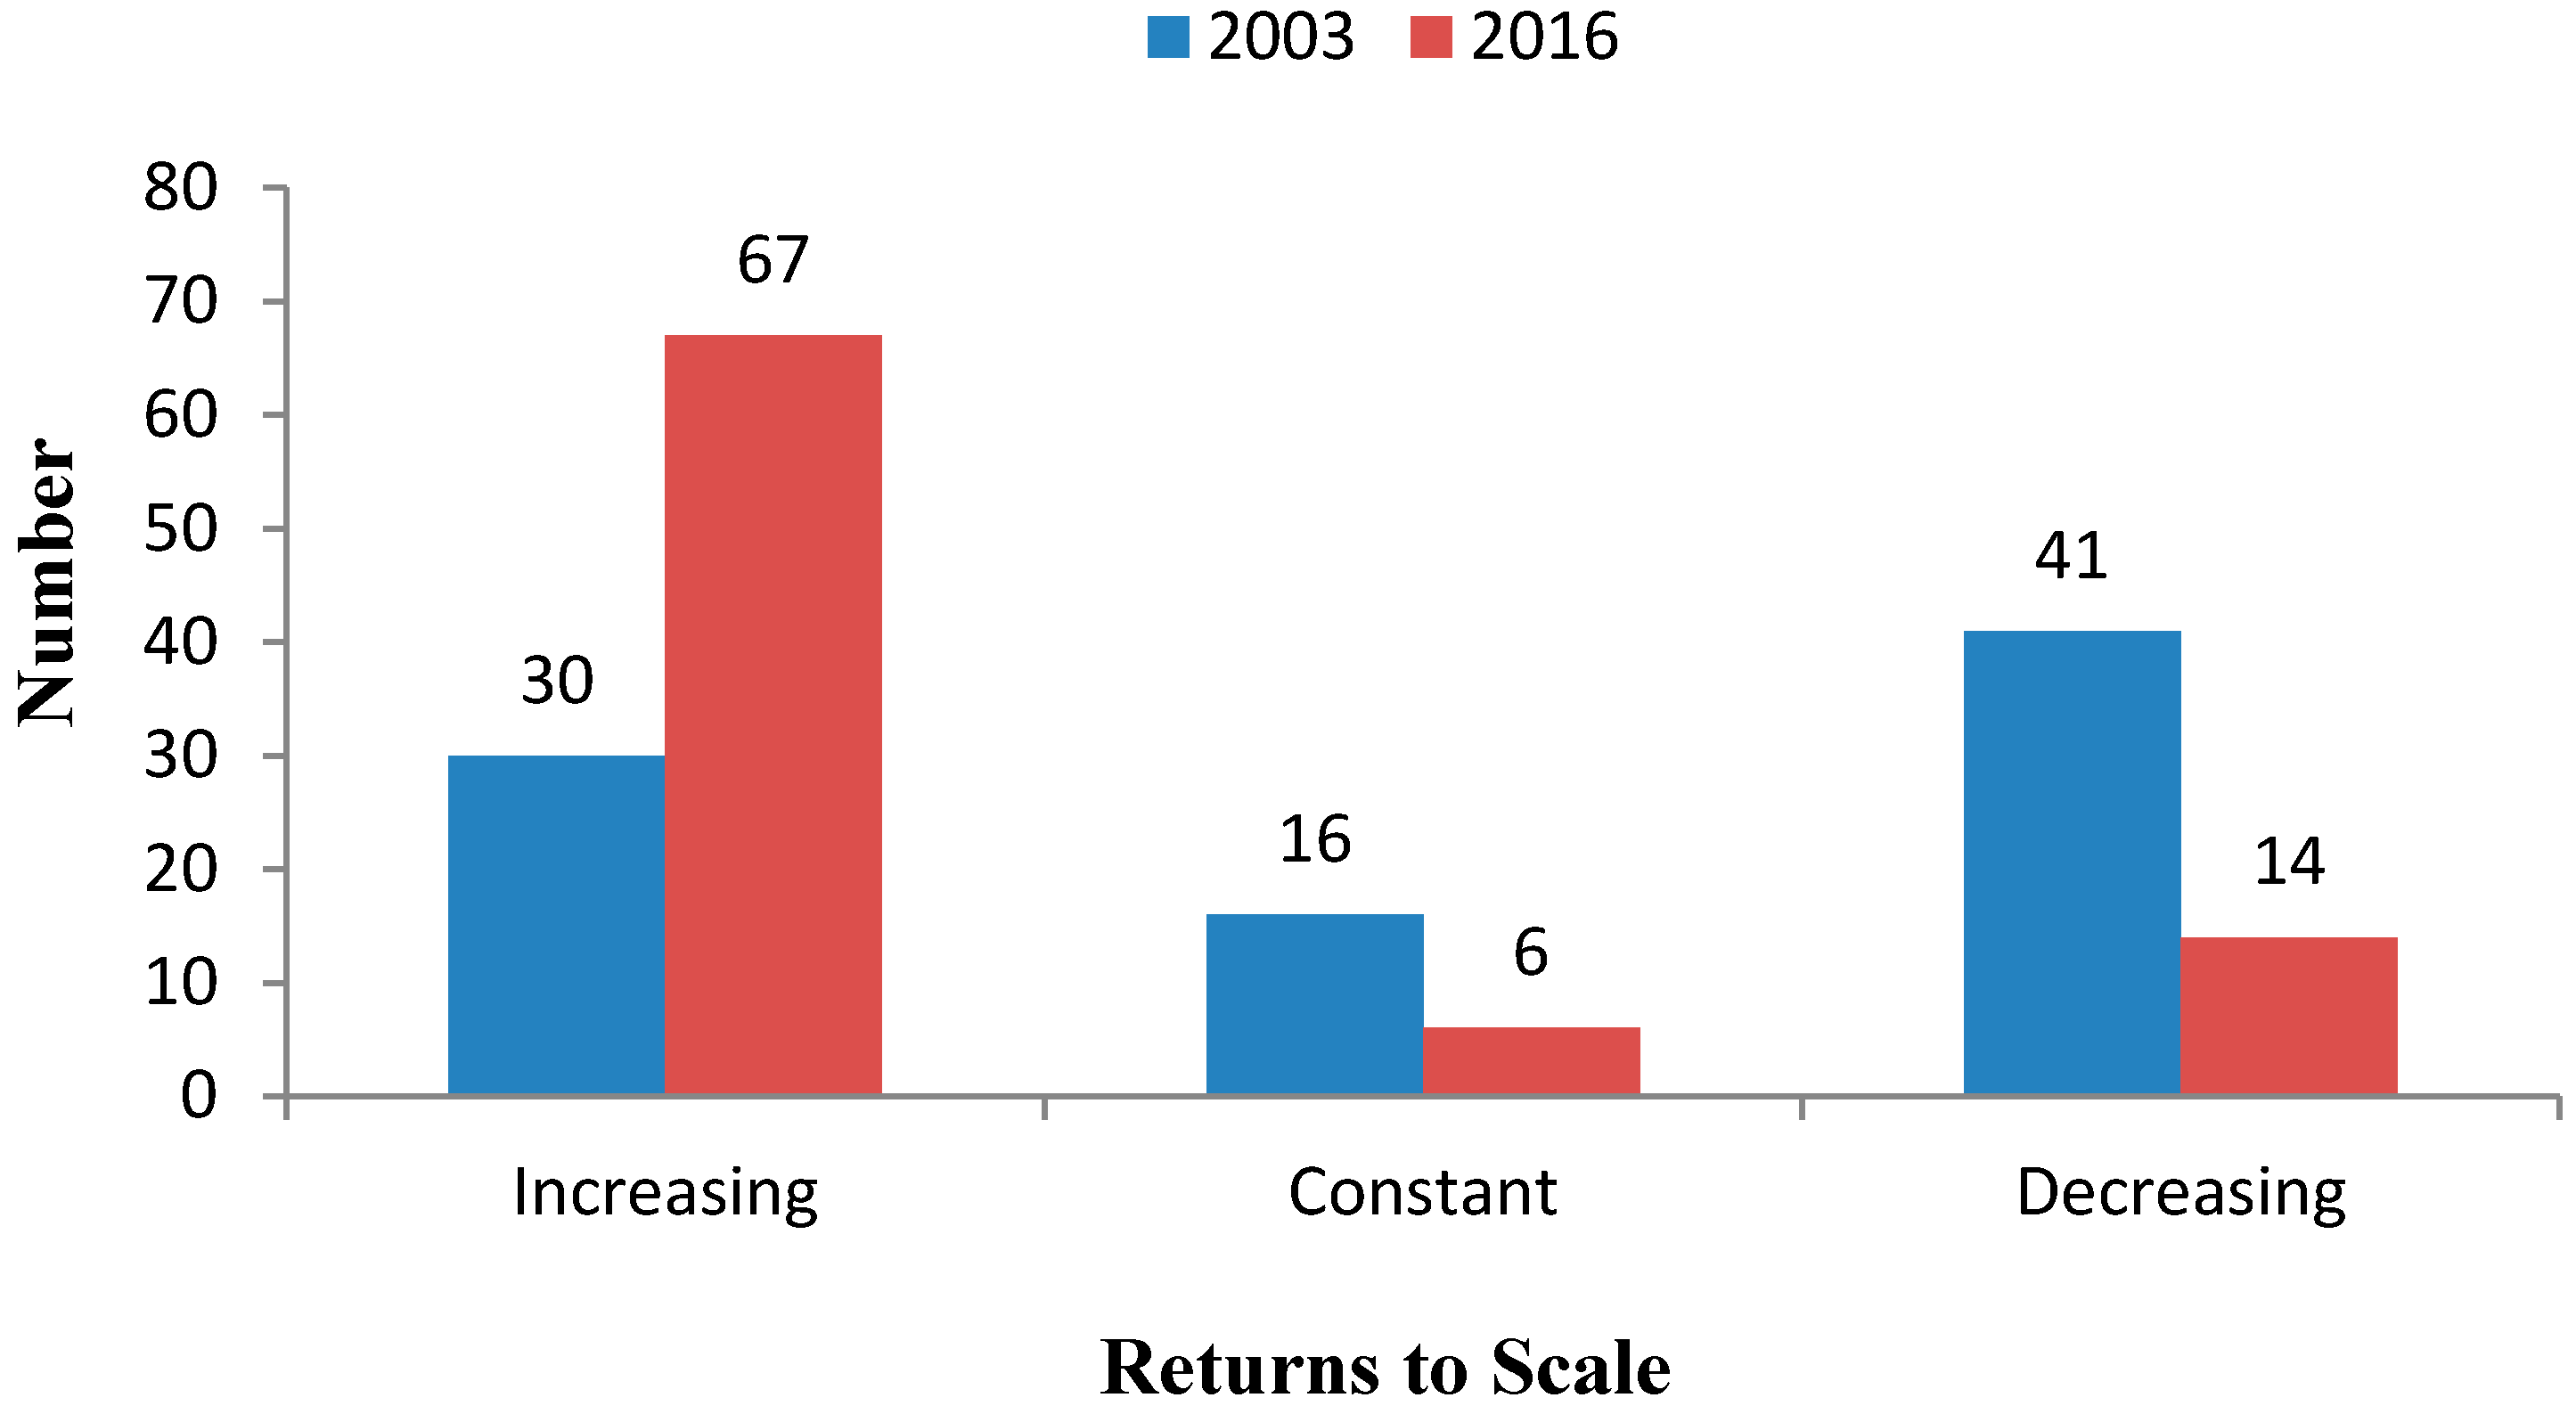
5.2. Analysis of the Eco-Efficiency of SOFEs from the Spatial Dimension

Table 3 shows the estimates of the eco-efficiency, pure-technical efficiency, and scale efficiency of five forestry groups in Northeast China.
The evaluation results in Table 3 show that the average eco-efficiency of all SOFEs in Northeast China was 0.576 during 2003–2016. The average eco-efficiency in JL, at 0.699, was the highest; LJ, GK, and CBM ranked second, third, and fourth, at 0.604, 0.581, and 0.570 respectively; IM ranked last, at 0.476. JL was the only listed company among the five forestry groups to employ a modern corporate governance structure, which has likely contributed to its having the highest eco-efficiency. From 2003 to 2016, the eco-efficiency of all SOFEs declined. The pure-technical efficiency was lower than scale efficiency, and the rate of decline of the former was faster than that of the latter. This indicates that pure-technical efficiency is a determinant of low and/or declining eco-efficiency. From 2003 to 2016, the eco-efficiency of each SOFE group declined, with a remarkable decline in all five forestry groups from 2015 to 2016, after the approval of a policy intended to stop commercial logging in natural forests.
A CV (Coefficient of Variation) in which the standard deviation is divided by the mean is the measurement for determining the relative variation of a distribution independent of the units. From 2003 to 2016, the CV of the eco-efficiency of all SOFEs ranged from 0.231 to 0.781; pure-technical efficiency ranged from 0.213 to 0.716; and scale efficiency ranged from 0.112 to 0.291. This means that all the regional differences in eco-efficiency, pure-technical efficiency, and scale efficiency grew. The regional increase in pure-technical efficiency was the primary cause of the regional increase in eco-efficiency.
Table 4 shows the classification of SOFEs’ eco-efficiency (EE) grade, including the DEA Efficient, High Level, Medium Level, and Low Level. In order to analyze the spatial variation, we categorized the SOFEs into five varieties according to their eco-efficiency grade. During 2003–2016, the highest number of SOFEs were at the ‘Medium Level’, the second most were at the ‘Low Level’, the third most were at ‘High Level’, and the rest were ‘DEA Efficient’. In 2003, most were ‘Medium Level’, then ‘High Level’, then ‘DEA Efficient’, and finally ‘Low Level’. However, in 2016, most SOFEs were in the ‘Low Level’, followed by the ‘Medium Level’, ‘DEA Efficient’, and ‘High Level’. This means that the grade of many SOFEs fell from 2003 to 2016.

6. Conclusions and Policy Implications

This paper analyzed the eco-efficiency of SOFEs using the SBM-DEA model and took various undesirable outputs into account. Using the data of 87 SOFEs from five forestry groups, an empirical study was done to measure the eco-efficiency of such enterprises in Northeast China from 2003–2016. Above all, the results show that the average eco-efficiency, pure-technical efficiency, and scale efficiency of SOFEs were 0.576, 0.671, and 0.870 respectively, from 2003 to 2016. This means that SOFEs’ low eco-efficiency was caused by low pure-technical efficiency. Moreover, the regional differences in eco-efficiency were significant and became larger. Among the five forestry groups considered, JL had the highest eco-efficiency and was the only listed company among them to have employed a modern corporate governance structure, which again may be the reason for it having the highest-rated eco-efficiency. Another important result is that the eco-efficiency of SOFEs declined from 2003 to 2016 due to the implementation of the NFPP, after which the output of timber from SOFEs decreased significantly. The growth of desirable outputs in and from SOFEs has made an impressive impact. Since 2015 in particular, the ban on commercial logging ban in natural forests has been in full effect, a policy that has had a dramatic effect on SOFEs. Finally, due to a relative lack of production factor inputs, most SOFEs are now in the stage of increasing scale returns. Liu et al. [22] argued that because the land area of SOFEs is not large enough, they are in a stage of increasing scale returns.
The specific policy proposals for the improvement of SOFEs in Northeast China and for achieving SDG 8 can be summarized as follows.
First, adhere to market-oriented reforms that encourage employing modern enterprise systems and separating forest administration from business operations wherever appropriate. The reforms also involve preserving the existing form of SOFEs and transferring all public and social service obligations to local governments. A market-oriented reform could stimulate the vitality of SOFEs and improve efficiency. In addition, the economic transition of SOFEs should be accelerated. In order to improve eco-efficiency, it is necessary to substantially reduce the dependence of SOFEs on secondary industries and accelerate the development of tertiary industries such as forestry tourism and forestry ecological service. Lastly, the industry scale of SOFEs should be expanded. As most SOFEs are currently in the stage of increasing scale returns, they should be encouraged, if not incentivized, to take the path of large-scale development. If these policy proposals are adopted, the eco-efficiency of SOFEs will be improved and their sustainable development promoted, which is beneficial for achieving SDG 8.
This paper took into account the negative impact of SOFEs on the environment, such as effluent, exhaust and solid-waste, but ignored any positive impacts on the environment. In the future, we will pay attention to such positive impacts through new output indicators.

Author Contributions

This paper was written in close collaboration between the contributing authors. Y.N. and Z.L. conceived and designed this study and went through all the sections. Z.N. wrote the introduction and results. H.Z. gave review suggestions on the entire writing process and manuscript. All authors read and approved the final manuscript.

Funding

The research of this paper is sponsored by the Central Public Research Institutes Fundamental Research Funds for the Project of Chinese Academy of Forestry (Grant No. CAFYBB2014QA017), the Project of Natural Science in Jiangsu University (Grant No. 16KJB210009), General Social Science Project of Jiangsu University (Grant No. 2016SJB790008) and the National Natural Science Foundation of China (Grant No. 71603126).

Conflicts of Interest

The authors declare no conflict of interest.

Abbreviations

The following abbreviations are used in this manuscript:
SBM-DEAData envelopment analysis
SDGSustainable Development Goal
SOFEState-owned forestry enterprise
SOFEsState-owned forestry enterprises
IMInner Mongolia Forest Industry Group
JLChina Jilin Forest Industry Group
CBMChangbai Mountain Forest Industry Group
LJLongjiang Forest Enterprise Industry Group
GKGreater Khingan Forest Industry Group
NFPPNatural Forest Protection Project

Appendix A

There exists literature that addresses forestry production efficiency. This literature is summarized in Table A1 and Table A2.
Table A1. Summary of previous literature on calculating the production efficiency of forestry-related industries.
ReferenceTargetMethodIndicatorResult
[10]Japan’s forestry industryLuenberger-DEAInputs: forestry machinery, labor, forest roads, forest area and rate of man-made forests
Outputs: volume
The average annual growth rate of TFP was 6.4% from 1975 to 2000.
[11]Chinese forestry industryMalmquist-DEAInputs: capital, labor, forestland
Outputs: total output value of forestry industry
The average annual growth rate of TFP was 4.8% from 1995 to 2011.
[8]Chinese forestry industrySFAInputs: labor, capital
Outputs: the gross output of the forestry industry and afforestation area
The average technical efficiency changed from 0.3 in 1998 to 0.7 in 2014.
[12]Chinese forestry industryMalmquist-DEAInputs: land, investment, labor
Outputs: forest stock volume and gross output value
TFP held up to growth on the whole.
[13]The sawmilling industry of the USA’s Pacific NorthwestSFAInputs: saw logs, 8-hour capacity, and labor et al.
Outputs: lumber output
TFP growth was strong from 1968 to 2002.
[14]Chinese forestry industrySFAInputs: fixed-asset investment, employee number, and forest area
Outputs: forestry output
Technical efficiency in the six Northern provinces declined.
[15]The USA’s sawmill and planing mill industryThe chain-type Fisher indexInputs: labor, energy, wood, and capital
Outputs: lumber
TFP growth increased by 43% from 1947 to 2000.
[16]The sawmill and wood preservation industries of Canada and the USAThe Tornqvist-Theil indexInputs: worker, capital, and energy et al.
Outputs: softwood lumber, hardwood lumber, and wood chips et al.
The TFP of the two countries grew at an average annual compound rate of 1.11% and 0.61% respectively, between 1958 and 2003.
[17]The Canadian sawmilling industryA translog multilateral index number modelInputs: capital stock, labour, energy, and raw material et al.
Outputs: lumber, shakes and shingles, byproducts
The average annual growth rate of the TFP was 2% from 1961 to 2000.
[18]The pulp and paper industry in MyanmarEco-efficiency ratioInputs: material consumption, energy consumption, and total waste output et al.
Outputs: net sales
Eco-efficiency decreased between 2002 and 2004, but increased in 2005.
[19]The pulp and paper industry in OECD countriesMalmquist-DEAInputs: wood pulp capacity, paper and paperboard capacity, number of employees
Outputs: wood pulp, paper and paperboard
The TFP growth of the countries therein ranged from 0.9% in Switzerland to 2.4% in Japan.
[20]China’s pulp and paper industrySBM-DEAInputs: water consumption
Outputs: wastewater emissions, COD, ammonia nitrogen, and total industrial output value
The industry’s productivity was dominated by high growth efficiency between 2010 and 2013.
[2]Chinese forestry industryDEA and MalmquistInputs: land, labor, investment and energy
Outputs: wastewater discharge, chemical oxygen demand of wastewater, and SO2 emission et al.
Eco-efficiency averaged 0.912, compared with the average ecological TFP index of 1.307 from 2004 to 2013.
[3]15 Chinese provincial forestry industriesDEAInputs: energy, timber, industrial wastewater discharge et al.
Outputs: production value
The secondary forestry industry’s eco-efficiency was not high, but rising from 2004–2013.
[21]The regional Canadian pulp and paper industriesAn input distance functionInputs: energy, virgin fiber, and non-wood materials et al.
Outputs: pulp and paper output, two water pollutant outputs (BOD and TSS)
During 1970–1993, annual average technical efficiency was 0.86 and the average annual TFP growth rate was −0.26%.
Table A2. Summary of previous literature on calculating production efficiency of forestry enterprises.
ReferenceTargetMethodIndicatorResult
[22]50 SOFEs in Northeast ChinaDEAInputs: labour, fixed capital and floating capital
Outputs: output value
TFP was reduced by 5% between 1992 and 2001.
[23]135 SOFEs in ChinaMalmquist-DEAInputs: fixed investment fund, number of on-the-job workers, and total costs
Outputs: Sales, total output
From 2001–2011, the TFP increased by 19.8%.
[24]Pulp, paper, and board mills in Finland and SwedenEconomic/environmental ratioEnvironmental impact: liquid effluents, atmospheric emissions, and solid-waste
Outputs: value added
The Swedish mills were more eco-efficient than the Finnish ones from 1993 to 1996.
[25]32 paper mills along the Huai River in ChinaDEAInputs: labor, capital
Outputs: paper products, biochemical oxygen demand
There was a considerable difference in eco-efficiency when undesirable outputs were considered, compared to when they were not.
[27]Four forestry administrations in Heilongjiang province in ChinaDEAInputs: energy consumption, the number of registered workers, and industrial wastewater et al.
Outputs: output value
The eco-efficiency of Mudanjiang and Yichun was equal to 1, whereas for Hejiang and Songhuajiang it was less than 1.
[28]Forest companies in FinlandThe Delphi methodInputs: water consumption, energy consumption and, raw material consumption
Outputs: sales, air emissions, and water emissions et al.
The economic performance of eco-efficiency should be measured using the ‘value added’ indicator; in environmental performance, however, they preferred using environmental impact or emissions groups.

References

  1. United Nations. Transforming Our World: The 2030 Agenda for Sustainable Development. 2015. Available online: https://sustainabledevelopment.un.org/content/documents/21252030%20Agenda%20for%20Sustainable%20Development%20web.pdf (accessed on 23 June 2018).
  2. Chen, K.; Li, X.T.; Piao, H.L. Analysis on forestry eco-efficiency and ecological productivity measure in China. Issues For. Econ. 2016, 36, 115–120. (In Chinese) [Google Scholar] [CrossRef]
  3. Zheng, Y.M.; Yin, S.H. Empirical analyses on forestry industry eco-efficiency—Based on fifteen provinces. For. Econ. 2016, 28, 36–40. (In Chinese) [Google Scholar] [CrossRef]
  4. Zheng, S.Q.; Yu, J.H. Evaluation on efficiency of technology innovation in paper industry: Using DEA-Malmquist index. Issues For. Econ. 2012, 32, 329–332. (In Chinese) [Google Scholar] [CrossRef]
  5. Zhang, L. Strategic adjustment of state-owned forestry industry enterprises. For. Econ. 1998, 4, 29–35. (In Chinese) [Google Scholar] [CrossRef]
  6. Jiang, X.M.; Gong, P.C.; Bostedt, G.; Xu, J. Impacts of policy measures on the development of state-owned forests in northeast China: theoretical results and empirical evidence. Environ. Dev. Econ. 2013, 19, 74–91. [Google Scholar] [CrossRef]
  7. State Forestry Administration. China Forestry Statistical Yearbook 2016; Chinese Forestry Press: Beijing, China, 2017; pp. 70–71. ISBN 978-7-5038-9241-7.
  8. Chen, J.D.; Wu, Y.Y.; Song, M.L.; Zhu, Z. Stochastic frontier analysis of productive efficiency in China’s forestry industry. J. For. Econ. 2017, 28, 87–95. [Google Scholar] [CrossRef]
  9. Zhang, Y.Q. Costs of plans vs costs of markets: reforms in China’s state-owned forest management. Dev. Policy Rev. 2000, 18, 285–306. [Google Scholar] [CrossRef]
  10. Managi, S. Productivity measures and effects from subsidies and trade: An empirical analysis for Japan’s forestry. Appl. Econ. 2010, 42, 3871–3883. [Google Scholar] [CrossRef]
  11. Chen, X.L.; Jiang, X.M. A study on total factor productivity of Chinese forestry. For. Econ. 2014, 36, 75–82. [Google Scholar] [CrossRef]
  12. Jiang, Y.; Guan, S.Y. Space-time differences and spatial convergence of forestry total factor productivity in China. Issues For. Econ. 2017, 37, 86–91. [Google Scholar] [CrossRef]
  13. Helvoigt, T.L.; Adams, D.M. A stochastic frontier analysis of technical progress, efficiency change and productivity growth in the Pacific Northwest sawmill industry. For. Policy Econ. 2009, 11, 280–287. [Google Scholar] [CrossRef]
  14. Xiong, L.C.; Wang, F.T.; Cheng, B.D.; Yu, C. Identifying factors influencing the forestry production efficiency in Northwest China. Resour. Conserv. Recycl. 2018, 130, 12–19. [Google Scholar] [CrossRef]
  15. Ahn, S.; Abt, R.C. Productivity measurement with improved index numbers: Application to the sawmills and planning mills industry of the U.S.: 1947–2000. For. Policy Econ. 2006, 8, 323–335. [Google Scholar] [CrossRef]
  16. Zhang, D.W.; Nagubadi, R.V. Total factor productivity growth in the sawmill and wood preservation industry in the United States and Canada: A comparative study. For. Sci. 2006, 52, 511–521. [Google Scholar]
  17. Ghebremichael, A.; Karen, P.W. Effects of tax incentives on long-run capital formation and total factor productivity growth in the Canadian sawmilling industry. For. Policy Econ. 2009, 11, 85–94. [Google Scholar] [CrossRef]
  18. Thant, M.M.; Charmondusit, K. Eco-efficiency assessment of pulp and paper industry in Myanmar. Clean Technol. Environ. Policy 2010, 12, 427–439. [Google Scholar] [CrossRef]
  19. Hseu, J.S.; Shang, J.K. Productivity changes of pulp and paper industry in OECD countries, 1991–2000: A non-parametric Malmquist approach. For. Policy Econ. 2005, 7, 411–422. [Google Scholar] [CrossRef]
  20. Yu, C.; Shi, L.; Wang, Y.; Chang, Y.; Cheng, B. The eco-efficiency of pulp and paper industry in China: An assessment based on slacks-based measure and Malmquist-Luenberger index. J. Clean. Prod. 2016, 127, 511–521. [Google Scholar] [CrossRef]
  21. Hailu, A. Pollution abatement and productivity performance of regional Canadian pulp and paper industries. J. For. Econ. 2003, 9, 5–25. [Google Scholar] [CrossRef]
  22. Liu, C.; Yu, F.W. Efficiency analysis of the Northeast national forest enterprise-DEA approach. Rev. Ind. Econ. 2006, 5, 107–121. (In Chinese) [Google Scholar]
  23. Yang, H.Q.; Yuan, T.; Zhang, X.B.; Li, S. A decade trend of total factor productivity of key state-owned forestry enterprises in China. Forests 2016, 7, 97. [Google Scholar] [CrossRef]
  24. Helminen, R.R. Developing tangible measures for eco-efficiency: The case of the Finnish and Swedish pulp and paper industry. Bus. Strategy Environ. 2000, 9, 196–2010. [Google Scholar] [CrossRef]
  25. Hua, Z.S.; Bian, Y.W.; Liang, L. Eco-efficiency analysis of paper mills along the Huai River: An extended DEA approach. Omega 2007, 35, 578–587. [Google Scholar] [CrossRef]
  26. Koskela, M.; Vehmas, J. Defining eco-efficiency: A case study on the Finnish forest industry. Bus. Strategy Environ. 2012, 21, 546–566. [Google Scholar] [CrossRef]
  27. Zhang, Y.; Wan, Z.F.; Wen, W. Accounting of the Heilongjiang state-owned forest area eco-efficiency based on DEA. Issues For. Econ. 2014, 34, 281–284. [Google Scholar] [CrossRef]
  28. Koskela, M. Measuring eco-efficiency in the Finnish forest industry using public data. J Clean. Prod. 2015, 98, 316–327. [Google Scholar] [CrossRef]
  29. Charnes, A.; Cooper, W.W.; Rhode, E. Measuring the efficiency of decision making units. Eur. J. Oper. Res. 1978, 2, 429–444. [Google Scholar] [CrossRef]
  30. Banker, R.D.; Charnes, A.; Cooper, W.W. Some models for estimating technical and scale inefficiencies in data envelopment analysis. Manag. Sci. 1984, 30, 1078–1092. [Google Scholar] [CrossRef]
  31. Tone, K. A slacks-based measure of efficiency in data envelopment analysis. Eur. J. Oper. Res. 2001, 130, 498–509. [Google Scholar] [CrossRef] [Green Version]
  32. Tone, K. Advances in DEA Theory and Applications: With Extensions to Forecasting Models; John Wiley & Sons Ltd.: Hoboken, NJ, USA, 2017; pp. 315–330. ISBN 9781118946701. Available online: https://www.wiley.com/en-gb/Advances+in+DEA+Theory+and+Applications%3A+With+Extensions+to+Forecasting+Models-p-9781118945629 (accessed on 9 May 2018).
  33. Verfaillie, H.A.; Bidwell, R. Measuring Eco-Efficiency: A Guide to Reporting Company Performance; World Business Council for Sustainable Development (WBCSD): Geneva, Switzerland, 2000; Available online: http://www.gdrc.org/sustbiz/measuring.pdf (accessed on 23 June 2018).
Figure 1. Distribution of study site in Northeast China.
Forests 09 00455 g001
Figure 2. Distribution of 87 SOFEs in study site.
Forests 09 00455 g002
Figure 3. Eco-efficiency of SOFEs from 2003 to 2016. Note: calculated based on data from the Chinese Forestry Statistical Yearbook and China Statistical Yearbook.
Forests 09 00455 g003
Figure 4. Classifications of SOFEs’ Returns to Scale. Note: calculated based on data from the Chinese Forestry Statistical Yearbook and the China Statistical Yearbook.
Forests 09 00455 g004
Table 1. The industry classification of state-owned forestry enterprises in Northeast China.
NameContents
The primary industryBreeding of trees, afforestation and forest management, wood and bamboo lumbering, cultivation and collection of non-wood forest products, etc.
The secondary industryWood processing, wood-based panel manufacturing, wood furniture manufacturing, paper products manufacturing, etc.
The tertiary industryForestry production services, forestry tourism services, forestry ecological services
Source: The content was sorted according to the State Forestry Administration [7] and Chen et al. [8].
Table 2. Descriptive statistics of the input and output indicators.
ItemIndicatorUnitObs.MeanStd. Dev.Min.Max.
Input indicatorslandthousand hm21218343.966216.48971.316966.110
capitalRMB million 1218114.395108.7924.8941698.573
laborpeople12184850.8852325.268684.00021,580.000
Desirable outputstotal outputRMB million1218449.787339.73425.6701955.000
saleRMB million1218288.199416.2260.0755622.822
Undesirable outputseffluentt121861,324.23564,608.1910.337364,888.388
exhaustthousand m3121857,639.57860,726.2180.317342964.127
solid-wastet121811.68712.3130.00069.542
Note: calculated based on data from the Chinese Forestry Statistical Yearbook, China Statistical Yearbook, and the China Statistical Yearbook on Environment.
Table 3. Eco-efficiency of five SOFE groups.
NameEco-EfficiencyPure-Technical EfficiencyScale Efficiency
2003201520162003–20162003201520162003–20162003201520162003–2016
IM0.7110.3090.0390.4670.8050.5010.1570.5950.8960.6850.6560.807
JL0.8450.7600.4820.6990.8760.8670.7670.8350.9640.8840.6820.849
CBM0.7030.4690.2960.5700.7870.5630.3660.7000.9090.8480.7880.832
LJ0.7690.5530.5060.6040.8230.6610.5950.6740.9310.8680.8920.903
GK0.7690.6120.4520.5810.8620.6290.5150.6410.8940.9730.9010.913
Mean0.7560.5160.3720.5760.8240.6300.4800.6710.9200.8390.8100.870
CV 0.2310.5390.7810.2810.2130.4560.7160.2630.1120.2600.2910.143
Note: calculated based on data from the Chinese Forestry Statistical Yearbook and the China Statistical Yearbook.
Table 4. Classification of SOFEs’ eco-efficiency grades.
RangeGrade200320162003–2016
NumberPercentNumberPercentNumberPercent
EE = 1DEA Efficient1618.39%66.90%22.30%
0.75 ≤ EE < 1High Level2326.44%11.15%1112.64%
0.5≤ EE < 0.75Medium Level4349.43%2326.44%4551.72%
EE < 0.5Low Level55.75%5765.52%2933.33%
Note: calculated based on data from the Chinese Forestry Statistical Yearbook and China Statistical Yearbook.

