Article

Effects of Growing-Season Drought on Phenology and Productivity in the West Region of Central Hardwood Forests, USA

1
School of Natural Resources, University of Missouri, 1105 Rollins Road, Columbia, MO 65211, USA
2
US Department of Agriculture Forest Service, Southern Research Station, 100 Reserve Street, Hot Springs, AR 71902, USA
*
Author to whom correspondence should be addressed.
Forests 2018, 9(7), 377; https://doi.org/10.3390/f9070377
Submission received: 22 April 2018 / Revised: 12 June 2018 / Accepted: 20 June 2018 / Published: 22 June 2018

Abstract

:
Studying the effects of drought on forest ecosystems is important in developing a better understanding of forest phenology and productivity. Many previous studies were based on single drought events, whereas effects of recurrent droughts have not been yet fully investigated. This study jointly analyzed the spatial–temporal change of drought patterns with forest phenology and productivity between 2000–2015 in the western Central Hardwood Forests at Missouri, Arkansas Illinois, Oklahoma, and Kansas of the US. Characteristics of forest phenology and productivity were captured by utilizing the Moderate Resolution Imaging Spectroradiometer (MODIS) remote sensing 16-day MOD13Q1 data and Savitsky–Golay (S-G) filtering method. Spatial-temporal drought patterns were assessed by empirical orthogonal function (EOF) on self-calibrating Palmer Drought Severity Index (scPDSI) time series. Our results revealed four drought zones: sporadic severe drought zone, cyclic light drought zone, minor drought zone, and moderate drought zone. The results showed that at the regional scale, drought effects on forest phenology and productivity depended on forest type and drought intensity. The cyclic light drought did not result in a notable decline of growing season length and productivity, while both minor drought and severe drought were followed by a significant decrease of forest growing season length and productivity. This research presents an alternative method to analyze the impacts of drought on regional forest dynamics.

1. Introduction

As one of the most common environmental perturbations, drought is expected to increase in frequency, extent, and severity with changing climate over large parts of the globe [1,2]. Drought may disrupt the structure and composition of ecosystem, community or diversity, and alter resource availability of physical environment [3]. It is crucial to understand the complex effects of drought on forest ecosystems [4,5,6].
Forest growth phenology and productivity are two indicators of forest ecosystem responses to drought-induced constraints. Drought-induced environmental and physiological changes can advance starting dates of spring phenology (e.g., bud burst, leaf expansion) and prolong ending dates of autumn phenology (e.g., leaf senescence) [7,8]. Jeong et al. analyzed 20 years of remote sensing data and found that the start of growing season (SOS) has been delayed in temperate forests in Northern Hemisphere [9]. Large interannual variability of the end of growing season (EOS) in the Eastern US has been detected by MODIS NDVI data [10], and the changed patterns matched ground-based observations [11]. The timing of growing season could influence forest productivity. For example, the early onset of spring might increase N mineralization rates, potentially resulting in the increase of plant uptake and higher levels of foliar N, which may stimulate photosynthetic rates over the entire growing season [12]. On an opposite scenario, earlier spring could increase transpiration rates, leaving less moisture in the soil in summer resulting in summer productivity reduction [13,14]. Changes in length and timing of growing season may ultimately change species carbon accumulation and forest productivity [15,16], which are widely reported from site to semi-hemisphere scales [9,17,18]. Multiple methods, such as ground network observation [19], remote sensing [20,21], and simulation modeling [22] have been used in monitoring and predicting forest ecosystem response to droughts.
The timing of the drought occurrence has varied impacts on growth phenology and productivity. Summer drought may reduce carbon use efficiency [23] and fall drought may accelerate leaf senescence [24], leading to seasonal productivity decrease. Earlier spring caused by drought may increase transpiration rates resulting in less soil moisture and reducing productivity in summer [25]. Temperature increase caused by drought or xerothermic events may also reveal impacts on forest growth and survival. For example, increased temperature could restrict tree growth and promote the mortality rate of temperature-sensitive species [26,27]. Although drought-induced forest changes have been extensively studied [28,29], few studies have analyzed the effect of recurrent droughts on forest phenology and productivity at regional scales [30,31]. Furthermore, spatial patterns of droughts also differ when examined at different spatial scales. Dendrochronological surveys, for example, provide essential long-term information on tree development under drought conditions. However, such information is often limited to local scales and is insufficient to portray drought characteristics across a region [32,33].
Species may have a different phenological response to droughts due to different physiological characteristics and abilities to adapt to local conditions [34,35,36]. For instance, Montserrat-Martí et al. reported growth phenological discrepancy in pine and oak under summer drought conditions [37]. Kuster et al. [38] found that warming and drought altered the intensity and frequency of some European oaks intra-annual shoot growth and brought forward bud burst in the next spring. Maseyk et al. [39] found that warm and dry summer conditions reduced foliage and stem respiration rates of a semi-arid pine forest which exhibited seasonal respiration adjustment. These adjustments reflect that an underlying high carbon use efficiency which in conjunction with the high levels of primary productivity resulted in a high productivity of that seasonally dry forest. Arend et al. [40] observed that European beech may exhibit three temporally separated phases of seasonal photosynthetic drought response reflecting drought limitation, drought recovery, and post-drought stimulation on tree net-photosynthesis. Thus, monitoring phenology and productivity of different forest compositions under diverse environmental conditions is essential for characterizing species’ responses to droughts. However, whether oaks, pines, and mixed forests exhibiting a similar pattern of phenology and productivity response to drought is still poorly studied [31].
Spatially explicit meteorological indices are useful in quantifying drought variations over long time spans [41]. Among these indices, the high-accuracy self-calibrating Palmer Drought Severity Index (scPDSI) [42] presents distinct advantages in characterizing spatial and temporal patterns of drought [43]. The scPDSI uses an improved realistic estimate of potential evapotranspiration (PET) and improves its comparability by considering multiple factors such as soil moisture and temperature [44]. Therefore, application of scPDSI may provide new insight into forest drought pattern. Instead of annual drought condition, seasonal drought variation may strengthen interpretation of drought effects during growing seasons.
The land surface phenology (LSP) was proposed as the study of the timing of cycling variation on vegetation surface observed via satellite sensors [45]. Compared with traditional individual-based phenological terms which describe simple biological phenomena, phenophase-aggregated terms such as start-of-growing season (SOS), growing season length (SL), and end-of-growing season (EOS) are more accurate in generalizing the dates of forest phenology [20]. Moreover, previous studies also presented that remote sensing observations have provided information to assess forest productivity. For example, Goward et al. [46] related the NDVI to NPP to convert the annual absorbed photosynthetically active radiation (APAR) energy to NPP for different forest systems; Pieter et al. [47] combined satellite estimates of primary productivity and tree-ring dataset to evaluate changes in forest productivity since 1982 across boreal Alaska. From the aspect of spatial coverage, remote sensing-based SOS, EOS, and SL can aggregate vegetation condition over multiple spatial scales, ranging from fine, moderate, to coarse depending on sensor’s spatial resolutions making it possible to capture different responses of forest vegetation (e.g., oaks, pines, mixed oak-pine) to drought.
Objectives of this study are to evaluate drought impacts (2000–2015) on the forest growth phenology and productivity of Central Hardwood Forests in the Ozark Highlands, U.S.A. Forest phenology and productivity variations were captured by utilizing 16-days MOD13Q1 standard MODIS products of 250 m resolution and the Savitsky–Golay (S–G) filtering method. The drought spatial-temporal patterns were assessed by using empirical orthogonal function (EOF) on scPDSI time series data acquired from Climate Research Unit (CRU) TS 3.25 datasets. We answered the following questions: (1) how did forest growth phenology and productivity respond to droughts of different intensities? (2) how did droughts affect the growth phenology and productivity of oaks, pine, and mixed oak-pine forests?

2. Materials and Methods
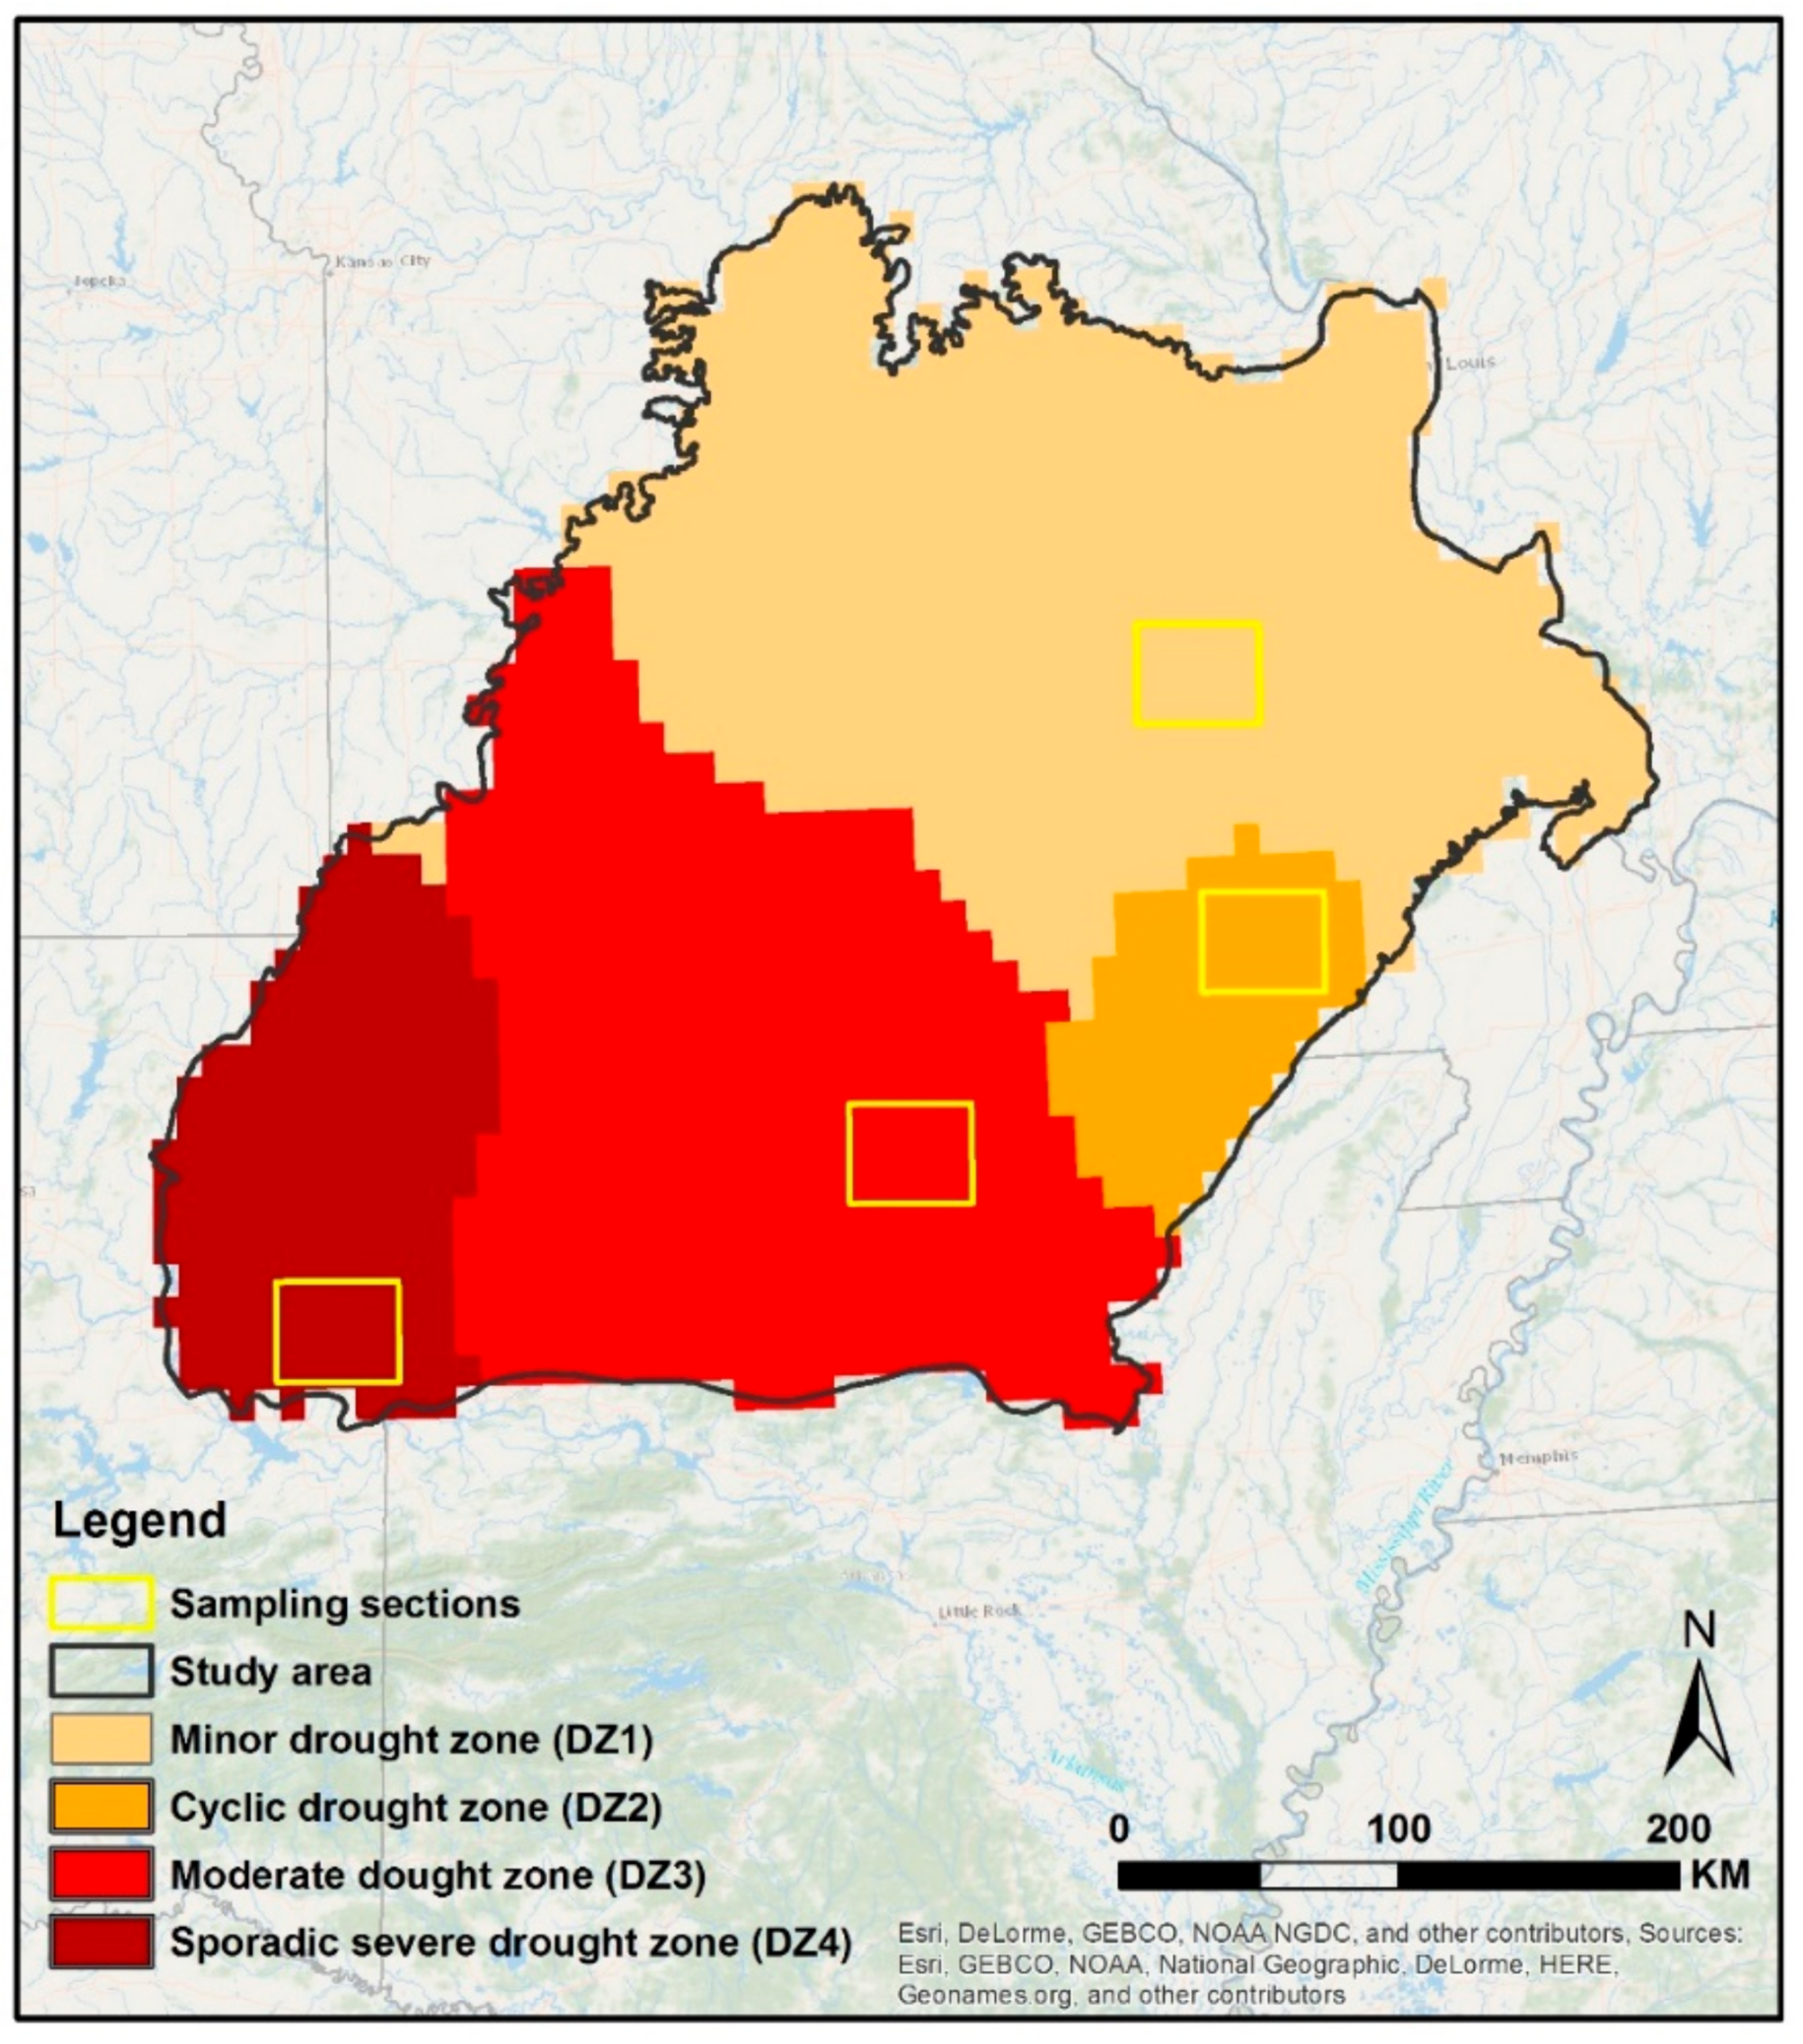
2.1. Study Area

The study area is located in the west portion of the Central Hardwood Forest including Ozark Highlands and Boston Mountains ecological sections with over 134,000 km2 [48]. This study area is a rugged and hilly region stretching across southern Missouri, Northern Arkansas, northeastern Oklahoma, southeastern Kansas, and southwest Illinois of the US (Figure 1). The elevation ranges from 100 to 762 m. Average annual temperature and precipitation range from 13.1 to 17.0 °C and from 1020 to 1325 mm, respectively, with over 50% annual precipitation occurring from April to September. The growing season lasts 180–205 days [49]. The hardwood forests in this area are dominated by the oak-hickory forest type. Specifically, dominant species are white oak (Quercus alba), post oak (Quercus stellata), chinkapin oak (Quercus muehlenbergii), black oak (Quercus velutina), northern red oak (Quercus rubra), blackjack oak (Quercus marilandica), southern red oak (Quercus falcate), pignut hickory (Carya glabra), and black hickory (Carya texana). Shortleaf pine (Pinus echinata) is abundant in the southeast area of Ozark Highlands and in the southern area of the Boston Mountains.

2.2. General Approach

We identified drought conditions in our study area and evaluated the response of different tree species growth phenology and productivity to droughts between 2000 and 2015. We derived spatial-temporal patterns of droughts by applying Empirical Orthogonal Function (EOF) analysis which is one of the Principle component analysis (PCA) on scPDSI data (Figure 2). We assessed the responses of forest growth phenology and productivity to drought using NDVI information from time-series MODIS products and compared them through several one-way ANOVA. Correspondence analysis (CA) was also applied to examine the response of oak, pine and mixed forests to drought, as expressed by growing period length and productivity changes, during this period.

2.3. Drought Dataset

The scPDSI data for 2000–2015 are calculated from the Climate Research Unit (CRU) TS 3.25 datasets (0.5° resolution) [50]. Gridded precipitation, temperature, cloud cover, and vapor pressure data from CRU were used in processing scPDSI. These datasets were generated by using weather station records with high-quality control and were also checked for inconsistencies. We used scPDSI to monitor drought conditions because (a) Penman-Monteith parameterization which is more physically based is used for potential evapotranspiration; (b) seasonal snowpack dynamics are taken into consideration in the model; (c) it is more comparable among diverse climate regions, which were suitable for pattern analysis of drought. A more detailed review of the scPDSI dataset is summarized by Schrier et al. [51]. In this study, drought year is defined as the whole growing season’s scPDSI < 0.

2.4. The Forest Type Data

The forest type map is extracted from National Land Cover Dataset 2011 (NLCD 2011) [52]. NLCD 2011 is the most recent national land cover product which provides spatially explicit land cover data across the United States. We reclassified the 16-class land covers into four classes, namely, oak forest, pine forest, mixed oak-pine forest, and others according to the Anderson Land Cover Classification System applied in NLCD 2011 (Table 1). We also resampled the land cover map from 30-m resolution to about 250 m to match MODIS NDVI data in the further analysis.

2.5. NDVI Time Series from MODIS

Normalized Difference Vegetation Index (NDVI), one of the greenness vegetation indices, is sensitive to indicators of canopy parameters and is widely used to derive vegetation phenology. In this study, the NDVI data were acquired from MODIS Terra sensor at a temporal resolution of 16 days and spatial resolution of 250 m (MOD13Q1) [53]. The time span of the data covers from January 2000 to December 2015. All NDVI data are organized in images and each image assigns the NDVI values in the array at a specified time. By extracting NDVI values at a location that includes the whole timespan, the NDVI time series can be established for further vegetation dynamics analysis.

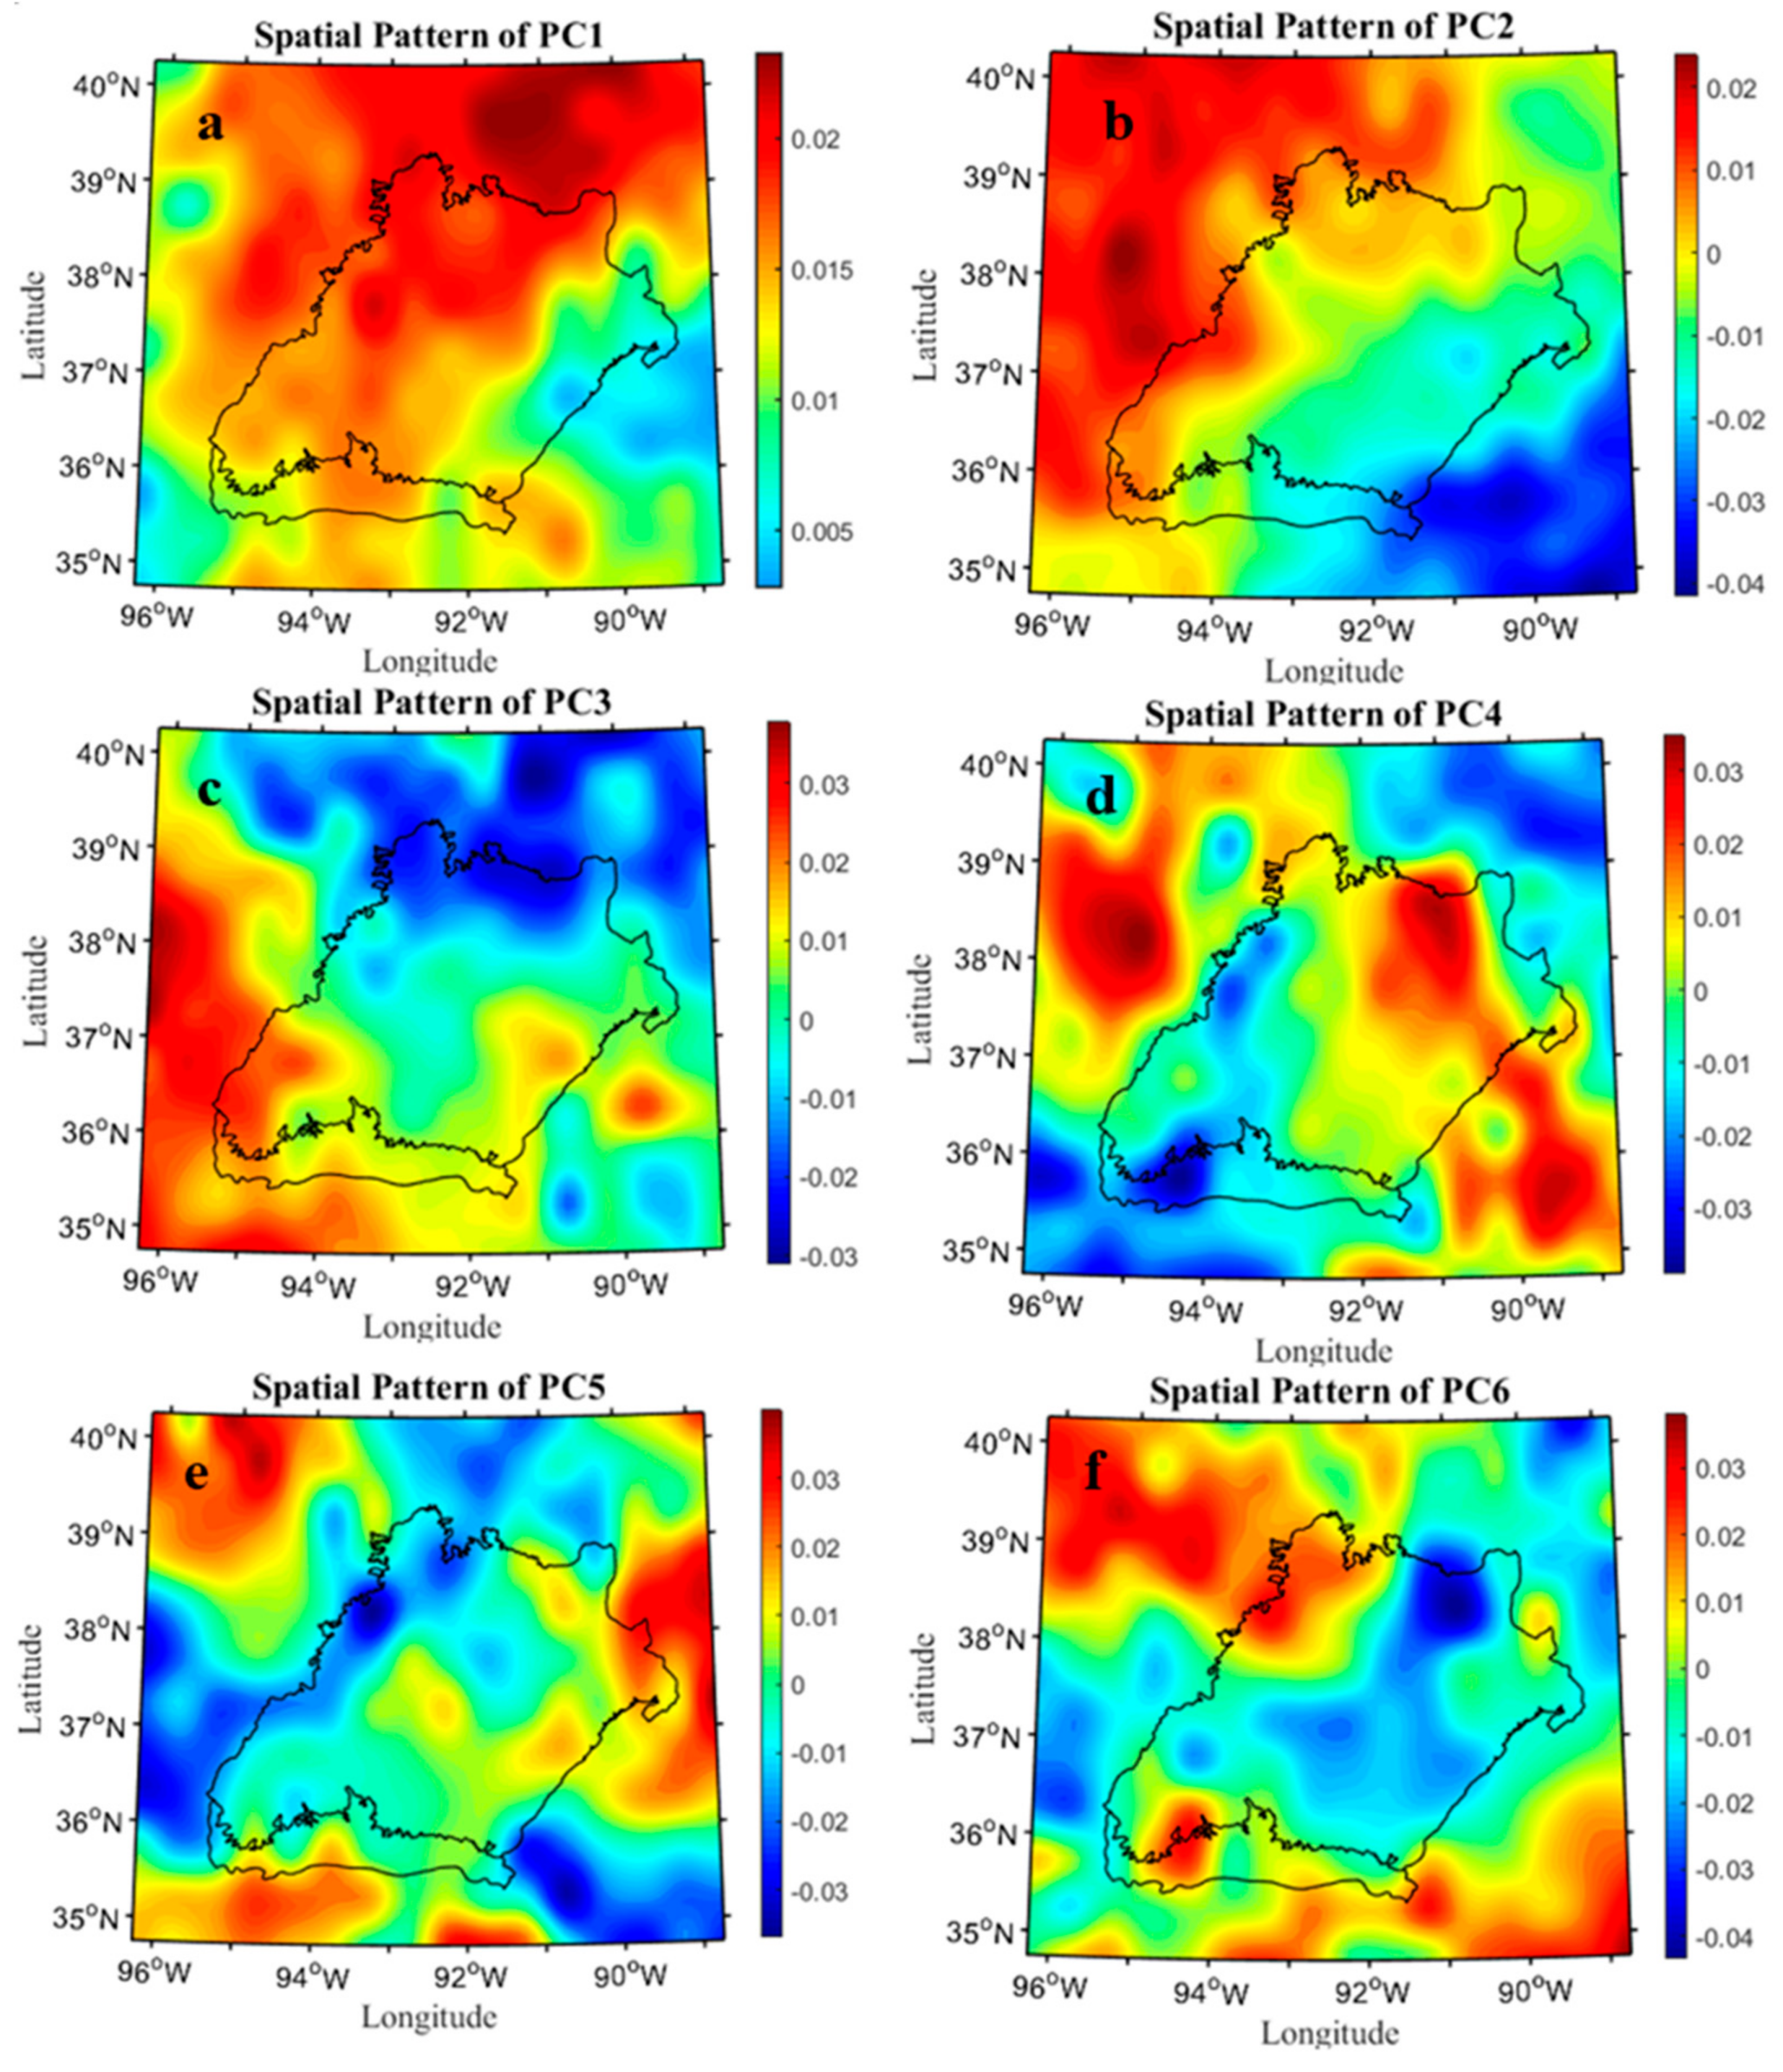
2.6. Spatial-Temporal Pattern Analysis of Drought Variability

Empirical orthogonal function (EOF) analysis is used to reduce the scPDSI time-series variables and to capture the mainly spatial-temporal variability of droughts between 2000 and 2015. EOF analysis is one of the principal component analysis (PCA) which has been widely used in meteorological data analysis to exclude the influence of unimportant components [54,55]. We only chose the first k PCs, in which k was the number of PCs explaining 90% of the total variation in the scPDSI data. The time series of normalized PCs were analyzed to show the major temporal fluctuations that existed in the scPDSI time-series. The spatial patterns corresponding to the temporal fluctuations were also generated, which can provide a direct view of the relationship between the scPDSI data and each PC. To reduce the influence from long-term climate condition changes and drought’s high interannual variability, we further analyzed the spatial pattern maps through an Isodata clustering process. Thus, these pixel-level correlation maps can be spatially averaged and classified into different drought zones through this process. Finally, a classified map was generated according to the scPDSI values. We labeled each zone as a drought zone (DZ).

2.7. Extraction of Forest Growth Phenology and Productivity

There were short peaks and drop-offs caused by noise and singular values in raw NDVI time series data due to the limitation of atmospheric conditions and sensors, which would affect further analysis and applications and need to be processed. Thus, the TIMESAT program package and Savitsky–Golay (S–G) filtering method were used to fit satellite data time-series and to handle the data defects in this study [56,57]. From the fitted time-series curve, a number of seasonality parameters, e.g., SOS, EOS, and length of growing season (SL), can be extracted. Meanwhile, we defined the NDVI Large Integral (NDVIlin) as a proxy for annual forest productivity. NDVIlin is measured by the area under the reconstructed NDVI curve which is delineated by the value of the yearly maximum and the value of beginning and end date.

2.8. Drought Effects on Forest Growth Phenology and Productivity

One sampling subsection was set within each identified drought type to test the drought effects on forest growth phenology and productivity using the following procedure: (a) randomly selecting 1000 points within each subsection; (b) matching the points with the forest cover map and removing non-forest points (Table 2); (c) assigning the forest type, drought zone id, and 16-year NDVI-based phenological parameters (SL, and NDVIlin) to the sample points; (d) then for each drought zone, conduct a one-way ANOVA test on oak/pine/mixed oak-pine forest’s growth phenology and productivity response to different drought severities. All tests were run through using Statistical Analysis System (SAS) ANOVA procedure to examine growth phenology and productivity differences between different drought years among oak/pine/mixed oak-pine forest. Statistical differences are reported in Table 3 at 0.05 significance level.

2.9. The Response of Different Forest Types to Drought

The steadiness index [58] was applied to NDVIlin and SL to estimate the growth phenology and productivity changes during 2000–2015. This index can capture no change and positive or negative changes by measuring the slope of linear trend of NDVIlin and SL time series, which results in nine possible combinations based on steadiness index for NDVIlin and SL. We quantified the number of pixels of the nine combinations ((1) increased SL and increased NDVIlin; (2) increased SL and stable NDVIlin; (3) increased SL and decreased NDVIlin; (4) stable SL and increased NDVIlin; (5) stable SL and stable NDVIlin; (6) stable SL and decreased NDVIlin; (7) decreased SL and increased NDVIlin; (8) decreased SL and stable NDVIlin; and (9) decreased SL and decreased NDVIlin) falling within each DZs and forest types. To assess spatial distribution of different forests response to droughts, we conducted Correspondence Analysis (CA) on the table with the nine combinations as columns and the spatial entities of DZs, forest types as rows using the algorithm in R package “FactoMineR” [59]. The correlation results are presented in bi-plots based on first two dimensions for each DZs. The percentage of each dimension indicates to what extent this dimension explains the variance in the data. The association was measured by the angle between the arrows for forest types and NDVIlin/SL combinations within a given DZ.

3. Results

3.1. Drought Conditions in the West Region of Central Hardwood Forests

Through EOF process, the first six PCs were selected for further analysis because they explained nearly 90% of the variation in the Ozark Highland and Boston Mountain of the scPDSI time-series (Figure 3). The first PC (Figure 3a) indicates drought conditions between 2005 spring and 2008 spring. This variability explains 60.4% of the total data variance. The spatial covariance of the first PC (Figure A1a) was positive ranging from 0.024 to 0.003, indicating that the drought condition in this area was homogeneous. The relatively high values in PC1’s spatial pattern map presented in the northwest of the Ozark Highland indicated that the variability of drought was larger than that in the rest of the area. The second identified PC (Figure 3b) revealed that drought conditions between 2002 winter and 2005 spring accounted for 13.3% of data variability. The spatial covariance ranged from 0.023 to −0.04 and declined from northwest to southeast demonstrating the other underlying drought condition: severe drought occurred in the northwest while less severe drought occurred in the southeast, and vice versa (Figure A1b). The third PC (Figure 3c) showed leveled temporal response with positive anomalies from 2002 spring to 2009 spring and this PC took up 7.3% of the total variance present in the scPDSI time series. The spatial covariance ranged from 0.036 to −0.03 increased from southwest to northeast, revealing limited drought variability in the central area of the Ozark Highlands (Figure A1c). In the fourth PC (Figure 3d), a sharp increase between 2000 spring and 2002 winter followed by two strong positive anomalies in 2005 winter and 2010 fall. This temporal pattern explained 3.6% of data variability. The fifth PC (Figure 3e) demonstrated positive anomalies in 2007 spring and 2004 summer as well as drought conditions in 2003 summer and 2020 fall in this study area associating with 2.8% data variability. Finally, the sixth PC (Figure 3f) showed fluctuating drought conditions with a subtle overall decreasing trend, which only explained 2.2% of scPDSI data variance. The last two PCs have a limit explanation for the total data variability (Figure A1e,f).
The six spatial patterns of the selected PCs resulted in four dominant zones of drought types after the Isodata clustering process (Figure 4). Drought zone 1 almost covered the northern part of the Ozark Highlands in Missouri and is the largest among all drought zones. It was characterized as drought zone with minor drought events occurred in 2000, 2001, 2007 and 2012 (Figure 5a). Drought zone 2 was characterized as recurrent major drought event zone (Figure 5b) in which major drought in 2005–2006 and 2011–2013, with averaged scPDSI values around −1.7 were found. Although cyclic drought zone has the same number of drought events as minor drought zone, the scPDSI value series have more up-and-down (cyclic) patterns than minor drought zone. Drought zone 3 was characterized as (Figure 5c) moderate drought zone in which drought event in 2006–2007 with average scPDSI values of −1.4 was captured. Drought zone 4 (Figure 5d) was characterized as sporadic severe drought zone in which drought events in 2003, 2005–2007, and 2013, with an average scPDSI value of −3.5 were captured.

3.2. Forest Growth Phenology and Productivity Response to Drought of Different Severities

In the DZ1, the drought occurred in 2000 with the average scPDSI value 0.92 and followed by slight droughts in 2001, 2012, and 2007, which influenced the forest phenology of oak by shortening its SL. When the drought was slight in 2007, the SL of oak forest was 208.9 days. However, it decreased to 190.9 days when influenced by the forest SL drought occurred in 2000. The proxy of forest productivity, NDVIlin, also significantly shrank from 123,368.5 to 117,012.1 indicating loss of biomass accumulation during the growing season when suffering severer drought (Table 3). The SL and NDVIlin value of droughts in 2001 and 2012 were between that of 2007 and 2000. In the cyclic drought zone (DZ2), the drought events can be sorted in descending order as 2000, 2012, 2001, and 2005 according to the average scPDSI value, and the SL of oak forest followed a reverse trend as drought intensity increased (Table 3). Moreover, NDVIlin of oak forests in 2012 had a stronger influence. This is probably due to the repeated short drought conditions (<3 months) that occurred before 2012, resulting in a decrease of drought resilience. In the moderate drought zone (DZ3), the 2000 drought resulted in a decrease of up to 7 days in SL of oak forest when compared with 2005 (Table 3). In the sporadic severe drought zone (DZ4), major drought events occurred in 2005–2007. However, significant discrepancies existed among these three years SL and NDVIlin of oak forest: the last two years have less influence than the first drought year (Table 3).

3.3. Forest Type Responses to Drought

Different forest types respond to drought differently. In the minor drought zone, drought events in 2000 and 2001 did not reveal significant differences on SL of pines or mixed forests, but significant differences were observed in the oak forests (Table 3). The SL and NDVIlin of mixed forests in 2012 were significantly different from that in 2007, while this was not observed in pine forests. In the cyclic drought zone, forest productivity of each forest type followed the same increasing trend as drought intensity decreased (Table 3). The trend in each forest type’s SL indicated that drought with increasing intensity may not cause significant changes in SL (e.g., pine forest), but more likely to influence productivity. Moreover, recurrent drought (2012) was followed by a greater reduction in SL and productivity than a single severe drought (2005). In the moderate drought zone, despite the pine forests’ SL indicated significant variability among drought years, productivity did not show any significant differences, whereas for oak forests did (Table 3). In sporadic severe drought zone, the drought events occurred in 2005, 2006, and 2007 with the average scPDSI value −0.7, −2.8, and −3.1 respectively. Changes in pine forests’ SL were not significant, whereas changes in oak forests SL were (Table 3).
From the results of CA for minor drought zone (DZ1), the response of oak, pine and mixed forests to drought varied: mixed forests presented stable or decreased growing season and increased productivity; pine forests showed increase in growth phenology and productivity from 2000 to 2015 indicating the recovery from the previous drought events, while oak forest’ responses were more complicated with slightly shrank SL and stable productivity (Figure 6a). In cyclic drought zone (DZ2), the mixed pine-oak forests and oak forests had a similar response: decreased phenology and stable productivity, while pine forests were clearly recovered from drought events during 2000–2015 (Figure 6b). In the moderate drought zone (DZ3), the mixed forests exhibited reversed trend in productivity under stable SL. Oak forests showed various responses for the length of growing seasons and stable productivity indicating that oak forests phenology is more sensitive than its productivity to drought (Figure 6c). Mixed forests in drought zone 4 showed increased or stable productivity under longer growing season (Figure 6d).

4. Discussion

4.1. Drought Variation Estimation

Drought spatial and temporal variations were estimated for the west region of Central Hardwood Forests for the period 2000–2015. The results showed that this region was exposed to drought of various extents during this period with major drought episodes in 2000–2003, 2006–2007 and 2012–2013. To be specific, southern Missouri experienced droughts in 2000, 2001, 2007 and 2012, which are consistent with the observations from Wang, Seco, and Yang et al. [60,61,62]. These drought records can also be discerned from the region scPDSI (Figure 5). In northern Arkansas, especially in the Ozark National Forests, the temporal pattern extracted from scPDSI of droughts in 2001–2003, 2006–2007, and 2008–2010 is in line with the results presented by Fan et al. [63] as well as regional events. Unlike previous studies in western Central Hardwood Forests, we disassembled the two ecological sections into four parts according to the dominating drought events during 2000–2015, which provides insights to further analysis on drought effects on forests. Temperature discrepancies during 2000–2015 could also have a dramatic impact on forest phenology and growth and contribute to explaining the results (Table 3). The respiration rates of some temperature-sensitive species were accelerated reducing the photosynthate accumulation and annual growth [64]. On the other hand, a cool and dry fall with early foliage senescence would directly result in an increase in net carbon sequestration [14].

4.2. Phenology and Productivity Response to Drought

In this study, we combined spatial-temporal patterns of recurrent drought with forest productivity and phenological changes to estimate the response of oak, pine and mixed forests to drought events of different intensities. Only part of the observed tempo-spatial patterns of drought co-occurred with negative effects on forest growth phenology and productivity. In the minor drought zone, significant growing season declines as drought intensity slightly increased (Table 3). However, cyclic droughts in drought zone 2 did not shorten the SL as they did in the minor drought zone (Table 3). This was likely due to that trees endure a short-term drought differently as they endure a long-term minor drought [36,65,66]. Besides, we also detected the wet period from 2009 to 2010. The similar wet conditions between each cyclic drought may also facilitate forest recovery, which reduced impacts on productivity decline from the previous drought [67,68]. A pronounced negative change in productivity and growing season length followed the sporadic severe drought in the west of the Ozarks. Similarly, Seco et al. [61] reported that the gross primary productivity was strongly suppressed by the extreme drought.
Recent estimates of phenology in US forests revealed that the growing season over temperate forests is extending from 1981 to 2012 based on NDVI data [69] and phenological modeling [22]. However, such prolongation estimations differed among regions and did not consider the impacts from extreme drought events. Our results mainly accord with the above assessments, but reveal deviations when drought effects are considered. For example, significantly shorter growing seasons have been detected in multiple regions after drought occurrences (Table 3). In turn, the shorter growing periods did not lead to productivity deduction in any drought zone indicating the resistance and recovery capability of Central Hardwood Forests (Figure 6).

4.3. Forest Types Response to Drought

Our results also showed that different forest types respond to drought differently. The productivity of oak-dominated forests was less affected under different types of droughts (Figure 6). In western Central Hardwood Forests, the primary deciduous tree species are oaks (Quercus sp.) and hickories (Carya sp.). These species have an isohydric strategy. They are drought-tolerant and show more stomatal control and lower negative water potential under extreme drought. The above facts allow them to endure drought episodes with less productivity loss [70]. Our results also showed that coniferous tree species have greater fluctuation in forest productivity when affected by different types of drought. The primary coniferous tree species included in the study were shortleaf pine (Pinus echinata) and loblolly pine (Pinus taeda). These species also have an isohydric strategy and can close stomata early to limit water losses, but they reduce stomatal conductance and decrease the level of carbohydrate reserves under drought conditions [70]. This may result in different performance under the same drought condition. For example, the SL of oak forests was 199.6 days when severe drought occurred in 2006. However, the SL of pine forests was 9 days shorter (Table 3). Mixed oak-pine forests showed negative response to growing season in DZ1 and DZ2 and positive response in DZ3, and DZ4, reflecting oak and pine’s adaptation strategies [31]. Also, these different responses can be explained as the tradeoffs between niche complementarity and species competitions in the mixed oak-pine forest. On the one hand, niche complementarity and facilitation may improve mixed versus pure stand performance during short-term water stress, for example, available water might be better stored and used in mixed other than pure stands due to highly developed shallow and deep root system [71,72]. On the other hand, the interspecific competitions may cause nonlinear physiological responses to drought intensity which in the same line with previous studies [73,74].

4.4. Advantages and Disadvantages of the Applied Methodology

We extracted phenology parameters based on the 16 phenological cycles derived from MODIS13Q1 time series data at 250-m spatial resolution, which demonstrates the average seasonality among several species. The species-specific phenology was not obtained for three main reasons. Firstly, species-specific measurements are not available at landscape scale, which influences the validation of remote sensing-based phenology extraction [22]. Secondly, species-level estimation raises the cost of computation and complexity while reducing its reliability [75]. Finally, the similarity of phenology and productivity between the species-specific and species-aggregated approaches was presented in studies at both stand and regional level [20]. The remote sensing imageries offer convenience and efficiency in estimating large-scale phenology. However, the phenology discrepancy caused by forest compositions and forest type configurations could reduce the analysis accuracy and bring uncertainty.
The methodology applied in this study based on EOF technique (one of the principal component analysis) makes it possible to assess forest productivity and growing season length that are influenced by recurrent and successive droughts. The current approach is applicable to visualize short- to medium-term forest ecosystem responses to extreme meteorological events such as drought at the regional scale. It clusters the ecoregions into different drought zones with specific drought spatial-temporal patterns. It also allows the classification of forests which have undergone similar short drought-stresses. For example, Lewinska et al. [76] applied a similar method and recognized drought temporal patterns over an alpine dominated forest in South Tyrol, Italy, providing a reference for monitoring drought impacts on alpine forests. Moreover, this methodology has potential to extract information of the frequency, severity, and extent of extreme events. It may bring insights into improving drought resistance and recovery capacity of forests with different species under a changing climate.

5. Conclusions

In this study, we evaluated spatial–temporal patterns of droughts in western Central Hardwood by applying Empirical orthogonal function (EOF) analysis on scPDSI data during the period of 2000–2015. The first six PCs explained nearly 90% of the variation of the scPDSI time-series. The six spatial patterns of the selected PCs resulted in four dominant zones of drought types after the Isodata clustering process. We named drought zones as minor droughts zone (DZ1), cyclic droughts zone (DZ2), moderate drought zone (DZ3), and sporadic severe drought zone (DZ4). The temporal patterns indicated that this region was exposed to major droughts in 2000–2003, 2006–2007 and 2012–2013.
We assessed the responses of forest phenology and productivity to drought using NDVI information from filtered time-series MOD13Q1 imageries and compared them through multiple one-way ANOVA. Correspondence analysis was applied to examine the response of affected oak, pine and mixed forests. We found that growing season and productivity could be significantly influenced by drought events. But the drought severity may not necessarily shorten the growing season and productivity. Among the species studied, especially the pine forests were recovered from drought events and exhibited positive responses. In our study, differences in response to drought types played a critical role in estimating drought effects on productivity and growth phenology. The responses of oak, pine and mixed forests to drought provide a useful insight in understanding temperate forests’ response to climate change under global warming.

Author Contributions

S.D. and H.S.H. designed the study; S.D. processed and analyzed the data; S.D., H.S.H. and M.S. wrote the paper.

Funding

This research was funded by grant 14-JV-11330134-049 from the U.S Forest Service Southern Station.

Acknowledgments

We thank the funding from the U.S Forest Service Southern Station. We also thank the three anonymous reviewers for their constructive comments to improve the manuscript.

Conflicts of Interest

The authors declare no conflict of interest.

Appendix A

Figure A1. The spatial patterns of the first six PCs estimated from the original monthly scPDSI from 2000 to 2015. Red represents a relatively high correlation while blue means a relatively low correlation (af).
Forests 09 00377 g0a1

Appendix B

Table A1. The ANOVA outputs of Section 2.8.
DZ1 for NDVIlin
SourceDFSum of SquaresMean SquareF ValuePr > F
Model322,147,183,4357,382,394,478.284.06<0.0001
Error2208193,910,331,25187,821,707.994
Corrected Total2211216,057,514,686
DZ1 for SL
SourceDFSum of SquaresMean SquareF ValuePr > F
Model3121.24963440.41654558.94<0.0001
Error22081514.0949370.685731
Corrected Total22111635.344571
DZ2 for NDVIlin:
SourceDFSum of SquaresMean SquareF ValuePr > F
Model315,449,150,2565,149,716,752137.10<0.0001
Error182868,661,833,03337,561,178
Corrected Total183184,110,983,289
DZ2 for SL
SourceDFSum of SquaresMean SquareF ValuePr > F
Model362.847685620.949228565.52<0.0001
Error1828584.47266380.3197334
Corrected Total1831647.3203493
DZ3 for NDVIlin
SourceDFSum of SquaresMean SquareF ValuePr > F
Model45,541,997,181.21,385,499,295.315.66<0.0001
Error2220196,472,945,18888,501,326.661
Corrected Total2224202,014,942,369
DZ3 for SL
SourceDFSum of SquaresMean SquareF ValuePr > F
Model4169.88362242.47090674.01<0.0001
Error22201273.9997750.573874
Corrected Total22241443.883398
DZ4 for NDVIlin
SourceDFSum of SquaresMean SquareF ValuePr > F
Model433,791,990,4828,447,997,620.4129.15<0.0001
Error2600170,076,503,14465,414,039.671
Corrected Total2604203,868,493,625
DZ4 for SL
SourceDFSum of SquaresMean SquareF ValuePr > F
Model4539.976791134.994198336.67<0.0001
Error26001042.5039920.400963
Corrected Total26041582.480783

Appendix C

Table A2. Normal year values for SL and NDVIlin for each drought zone.
Drought ZoneType of ForestPhenology ParametersNormal Year Values
Minor drought zoneOak forestSL (days)200.2
NDVIlin117,956.2
Pine forestSL (days)203.0
NDVIlin123,084.9
Mixed forestSL (days)199.0
NDVIlin116,653.3
Cyclic drought zoneOak forestSL (days)195.8
NDVIlin119,606.1
Pine forestSL (days)201.4
NDVIlin127,575.2
Mixed forestSL (days)208.8
NDVIlin121,881.1
Moderate drought zoneOak forestSL (days)204.0
NDVIlin124,277.9
Pine forestSL (days)213.6
NDVIlin123,600.5
Mixed forestSL (days)209.8
NDVIlin123,106.8
Sporadic severe drought zoneOak forestSL (days)201.4
NDVIlin118,559.1
Pine forestSL (days)198.4
NDVIlin119,523.7
Mixed forestSL (days)204.8
NDVIlin121,145.2

References

  1. Asner, G.P.; Alencar, A. Drought impacts on the amazon forest: The remote sensing perspective. New Phytol. 2010, 187, 569–578. [Google Scholar] [CrossRef] [PubMed]
  2. Williams, J.W.; Jackson, S.T.; Kutzbach, J.E. Projected distributions of novel and disappearing climates by 2100 AD. Proc. Natl. Acad. Sci. USA 2007, 104, 5738–5742. [Google Scholar] [CrossRef] [PubMed] [Green Version]
  3. Breshears, D.D.; Cobb, N.S.; Rich, P.M.; Price, K.P.; Allen, C.D.; Balice, R.G.; Romme, W.H.; Kastens, J.H.; Floyd, M.L.; Belnap, J. Regional vegetation die-off in response to global-change-type drought. Proc. Natl. Acad. Sci. USA 2005, 102, 15144–15148. [Google Scholar] [CrossRef] [PubMed] [Green Version]
  4. Scherrer, D.; Bader, M.K.-F.; Körner, C. Drought-sensitivity ranking of deciduous tree species based on thermal imaging of forest canopies. Agric. For. Meteorol. 2011, 151, 1632–1640. [Google Scholar] [CrossRef]
  5. Bonan, G.B. Forests and climate change: Forcings, feedbacks, and the climate benefits of forests. Science 2008, 320, 1444–1449. [Google Scholar] [CrossRef] [PubMed]
  6. Brandt, L.; He, H.; Iverson, L.; Thompson, F.R.; Butler, P.; Handler, S.; Janowiak, M.; Shannon, P.D.; Swanston, C.; Albrecht, M. Central Hardwoods Ecosystem Vulnerability Assessment and Synthesis: A Report from the Central Hardwoods Climate Change Response Framework Project; Gen. Tech. Rep. NRS-124; US Department of Agriculture, Forest Service, Northern Research Station: Newtown Square, PA, USA, 2014; Volume 124, pp. 1–254.
  7. Xie, Y.; Wang, X.; Silander, J.A. Deciduous forest responses to temperature, precipitation, and drought imply complex climate change impacts. Proc. Natl. Acad. Sci. USA 2015, 112, 13585–13590. [Google Scholar] [CrossRef] [PubMed] [Green Version]
  8. Camarero, J.J.; Franquesa, M.; Sangüesa-Barreda, G. Timing of drought triggers distinct growth responses in holm oak: Implications to predict warming-induced forest defoliation and growth decline. Forests 2015, 6, 1576–1597. [Google Scholar] [CrossRef]
  9. Jeong, S.J.; HO, C.H.; GIM, H.J.; Brown, M.E. Phenology shifts at start vs. End of growing season in temperate vegetation over the northern hemisphere for the period 1982–2008. Glob. Chang. Biol. 2011, 17, 2385–2399. [Google Scholar] [CrossRef]
  10. Dragoni, D.; Rahman, A.F. Trends in fall phenology across the deciduous forests of the eastern USA. Agric. For. Meteorol. 2012, 157, 96–105. [Google Scholar] [CrossRef]
  11. Dragoni, D.; Schmid, H.P.; Wayson, C.A.; Potter, H.; Grimmond, C.S.B.; Randolph, J.C. Evidence of increased net ecosystem productivity associated with a longer vegetated season in a deciduous forest in south-central indiana, USA. Glob. Chang. Biol. 2011, 17, 886–897. [Google Scholar] [CrossRef]
  12. Richardson, A.D.; Hollinger, D.Y.; Dail, D.B.; Lee, J.T.; Munger, J.W.; O’keefe, J. Influence of spring phenology on seasonal and annual carbon balance in two contrasting new england forests. Tree Physiol. 2009, 29, 321–331. [Google Scholar] [CrossRef] [PubMed]
  13. Kljun, N.; Black, T.; Griffis, T.; Barr, A.; Gaumont-Guay, D.; Morgenstern, K.; McCaughey, J.; Nesic, Z. Response of net ecosystem productivity of three boreal forest stands to drought. Ecosystems 2006, 9, 1128–1144. [Google Scholar] [CrossRef]
  14. Richardson, A.D.; Black, T.A.; Ciais, P.; Delbart, N.; Friedl, M.A.; Gobron, N.; Hollinger, D.Y.; Kutsch, W.L.; Longdoz, B.; Luyssaert, S. Influence of spring and autumn phenological transitions on forest ecosystem productivity. Philos. Trans. R. Soc. B Biol. Sci. 2010, 365, 3227–3246. [Google Scholar] [CrossRef] [PubMed] [Green Version]
  15. Piao, S.; Ciais, P.; Friedlingstein, P.; Peylin, P.; Reichstein, M.; Luyssaert, S.; Margolis, H.; Fang, J.; Barr, A.; Chen, A. Net carbon dioxide losses of northern ecosystems in response to autumn warming. Nature 2008, 451, 49–52. [Google Scholar] [CrossRef] [PubMed]
  16. Richardson, A.D.; Bailey, A.S.; Denny, E.G.; Martin, C.W.; O’KEEFE, J. Phenology of a northern hardwood forest canopy. Glob. Chang. Biol. 2006, 12, 1174–1188. [Google Scholar] [CrossRef] [Green Version]
  17. White, M.A.; Beurs, D.; Kirsten, M.; Didan, K.; Inouye, D.W.; Richardson, A.D.; Jensen, O.P.; O’Keefe, J.; Zhang, G.; Nemani, R.R. Intercomparison, interpretation, and assessment of spring phenology in north america estimated from remote sensing for 1982–2006. Glob. Chang. Biol. 2009, 15, 2335–2359. [Google Scholar] [CrossRef]
  18. Peñuelas, J.; Filella, I. Phenology feedbacks on climate change. Science 2009, 324, 887–888. [Google Scholar] [CrossRef] [PubMed] [Green Version]
  19. Gunderson, C.A.; Edwards, N.T.; Walker, A.V.; O’hara, K.H.; Campion, C.M.; Hanson, P.J. Forest phenology and a warmer climate–growing season extension in relation to climatic provenance. Glob. Chang. Biol. 2012, 18, 2008–2025. [Google Scholar] [CrossRef]
  20. Hamunyela, E.; Verbesselt, J.; Roerink, G.; Herold, M. Trends in spring phenology of western european deciduous forests. Remote Sens. 2013, 5, 6159–6179. [Google Scholar] [CrossRef]
  21. Anderson, L.O.; Malhi, Y.; Aragão, L.E.; Ladle, R.; Arai, E.; Barbier, N.; Phillips, O. Remote sensing detection of droughts in amazonian forest canopies. New Phytol. 2010, 187, 733–750. [Google Scholar] [CrossRef] [PubMed]
  22. Yue, X.; Unger, N.; Zhang, X.; Vogel, C. Probing the past 30-year phenology trend of us deciduous forests. Biogeosciences 2015, 12, 4693. [Google Scholar] [CrossRef]
  23. Ciais, P.; Reichstein, M.; Viovy, N.; Granier, A.; Ogée, J.; Allard, V.; Aubinet, M.; Buchmann, N.; Bernhofer, C.; Carrara, A. Europe-wide reduction in primary productivity caused by the heat and drought in 2003. Nature 2005, 437, 529. [Google Scholar] [CrossRef] [PubMed]
  24. Marchin, R.; Zeng, H.; Hoffmann, W. Drought-deciduous behavior reduces nutrient losses from temperate deciduous trees under severe drought. Oecologia 2010, 163, 845–854. [Google Scholar] [CrossRef] [PubMed]
  25. Leuzinger, S.; Zotz, G.; Asshoff, R.; Körner, C. Responses of deciduous forest trees to severe drought in central europe. Tree Physiol. 2005, 25, 641–650. [Google Scholar] [CrossRef] [PubMed]
  26. Allen, C.D.; Breshears, D.D.; McDowell, N.G. On underestimation of global vulnerability to tree mortality and forest die-off from hotter drought in the anthropocene. Ecosphere 2015, 6, 1–55. [Google Scholar] [CrossRef]
  27. Dietze, M.C.; Moorcroft, P.R. Tree mortality in the eastern and central united states: Patterns and drivers. Glob. Chang. Biol. 2011, 17, 3312–3326. [Google Scholar] [CrossRef]
  28. Bréda, N.; Huc, R.; Granier, A.; Dreyer, E. Temperate forest trees and stands under severe drought: A review of ecophysiological responses, adaptation processes and long-term consequences. Ann. For. Sci. 2006, 63, 625–644. [Google Scholar] [CrossRef]
  29. Kogan, F.; Guo, W. 2006–2015 mega-drought in the western USA and its monitoring from space data. Geomat. Nat. Hazards Risk 2015, 6, 651–668. [Google Scholar] [CrossRef]
  30. Lindner, M.; Maroschek, M.; Netherer, S.; Kremer, A.; Barbati, A.; Garcia-Gonzalo, J.; Seidl, R.; Delzon, S.; Corona, P.; Kolström, M. Climate change impacts, adaptive capacity, and vulnerability of european forest ecosystems. For. Ecol. Manag. 2010, 259, 698–709. [Google Scholar] [CrossRef]
  31. Swidrak, I.; Schuster, R.; Oberhuber, W. Comparing growth phenology of co-occurring deciduous and evergreen conifers exposed to drought. Flora-Morphol. Distrib. Funct. Ecol. Plants 2013, 208, 609–617. [Google Scholar] [CrossRef] [Green Version]
  32. Weber, P.; Bugmann, H.; Rigling, A. Radial growth responses to drought of pinus sylvestris and quercus pubescens in an inner-alpine dry valley. J. Veg. Sci. 2007, 18, 777–792. [Google Scholar] [CrossRef]
  33. Klos, R.J.; Wang, G.G.; Bauerle, W.L.; Rieck, J.R. Drought impact on forest growth and mortality in the southeast USA: An analysis using forest health and monitoring data. Ecol. Appl. 2009, 19, 699–708. [Google Scholar] [CrossRef] [PubMed]
  34. Coops, N.C.; Waring, R.H. Estimating the vulnerability of fifteen tree species under changing climate in northwest north america. Ecol. Model. 2011, 222, 2119–2129. [Google Scholar] [CrossRef]
  35. Ogaya, R.; Peñuelas, J. Species-specific drought effects on flower and fruit production in a mediterranean holm oak forest. Forestry 2007, 80, 351–357. [Google Scholar] [CrossRef]
  36. Arend, M.; Kuster, T.; Günthardt-Goerg, M.S.; Dobbertin, M. Provenance-specific growth responses to drought and air warming in three european oak species (Quercus robur, Q. Petraea and Q. Pubescens). Tree Physiol. 2011, 31, 287–297. [Google Scholar] [CrossRef] [PubMed]
  37. Montserrat-Marti, G.; Camarero, J.J.; Palacio, S.; Pérez-Rontomé, C.; Milla, R.; Albuixech, J.; Maestro, M. Summer-drought constrains the phenology and growth of two coexisting mediterranean oaks with contrasting leaf habit: Implications for their persistence and reproduction. Trees 2009, 23, 787–799. [Google Scholar] [CrossRef] [Green Version]
  38. Kuster, T.M.; Dobbertin, M.; Günthardt-Goerg, M.S.; Schaub, M.; Arend, M. A phenological timetable of oak growth under experimental drought and air warming. PLoS ONE 2014, 9, e89724. [Google Scholar] [CrossRef] [PubMed]
  39. Maseyk, K.; Grünzweig, J.M.; Rotenberg, E.; Yakir, D. Respiration acclimation contributes to high carbon-use efficiency in a seasonally dry pine forest. Glob. Chang. Biol. 2008, 14, 1553–1567. [Google Scholar] [CrossRef]
  40. Arend, M.; Sever, K.; Pflug, E.; Gessler, A.; Schaub, M. Seasonal photosynthetic response of european beech to severe summer drought: Limitation, recovery and post-drought stimulation. Agric. For. Meteorol. 2016, 220, 83–89. [Google Scholar] [CrossRef]
  41. Peters, M.P.; Iverson, L.R.; Matthews, S.N. Long-term droughtiness and drought tolerance of eastern us forests over five decades. For. Ecol. Manag. 2015, 345, 56–64. [Google Scholar] [CrossRef]
  42. Wells, N.; Goddard, S.; Hayes, M.J. A self-calibrating palmer drought severity index. J. Clim. 2004, 17, 2335–2351. [Google Scholar] [CrossRef]
  43. Rohli, R.V.; Bushra, N.; Lam, N.S.; Zou, L.; Mihunov, V.; Reams, M.A.; Argote, J.E. Drought indices as drought predictors in the south-central USA. Nat. Hazards 2016, 83, 1567–1582. [Google Scholar] [CrossRef]
  44. Dai, A. Increasing drought under global warming in observations and models. Nat. Clim. Chang. 2013, 3, 52. [Google Scholar] [CrossRef]
  45. Melaas, E.K.; Sulla-Menashe, D.; Gray, J.M.; Black, T.A.; Morin, T.H.; Richardson, A.D.; Friedl, M.A. Multisite analysis of land surface phenology in north american temperate and boreal deciduous forests from landsat. Remote Sens. Environ. 2016, 186, 452–464. [Google Scholar] [CrossRef]
  46. Goward, S.N.; Dye, D.; Kerber, A.; Kalb, V. Comparison of north and south american biomes from avhrr observations. Geocarto Int. 1987, 2, 27–39. [Google Scholar] [CrossRef]
  47. Beck, P.S.; Juday, G.P.; Alix, C.; Barber, V.A.; Winslow, S.E.; Sousa, E.E.; Heiser, P.; Herriges, J.D.; Goetz, S.J. Changes in forest productivity across alaska consistent with biome shift. Ecol. Lett. 2011, 14, 373–379. [Google Scholar] [CrossRef] [PubMed]
  48. Nigh, T.A.; Schroeder, W.A. Atlas of Missouri Ecoregions; Missouri Department of Conservation: Jefferson City, MO, USA, 2002.
  49. McNab, W.H.; Avers, P.E. Ecological Subregions of the United States, Section Descriptions; Food and Agriculture Organization of the United Nations: Rome, Italy, 1994. [Google Scholar]
  50. Jones, P.; Harris, I. CRU TS3.25: Climatic Research Unit (CRU) Time-Series (TS) Version 3.25 of High-Resolution Gridded Data of Month-by-month Variation in Climate (Jan. 1901–Dec. 2016). Available online: http://data.ceda.ac.uk/badc/cru/data/cru_ts/cru_ts_3.25/ (accessed on 21 September 2017).
  51. Schrier, G.; Barichivich, J.; Briffa, K.; Jones, P. A scpdsi-based global data set of dry and wet spells for 1901–2009. J. Geophys. Res. Atmos. 2013, 118, 4025–4048. [Google Scholar] [CrossRef]
  52. Homer, C.; Dewitz, J.; Yang, L.; Jin, S.; Danielson, P.; Xian, G.; Megown, K. Completion of the 2011 National Land Cover Database for the conterminous United States–representing a decade of land cover change information. Photogramm. Eng. Remote Sens. 2015, 81, 345–354. [Google Scholar]
  53. Didan, K. MOD13Q1 MODIS/Terra Vegetation Indices 16-Day L3 Global 250m SIN Grid. Available online: https://lpdaac.usgs.gov/node/844 (accessed on 30 September 2016).
  54. Bjornsson, H.; Venegas, S. A Manual for EOF and SVD Analyses of Climatic Data; CCGCR Report; McGill University: Montreal, QC, Canada, 1997; Volume 97, pp. 112–134. [Google Scholar]
  55. Liu, X.; Wang, S.; Zhou, Y.; Wang, F.; Li, W.; Liu, W. Regionalization and spatiotemporal variation of drought in china based on standardized precipitation evapotranspiration index (1961–2013). Adv. Meteorol. 2015, 2015, 950262. [Google Scholar] [CrossRef]
  56. Jönsson, A.M.; Eklundh, L.; Hellström, M.; Bärring, L.; Jönsson, P. Annual changes in modis vegetation indices of swedish coniferous forests in relation to snow dynamics and tree phenology. Remote Sens. Environ. 2010, 114, 2719–2730. [Google Scholar] [CrossRef]
  57. Jönsson, A.M.; Schroeder, L.M.; Lagergren, F.; Anderbrant, O.; Smith, B. Guess the impact of ips typographus—An ecosystem modelling approach for simulating spruce bark beetle outbreaks. Agric. For. Meteorol. 2012, 166, 188–200. [Google Scholar] [CrossRef]
  58. Ivits, E.; Cherlet, M.; Sommer, S.; Mehl, W. Addressing the complexity in non-linear evolution of vegetation phenological change with time-series of remote sensing images. Ecol. Indic. 2013, 26, 49–60. [Google Scholar] [CrossRef]
  59. Husson, F.; Lê, S.; Pagès, J. Exploratory Multivariate Analysis by Example Using R; Chapman and Hall/CRC: Boca Raton, FL, USA, 2017. [Google Scholar]
  60. Wang, C.; He, H.S.; Kabrick, J.M. A remote sensing-assisted risk rating study to predict oak decline and recovery in the missouri ozark highlands, USA. GIScience Remote Sens. 2008, 45, 406–425. [Google Scholar] [CrossRef]
  61. Seco, R.; Karl, T.; Guenther, A.; Hosman, K.P.; Pallardy, S.G.; Gu, L.; Geron, C.; Harley, P.; Kim, S. Ecosystem-scale volatile organic compound fluxes during an extreme drought in a broadleaf temperate forest of the missouri ozarks (central USA). Glob. Chang. Biol. 2015, 21, 3657–3674. [Google Scholar] [CrossRef] [PubMed]
  62. Yang, B.; Pallardy, S.G.; Meyers, T.P.; GU, L.H.; Hanson, P.J.; Wullschleger, S.D.; Heuer, M.; Hosman, K.P.; Riggs, J.S.; Sluss, D.W. Environmental controls on water use efficiency during severe drought in an ozark forest in missouri, USA. Glob. Chang. Biol. 2010, 16, 2252–2271. [Google Scholar] [CrossRef]
  63. Fan, Z.; Fan, X.; Crosby, M.K.; Moser, W.K.; He, H.; Spetich, M.A.; Shifley, S.R. Spatio-temporal trends of oak decline and mortality under periodic regional drought in the ozark highlands of arkansas and missouri. Forests 2012, 3, 614–631. [Google Scholar] [CrossRef]
  64. Dunn, A.L.; Barford, C.C.; Wofsy, S.C.; Goulden, M.L.; Daube, B.C. A long-term record of carbon exchange in a boreal black spruce forest: Means, responses to interannual variability, and decadal trends. Glob. Chang. Biol. 2007, 13, 577–590. [Google Scholar] [CrossRef]
  65. LeBlanc, D.C. Interactive effects of acidic deposition, drought, and insect attack on oak populations in the midwestern united states. Can. J. For. Res. 1998, 28, 1184–1197. [Google Scholar] [CrossRef]
  66. Ogaya, R.; Peñuelas, J. Tree growth, mortality, and above-ground biomass accumulation in a holm oak forest under a five-year experimental field drought. Plant Ecol. 2007, 189, 291–299. [Google Scholar] [CrossRef]
  67. Hinckley, T.; Dougherty, P.; Lassoie, J.; Roberts, J.; Teskey, R. A severe drought: Impact on tree growth, phenology, net photosynthetic rate and water relations. Am. Midl. Nat. 1979, 307–316. [Google Scholar] [CrossRef]
  68. Seneviratne, S.I. Climate science: Historical drought trends revisited. Nature 2012, 491, 338–339. [Google Scholar] [CrossRef] [PubMed]
  69. Buitenwerf, R.; Rose, L.; Higgins, S.I. Three decades of multi-dimensional change in global leaf phenology. Nat. Clim. Chang. 2015, 5, 364–368. [Google Scholar] [CrossRef]
  70. Aguadé, D.; Poyatos, R.; Rosas, T.; Martínez-Vilalta, J. Comparative drought responses of quercus ilex l. and pinus sylvestris l. In a montane forest undergoing a vegetation shift. Forests 2015, 6, 2505–2529. [Google Scholar] [CrossRef]
  71. Pretzsch, H.; Schütze, G.; Uhl, E. Resistance of european tree species to drought stress in mixed versus pure forests: Evidence of stress release by inter-specific facilitation. Plant Biol. 2013, 15, 483–495. [Google Scholar] [CrossRef] [PubMed]
  72. Morin, X.; Fahse, L.; Scherer-Lorenzen, M.; Bugmann, H. Tree species richness promotes productivity in temperate forests through strong complementarity between species. Ecol. Lett. 2011, 14, 1211–1219. [Google Scholar] [CrossRef] [PubMed]
  73. Hommel, R.; Siegwolf, R.; Zavadlav, S.; Arend, M.; Schaub, M.; Galiano, L.; Haeni, M.; Kayler, Z.E.; Gessler, A. Impact of interspecific competition and drought on the allocation of new assimilates in trees. Plant Biol. 2016, 18, 785–796. [Google Scholar] [CrossRef] [PubMed]
  74. Ruehr, N.K.; Offermann, C.A.; Gessler, A.; Winkler, J.B.; Ferrio, J.P.; Buchmann, N.; Barnard, R.L. Drought effects on allocation of recent carbon: From beech leaves to soil CO2 efflux. New Phytol. 2009, 184, 950–961. [Google Scholar] [CrossRef] [PubMed]
  75. Ganguly, S.; Friedl, M.A.; Tan, B.; Zhang, X.; Verma, M. Land surface phenology from modis: Characterization of the collection 5 global land cover dynamics product. Remote Sens. Environ. 2010, 114, 1805–1816. [Google Scholar] [CrossRef]
  76. Lewińska, K.E.; Ivits, E.; Schardt, M.; Zebisch, M. Alpine forest drought monitoring in south tyrol: PCA based synergy between scPDSI data and modis derived NDVI and NDII7 time series. Remote Sens. 2016, 8, 639. [Google Scholar] [CrossRef]
Figure 1. Location of the study area.
Forests 09 00377 g001
Figure 2. Flow diagram of the determination of spatial-temporal patterns of droughts in the period 2000–2015. SL and NDVIlin are the abbreviations of growing season length and NDVI large integral (a forest productivity proxy), respectively. Dashed rectangles indicate the major outputs from major data processing procedures.
Forests 09 00377 g002
Figure 3. The temporal pattern of the first six PCs estimated from the original monthly self-calibrating Palmer Drought Severity Index (scPDSI) from 2000 to 2015 (af). High component score indicates more wet conditions in that year while negative values indicate dry conditions occurred. See the correlated spatial pattern of each PCs in supplement materials.
Forests 09 00377 g003
Figure 4. Four drought zones were extracted by Isodata procedure from the first six PCs.
Forests 09 00377 g004
Figure 5. Plots correspond to the spatial average scPDSI (±SD) for each drought zone, estimated from the original monthly scPDSI data (ad). Zero indicates a normal year, and negative number indicate dry conditions. We can consider a severe or extreme drought occurred when the value ≤−3.
Forests 09 00377 g005
Figure 6. Correspondence Analysis (CA) results are present in bi-plots based on first two dimensions for four DZs (ad). The dash lines are the first two dimensions. The two dimensions represented the two principle components among all variables. The percentage of the dimensions explained the variance in the data. The association was measured by the angle between the arrows for forest types and NDVIlin/SL combinations for each DZs. The acuter the angle is, the stronger the association is. SL and PD are the abbreviation for growing season length and productivity respectively. +, 0, and - sign indicate “increase”, “no change”, and “decrease”.
Forests 09 00377 g006
Table 1. The classification scheme of forests in this study. This classification system is modified from the Anderson Land Cover Classification System and is based on species composition in western Central Hardwood Forests.
Value in NLCDForest TypesDescriptions
41Oak forestThese areas are dominated by oak species.
>42>Pine forest>These areas are dominated by pine species.
43Mixed oak-pine forestThese areas are co-dominated by oak and pine species.
11, 12, 21–24, 31, 51, 52, 71–74, 81, 82, 90, 95OthersWater, urban or built-up land, agriculture, barren, tundra, wetland, rangeland, perennial snow or ice.
Table 2. The number of samples in each drought zone.
Drought Zone# of Samples in Oak Forest# of Samples in Pine Forest# of Samples in Mixed ForestsTotal
DZ14745583612
DZ24586573596
DZ34457181597
DZ45212111553
Table 3. Average SL and NDVIlin of each drought event in each drought zone.
Drought Zone
(Avg. scPDSI for 2000–2015)
Type of ForestPhenology ParametersDrought Year (avg. scPDSI for the Drought Event)
Minor drought zone
(1.05)
2000 (−0.92)2001 (−0.79)2007 (−0.48)2012 (−0.52)
Oak forestSL (days)190.9 d197.2 c208.9 a201.5 b
NDVIlin117,012.1 c119,454.3 b123,368.5 a119,560.8 b
Pine forestSL (days)190.0 b196.3 b210.1 a201.9 a
NDVIlin117,133.0 b119,557.0 a124,128.0 a119,103.0 a
Mixed forestSL (days)187.8 c194.8 c208.5 a199.9 b
NDVIlin116,292.8 b118,645.2 b123,500.6 a119,462.3 b
Cyclic drought zone
(0.60)
2000 (−1.20)2001 (−0.77)2005 (−0.29)2012 (−1.01)
Oak forestSL (days)195.4 c201.1 b203.6 a200.2 b
NDVIlin122,278.9 b124,853.4 a124,742.4 a117,687.1 c
Pine forestSL (days)194.3 b199.9 a204.0 a200.0 a
NDVIlin121,145.0 ab123,408.0 a125,588.0 a118,018.0 c
Mixed forestSL (days)195.0 c198.3 b204.8 a201.0 b
NDVIlin121,145.3 a123,408.3 a125,588.0 a118,017.9 b
Moderate drought zone
(0.95)
2000 (−1.08)2001 (−0.12)2005 (−0.22)2006 (−0.55)2007 (−0.43)
Oak forestSL (days)207.7 c208.6 b202.4 d215.3a 212.4 b
NDVIlin122,209.1 b122,786.7 b120,134.1 c124,507.9 a124,243.3 a
Pine forestSL (days)206.0 b207.9 b203.9 c216.2 a212.2 a
NDVIlin122,420.0 a123,654.0 a121,759.0 a125,948.0 a125,226.0 a
Mixed forestSL (days)208.2 b209.7 b204.0 c214.3 a214.0 a
NDVIlin123,573 a124,072 a122,588 a125,401 a125,918 a
Sporadic severe drought zone
(−0.12)
2003 (−0.83)2005 (−0.72)2006 (−2.80)2007 (−3.11)2013 (−1.2)
Oak forestSL (days)187.1 d195.1 c199.6 b200.8 b209.3 a
NDVIlin117,956.3 c125,627.6 b127,971.8 a126,930.9 a126,513.8 a
Pine forestSL (days)184.2 c188.3 b190.7 b197.6 b218.9 a
NDVIlin123,085.0 c127,783.0 b129,003.0 b131,911.0 b135,909.0 a
Mixed forestSL (days)183.9 a192.0 a198.4 a199.4 a203.8 a
NDVIlin114,653 a124,281 a124,906 a123,075 a123,527 a
Differences in small-case letters indicate that significant differences exist within each drought year’s SL or NDVIlin at α = 0.05 level. For example, the bold numbers mean: in 2007, the SL of oak forest is 208.9 days which is significantly different from its SL in 2012 (201.5 days). The statistic outputs for ANOVA are listed in Appendix B (Table A1). The normal year values for SL and NDVIlin are presented in Appendix C (Table A2).

