Article

Microbial Taxa and Soil Organic Carbon Accumulation Driven by Tree Roots

1
College of Forestry, Beijing Forestry University, Beijing 100083, China
2
Key Laboratory for Forest Resources and Ecosystem Processes of Beijing, Beijing Forestry University, Beijing 100083, China
*
Author to whom correspondence should be addressed.
Forests 2018, 9(6), 333; https://doi.org/10.3390/f9060333
Submission received: 18 April 2018 / Revised: 4 June 2018 / Accepted: 5 June 2018 / Published: 6 June 2018
(This article belongs to the Collection Forests Carbon Fluxes and Sequestration)

Abstract

:
Rhizosphere microbes in forests are key elements for carbon accumulation in terrestrial ecosystems. To date, little is known on the rhizomicrobial community changes occurring during soil carbon accumulation. Using high-throughput DNA sequencing, we identified the phyla composing the rhizomicrobial communities of Pinus tabuliformis Carr. and Quercus variabilis Blume forests in North China and their abundance. These results were correlated with the soil organic carbon (SOC) accumulation driven by tree roots. Rhizomicrobial community composition and abundance and SOC accumulation varied with tree species, but root presence benefited SOC accumulation significantly. Different phyla played different roles in root-driven carbon accumulation during the succession of a recovery forest ecosystem, but Proteobacteria and Basidiomycota were keystones for root-driven carbon accumulation.

1. Introduction

Carbon (C) input from plants into soil is an important flux in the terrestrial C cycle, and it is crucial not only for C accumulation, but also for the maintenance of soil fertility and ecosystem stability and function [1,2]. Soil organic carbon (SOC) is thought to derive mostly from the decomposition of litter [3]. However, recent studies have found that SOC is mainly derived from roots and from the microbial community around them [4]. Plant-microbe interactions in soil play a central role in terrestrial ecosystem functions and may control up to half of the total carbon dioxide (CO2) released from terrestrial ecosystems at the global scale [5]. Roots can strongly change the turnover of soil organic matter and greatly affect soil C accumulation [6]. While mycorrhizae supply nitrogen and phosphorus to plants, the mycelium transfers a large amount of photosynthetic organic C to the underground [7]. Additionally, the root-microbial system can transfer organic C directly from the plant to the soil carbon pool [8], and the biomass and secretions of microbes are also large sources of SOC [9]. Therefore, studies on root-microbial systems are essential for revealing the mechanisms regulating SOC accumulation.
Forests are the largest C sinks worldwide, accounting for about two-thirds of the total C accumulation in terrestrial ecosystems [10]. Tree roots have the potential to shift underground microbial compositions [11,12,13], and, according to the ecological stoichiometry theory, this change can affect organic matter decomposition and biogeochemical cycling [6,14,15]. Tree species and microbial diversity also affect soil C accumulation in forests [11,16,17]. Thus, changes in the physical, chemical, and biological properties of the soil affected by tree roots have been evaluated in recent studies [17,18,19,20]. However, limitations due to the use of traditional techniques hinder an accurate evaluation of soil microbial taxa, which has greatly delayed our understanding of several core ecosystem processes, such as variations in microbial communities, soil C accumulation, ecosystem succession, and ecosystem functions [20,21]. Identifying and quantifying the relative influence of root-microbial systems in forests remains a challenge for researchers [22]. Thus, there is still a limited understanding of the relationship between soil microbial taxa and soil C accumulation in a changing environment, especially in restored forest ecosystems.
Plant succession is intrinsically linked to the succession of microbes, as these utilize all forms of plant-derived C and are important drivers of plant community productivity and diversity [23]. Root-associated microbes have evolved close links to living plants, albeit being a highly heterogeneous group [24]. Roots are colonized by obligate or facultative microbes, but also by many fungi commonly termed root endophytes, which have a variable and only partially known trophic and functional relationship with plants [25]. Similar to the aboveground biomass of plants, rhizosphere microbes in forests also present a succession from the degraded ecosystem to climax community during the restoration of forest ecosystems [26]. However, microbial succession has received less attention than the successional dynamics of plants [24].
Afforestation, as a type of ecosystem degradation counter measure, can add terrestrial C sink capacity and alleviate atmospheric CO2 accumulation [27]. In the last century, the “Grain for Green” Project conducted nationwide aimed to rehabilitate and recover degraded ecosystems in China. The conversion of cropland to forest offers opportunities to conserve soil and water and improve the microclimate, among other benefits [28]. Pinus tabuliformis Carr. and Quercus variabilis Blume. are two primary conifer and broad leave afforestation species due to their capacity to limit soil erosion, their well-developed root system, and their role in C restoration [29,30]. Although the effects of afforestation on C restoration have been studied in China, the microbial mechanisms of C accumulation following afforestation have not been explored [28]. Therefore, a better understanding of the effects of soil microbial communities on soil C dynamics is fundamental for providing further insight into the microbial mechanisms of C accumulation following afforestation.
Because root-associated microbes are important for SOC accumulation in forest ecosystems, disclosing key microbial taxa for SOC accumulation driven by tree roots is not only helpful for a better understanding of the microbial mechanisms of C accumulation, but it can also improve forest management, degraded ecosystem restoration, and afforestation. In the present study, we estimated variations in microbial communities and SOC accumulation driven by tree roots during the succession from a degraded to climax forest ecosystem using high-throughput DNA sequencing. The current study aimed to reveal the variations occurring in rhizosphere microbial species in restored forest ecosystems and which species benefit rhizosphere SOC accumulation. These results might contribute to future research and the management of forest C accumulation.

2. Materials and Methods

2.1. Experimental Setup and Sampling

This study was conducted at Jiufeng National Forest Park, which is located in Beijing, China (40 ° 3' 36" N, 116° 5' 24" E). Stainless steel boxes (2 × 2 × 10 cm) containing an 800-screen mesh (18 µm) at the top and bottom, to allow soil gas and water to pass through the box without any fine soil particles, were filled with homogeneous control soil (CS) with known soil properties, and roots were passed through the box (Figure S1). The diameters of the selected roots were 2–5 mm. In April 2016, five boxes were set around the middle portion of P. tabuliformis roots growing on five trees in different locations (MPR group), and another five boxes were placed around the tips of the same roots (TPR group). Similarly, five boxes were set around the middle portion of Q. variabilis roots growing on five trees in different locations (MQR group), and another five boxes were placed around the tips of the same roots (TQR group). Five boxes were also set in a post-fire planted forest of P. tabuliformis (FPR group) and five dead P. tabuliformis roots were also placed in boxes (DPR group). Soil samples were also collected from a natural P. tabuliformis forest (NFS). Among the five replicates in each group, four were chosen in the four corners and one was chosen in the middle of the plot (200 × 200 m), respectively. After one year, in April 2017, the boxes were removed and the soil contained in each box was treated as a sample in SOC accumulation and molecular analyses.

2.2. Molecular and Bioinformatics Analyses

Genomic DNA was extracted from 0.5 g fresh soil samples using a PowerSoil DNA Isolation Kit (MoBio Laboratories, Carlsbad, CA, USA), following the manufacturer’s instructions. All extracted DNA samples were stored at −20 °C until PCR amplifications. To assess bacterial and fungal community compositions, we amplified the V3–V4 hypervariable region of the bacterial 16S rRNA gene using the forward primer 338F (5′-ACTCCTACGGGAGGCAGCAG-3′) and the reverse primer 806R (5′-GGACTACHVGGGTWTCTAAT-3′), and the fungal internal transcribed spacer (ITS) region using the forward primer ITS1-F (5′-CTTGGTCATTTAGAGGAAGTAA-3′) and the reverse primer ITS2 (5′-TGCGTTCTTCATCGATGC-3′). These primers (MoBio Laboratories, Carlsbad, CA, USA) contained a set of eight-nucleotide barcode sequences unique to each sample. Amplifications were performed following the procedure described by Taş et al. [31]. Amplicons were pooled and purified using a QIAquick Gel Extraction Kit (Qiagen, Hilden, Germany). The purified PCR products were pooled at equimolar concentrations and paired-end sequenced (2 × 300 bp) on a MiSeq platform (Illumina, San Diego, CA, USA), according to standard protocols.
The raw data obtained were screened, and sequences were removed from consideration if they were shorter than 200 bp, had a low quality score (≤20), contained ambiguous bases, or did not exactly match primer sequences and barcode tags. Unique sequence sets were classified into operational taxonomic units (OTUs) based on the threshold of 97% identity using UCLUST. Chimeric sequences were identified and removed using Usearch. The 16S rRNA sequences were compared to the Silva119 16S rRNA database using UCLUST with a confidence threshold of 97%, and each ITS sequence was compared to sequences within the Unite 7.0 database using UCLUST. The DNA data of five replicates were merged into one for the analyses in each group.

2.3. Calculations and Statistical Analyses

Briefly, after treating soil samples with acid to remove carbonates, these were weighted and C% was analyzed in the Flash EA1112 HT Elemental Analyzer (Thermo Fisher Scientific Inc., Waltham, MA, USA).
According to the experimental design, SOC accumulation (CSSOC) was calculated as:
C S S O C = C R C C S ,
where CR is the SOC of TPR, MPR, TQR, MQR, DPR, or FPR and CCS is the SOC of CS.
The values presented in the figures are means ± standard errors of the means. The unweighted pair group with the arithmetic mean method was used for the hierarchical clustering of OTUs in each group. The QIIME (Quantitative insights into microbial ecology) package for hierarchical clustering with the Bray-Curtis similarity algorithm was used as described by Jiang et al. [32]. Statistical analyses were performed in SPSS 23.0 (IBM Inc., New York, NY, USA).

3. Results

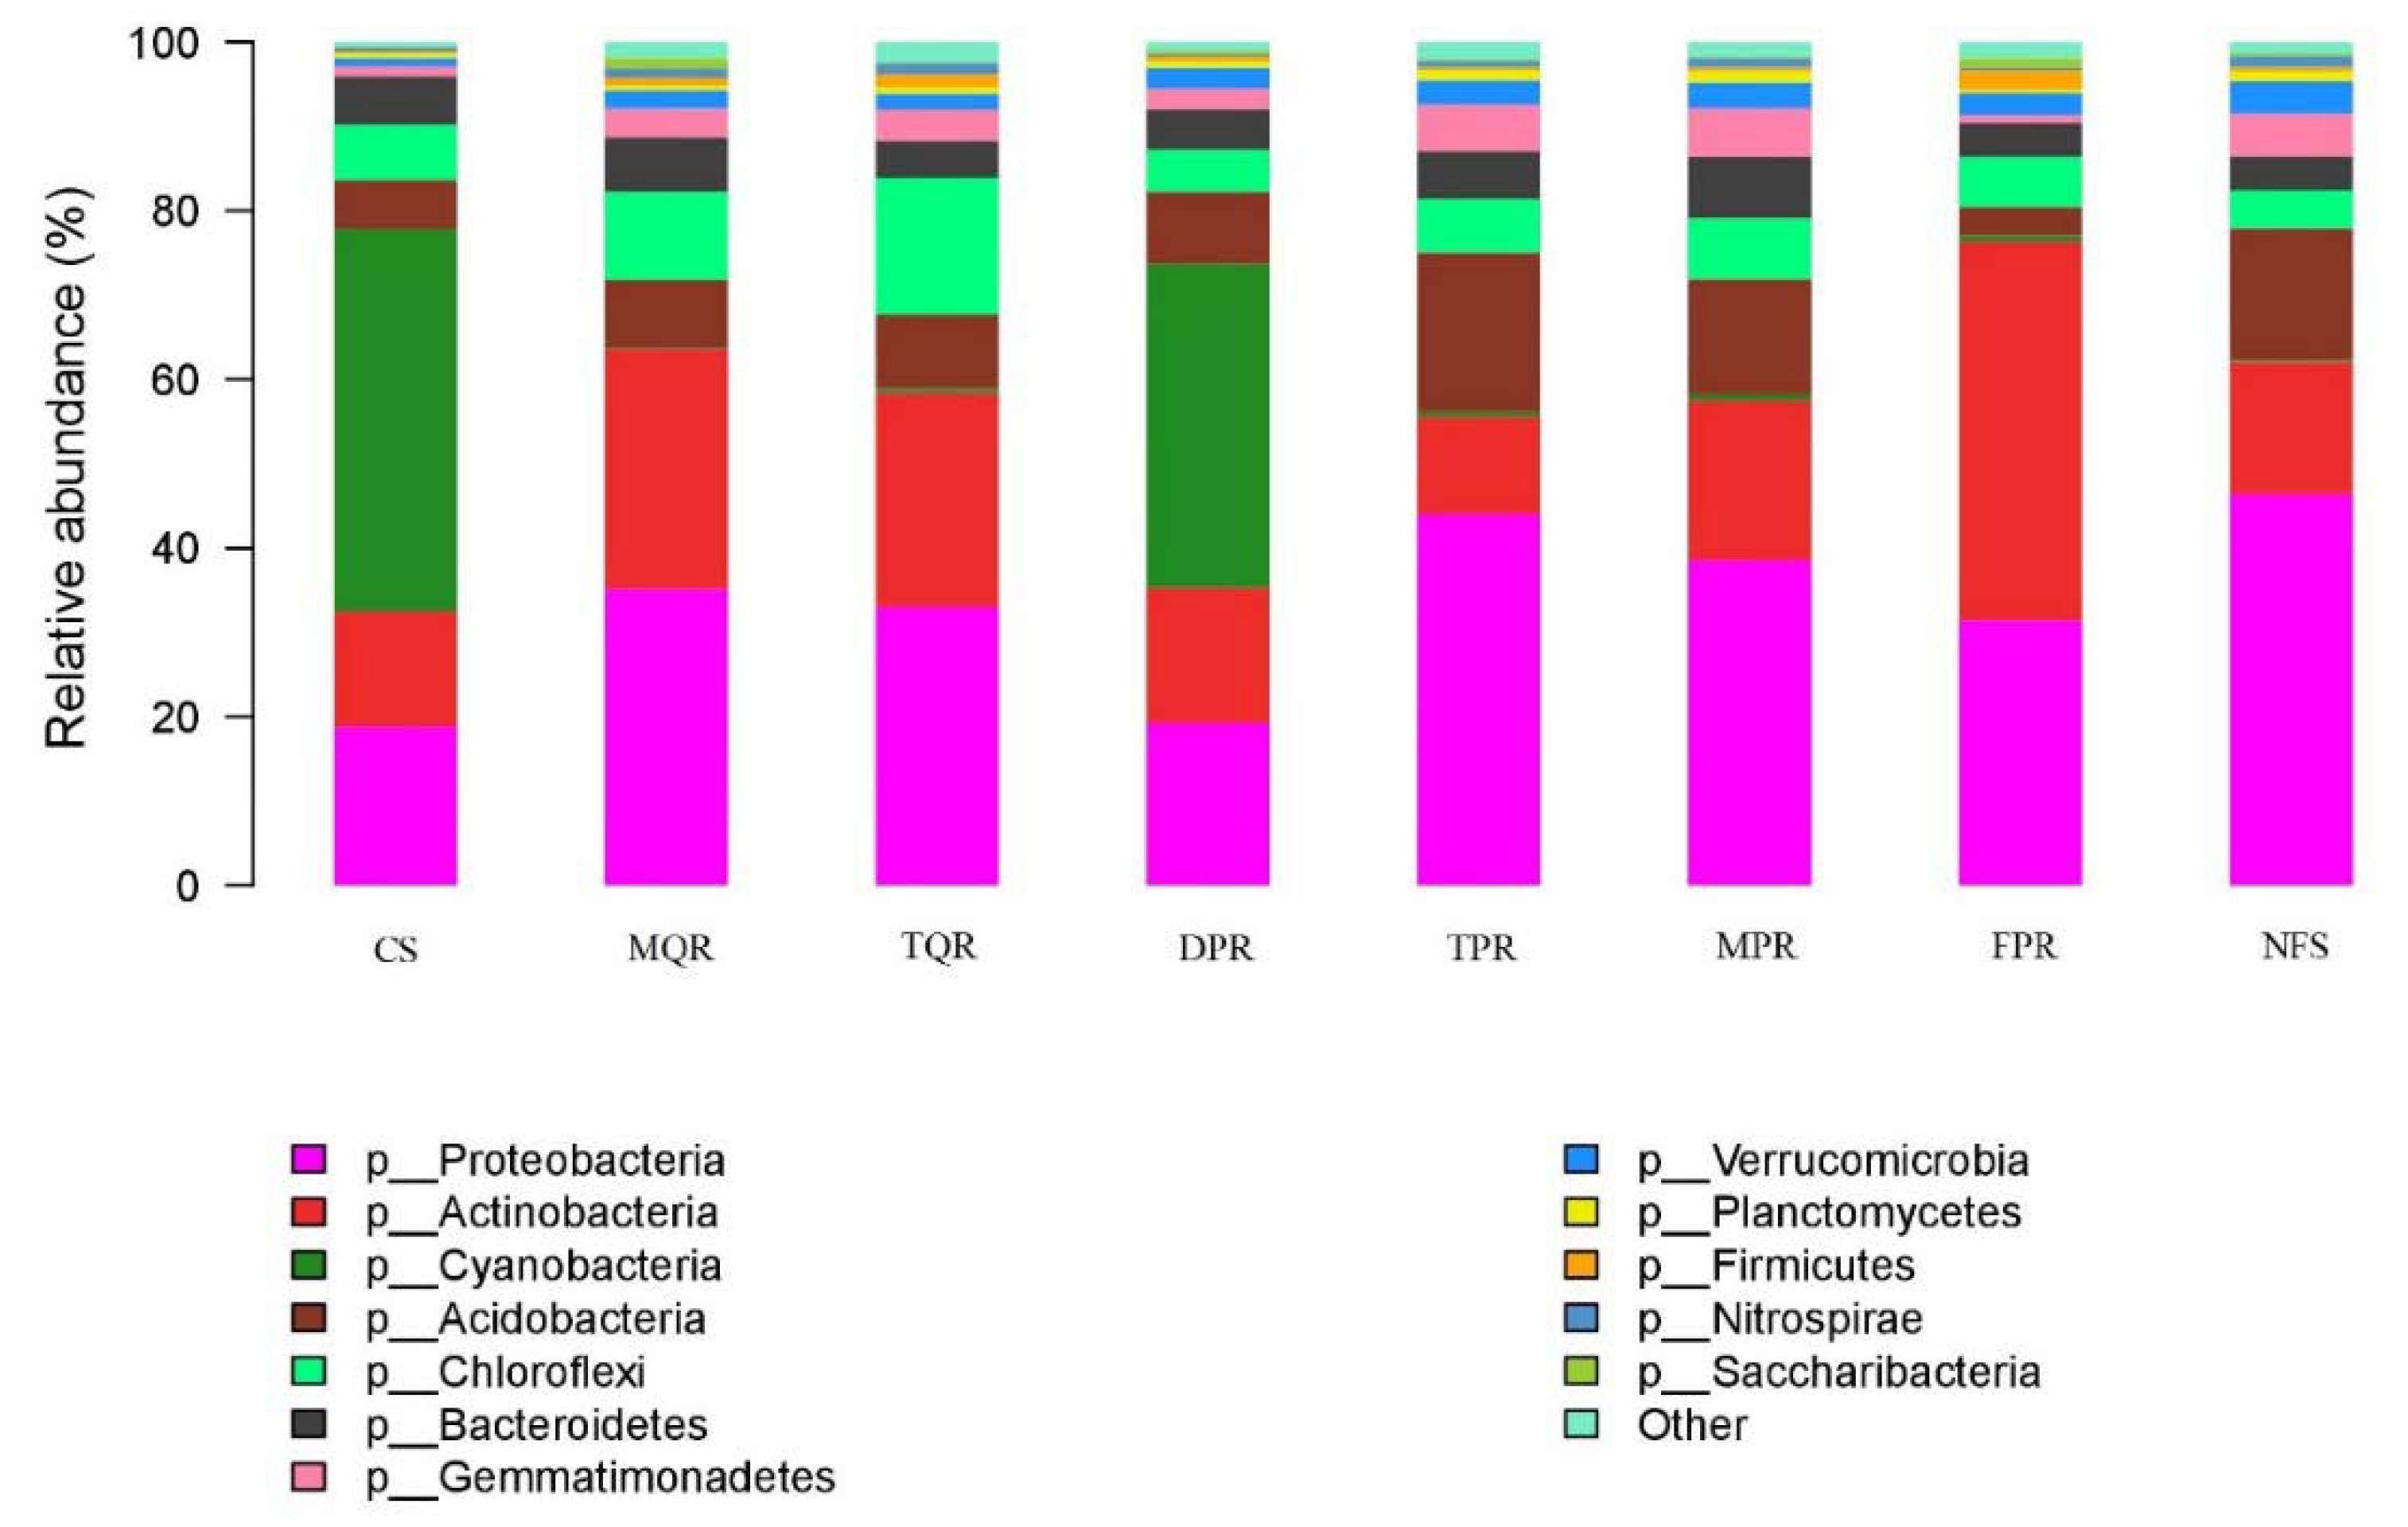
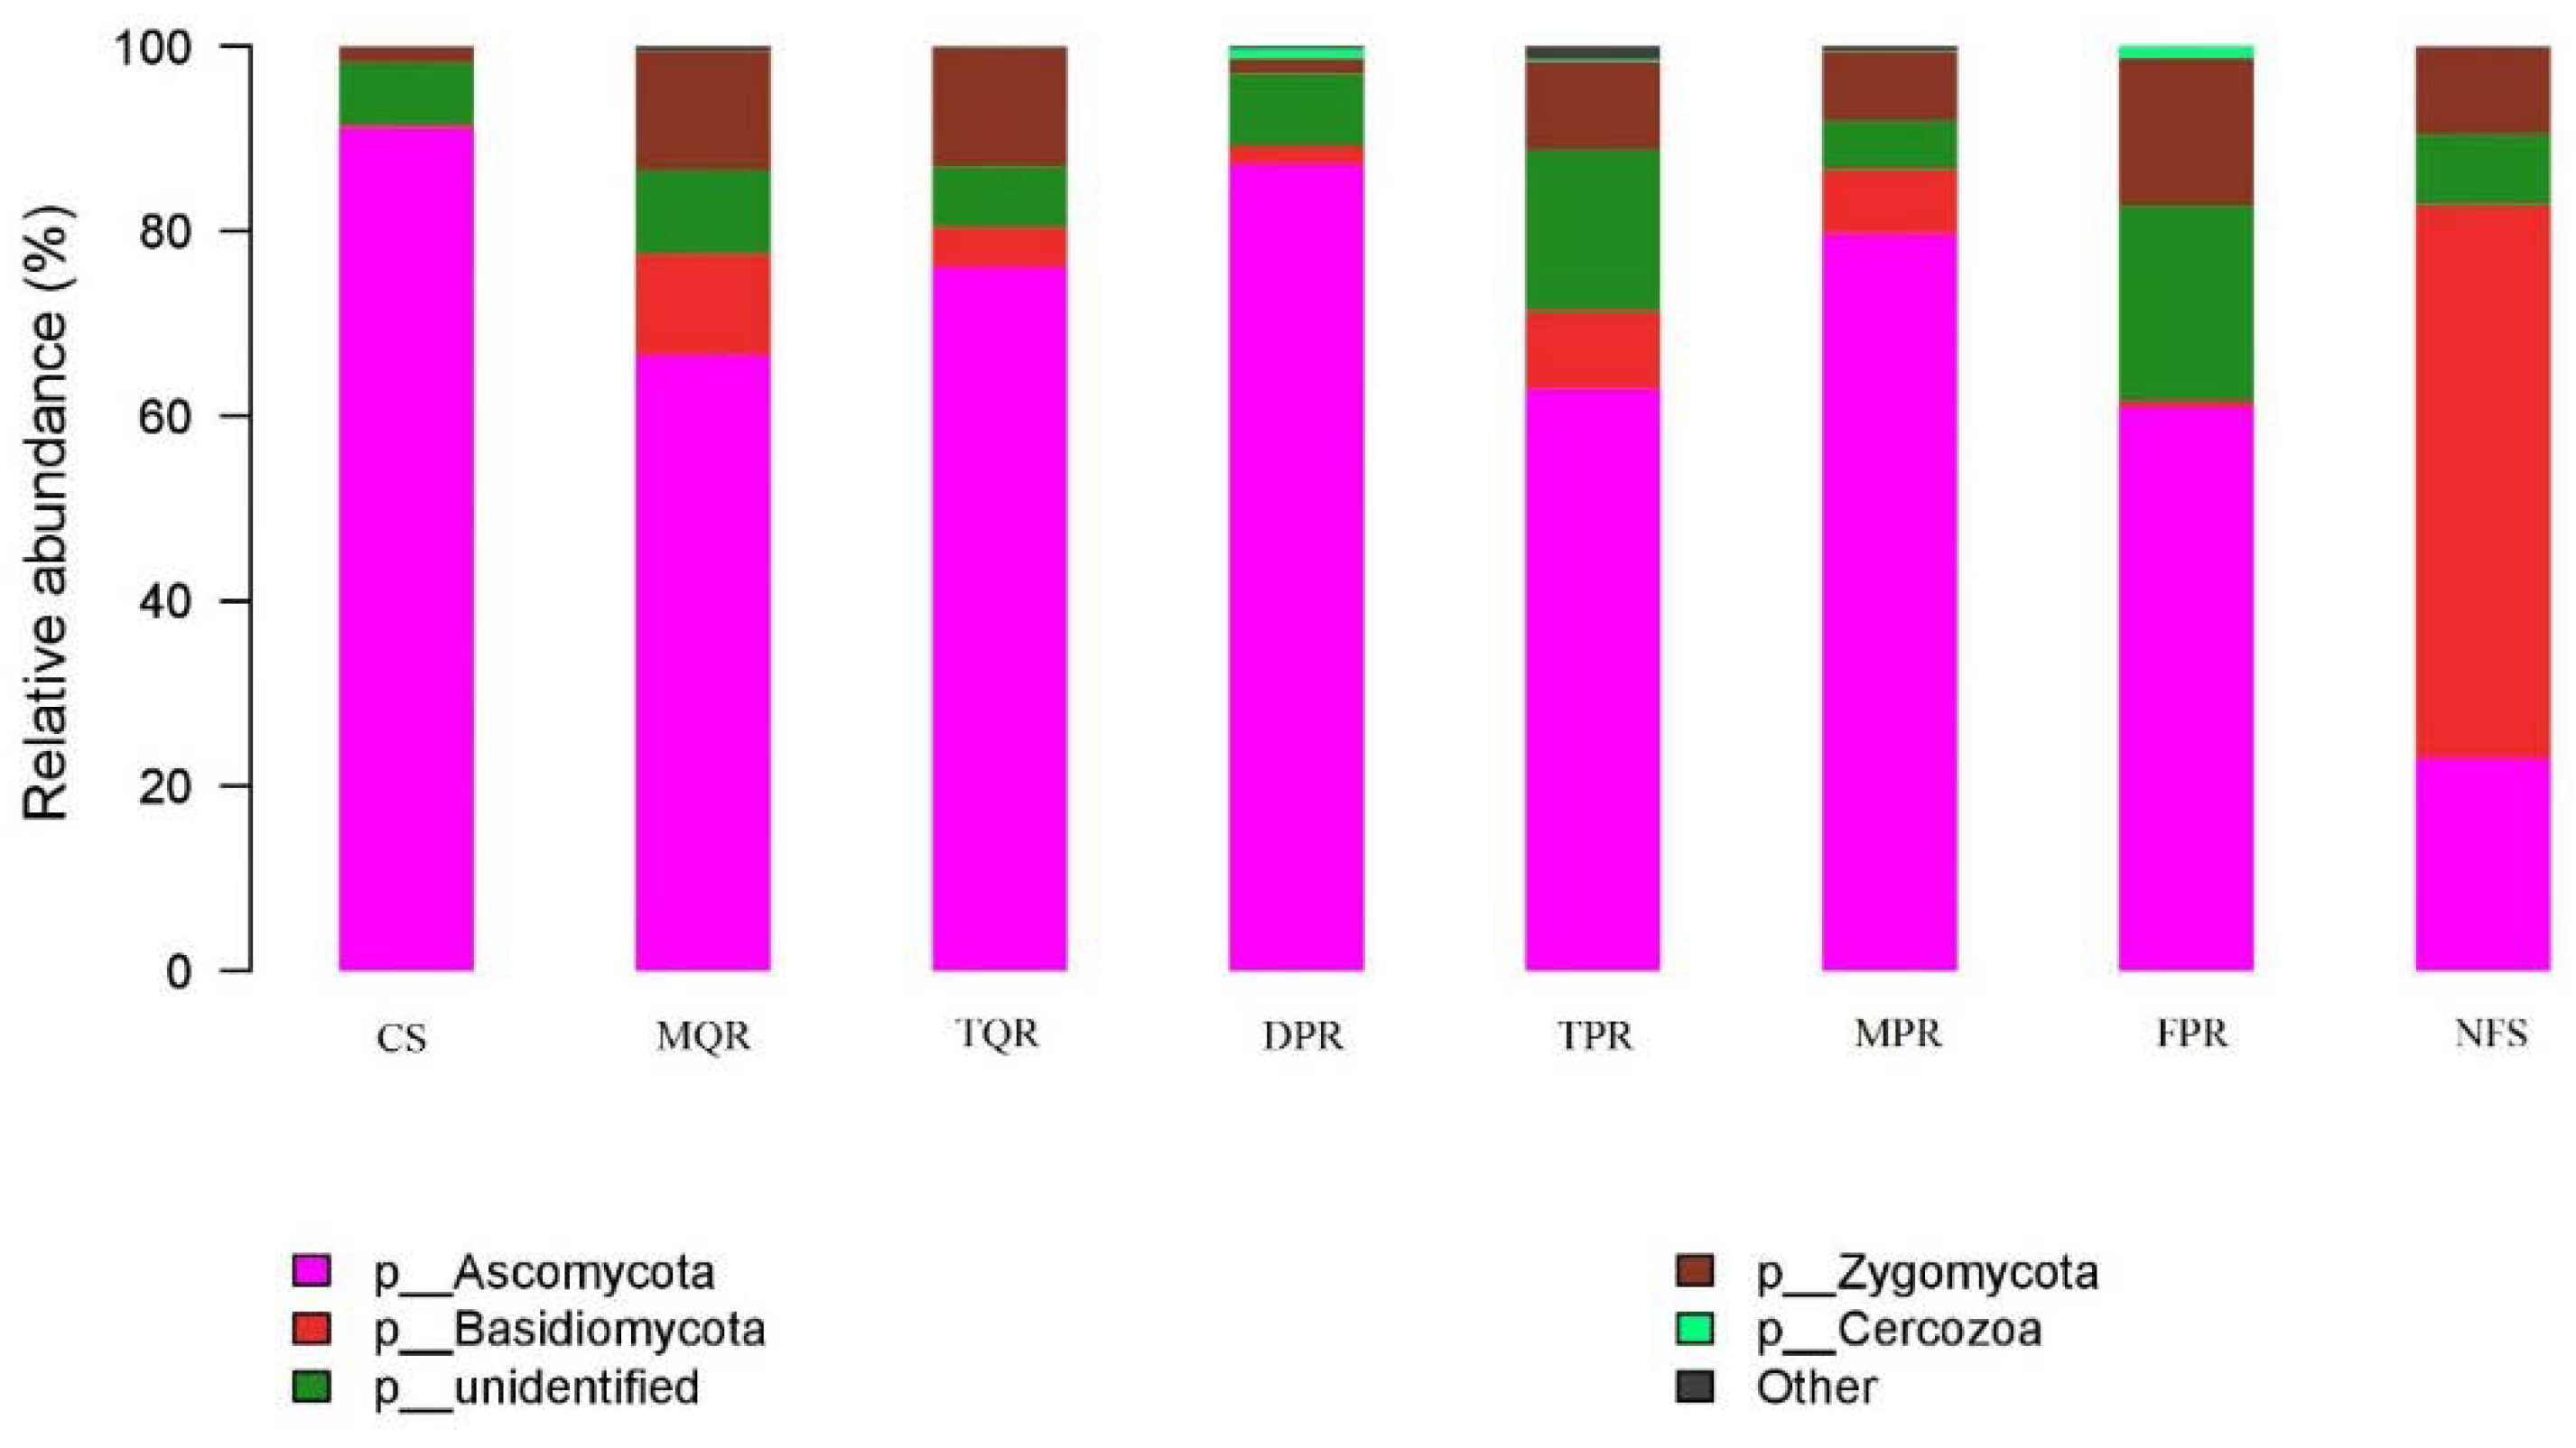
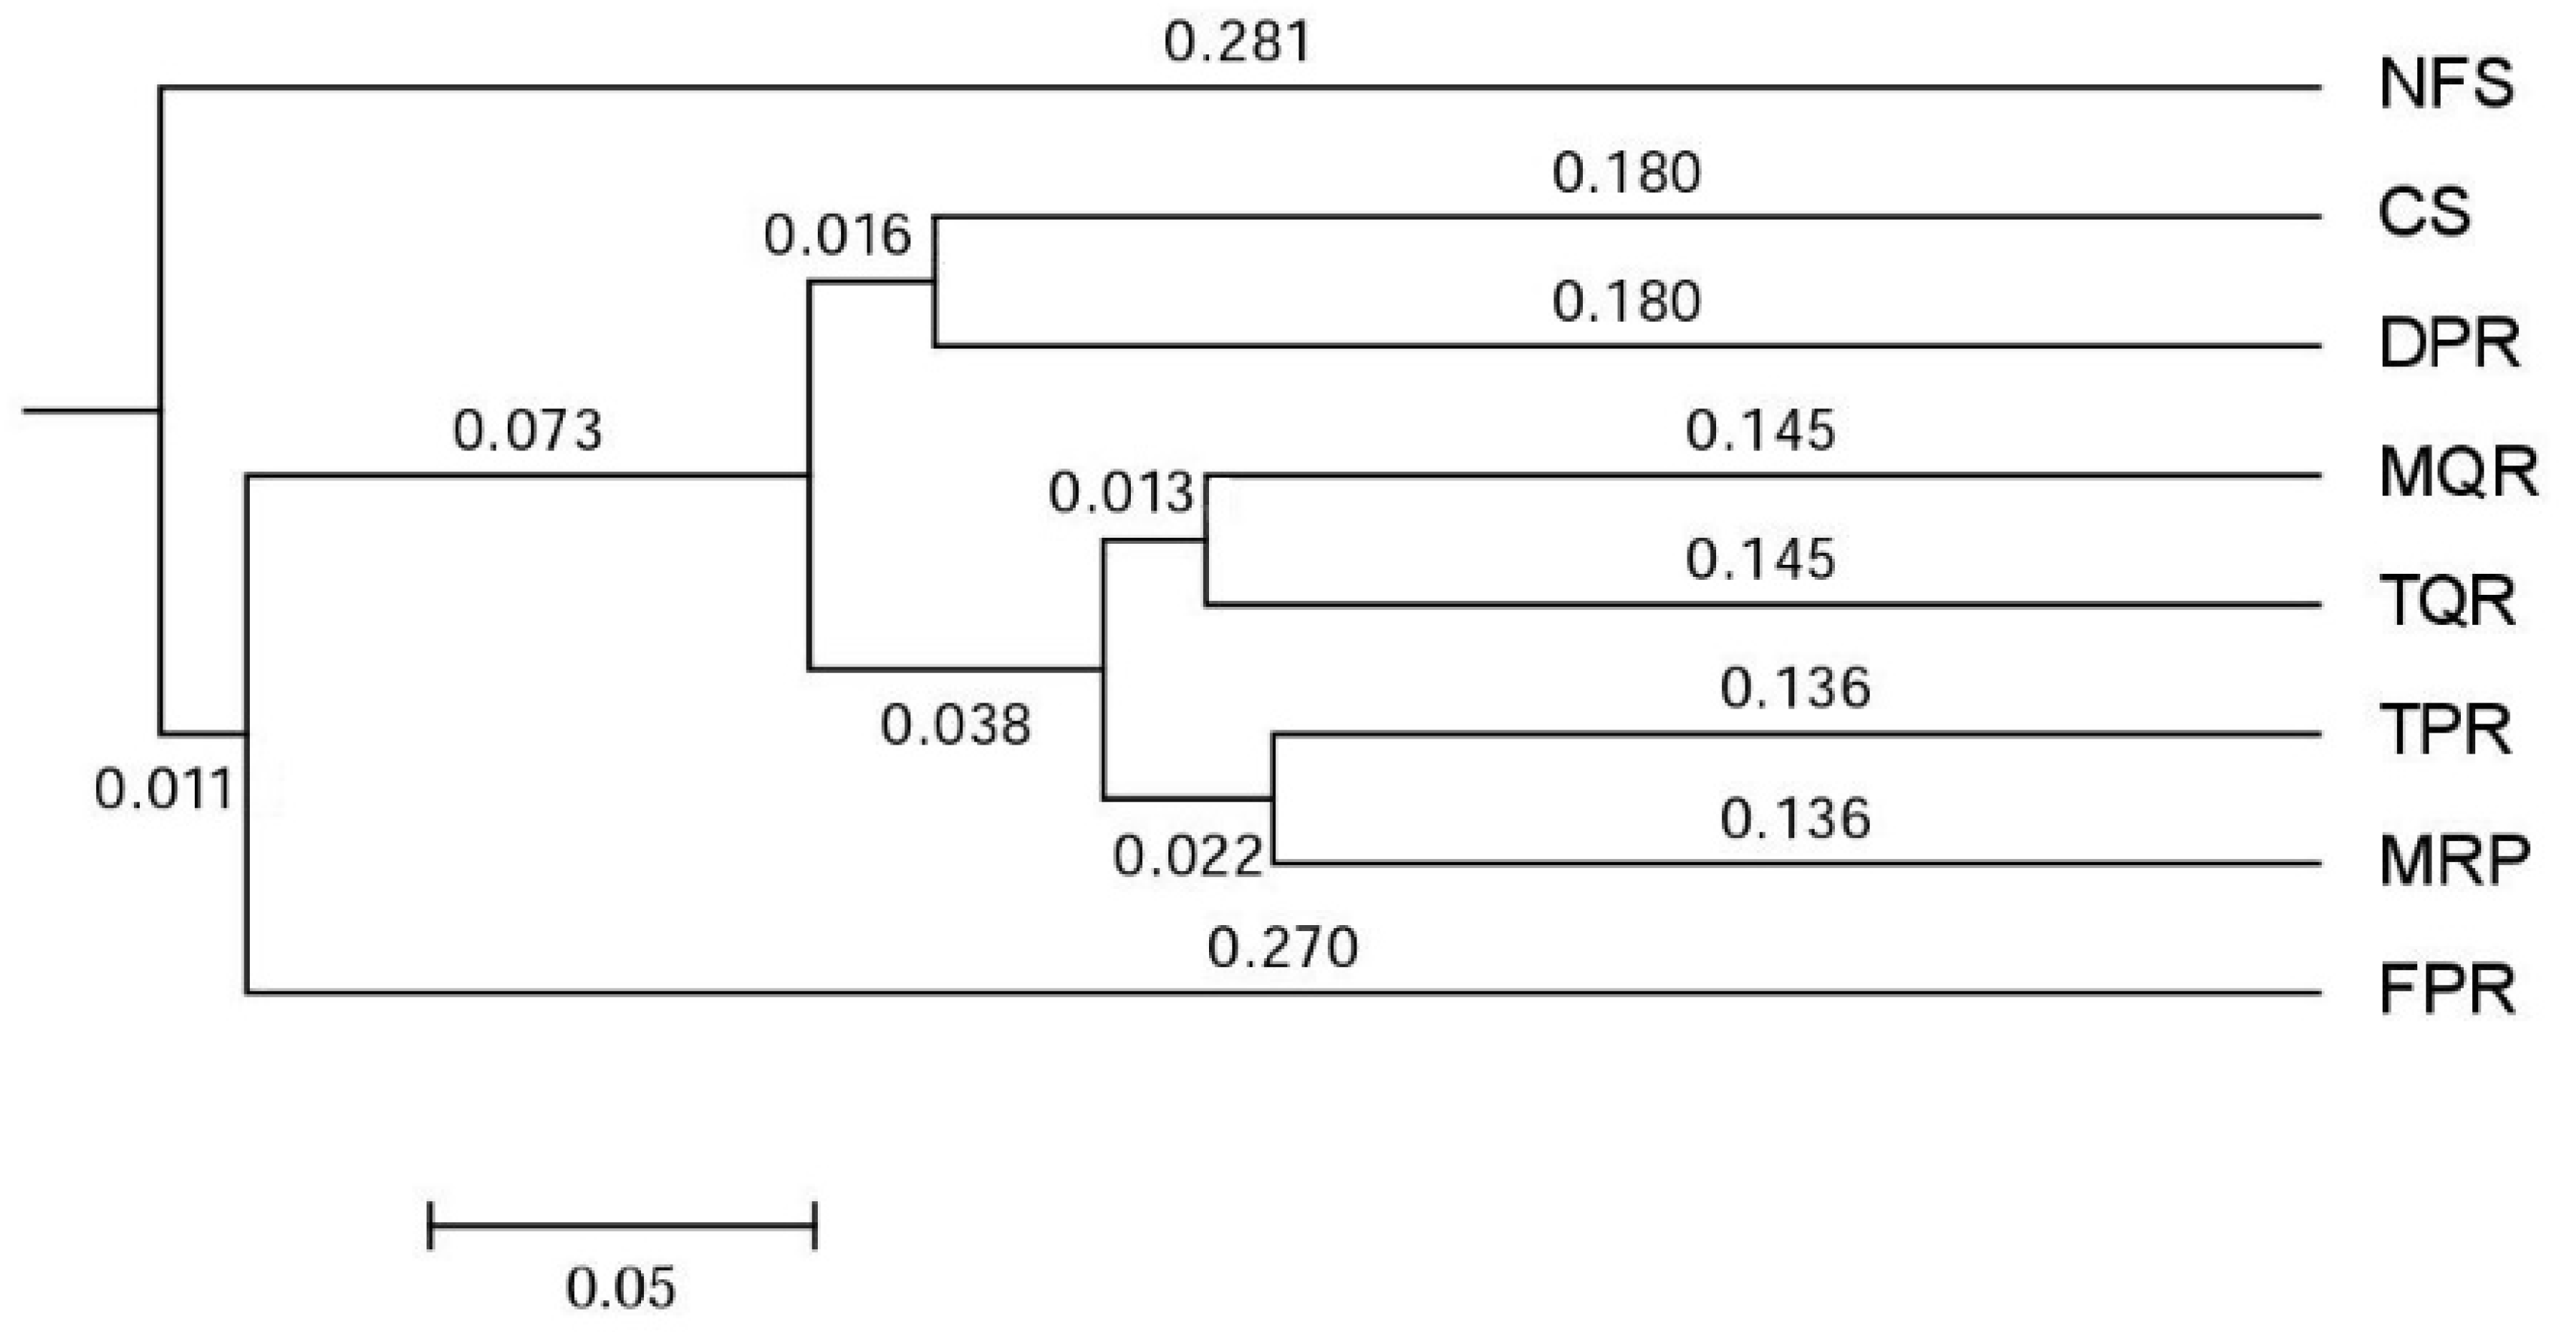
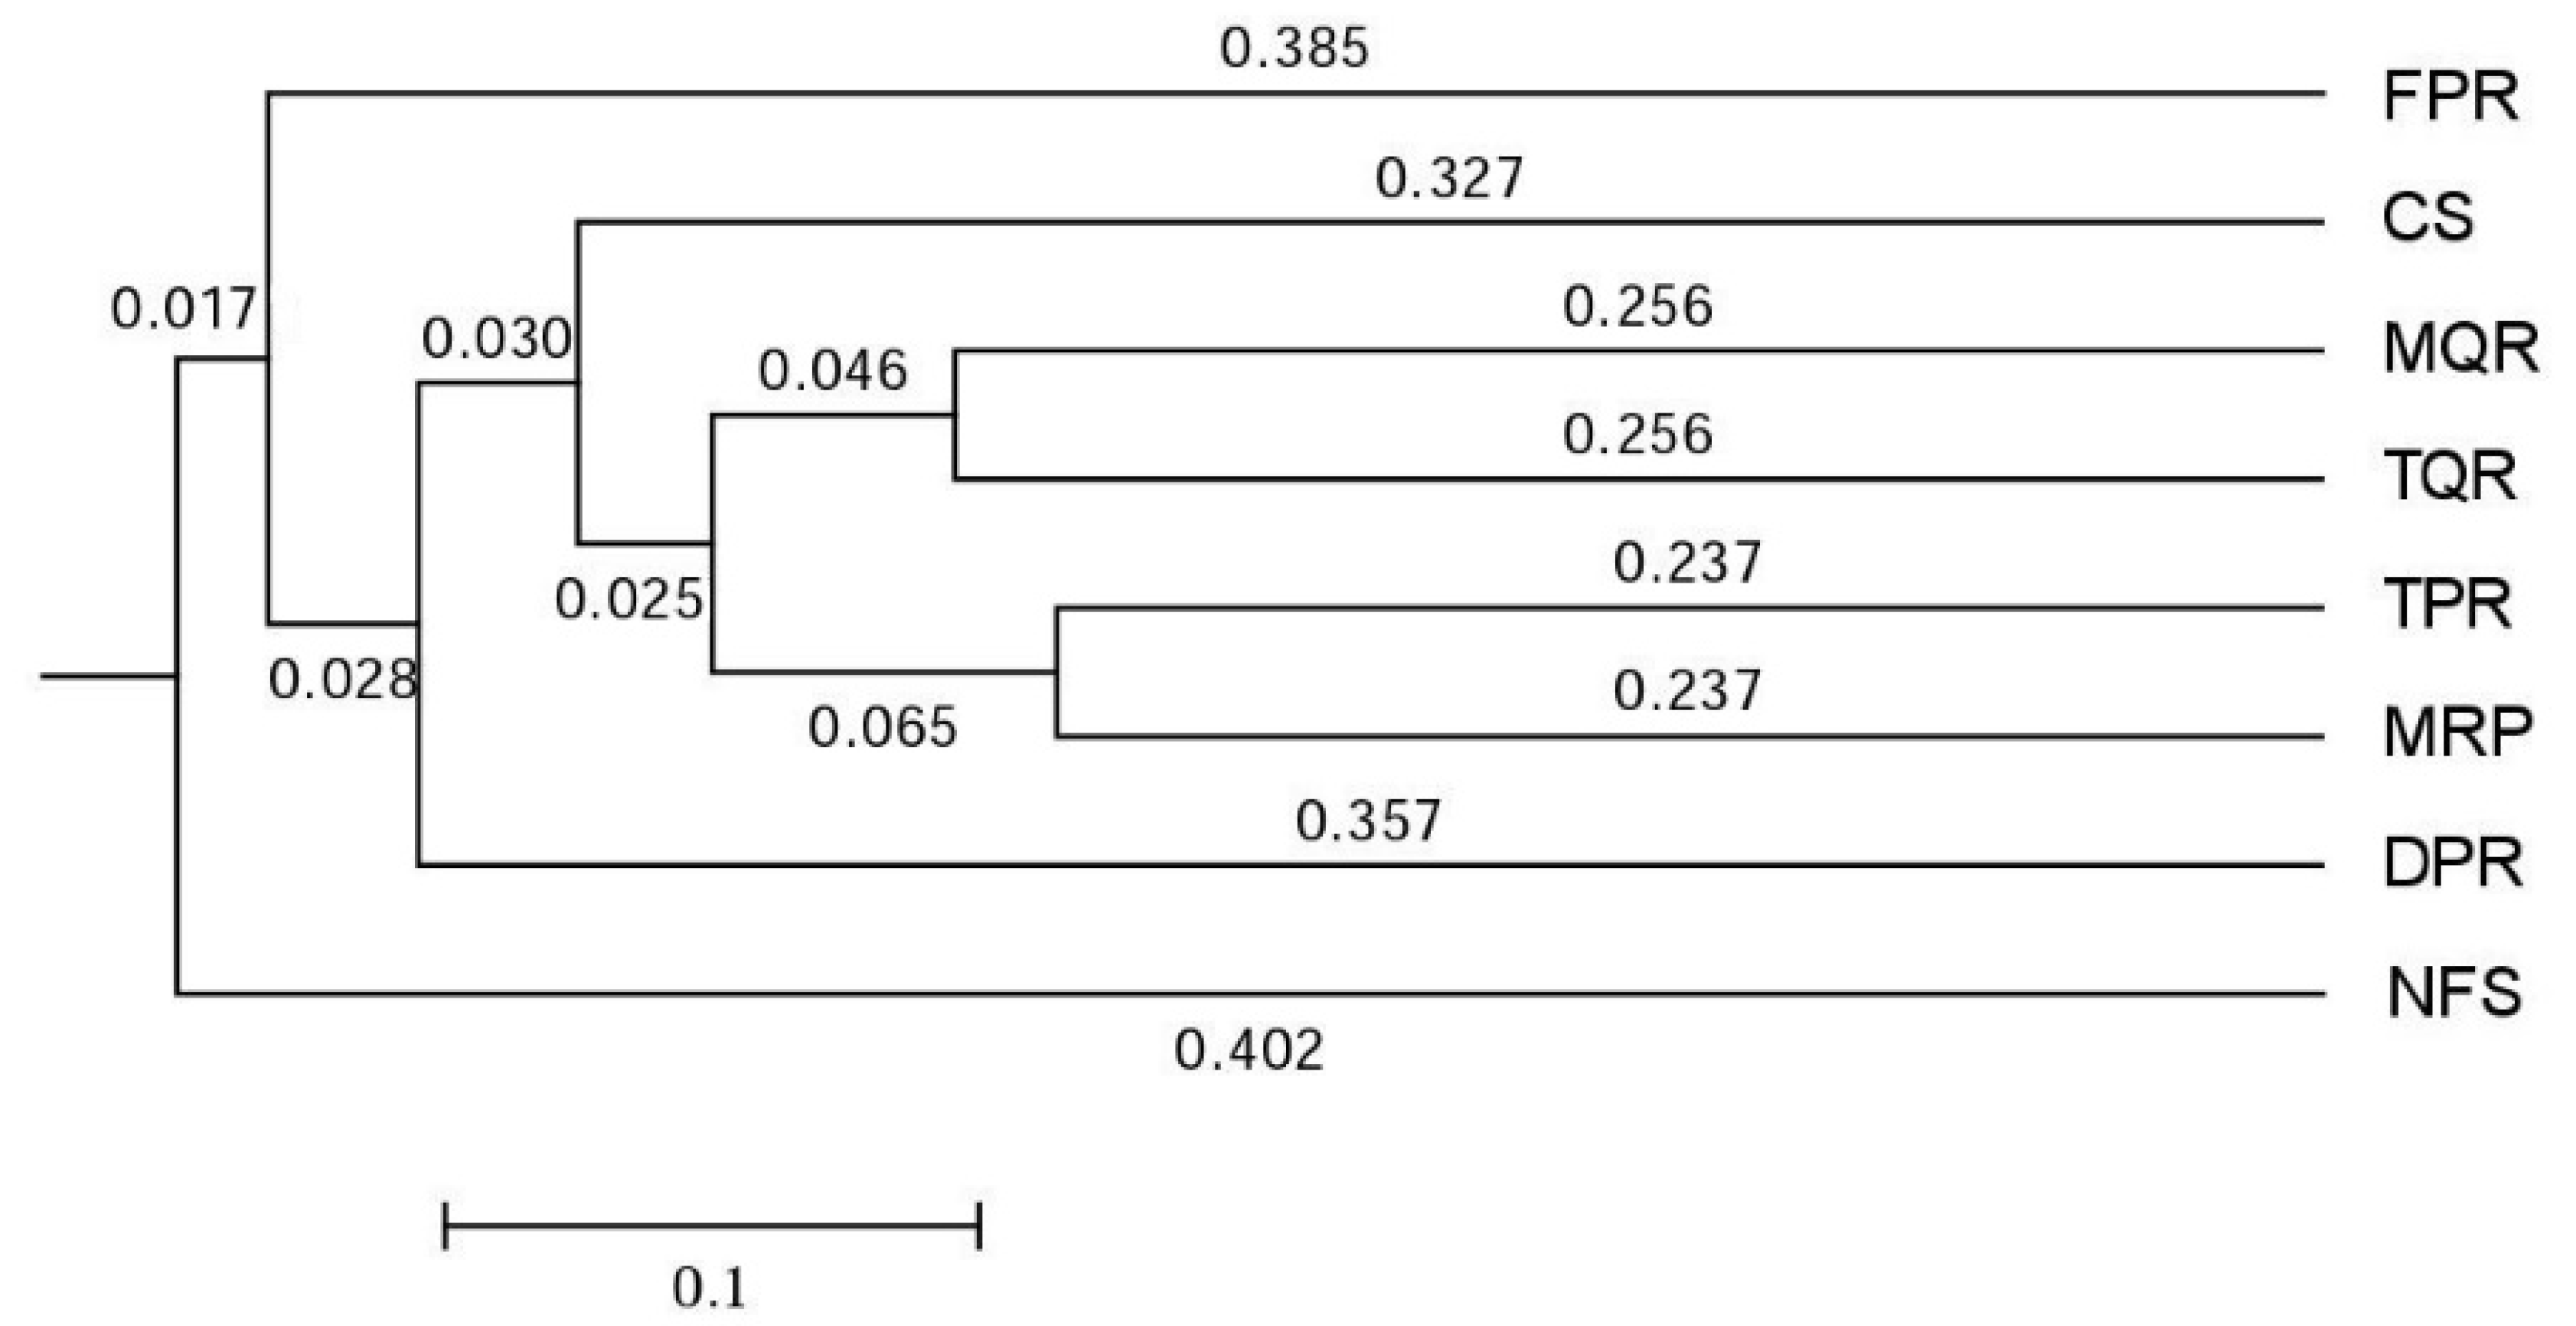
3.1. Changes in Soil Bacterial and Fungal Community Compositions

High-throughput sequencing and subsequent quality filtering allowed 476,667 bacterial and 496,873 fungal clean reads (tags) to be obtained with the 338F/806R (bacterial 16S rRNA) and ITS1F/ITS2 (fungal ITS) primer sets, respectively, across all soil samples. The number of bacterial clean tags found in each soil sample was 77, 617 in TPR, 73,809 in MPR, 73,704 in CS, 73,154 in NFS, 57,130 in DPR, 48,660 in TQR, 37,756 in MQR, and 34,837 in FPR; fungal clean tags reached 111,512 in TPR, 75,803 in MPR, 68,202 in DPR, 56,802 in MQR, 55,589 in NFS, 49,117 in TQR, 41,797 in CS, and 38,051 in FPR.
Regarding bacterial communities, Cyanobacteria were dominant in CS (45.30%) and DPR (38.36%); Proteobacteria and Actinobacteria in MQR (35.18% and 28.41%, respectively), TQR (33.05% and 25.35%, respectively), and FPR (31.43% and 44.92%, respectively); and Proteobacteria in TPR (44.01%), MPR (38.57%), and NFS (46.39%) (Figure 1). Notably, Proteobacteria and Actinobacteria were more abundant in MQR, TQR, TPR, MPR, and NFS groups (containing living roots), whereas Cyanobacteria were more abundant in CS and DPR groups (not containing living roots) (Figure 1). Fungal communities of all groups except NFS were dominated by Ascomycota: 91.15% in CS, 87.25% in DPR, 79.58% in MPR, 66.63% in MQR, 62.98% in TPR, and 60.99% in FPR (Figure 2). Basidiomycota accounted for about 59.82% of the fungal community in NFS (Figure 2).
Soil bacterial and fungal community similarities are shown in Figure 3 and Figure 4, respectively. Based on hierarchical clustering, bacterial CS communities were most similar to DPR communities, TPR communities were most similar to MPR communities, TQR communities were most similar to MQR communities, and NFS communities were most similar to FPR communities. Fungal TPR and MPR communities, and TQR and MQR communities, were also clustered, but CS and DPR were in different branches of the dendrogram. Bacterial and fungal FPR and NFS were the least similar (Figure 3 and Figure 4).

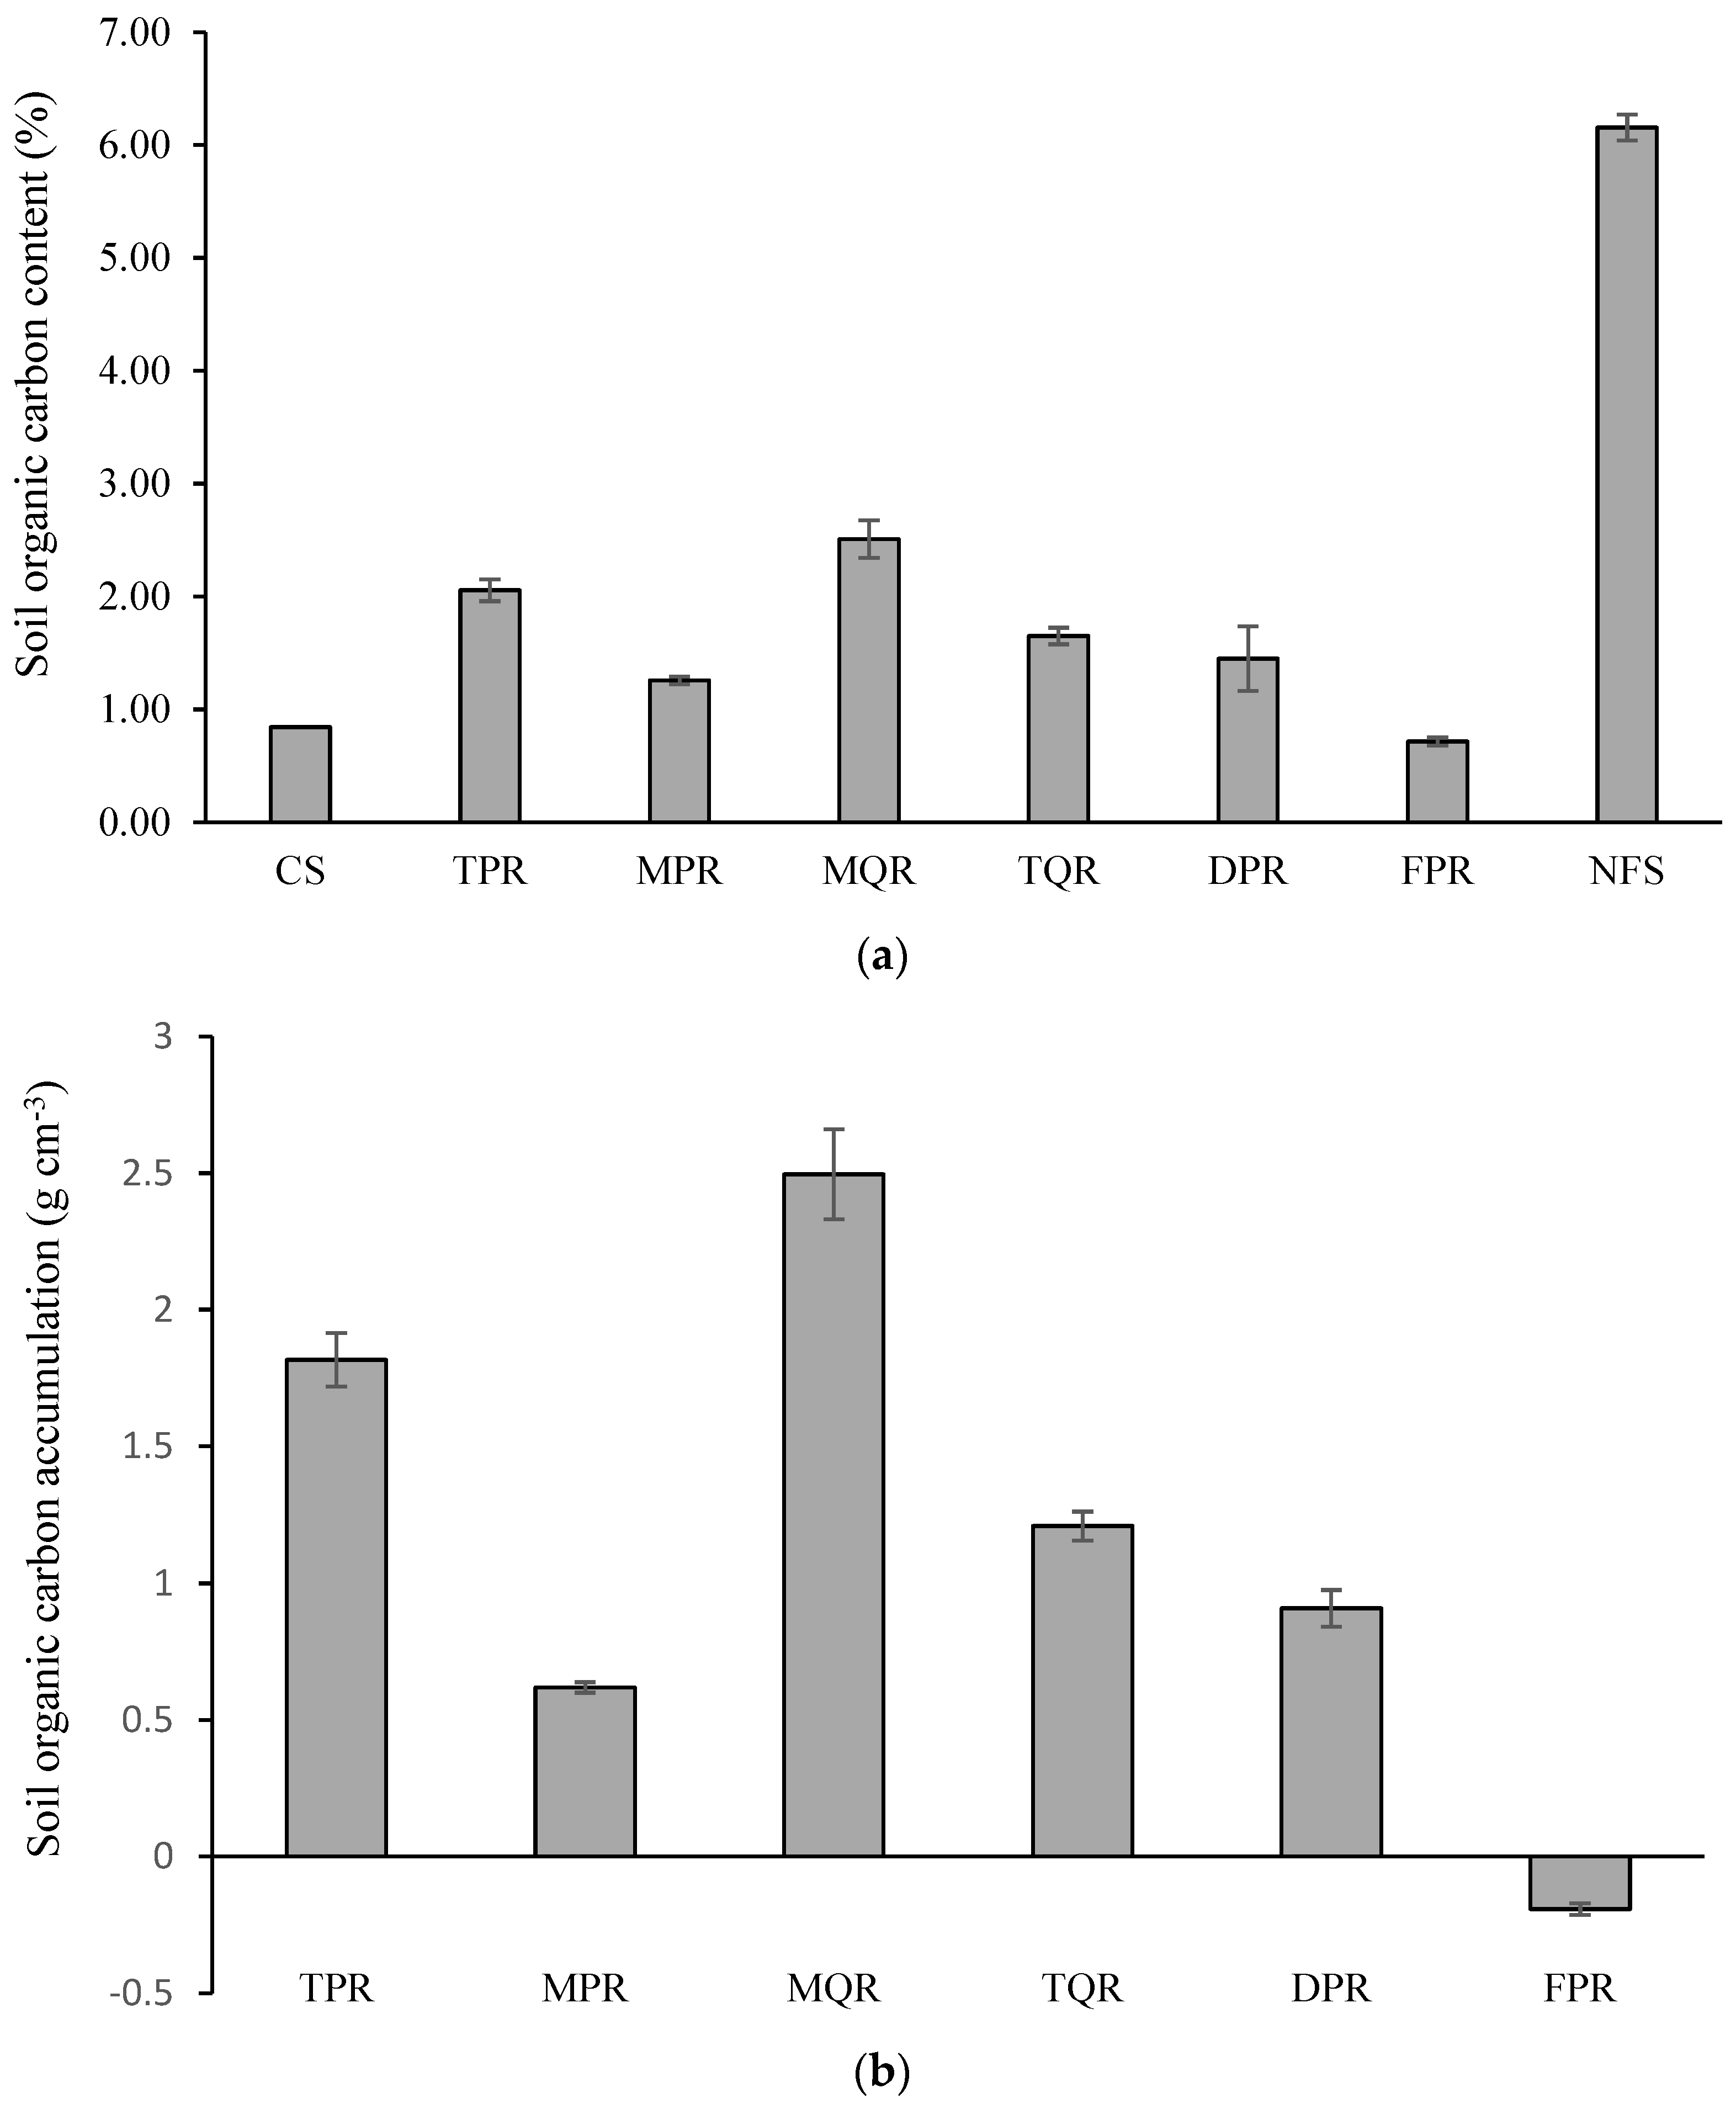
3.2. Changes in SOC Accumulation and Microbial Taxa

Soil organic C content (%) was lower in CS than in all other groups, except FPR, and decreased in the following order: NFS > MQR > TPR > TQR > DPR > MPR > CS > FPR (Figure 5a). After one year, SOC accumulation was 2.49, 1.81, 1.20, 0.91, 0.62, and −0.19 g/cm3 in MQR, TPR, TQR, DPR, MPR, and FPR, respectively (Figure 5b). Thus, SOC contents were greatly affected by tree roots.
The abundances of Proteobsacteria, Acidobacteria, and Gemmatimonadetes were positively correlated with SOC accumulation in groups comprising P. tabuliformis living roots (TPR and MPR; Table 1), and Proteobacteria, Actinobacteria, Chloroflexi, and Gemmatimonadetes abundances were positively correlated with SOC accumulation in groups comprising Q. variabilis living roots (TQR and MQR; Table 1). The abundance of Cyanobacteria was negatively correlated with SOC accumulation in all groups comprising living tree roots (TPR, MPR, TQR, and MQR; Table 1). The abundances of Verrucomicrobia and Gemmatimonadetes were positively correlated with SOC accumulation in DPR and Proteobacteria and Acidobacteria abundances were positively correlated with SOC accumulation in FPR (Table 1).
The abundances of Basidiomycota and Zygomycota were positively correlated with SOC accumulation in all groups containing living tree roots (TPR, MPR, TQR, and MQR; Table 2), while Ascomycota abundance was negatively correlated with SOC in these groups. Zygomycota abundance was positively correlated and Ascomycota abundance negatively correlated with SOC accumulation in FPR (Table 2). No significant correlation was found between SOC accumulation and fungi abundance in DPR (Table 2).

4. Discussion

4.1. Changes in Soil Bacterial and Fungal Communities

In our experimental design, CS and DPR groups represented the degraded ecosystem; TPR, MPR, TQR, MQR, and FPR represented the primary stage of succession; and NFS represented the climax microbial community. In degraded ecosystems (CS and DPR), decay processes predominate, and only some autotrophic or saprophytic microbes can survive [33,34]. Accordingly, Cyanobacteria were the dominant bacterial phylum (Figure 1).
During primary succession, the composition of microbial communities is greatly changed. Although Proteobacteria were dominant in TPR, MPR, TQR, and MQR (Figure 1), the proportion of Actinobacteria in TQR and MQR was larger than in TPR and MPR (Figure 1), revealing that members of this phylum are more adapted to the rhizosphere of Q. variabilis than to that of P. tabuliformis. Bacterial community composition in FPR also changed dramatically post-fire with increased Actinobacteria, Proteobacteria, and Firmicutes abundance (Figure 1). The adverse soil environment due to fire [35] increased dissimilarity between microbial community composition in FPR and TPR, MPR, TQR, and MQR (Figure 3 and Figure 4). There were no significant differences in fungal communities among groups representing the primary stage of succession (TPR, MPR, TQR, MQR, and FPR), but the microbial climax community (NFS) differed significantly from other groups (Figure 4).
Based on our data, and on previous studies, soil bacterial communities seem to recover faster than fungal communities [20]. After recovery, dominant species within soil microbial communities shift from fast-growing, pathogenic bacteria to beneficial, slow-growing fungal species, and pathogenic bacterial populations are eliminated [21,36]; thus, the bacterial community in NFS was similar to that in FPR (Figure 3). Furthermore, because the composition of the active functional fungal community changed from fast-growing and pathogenic fungal species to beneficial and slower-growing fungal species [21], the dominant fungal phylum in our groups shifted from Ascomycota to Basidiomycota (Figure 2).

4.2. Influence on SOC Accumulation and Microbial Taxa

Soil organic C was lower in CS than in all other groups except FPR (Figure 5) because soil C was not available for soil microbes due to the presence of pyrogenic organic matter [37]. Thus, tree roots benefited SOC stocks while burned SOC required a long recovery time. Although bacterial FPR and NFS communities were similar, C content was much higher in NFS than in FPR (Figure 3 and Figure 5a). Similarly, SOC was higher in DPR than in CS, but the microbial communities of these groups were similar (Figure 3 and Figure 4). However, most bacterial and fungal phyla in DPR were not correlated with SOC accumulation (Table 1 and Table 2). Therefore, microbial processes were not the main factors affecting C accumulation in DPR. The increased SOC in DPR was most likely due to C transfer from dead roots, not to biochemical processes [38].
During primary succession, Proteobacteria seem beneficial for the C accumulation driven by tree roots (Table 1). However, while root-driven SOC accumulation of P. tabuliformis was concentrated at root tips, that of Q. variabilis was concentrated at the middle region of roots (Figure 5). Therefore, P. tabuliformis seems to concentrate root exudates on root tips, thereby stimulating bacteria growth in this area of the rhizosphere such that roots can extend to obtain nutrients and water. On the other hand, Q. variabilis seems to concentrate root exudates in the middle region of roots, stimulating the growth of rhizomicrobes in this area to obtain nutrients [39]. As so, Q. variabilis uses most of the length of the root, which may be helpful to adapt to poor, shallow soils. Due to these different strategies of root-driven C accumulation, the bacterial communities of TPR and MPR differed from those of TQR and MQR (Figure 3). In addition, Verrucomicrobia benefited the C accumulation driven by P. tabuliformis roots but not by Q. variabilis roots, while Actinobacteria and Chloroflexi benefited the C accumulation driven by Q. variabilis roots but not by P. tabuliformis roots (Table 1).
Our results showed that tree roots and some rhizomicrobes benefited SOC accumulation significantly (Figure 5, Table 1 and Table 2). Rhizomicrobes can help roots transfer nutrients through functional structures, such as biofilm, thereby improving the environment of degraded ecosystems [40,41]. Proteobacteria benefited the C accumulation driven by tree roots during primary succession (Table 1), and Basidiomycota benefited the C accumulation driven by tree roots in stable forest ecosystems (Table 2). These observations indicated that these phyla might be used as novel biotechnological tools to mitigate degradation and C loss in degraded forest ecosystems.

5. Conclusions

In this study, we demonstrated that microbial community composition changed according to root-associated SOC accumulation along the primary succession of forest ecosystems. Soil organic C contents were greatly affected by tree roots and rhizomicrobes in the primary stage and climax of succession. Tree roots can shift underground microbial compositions and benefit SOC restoration in degraded ecosystems. Proteobacteria were keystone organisms for root-driven C accumulation in primary succession and Basidiomycota were the keystone for root-driven C accumulation in climax communities. This work has therefore enabled a deeper insight into root-associated microbial communities, increased awareness on root-associated SOC accumulation mechanisms, and contributes to a better understanding of microbial ecology in forest succession.
Based on our results, we suggest the forest management practices listed below. The establishment of P. tabuliformis and Q. variabilis plantations in the study area promoted SOC accumulation and the recovery of soil ecological environment; nevertheless, different species should be used in different circumstances during afforestation. Forest fire was harmful for both microbial community and SOC restoration, and, therefore, should be avoided in forest management. Microbial biofilms should be filtered from the apical region of P. tabuliformis roots or middle region of Q. variabilis roots and applied to soil to facilitate C accumulation in degraded forests and to improve the abundance of beneficial rhizomicrobes in afforestation.
In order to achieve the consistency of the study, we only experimented in the site mentioned. We are not sure whether these results would occur in other locations since the geographic factors were ignored. For this reason, the microbial phyla cannot be fully correlated with root-associated SOC in other forests. Whether the phyla were determined by the rhizosphere environment or the locations is still an important question and needs to be clarified. More replicates and geographic factors should be taken into account in future studies.

Supplementary Materials

The following are available online at https://www.mdpi.com/1999-4907/9/6/333/s1, Figure S1: Experimental devices for sampling.

Author Contributions

W.S. and Y.L. conceptualized the study. W.S. designed and performed the experiments. Y.L. contributed materials and analysis tools. W.S. analyzed the data and wrote the paper.

Funding

This study was sponsored by the Key Project of National Key Research and Development Plan (Grant No. 2017YFC0504004).

Conflicts of Interest

The authors declare no conflict of interest.

References

  1. Pausch, J.; Kuzyakov, Y. Carbon input by roots into the soil: Quantification of rhizodeposition from root to ecosystem scale. Glob. Chang. Biol. 2017, 24, 1–12. [Google Scholar] [CrossRef] [PubMed] [Green Version]
  2. Bond-Lamberty, B.; Thomson, A. Temperature-associated increases in the global soil respiration record. Nature 2010, 464, 579–584. [Google Scholar] [CrossRef] [PubMed]
  3. Fahey, T.J.; Woodbury, P.B.; Battles, J.J.; Goodale, C.L.; Hamburg, S.P.; Ollinger, S.V.; Woodall, C.W. Forest carbon storage: Ecology, management, and policy. Front. Ecol. Environ. 2010, 8, 245–252. [Google Scholar] [CrossRef]
  4. Treseder, K.K.; Holden, S.R. Fungal carbon sequestration. Science 2013, 339, 1528–1529. [Google Scholar] [CrossRef] [PubMed]
  5. Cheng, W.X.; Parton, W.J.; Gonzalez-Meler, M.A.; Phillips, R.; Asao, S.; Mc Nickle, G.G.; Brzostek, E.; Jastrow, J.D. Synthesis and modeling perspectives of rhizosphere priming. New Phytol. 2014, 201, 31–44. [Google Scholar] [CrossRef] [PubMed]
  6. Kuzyakov, Y. Priming effects: Interactions between living and dead organic matter. Soil Biol. Biochem. 2010, 42, 1363–1371. [Google Scholar] [CrossRef]
  7. Johnson, D.; Leake, J.R.; Read, D.J. Transfer of recent photosynthate into mycorrhizal mycelium of an upland grassland: Short-term respiratory losses and accumulation of 14C. Soil Biol. Biochem. 2002, 34, 1521–1524. [Google Scholar] [CrossRef]
  8. Rillig, M.C.; Mummey, D.L. Mycorrhizas and soil structure. New Phytol. 2006, 171, 41–53. [Google Scholar] [CrossRef] [PubMed] [Green Version]
  9. Clemmensen, K.E.; Bahr, A.; Ovaskainen, O.; Dahlberg, A.; Ekblad, A.; Wallander, H.; Stenlid, J.; Finlay, R.D.; Wardle, D.A.; Lindahl, B.D. Roots and associated fungi drive long-term carbon sequestration in boreal forest. Science 2013, 339, 1615–1618. [Google Scholar] [CrossRef] [PubMed]
  10. Pan, Y.D.; Birdsey, R.A.; Fang, J.Y.; Houghton, R.; Kauppi, P.E.; Kurz, W.A.; Phillips, O.L.; Shvidenko, A.; Lewis, S.L.; Canadell, J.G. A large and persistent carbon sink in the world’s forests. Science 2011, 333, 988–993. [Google Scholar] [CrossRef] [PubMed]
  11. Deng, Q.; Cheng, X.X.; Hui, D.F.; Zhang, Q.; Li, M.; Zhang, Q.F. Soil microbial community and its interaction with soil carbon and nitrogen dynamics following afforestation in central China. Sci. Total Environ. 2016, 541, 230–237. [Google Scholar] [CrossRef] [PubMed]
  12. Zhang, C.; Liu, G.B.; Xue, S.; Wang, G. Soil bacterial community dynamics reflect changes in plant community and soil properties during the secondary succession of abandoned farmland in the Loess Plateau. Soil Biol. Biochem. 2016, 97, 40–49. [Google Scholar] [CrossRef]
  13. Song, W.C.; Tong, X.J.; Zhang, J.S.; Meng, P. Three-source partitioning of soil respiration by 13C natural abundance and its variation with soil depth in a plantation. J. For. Res. 2016, 27, 533–540. [Google Scholar] [CrossRef]
  14. Mooshammer, M.; Wanek, W.; Zechmeister-Boltenstern, S.; Richter, A. Stoichiometric imbalances between terrestrial decomposer communities and their resources: Mechanisms and implications of microbial adaptations to their resources. Front. Microbiol. 2014, 5, 22. [Google Scholar] [CrossRef] [PubMed]
  15. Song, W.C.; Tong, X.J.; Zhang, J.S.; Meng, P.; Li, J. Autotrophic and heterotrophic components of soil respiration caused by rhizosphere priming effects in a plantation. Plant Soil Environ. 2017, 63, 295–299. [Google Scholar]
  16. Khlifa, R.; Paquette, A.; Messier, C.; Reich, P.B.; Munson, A.D. Do temperate tree species diversity and identity influence soil microbial community function and composition? Ecol. Evol. 2017, 7, 7965–7974. [Google Scholar] [CrossRef] [PubMed] [Green Version]
  17. Song, W.C.; Liu, Y.H.; Tong, X.J. Newly sequestrated soil organic carbon varies with soil depth and tree species in three forest plantations from northeastern China. For. Ecol. Manag. 2017, 400, 384–395. [Google Scholar] [CrossRef]
  18. Zhao, F.Z.; Kang, D.; Han, X.H.; Yang, G.H.; Feng, Y.Z.; Ren, G.X. Soil stoichiometry and carbon storage in long-term afforestation soil affected by understory vegetation diversity. Ecol. Eng. 2015, 74, 415–422. [Google Scholar] [CrossRef]
  19. Ren, C.J.; Zhao, F.Z.; Kang, D.; Yang, G.H.; Han, X.H.; Tong, X.G.; Feng, Y.Z.; Ren, G.X. Linkages of C:N:P stoichiometry and bacterial community in soil following afforestation of former farmland. For. Ecol. Manag. 2016, 376, 59–66. [Google Scholar] [CrossRef]
  20. Ren, C.; Chen, J.; Deng, J.; Zhao, F.; Han, X.; Yang, G.; Tong, X.; Feng, Y.; Shelton, S.; Ren, G. Response of microbial diversity to c:n:p stoichiometry in fine root and microbial biomass following afforestation. Biol. Fertil. Soils 2017, 53, 457–468. [Google Scholar] [CrossRef]
  21. Hannula, S.E.; Morriën, E.; Hollander, M.D.; Putten, W.H.V.D.; Veen, J.A.V.; Boer, W.D. Shifts in rhizosphere fungal community during secondary succession following abandonment from agriculture. ISME J. 2017, 11, 1–11. [Google Scholar] [CrossRef] [PubMed]
  22. Laganière, J.; Boča, A.; Miegroet, H.V.; Paré, D. A tree species effect on soil that is consistent across the species’ range: The case of aspen and soil carbon in North America. Forests 2017, 8, 113. [Google Scholar] [CrossRef]
  23. Van der Heijden, M.G.; Bardgett, R.D.; van Straalen, N.M. The unseen majority: Soil microbes as drivers of plant diversity and productivity in terrestrial ecosystems. Ecol. Lett. 2008, 11, 296–310. [Google Scholar] [CrossRef] [PubMed]
  24. Kolaříková, Z.; Kohout, P.; Krüger, C.; Janoušková, M.; Mrnka, L.; Rydlová, J. Root-associated fungal communities along a primary succession on a mine spoil: Distinct ecological guilds assemble differently. Soil Biol. Biochem. 2017, 113, 143–152. [Google Scholar] [CrossRef]
  25. Porras-Alfaro, A.; Bayman, P. Hidden fungi, emergent properties: Endophytes and microbiomes. Annu. Rev. Phytopathol. 2011, 49, 291–315. [Google Scholar] [CrossRef] [PubMed]
  26. Jia, G.M.; Cao, J.; Wang, C.; Wang, G. Microbial biomass and nutrients in soil at the different stages of secondary forest succession in Ziwulin, northwest China. For. Ecol. Manag. 2005, 217, 117–125. [Google Scholar] [CrossRef]
  27. Noormets, A.; Epron, D.; Domec, J.C.; McNulty, S.G.; Fox, T.; Sun, G.; King, J.S. Effects of forest management on productivity and carbon sequestration: A review and hypothesis. For. Ecol. Manag. 2015, 355, 124–140. [Google Scholar] [CrossRef] [Green Version]
  28. Xiang, Y.; Cheng, M.; Huang, Y.; An, S.; Darboux, F. Changes in soil microbial community and its effect on carbon sequestration following afforestation on the Loess Plateau, China. Int. J. Environ. Res. Public Health 2017, 14, 948. [Google Scholar] [CrossRef] [PubMed]
  29. Zhao, F.Z.; Han, X.H.; Yang, G.H.; Feng, Y.Z.; Ren, G.X. Soil structure and carbon distribution in subsoil affectedby vegetation restoration. Plant Soil Environ. 2014, 60, 21–26. [Google Scholar]
  30. Liu, Z.; Yu, X.; Jia, G.; Jia, J.; Lou, Y.; Lu, W. Contrasting water sources of evergreen and deciduous tree species in rocky mountain area of Beijing, China. Catena 2017, 150, 108–115. [Google Scholar] [CrossRef]
  31. Taş, N.; Prestat, E.; McFarland, J.W.; Wickland, K.P.; Knight, R.; Berhe, A.A.; Jansson, J.K. Impact of fire on active layer and permafrost microbial communities and metagenomes in an upland Alaskan boreal forest. ISME J. 2014, 8, 1904–1919. [Google Scholar] [CrossRef] [PubMed]
  32. Jiang, X.T.; Peng, X.; Deng, G.H.; Sheng, H.F.; Wang, Y.; Zhou, H.W.; Tam, N.F. Illumina sequencing of 16s RNA tag revealed spatial variations of bacterial communities in a mangrove wetland. Microb. Ecol. 2013, 66, 96–104. [Google Scholar] [CrossRef] [PubMed]
  33. Jiang, D.M.; Cao, C.Y.; Zhang, Y.; Cui, Z.B.; Han, X.S. Plantations of native shrub species restore soil microbial diversity in the horqin sandy land, northeastern China. J. Arid Land 2014, 6, 445–453. [Google Scholar] [CrossRef]
  34. Singh, J.S.; Kumar, A.; Rai, A.N.; Singh, D.P. Cyanobacteria: A precious bio-resource in agriculture, ecosystem, and environmental sustainability. Front. Microbiol. 2016, 7, 529. [Google Scholar] [CrossRef] [PubMed]
  35. Prendergast-Miller, M.T.; Menezes, A.B.D.; Macdonald, L.M.; Toscas, P.; Bissett, A.; Baker, G.; Farrell, M.; Richardson, A.E.; Wark, T.; Thrall, P.H. Wildfire impact: Natural experiment reveals differential short-term changes in soil microbial communities. Soil Biol. Biochem. 2017, 109, 1–13. [Google Scholar] [CrossRef] [Green Version]
  36. Chang, E.H.; Tian, G.; Chiu, C.Y. The effect of re-planting trees on soil microbial communities in a wildfire-induced subalpine grassland. Forests 2017, 8, 385. [Google Scholar] [CrossRef]
  37. Soong, J.L.; Dam, M.; Wall, D.H.; Cotrufo, M.F. Below-ground biological responses to pyrogenic organic matter and litter inputs in grasslands. Funct. Ecol. 2017, 31, 260–269. [Google Scholar] [CrossRef]
  38. López-Ballesteros, A.; Oyonarte, C.; Kowalski, A.S.; Serrano-Ortiz, P.; Sánchez-Cañete, E.P.; Moya, M.R.; Domingo, F. Can land degradation drive differences in the C exchange of two similar semiarid ecosystems? Biogeosciences 2018, 15, 1–25. [Google Scholar] [CrossRef]
  39. Kuzyakov, Y.; Xu, X. Competition between roots and microorganisms for nitrogen: Mechanisms and ecological relevance. New Phytol. 2013, 198, 656–669. [Google Scholar] [CrossRef] [PubMed]
  40. Briones, A.M.; Okabe, S.; Umemiya, Y.; Ramsing, N.B.; Reichardt, W.; Okuyama, H. Influence of different cultivars on populations of ammonia-oxidizing bacteria in the root environment of rice. Appl. Environ. Microb. 2002, 68, 67–75. [Google Scholar] [CrossRef]
  41. Herath, L.; Seneviratne, G.; Jayasinghe, J.W.W.; Senanayake, D.N. Microbial biofilms and mitigation of loss of agro-biodiversity in degraded soils. J. Natl. Sci. Found. Sri Lanka 2017, 45, 329–335. [Google Scholar] [CrossRef]
Figure 1. Distribution of 16S rRNA sequences across bacterial communities. CS, control soil; MPR, middle portion of Pinus tabuliformis roots; TPR, tips of P. tabuliformis roots; MQR, middle portion of Quercus variabilis roots; tips of Q. variabilis roots; FPR, post-fire planted forest of P. tabuliformis; DPR, dead P. tabuliformis roots; NFS, natural P. tabuliformis forest.
Forests 09 00333 g001
Figure 2. Distribution of ITS sequences across fungal communities. CS, control soil; MPR, middle portion of Pinus tabuliformis roots; TPR, tips of P. tabuliformis roots; MQR, middle portion of Quercus variabilis roots; tips of Q. variabilis roots; FPR, post-fire planted forest of P. tabuliformis; DPR, dead P. tabuliformis roots; NFS, natural P. tabuliformis forest.
Forests 09 00333 g002
Figure 3. Hierarchical clustering of soil bacterial communities according to the Bray-Curtis similarity algorithm and unweighted pair group with arithmetic mean. CS, control soil; MPR, middle portion of Pinus tabuliformis roots; TPR, tips of P. tabuliformis roots; MQR, middle portion of Quercus variabilis roots; tips of Q. variabilis roots; FPR, post-fire planted forest of P. tabuliformis; DPR, dead P. tabuliformis roots; NFS, natural P. tabuliformis forest.
Forests 09 00333 g003
Figure 4. Hierarchical clustering of soil fungal communities according to the Bray-Curtis similarity algorithm and unweighted pair group with arithmetic mean. CS, control soil; MPR, middle portion of Pinus tabuliformis roots; TPR, tips of P. tabuliformis roots; MQR, middle portion of Quercus variabilis roots; tips of Q. variabilis roots; FPR, post-fire planted forest of P. tabuliformis; DPR, dead P. tabuliformis roots; NFS, natural P. tabuliformis forest.
Forests 09 00333 g004
Figure 5. Soil organic carbon (a) content in each group and (b) its accumulation after one year. CS, control soil; MPR, middle portion of Pinus tabuliformis roots; TPR, tips of P. tabuliformis roots; MQR, middle portion of Quercus variabilis roots; tips of Q. variabilis roots; FPR, post-fire planted forest of P. tabuliformis; DPR, dead P. tabuliformis roots; NFS, natural P. tabuliformis forest.
Forests 09 00333 g005
Table 1. Correlation coefficients between soil organic carbon accumulation and bacterial taxa abundance in each sample group. Bacterial taxa: Proteobacteria (Prot), Actinobacteria (Acti), Cyanobacteria (Cyan), Acidobacteria (Acid), Chloroflexi (Chlo), Bacteroidetes (Bact), Gemmatimonadetes (Gemm), Verrucomicrobia (Verr), Planctomycetes (Plan), Firmicutes (Firm), Nitrospirae (Nitr), and Saccharibacteria (Sacc).
ProtActiCyanAcidChloBactGemmVerrPlanFirmNitrSacc
TPR+ **n− **+ **nn+ **+ *nnnn
MPR+ **n− **+ *nn+ **+ *nnnn
MQR+ **+ **− **n+ *n+ *nnnnn
TQR+ **+ **− **n+ **n+ *nn+ *+ *n
DPRnnnnnn+ *+ *nnnn
FPR+ *nn+ *nnnnn− *n− *
Significance levels: n: p > 0.05, * p < 0.05, ** p < 0.005. + positive correlation; − negative correlation. CS, control soil; MPR, middle portion of Pinus tabuliformis roots; TPR, tips of P. tabuliformis roots; MQR, middle portion of Quercus variabilis roots; tips of Q. variabilis roots; FPR, post-fire planted forest of P. tabuliformis; DPR, dead P. tabuliformis roots; NFS, natural P. tabuliformis forest.
Table 2. Correlation coefficients between soil organic carbon accumulation and fungi taxa abundance in each sample group.
AscomycotaBasidiomycotaZygomycotaCercozoaOther
TPR− **+ **+ **n+ **
MPR− **+ **+ **nn
MQR− **+ **+ **nn
TQR− **+ **+ **nn
DPRnnnnn
FPR− **n+ **nn
Significance levels: n: p > 0.05, ** p < 0.005. + positive correlation; − negative correlation. CS, control soil; MPR, middle portion of Pinus tabuliformis roots; TPR, tips of P. tabuliformis roots; MQR, middle portion of Quercus variabilis roots; tips of Q. variabilis roots; FPR, post-fire planted forest of P. tabuliformis; DPR, dead P. tabuliformis roots; NFS, natural P. tabuliformis forest.

