Article

The Transcriptomic Responses of Pinus massoniana to Drought Stress

1
School of Forestry Science, Guizhou University, Guiyang 550025, Guizhou, China
2
Institute for Forest Resources & Environment of Guizhou, Guizhou University, Guiyang 550025, Guizhou, China
3
School of Karst Science, Guizhou Normal University, Guiyang 550001, Guizhou, China
*
Author to whom correspondence should be addressed.
Forests 2018, 9(6), 326; https://doi.org/10.3390/f9060326
Submission received: 29 April 2018 / Revised: 30 May 2018 / Accepted: 31 May 2018 / Published: 4 June 2018
(This article belongs to the Special Issue Genetics and Genomics of Forest Trees)

Abstract

:
Masson pine (Pinus massoniana) is a major fast-growing timber species planted in southern China, a region of seasonal drought. Using a drought-tolerance genotype of Masson pine, we conducted large-scale transcriptome sequencing using Illumina technology. This work aimed to evaluate the transcriptomic responses of Masson pine to different levels of drought stress. First, 3397, 1695 and 1550 unigenes with differential expression were identified by comparing plants subjected to light, moderate or severe drought with control plants. Second, several gene ontology (GO) categories (oxidation-reduction and metabolism) and Kyoto Encyclopedia of Genes and Genomes (KEGG) pathways (plant hormone signal transduction and metabolic pathways) were enriched, indicating that the expression levels of some genes in these enriched GO terms and pathways were altered under drought stress. Third, several transcription factors (TFs) associated with circadian rhythms (HY5 and LHY), signal transduction (ERF), and defense responses (WRKY) were identified, and these TFs may play key roles in adapting to drought stress. Drought also caused significant changes in the expression of certain functional genes linked to osmotic adjustment (P5CS), abscisic acid (ABA) responses (NCED, PYL, PP2C and SnRK), and reactive oxygen species (ROS) scavenging (GPX, GST and GSR). These transcriptomic results provide insight into the molecular mechanisms of drought stress adaptation in Masson pine.

1. Introduction

Drought is one of the world’s most severe environmental stresses. It represents an increasing threat to the productivity of agriculture and forestry as it has negative impacts on plant growth and development [1]. To adapt to unfavorable conditions of water deficit, plants activate a variety of complex regulatory mechanisms by altering gene expression levels [2] and by activating complex cross-talk between biochemical and molecular processes [3]. The involved genes are typically divided into genes encoding functional proteins and those encoding regulatory proteins. Functional proteins directly protect plants and include scavengers of ROS (reactive oxygen species) [4], aquaporins [5], dehydrins [6] and others. In contrast, regulatory proteins control gene expression networks and signal transduction pathways involved in stress responses [2]. Many regulatory proteins, such as MYB and WRKY, play key roles in plant drought stress responses. In addition, ABA (abscisic acid), a crucial hormone that is often involved in signaling and stress responses, generally accumulates under drought conditions and can initiate signal transduction that results in the up-regulation of several genes involved in drought stress responses [7].
Masson pine (Pinus massoniana), a major coniferous tree widely distributed in southern China, is not only an economically important species that is commonly used for timber, wood pulp and rosin but also an ecologically important species in forest ecosystems [8]. Seasonal soil drought in southern China is a major natural phenomenon that constrains the production and growth of Masson pine. Therefore, it is of interest to cultivate genotypes that are resistant to drought conditions. Most studies investigating the drought tolerance of Masson pine have focused on the plant’s morphology and physiology. These studies have described certain important morphological adaptations to xeric environments, such as alterations to root development [9]. Moreover, some analyses of the physiological responses of this plant have uncovered traits related to drought resistance, such as changes in MDA (malondialdehyde) and PRO (free proline) content [9] as well as changes in the activities of POD (peroxidase), SOD (superoxide dismutase) and CAT (catalase). In addition, several important drought-stress-induced genes have been identified using reverse transcription-polymerase chain reaction (RT-PCR), including F-box, Ribosomal RNA Processing 8 (RRP8), auxin response factors (ARFs), and EF1b [10]. However, despite the importance of drought resistance in Masson pine, a more comprehensive understanding of the molecular response mechanisms underlying resistance remains lacking. NGS (next-generation sequencing), a technology that provides deep sequencing sufficient to cover the entire transcriptome of an organism, has contributed greatly to studies in model and non-model plants. Expanding transcriptome information is extremely useful for the exploration of differential gene expression and key responsive factors in conifer species subjected to drought stress, such as Pinus pinaster [11] and Pinus menziesii [12]. In this study, the transcriptome of Masson pine under different drought stress conditions was evaluated using the Illumina Hi-Seq sequencing platform. The transcriptome data were used to identify genes that may be involved in the response to drought and to clarify the possible molecular mechanisms involved in Masson pine’s adaptation to different drought stress conditions. The results improve our understanding of environmental acclimation mechanisms in Masson pine and will serve as an invaluable molecular-level reference to inform future work on the enhancement of drought tolerance in Masson pine.

2. Material and Methods

2.1. Plant Material and Experimental Setup

An elite pure line of Masson pine, named the 83rd family of Masson pine, obtained from the seed orchard of Guangxi Province (P. R. China) (20°36′ N, 107°28′ E) was used in this study. This line exhibited rapid growth and strong drought resistance in our previous study [9]. In April 2015, one-year-old seedlings of this elite line were cultured in pots in a ventilated nursery at the College of Forestry, Guizhou University, with a day/night room temperature of approximately 20 °C/10 °C and a light/dark photoperiod of 14 h/10 h. Each pot had a 300-mm top diameter, a 200 mm bottom diameter and a 250 mm depth and was filled with yellow soil that had developed from quaternary red clay and was collected from a Masson pine forest. The soil had a pH of approximately 5.0. Its total contents of N, P, and K were 0.16 g/kg, 0.36 g/kg and 1.50 g/kg, respectively, and its available contents of N, P, and K was 65.77 mg/kg, 10.99 mg/kg and 164.26 mg/kg, respectively. In May 2016, the two-year-old seedlings in each pot were approximately 65 cm in height. At this time, the seedlings were divided evenly into four groups, with 3 seedlings per pot and 15 pots per group. The four groups corresponding to four levels of field moisture capacity were as follows: well-watered control (CK, ≥70%), light drought (LD, 55–70%), moderate drought (MD, 45–55%), and severe drought (SD, 30–45%). The water content was controlled by potted planting [13], and the soil moisture content was measured by weighing each pot and was regulated by artificial irrigation. The seedlings were sampled after a one-month period of drought treatment, and the stem apex needles of the seedlings were selected for RNA extraction.

2.2. Total RNA Isolation, Sequencing Library Preparation and Transcriptome Assembly

RNA was extracted from four treatment seedlings with two biological replicates for each treatment and then used to construct 8 cDNA libraries. Total RNA was extracted using a Plant RNA Isolation Kit (Invitrogen, Carlsbad, CA, USA). Sequencing library construction and Illumina deep sequencing were performed using the method described by Ma et al. [14], and 150-bp paired-end reads were generated. De novo transcriptome assembly was conducted using Trinity [15]. The raw data and sequences can be found online at the NCBI Sequence Read Archive (SRA) database (accession number SRP092298) and the GenBank Transcriptome Shotgun Assembly (TSA) database (accession number GFHB00000000), respectively.

2.3. Gene Expression Quantification and Differential Expression Analysis

Gene expression was estimated using RSEM [16] for FPKM (expected number of Fragments Per Kilobase of transcript sequence per Millions base pairs sequenced) values. Differential gene expression analyses of different water conditions were conducted using the R package DESeq (http://www.bioconductor.org/packages/release/bioc/html/DESeq2.html). p values were adjusted to control for logFC > 1 and FDR < 0.05 using the BH (Benjamini–Hochberg) approach.

2.4. Functional Annotation and Enrichment Analysis

Gene function was annotated using the NCBI blast (http://www.ncbi.nlm.nih.gov/) [17] for Nr (NCBI non-redundant protein sequences), Nt (NCBI non-redundant nucleotide sequences), Swiss-Prot (A manually annotated and reviewed protein sequence database) and KOG/COG (Clusters of Orthologous Groups of proteins); the BLAST parameters of NR, NT and Swiss-Prot were controlled for using an e-value = 1 × 10⁻⁵, and KOG/COG was controlled for using an e-value = 1 × 10⁻³. Gene function was annotated on the Pfam (Protein family) database using hmmscan software with an e-value = 0.01; GO annotation was accomplished using blast2go software with an e-value = 1 × 10⁻⁶; and KEGG annotation was performed using KAAS software with an e-value = 1 × 10⁻¹⁰ [18].
Gene ontology (GO) enrichment analysis of the differentially expressed genes (DEGs) was performed using the GOseq R package based on Wallenius’ noncentral hypergeometric distribution [19]. Kyoto Encyclopedia of Genes and Genomes (KEGG) pathway enrichment analysis of the DEGs was conducted using KOBAS [20].

2.5. qRT-PCR (Quantitative Real-Time PCR) Validation

The total RNA isolated as described above was used to synthesize cDNA using the RNA LA PCR Kit (TaKaRa, Shiga, Japan) following the manufacturer’s instructions. Gene-specific primers (Table S1) were designed for 9 unigenes using Primer Premier 5.0 (Premier, Canada). Three biological replicates for each reaction and three technical replicates for each biological replicate were analyzed using SYBR Premix ExTaq (TaKaRa) on a 7500 fast real-time PCR system (Applied Biosystems, Waltham, MA, USA) with the following PCR procedure parameters: 95 °C for 120 s followed by 40 cycles of 95 °C for 10 s, 61 °C for 30 s, and 72 °C for 30 s; and an additional procedure for dissociation (95 °C for 15 s, 60 °C for 60 s, and 95 °C for 15 s). qRT-PCR was performed in 20.0 µL reactions containing 10.0 µL of SYBR mix, 1.0 µL of template cDNA, 0.4 µL of forward primer (10.0 µM), 0.4 µL of reverse primer (10.0 µM), and 8.2 µL of deionized water. Amplification of three internal control genes (UBC, ubiquitin-conjugating enzyme-like protein; 18 s RNA; and GAPDH, NAD-dependent glyceraldehyde-3-phosphate dehydrogenase) [21] was used to normalize the qRT-PCR data. Quantification was achieved using comparative cycle threshold (Ct) values, and gene expression levels were calculated using the 2−ΔΔCt method [22].

3. Results

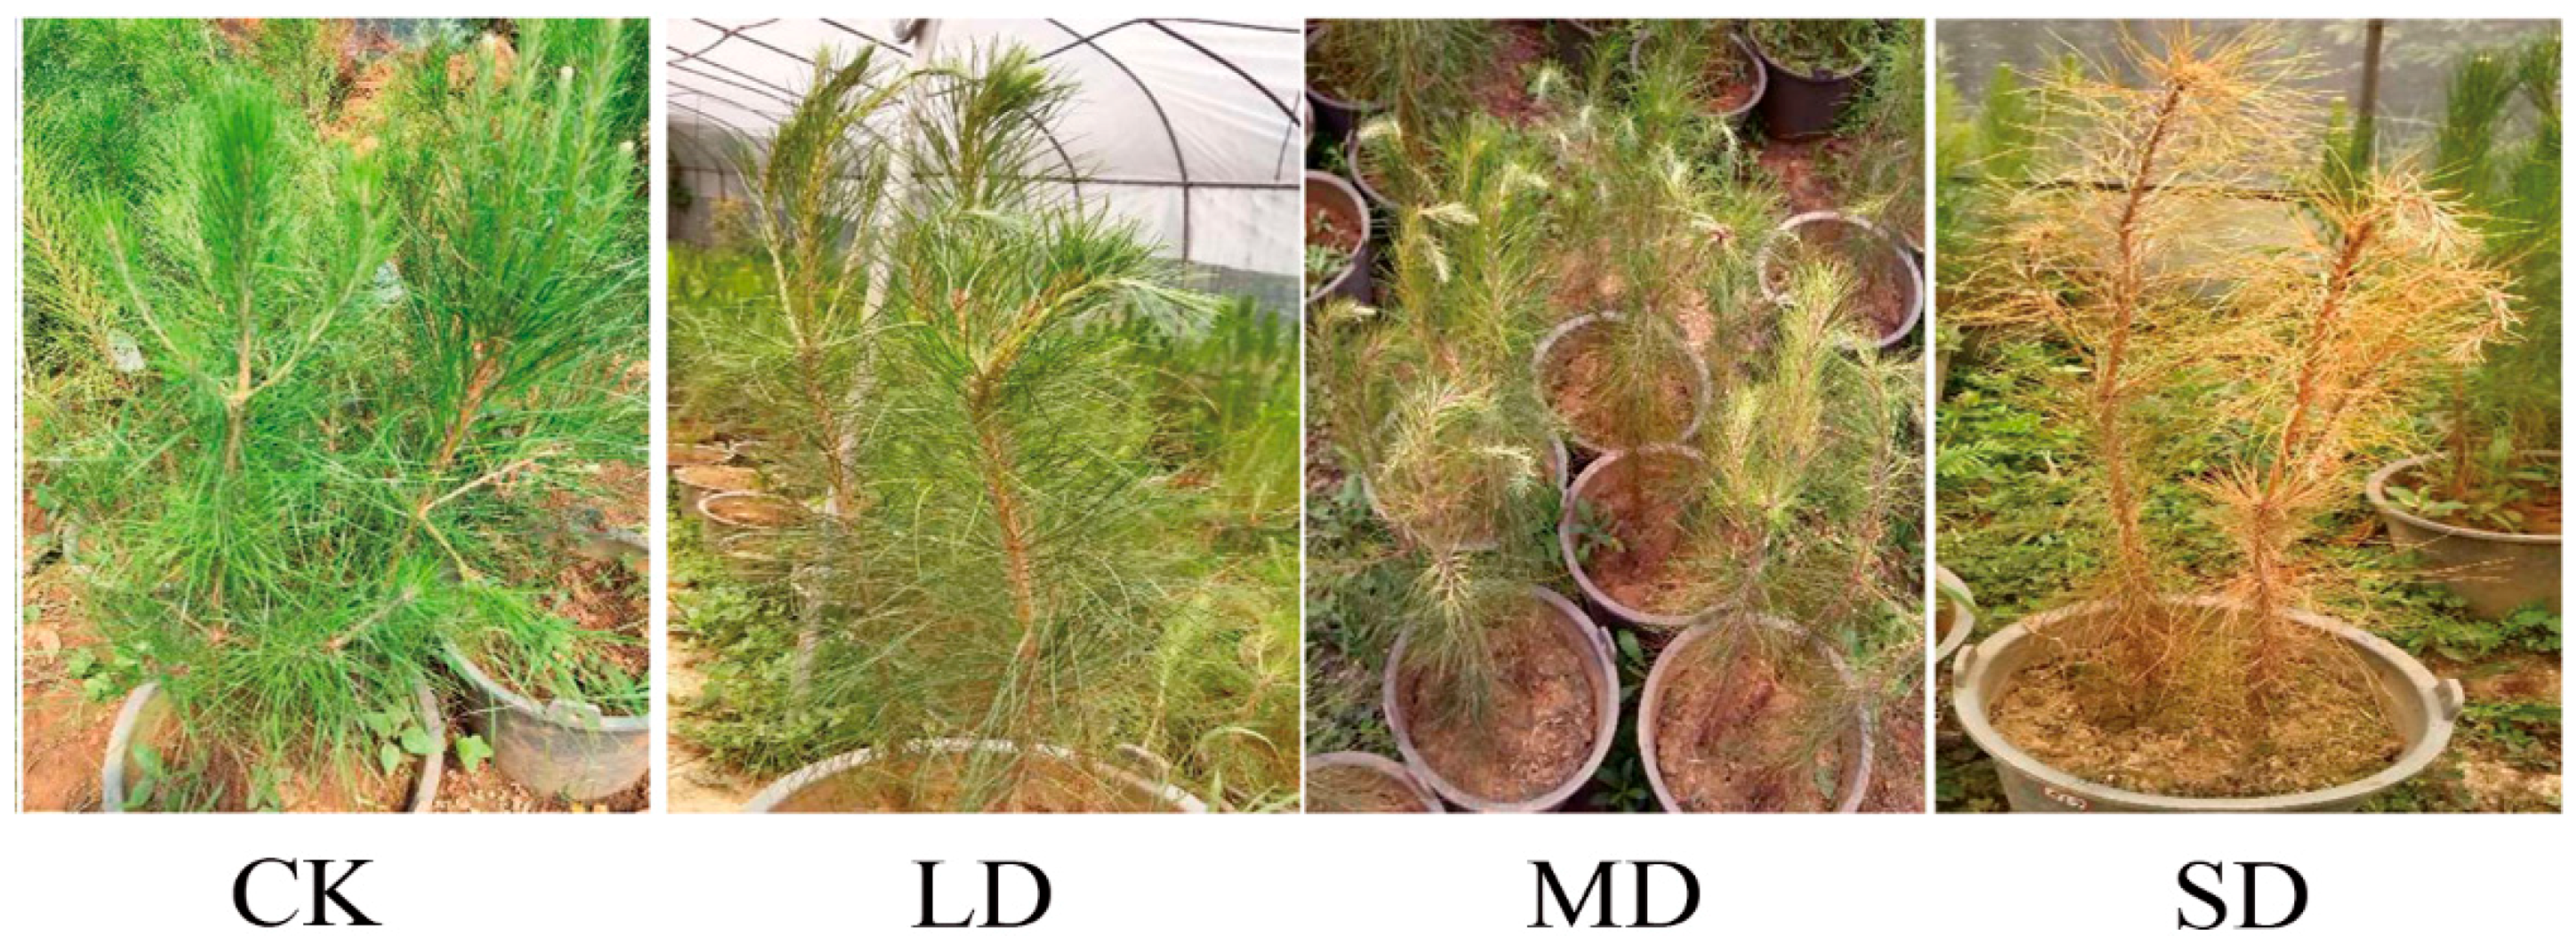
3.1. Variations in Phenotypes during Drought Stress

Seedling phenotypes were evaluated throughout the experiment (Figure 1). Although the well-watered control seedlings displayed normal growth, the shoot tips of seedlings showed mild wilt under LD, and the wilting became increasingly severe with increasing drought stress.

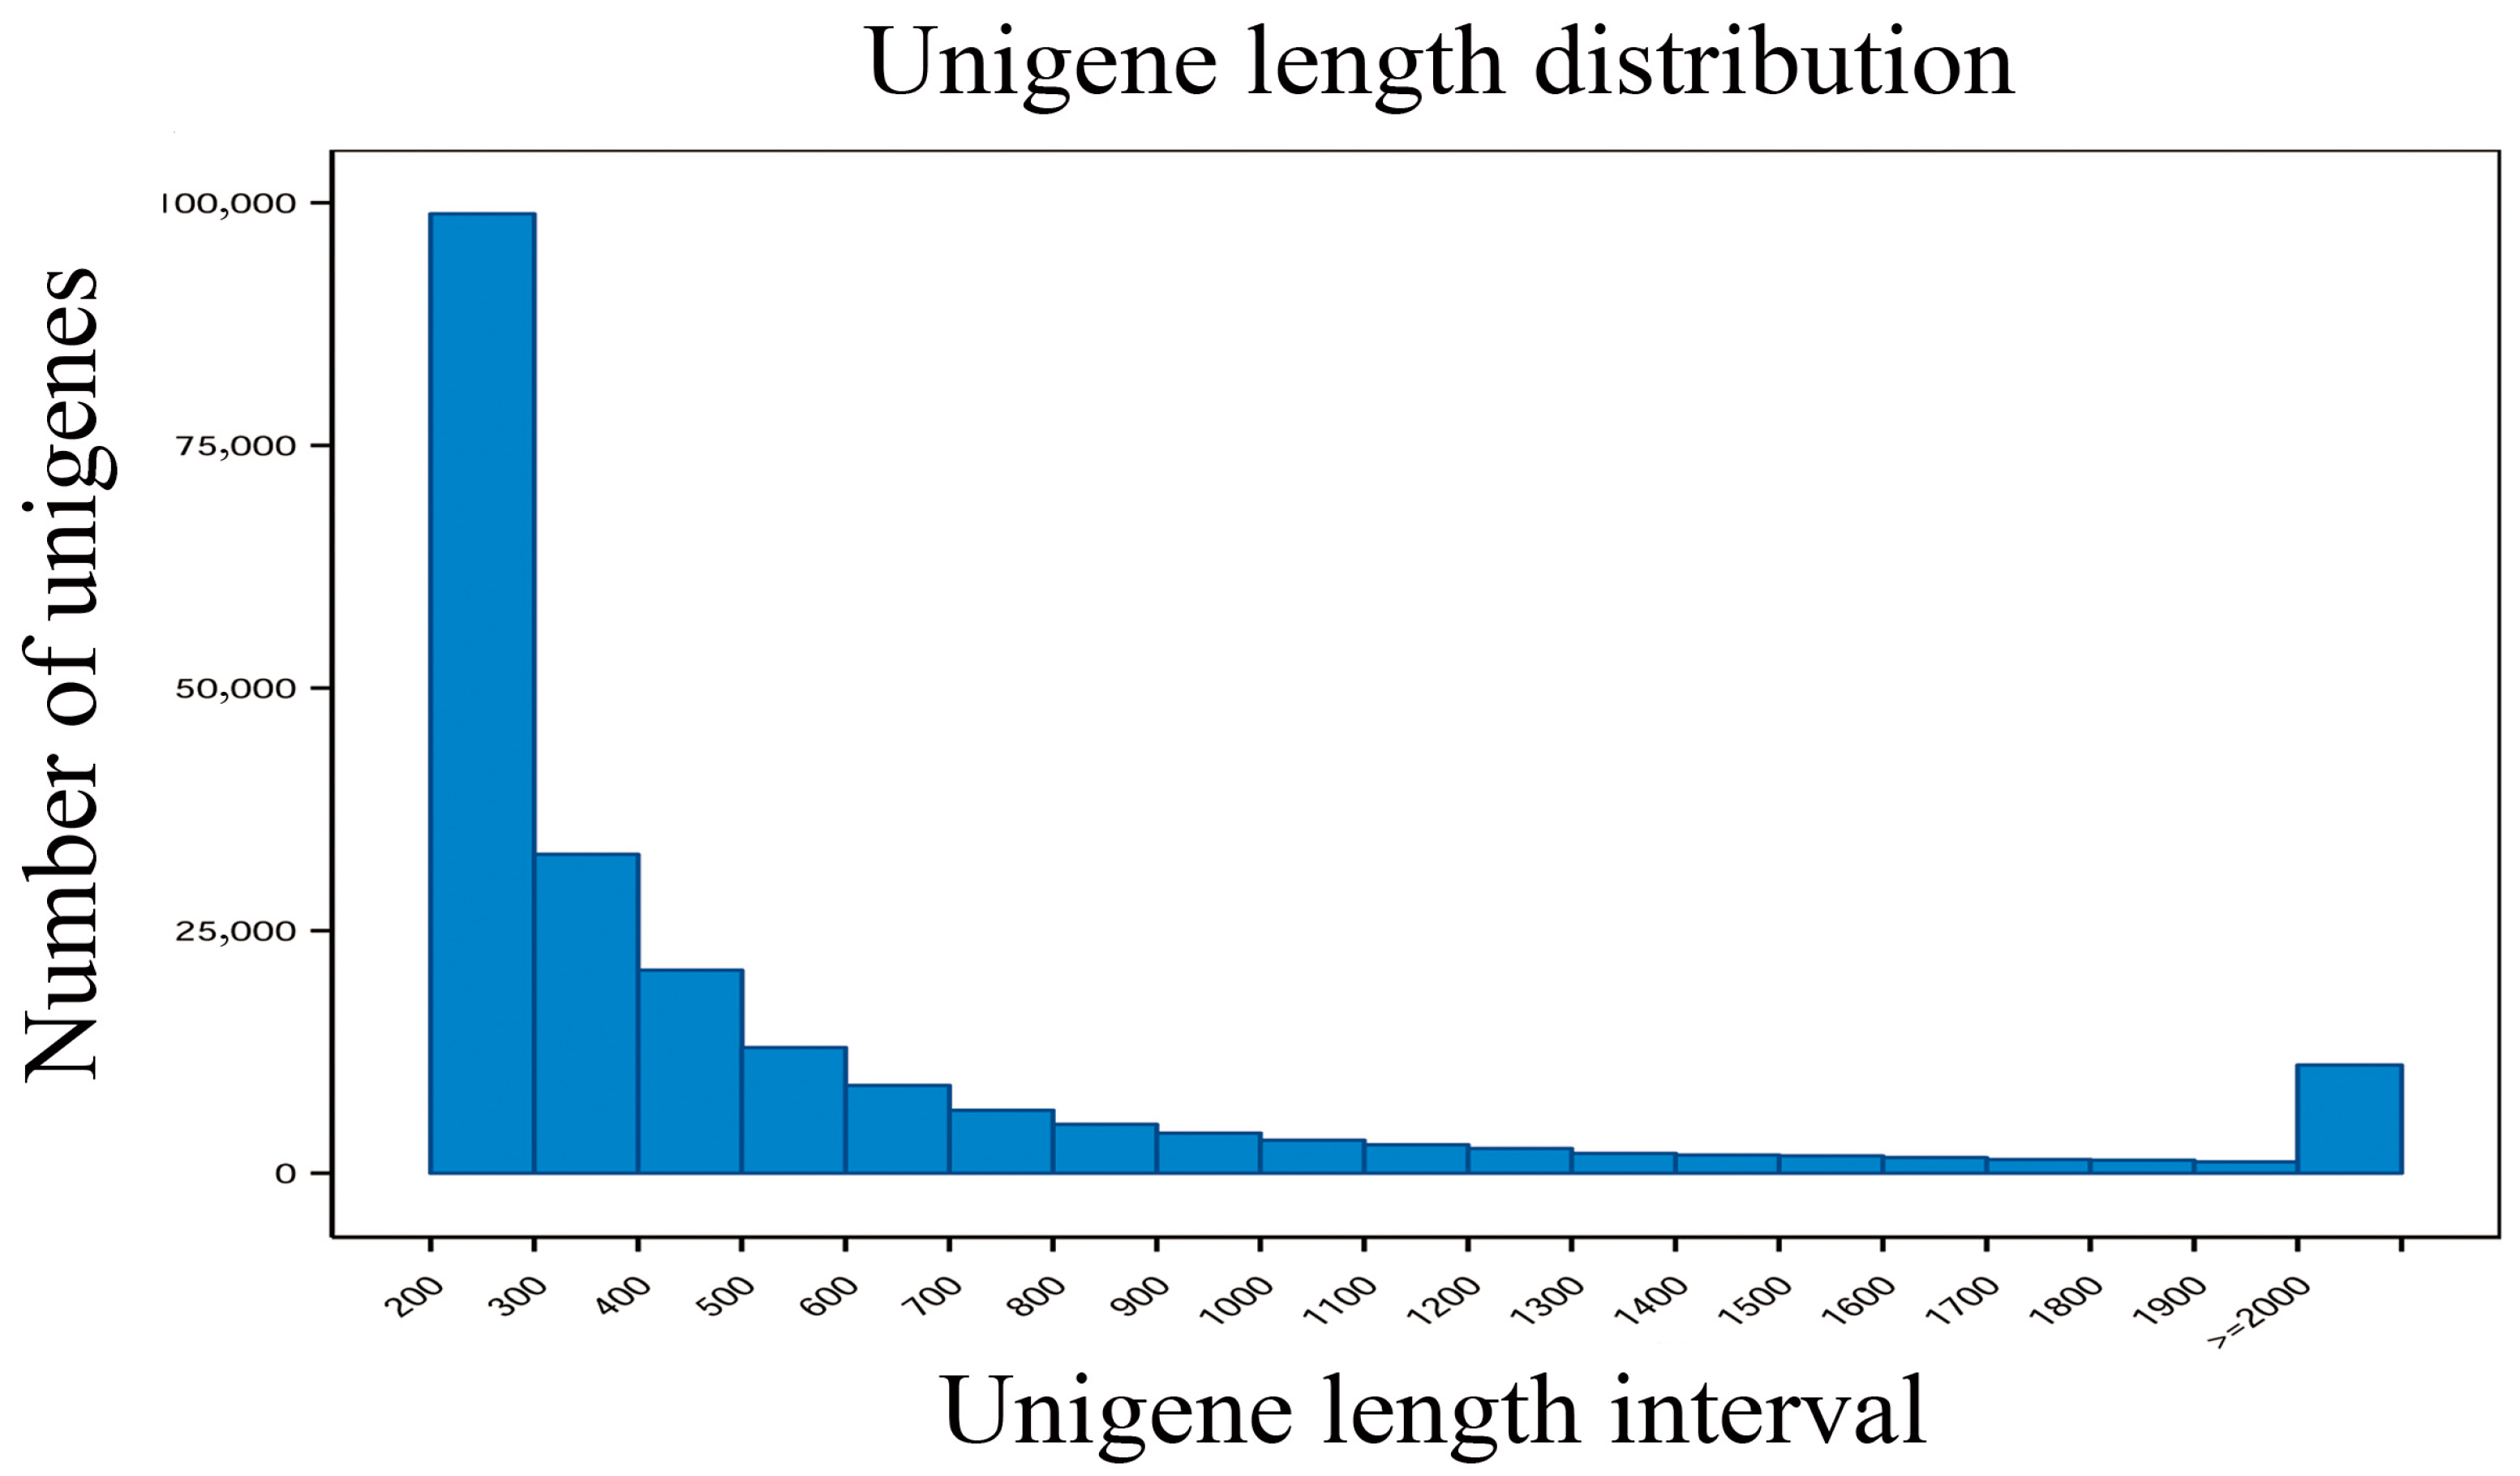
3.2. Transcriptome Sequencing and De Novo Assembly and Annotation

A total of 390,320,648 raw reads were generated to assemble 197,612 non-redundant unigenes, which had a length range of 201–15,800 bp, an N50 of 1227 bp, and an average length of 695 bp (Figure 2).
The sequenced unigenes were validated and annotated by alignment with public databases, including the NT (NCBI nucleotide sequences), NR (NCBI non-redundant protein sequences), Swiss-Prot (a manually annotated and reviewed protein sequence database), PFAM (protein family), GO, KEGG and KOG (EuKaryotic Orthologous Groups) databases (Table S2). Of the 197,612 unigenes, 66,825 (33.81%) and 49,085 (24.83%) had significant matches in the NR and NT databases, respectively. In addition, 64,943 (32.86%), 35,880 (18.15%), and 30,882 (15.62%) unigenes had annotations in the GO, KOG, and KO databases, respectively. A total of 101,806 unigenes (51.51%) were successfully annotated in at least one of the above databases, and 11,874 unigenes (6%) were annotated in all seven databases.

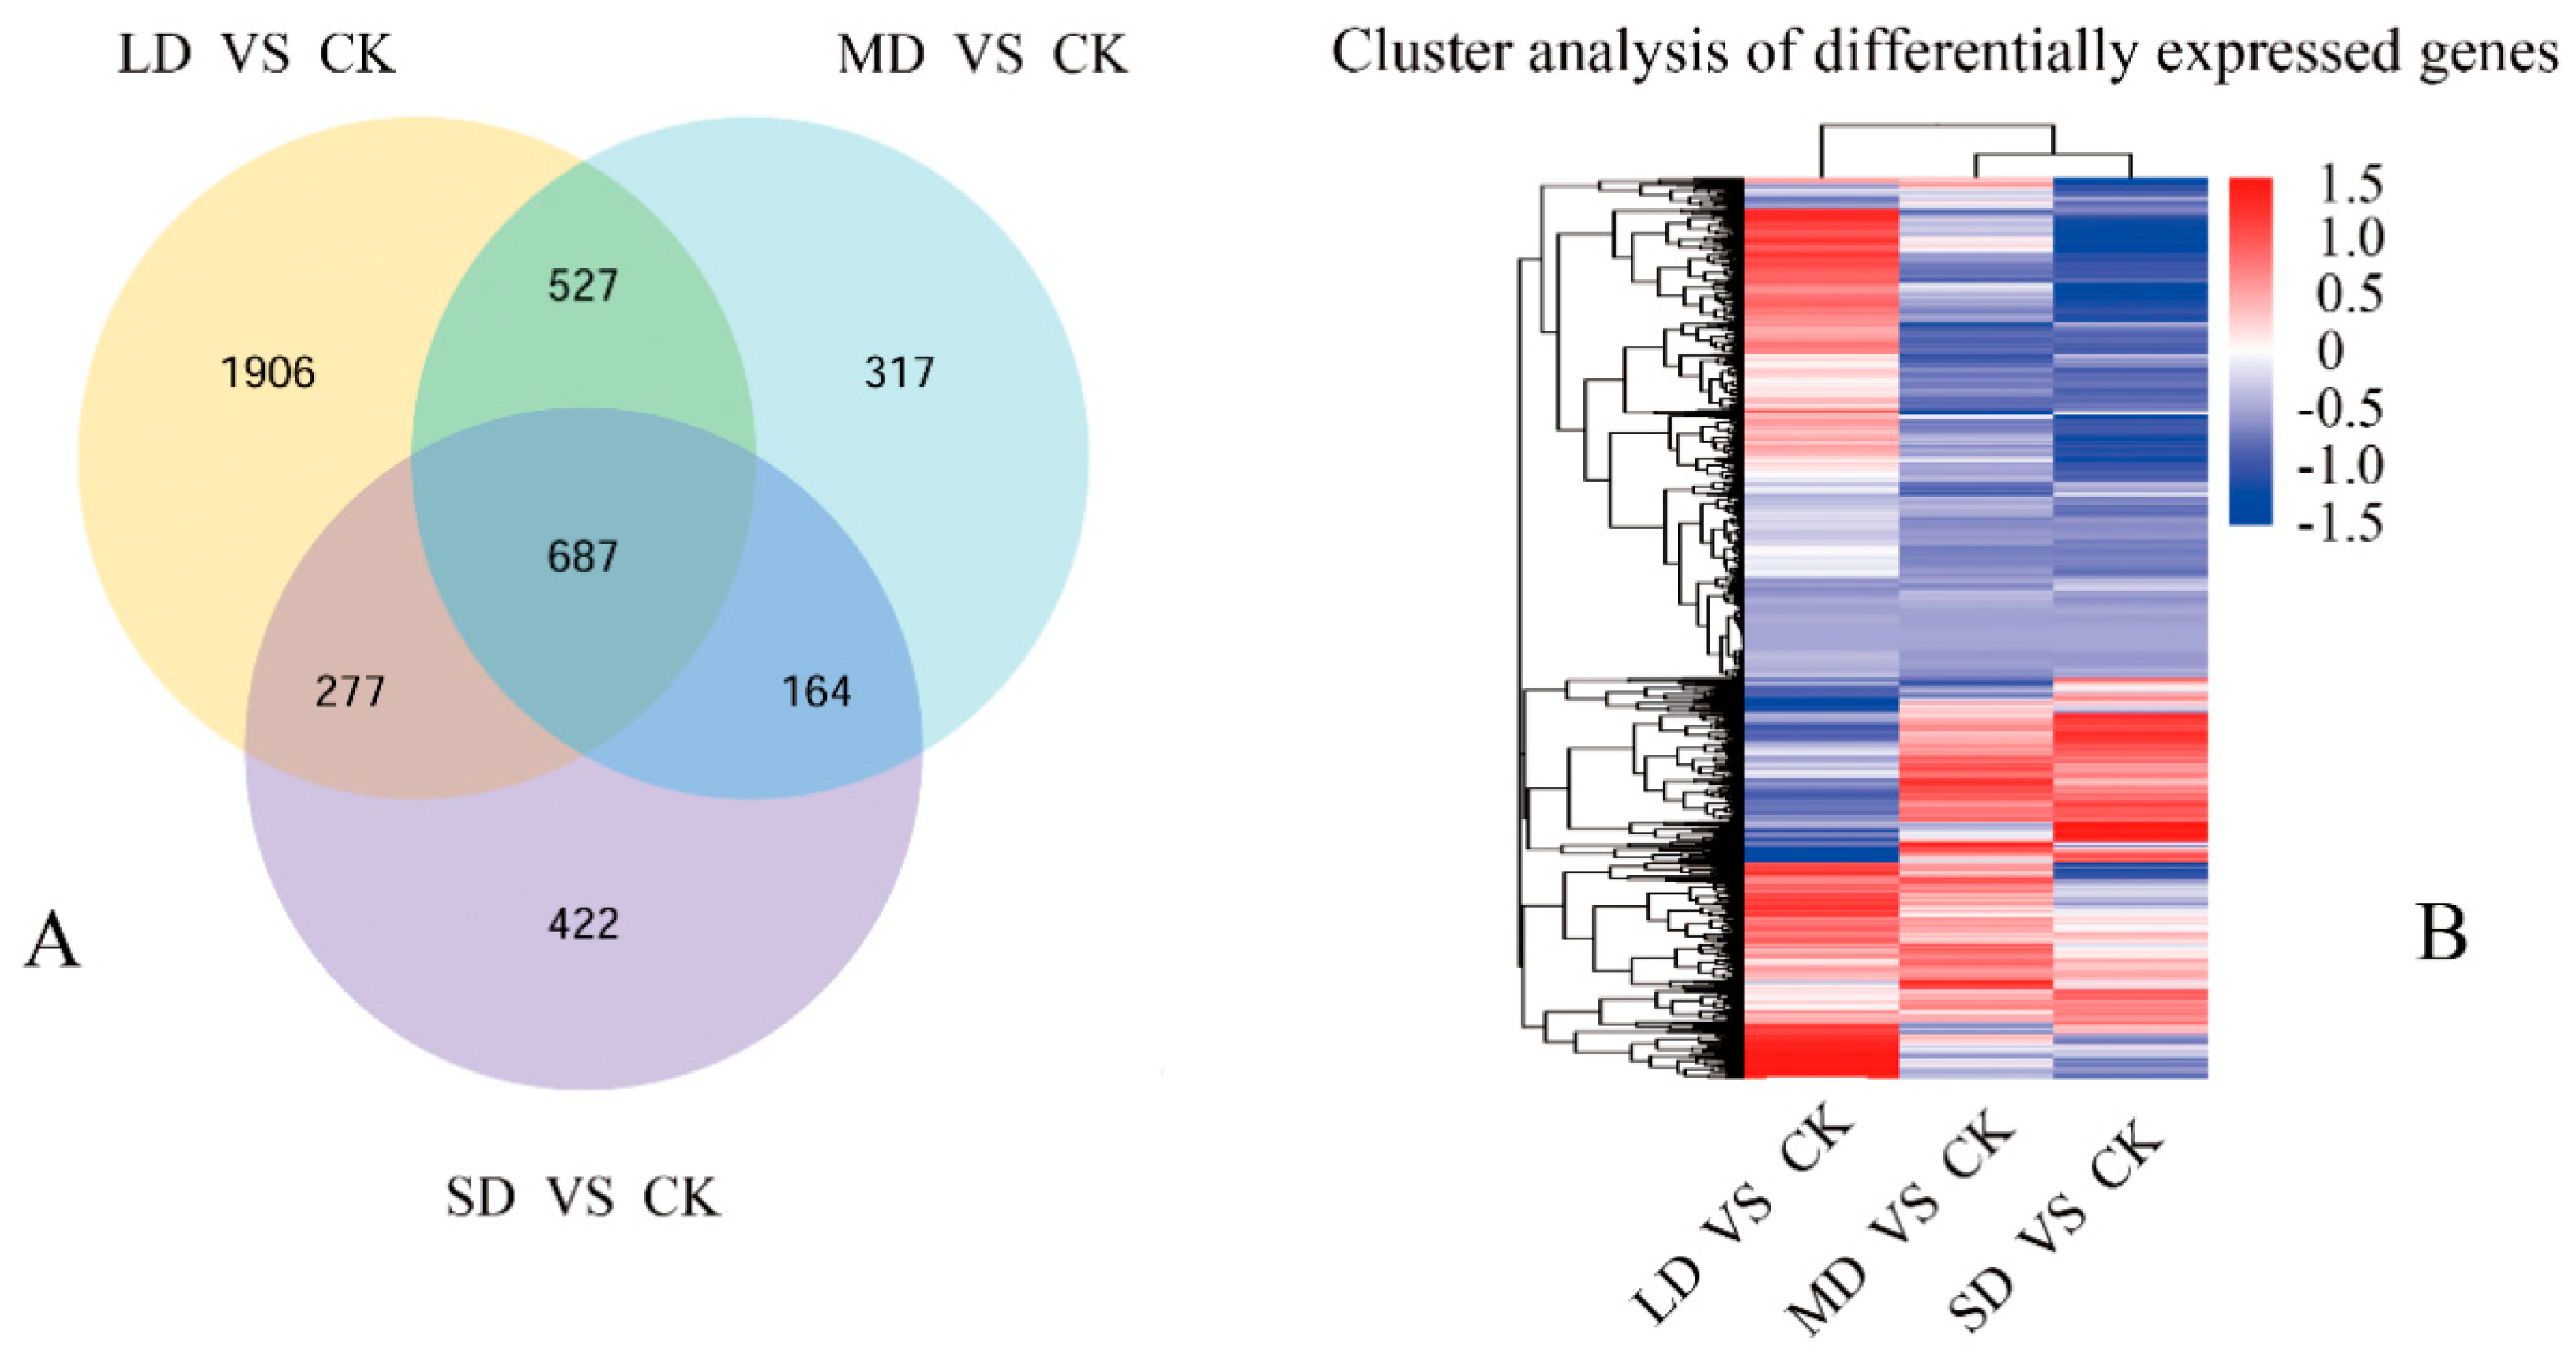
3.3. Exploration of Gene Expression in Seedlings under Drought Stress

To elucidate the molecular activities that occurred across the different water content conditions, differential expression analyses were performed on samples collected from the three treatments (LD, MD and SD). In total, 4300 genes were differentially expressed (q ≤ 0.05) between the samples from the three drought treatments and the well-watered control samples (Table S3). Of these, 3397, 1695 and 1550 genes were differentially expressed between the LD and CK, MD and CK, and SD and CK treatments, respectively (Table S3). Among the DEGs, 1656, 611 and 651 were found to be up-regulated (q ≤ 0.05) in the LD, MD and SD treatments, respectively, and 1741, 1084 and 899 were found to be down-regulated (q ≤ 0.05) in the LD, MD and SD treatments, respectively (Table S3, Figure 3).
The overlap among these comparisons showed that 687 genes were identified as differentially expressed under the three drought conditions (Figure 3). Of these, only 341 unigenes were identified by GO analysis, whereas 209 unigenes had no known function (Table S3). Among the former, 156 unigenes were annotated in the biological process category and were linked to signal transduction, defense response, transcriptional regulation, photosynthesis, transmembrane transport, biosynthetic processes, metabolic processes, oxidation-reduction processes, and protein phosphorylation. Our findings suggest that these biological processes may participate in the drought response.

3.4. Gene Ontology Enrichment Analysis

Enrichment analysis of GO terms derived from DEGs after drought stress was conducted to reveal the GO terms that were common among all drought samples and those that were unique to each drought sample (Table S4). Enriched (q ≤ 0.05) GO terms were observed in the foundation categories of metabolism, oxidation-reduction, and photosynthesis, and these terms were significantly over- or underrepresented in different drought stress treatments. These results suggest that the expression of proteins associated with these GO terms was strongly affected by drought. In the category of metabolism, differential representation was found for the molecular functions of chitinases, transferases, pectinesterases, peptidases, kinases, synthases, hydrolases, peroxidases, oxidases and catalytic activity. The enriched GO terms for biological processes included hormones, single-organism, chitin, amino sugar, starch, glucose and cellular carbohydrate. It is noteworthy that lipid, cellular lipids, isoprenoids and glycosylation were affected in the lipid metabolism category, suggesting that changes in membrane lipids may have occurred. In the oxidation-reduction category, the following GO terms were significantly overrepresented: biological processes of oxidation-reduction and the molecular functions of oxidoreductase activity, including acting on peroxide as an acceptor, acting on the CH-OH group of donors, acting on paired donors, acting on single donors with the incorporation of molecular oxygen, and incorporation or reduction of molecular oxygen. These findings indicated that oxidation-reduction reactions and oxidoreductase activity were enhanced. In the categories related to photosynthesis, the down-regulated GO terms included the biological process photosynthesis and the cellular components of photosystem, photosystem I, photosystem I reaction center, photosystem II and photosystem II oxygen-evolving complex, indicating that photosynthetic functions were inhibited. Not unexpectedly, GO terms for biological processes that occur in response to stress (obsolete peroxidase reaction and response to oxidative stress) and negative regulation of catalytic activity and molecular function were highly enriched. Enriched GO terms for molecular function included chitin binding, ion binding, heme binding, ribonucleotide binding, tetrapyrrole binding and ADP binding. In the category of cellular components, the three major enriched GO terms were cell wall, apoplast, and external encapsulating structure.
Certain enriched GO terms were discovered only for a particular level of drought stress, suggesting that proteins with important specific functions are expressed in response to specific level of drought stress (Table S4). First, several phosphorylation-related GO terms were specifically enriched among the DEGs that were down-regulated under LD relative to CK, including phosphorylation, protein phosphorylation, phosphate-containing compound metabolic process, and phosphorus metabolic and modification process. Second, the GO terms for transport, including drug transport, drug transporter activity, drug transmembrane transport, and drug transmembrane transporter activity, were enriched only among the DEGs that were up-regulated under MD relative to CK. Finally, the GO terms for carbon utilization, obsolete electron transport, and electron carrier activity were enriched only among the genes that were down-regulated under SD relative to CK. Taken together, the results show that many of the GO functional categories found to be enriched were significantly inhibited in the drought-stressed seedlings.

3.5. KEGG Pathway Enrichment Analysis

The KEGG pathways that were enriched in the DEGs were analyzed to reveal the specific pathways involving the DEGs that were responsive to drought stress (Table S5). The four pathways of plant hormone signal transduction, photosynthesis, phenylalanine metabolism and phenylpropanoid biosynthesis were enriched (q ≤ 0.05) under every drought treatment. Among these pathways, plant hormone signal transduction, phenylalanine metabolism, and phenylpropanoid biosynthesis were enriched among the up-regulated DEGs, whereas photosynthesis was enriched among the down-regulated DEGs. These results indicate that drought stress induced the signal transduction of plant hormones, which had strong effects on biosynthesis and metabolism and led to a severe decline in photosynthesis.
In addition, certain pathways enriched by DEGs occurred under the various drought treatments (Table S5). For example, enrichment of DEGs associated with the pathways of amino sugar and nucleotide sugar metabolism, circadian rhythm-plant and plant–pathogen interaction first appeared in LD samples; enrichment of DEGs associated with the pathways of NF-kappa B signaling and glutathione metabolism first appeared in MD samples; and enrichment of DEGs associated with the pathways of carbon metabolism, chemical carcinogenesis, and drug metabolism-cytochrome P450 appeared only in SD samples.

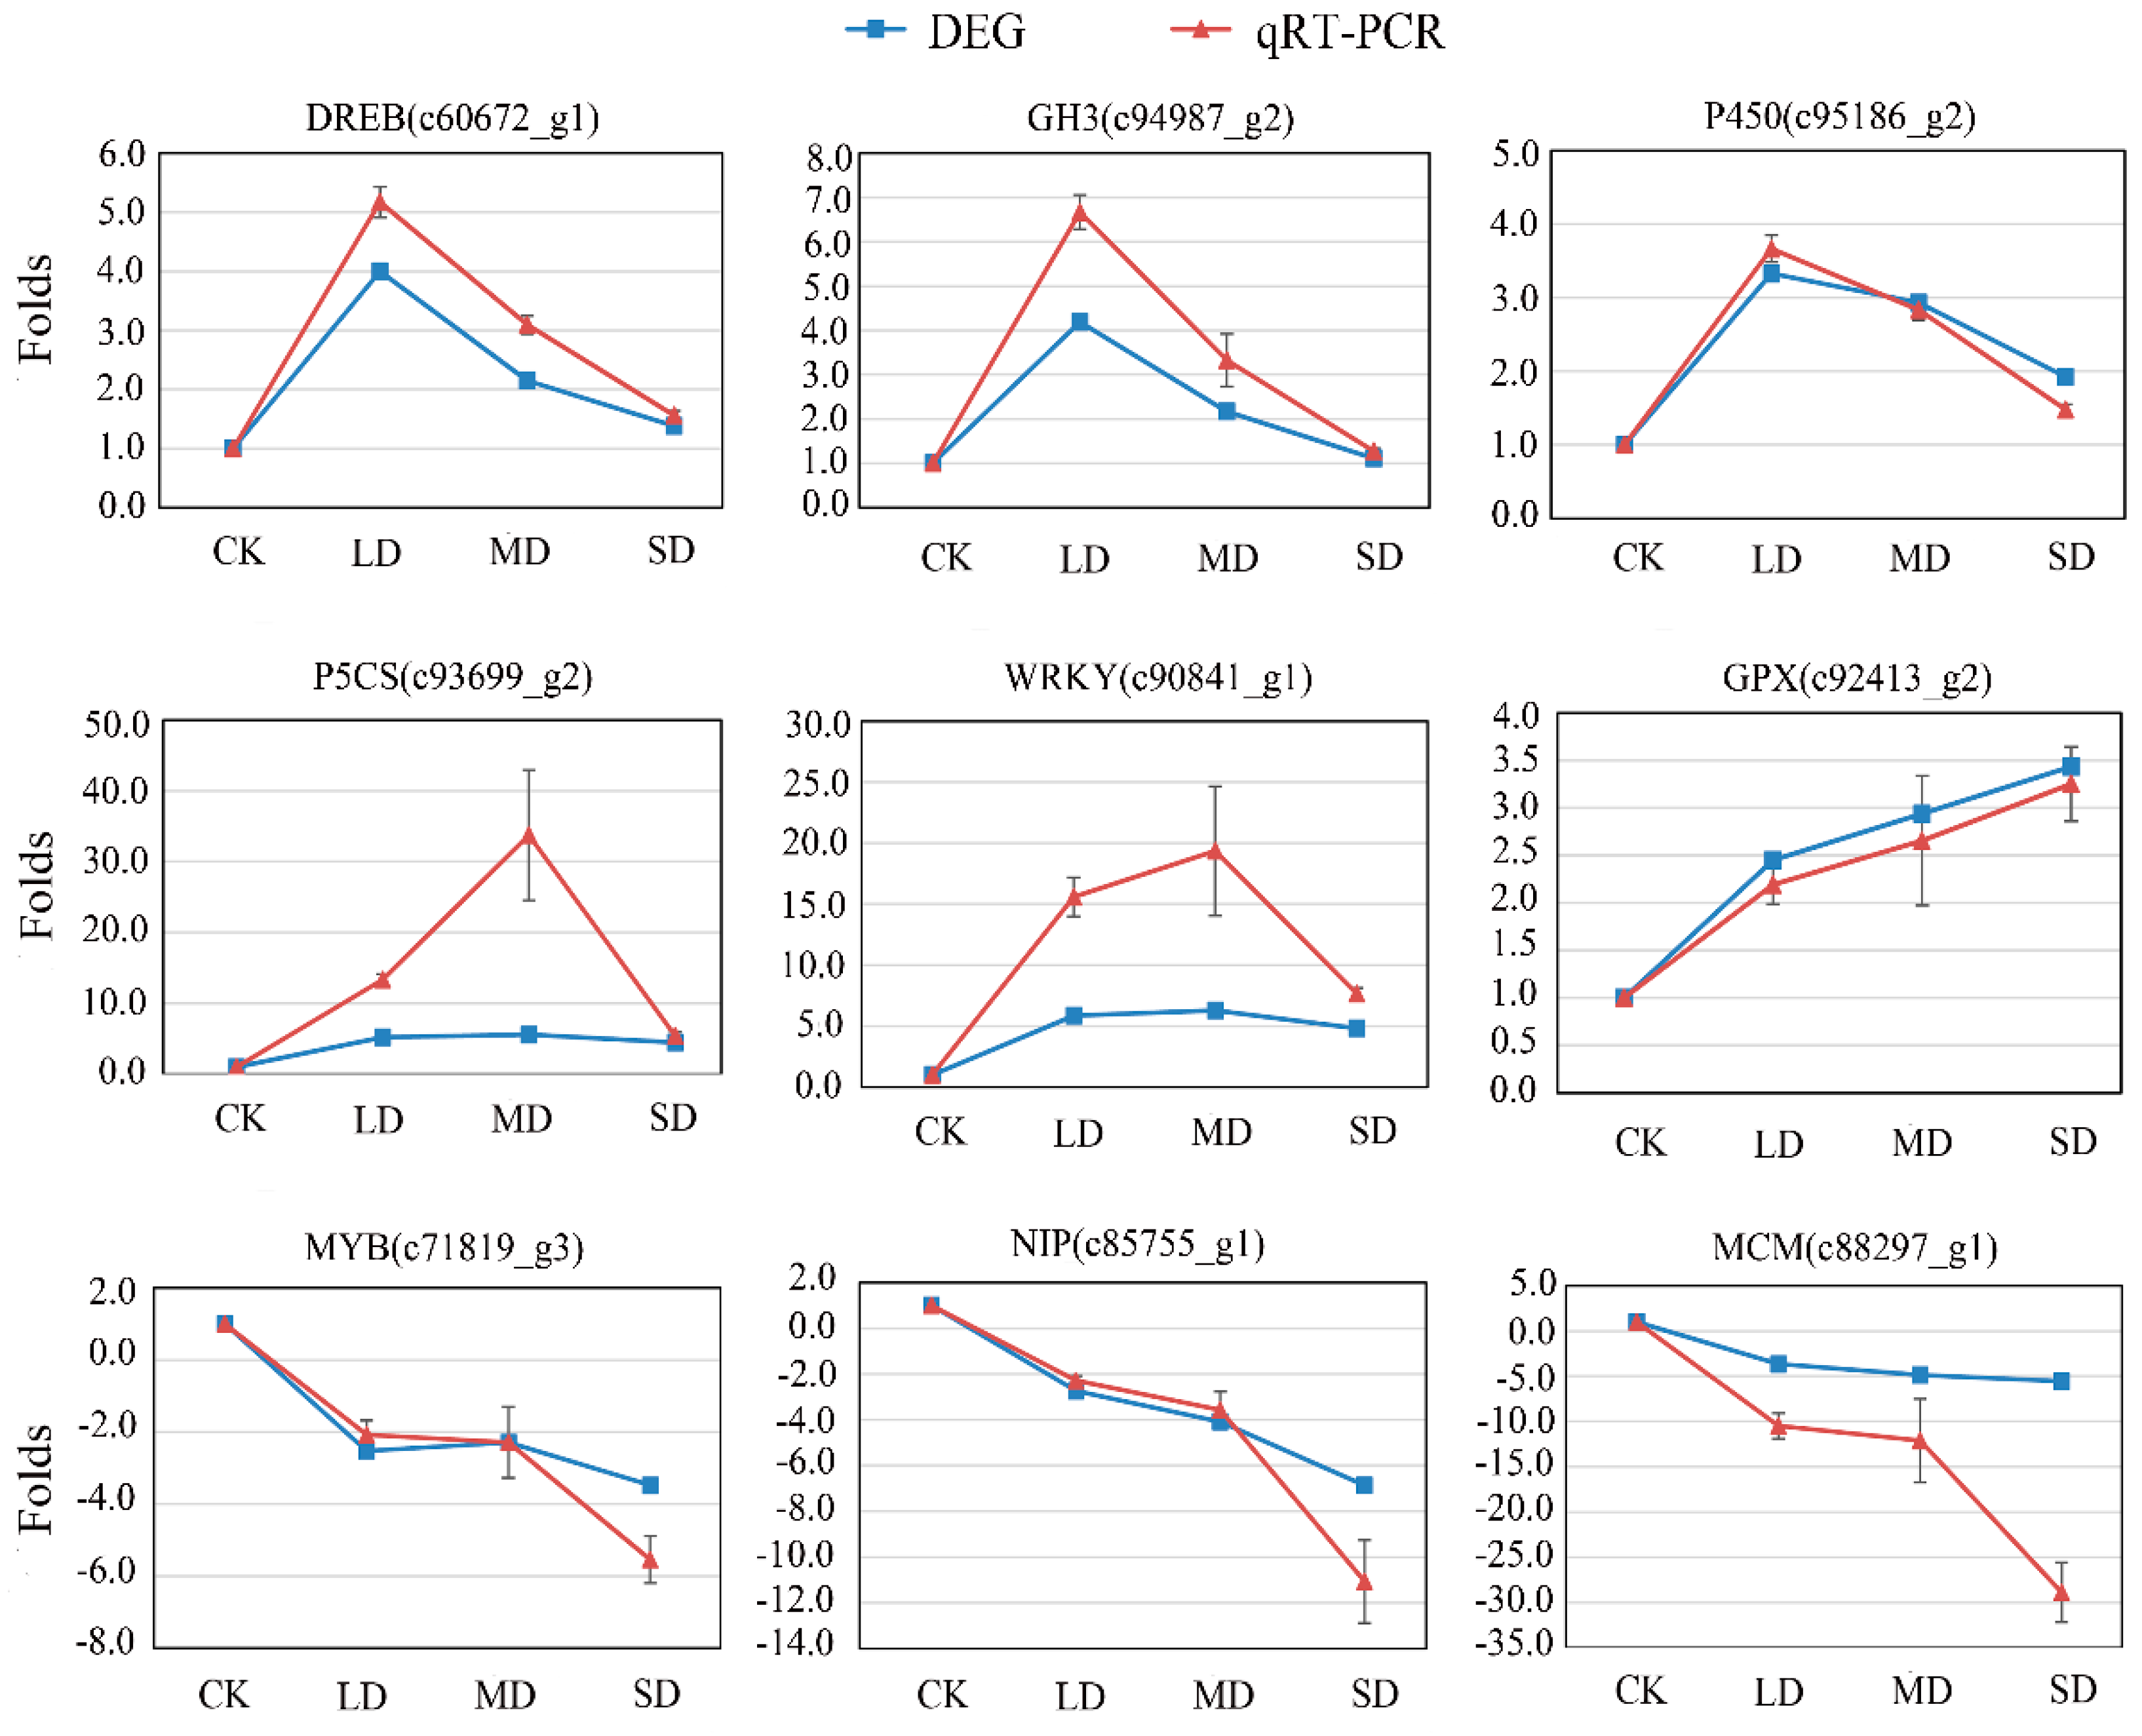
3.6. Validation by qRT-PCR

To verify the reliability of the RNA-Seq data, nine drought-responsive unigenes showing significant up- or downregulation in the drought seedlings were randomly chosen for qRT-PCR analysis (Figure 4). Among them, three unigenes (MYB (c71819_g3), NIP (c85755_g1), and MCM (c88297_g1)) showed constitutively down-regulated expression, and one unigene (GPX (c92413_g2)) showed constitutively up-regulated expression with increasing drought stress; five unigenes (DREB (c60672_g1), GH3 (c94987_g2), P450 (c95186_g2), P5CS (c93699_g2) and WRKY (c90841_g1)) were up-regulated under LD, MD and SD, the relative expression levels of these unigenes were higher under LD than under MD and SD. These results indicated that nine unigenes were induced by drought stress, which could assist in revealing the response to drought stress in Masson pine. For six of the unigenes (DREB, GH3, P450, GPX, MYB, and NIP), the qRT-PCR results closely matched the RNA-Seq results. The other three unigenes (P5CS, WRKY, and MCM) showed similar trends in expression, but the fold change in expression indicated by RNA-Seq was lower than that indicated by qRT-PCR. Overall, the unigene expression trends revealed by the RNA-Seq data and the qRT-PCR analysis were similar, showing that the results of the RNA-Seq analyses were valid.

4. Discussion

In this study, we observed that the tips of the seedlings were slightly wilted under LD. The observed phenotypic changes were considered together to assist in characterizing transcriptional responses and revealing the defense response to drought stress in conifer trees.

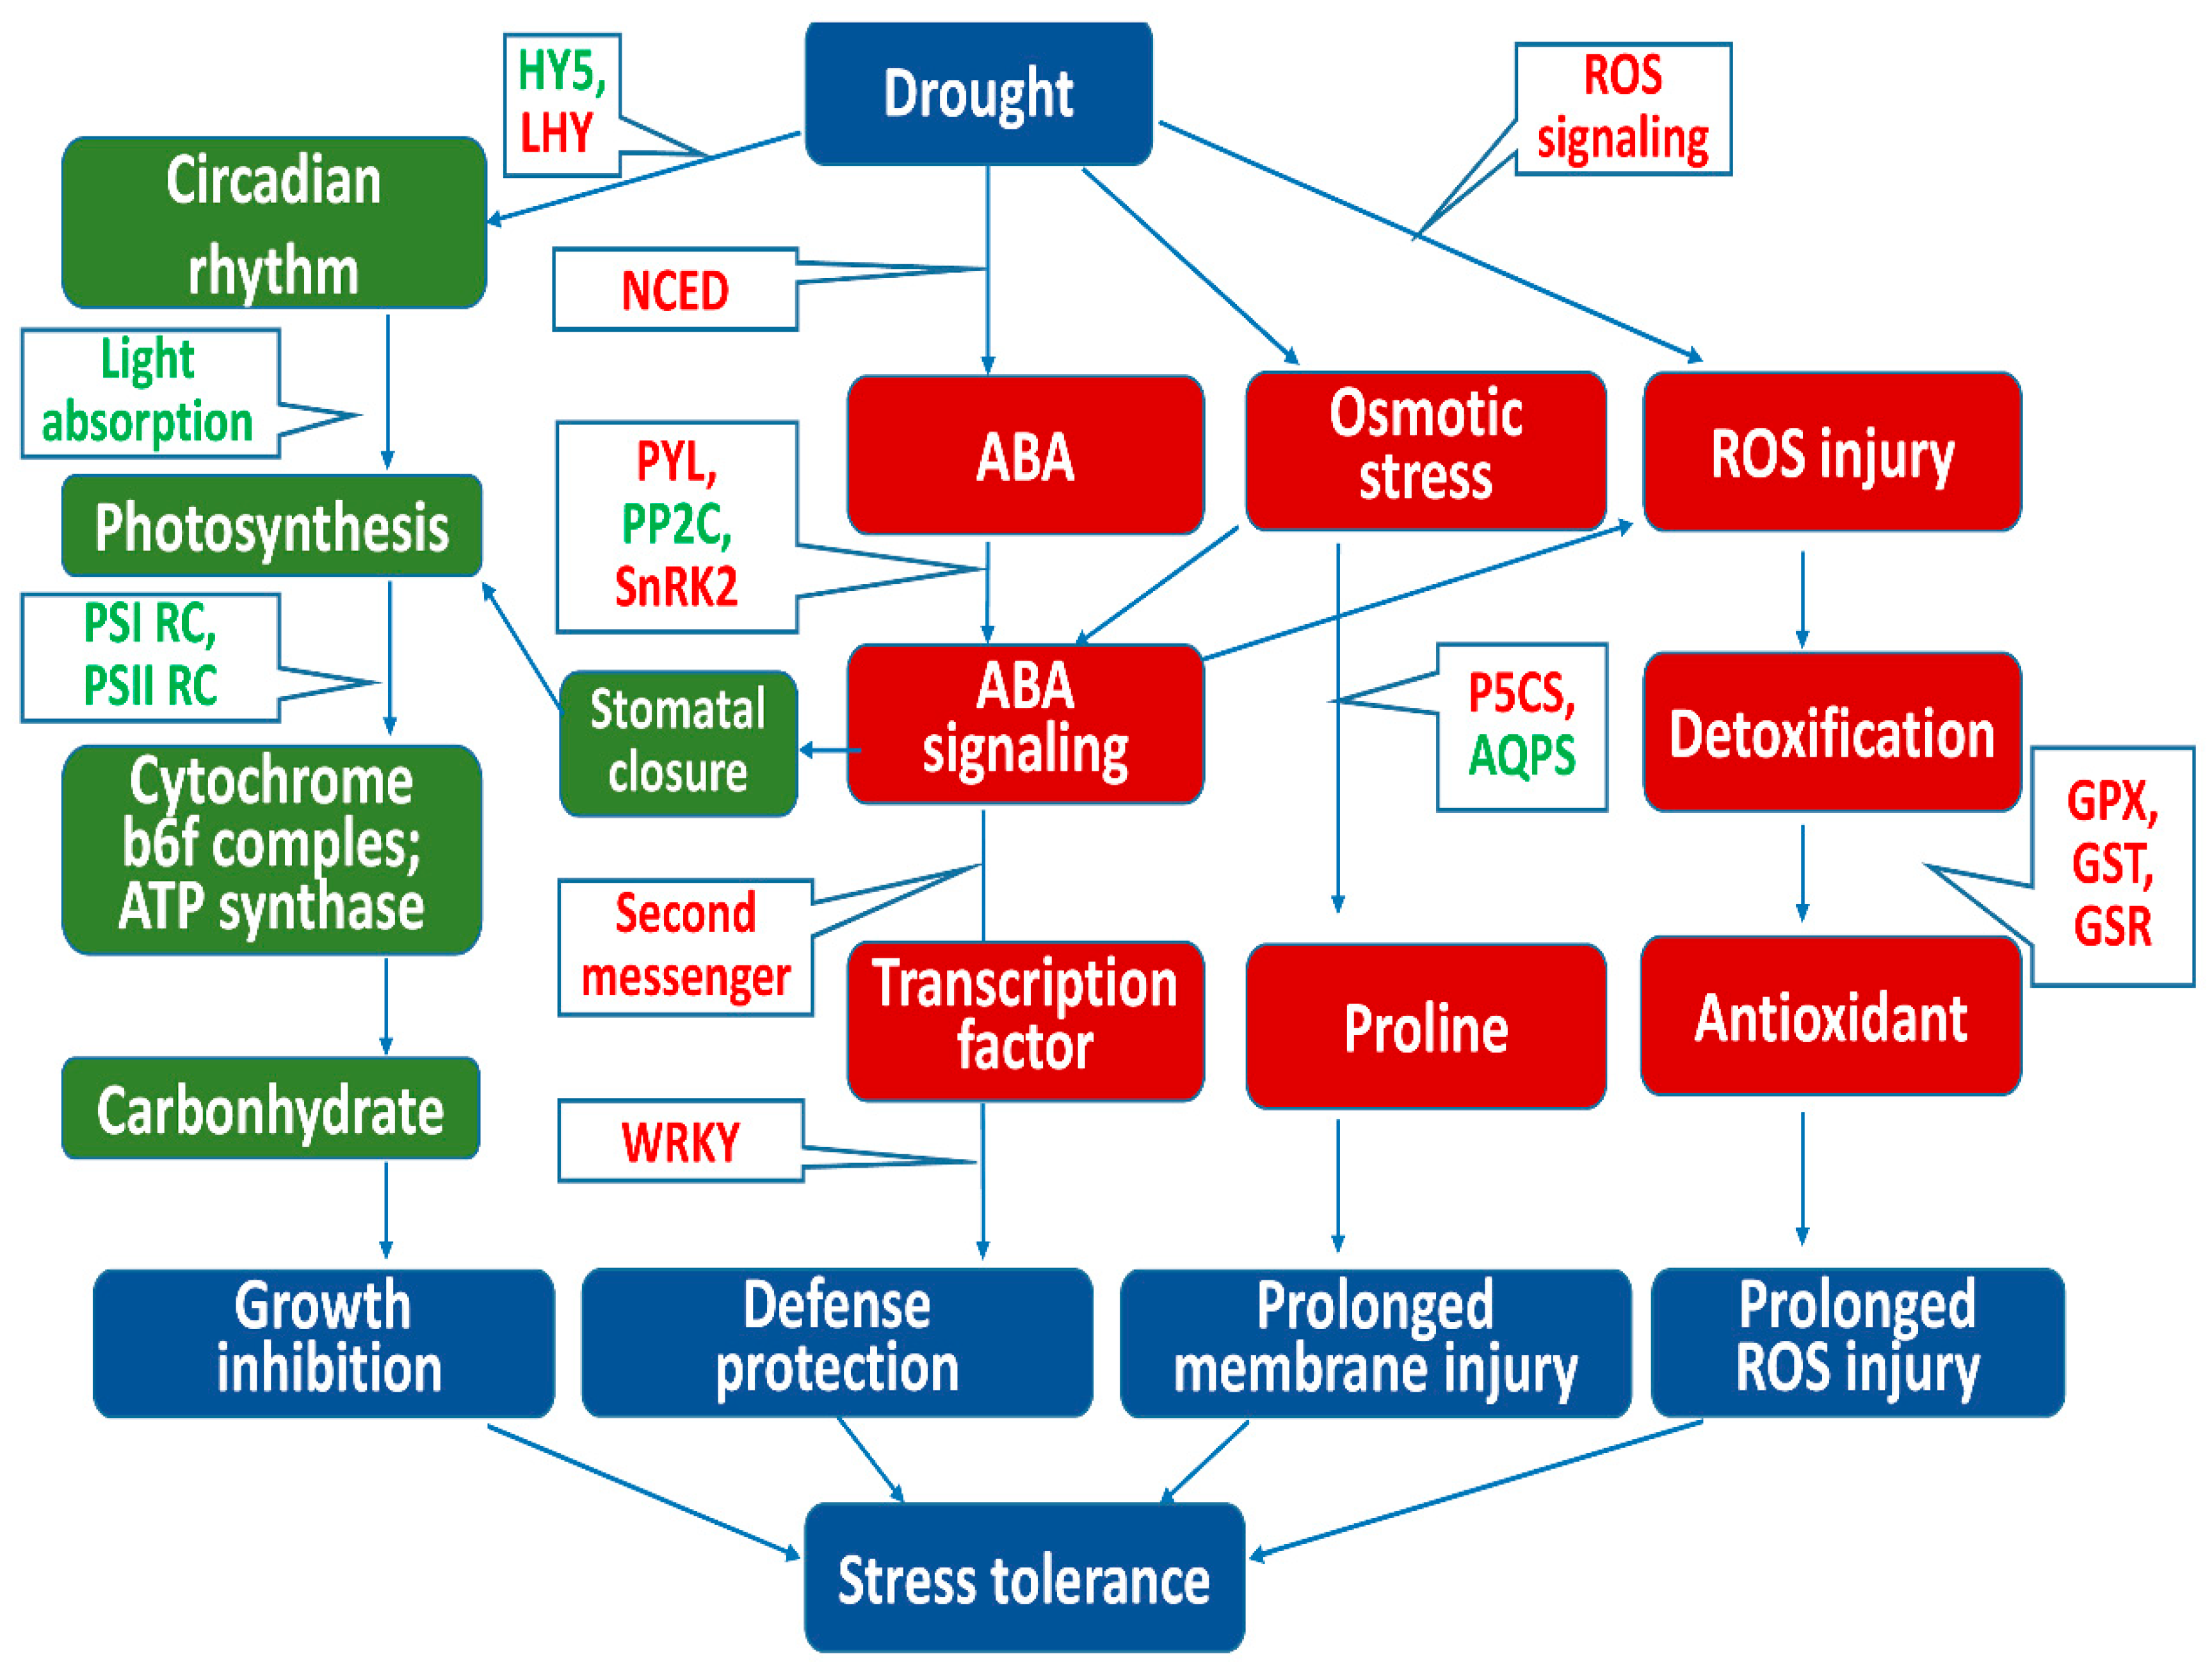
4.1. Resistance to Osmotic Stress at Each Level of Drought Stress

Osmotic adjustment is believed to be an adaptation to drought stress, as observed in many studies of drought-tolerance mechanisms [5]. In the present study, the P5CS (pyrroline-5-carboxylate synthase) gene (c93699_g2), which plays a role in stabilizing membranes and proteins under osmotic stress in pine [5,6], was found to be up-regulated in each drought treatment. It has been reported that the proline content is increased with increasing severity of drought conditions in this elite pure line [9]. These results suggested that Masson pine exhibits a strong capacity for osmotic adjustment via the accumulation of proline to reduce the effects of osmotic stress caused by drought.
In addition, AQPs (aquaporins) are the main membrane proteins that regulate osmotic pressure in water transport [5]. However, AQPs play complex roles due to their disparate functions and expression patterns in the response to drought stress. Under drought conditions, AQPs are up-regulated in Phaseolus vulgaris [23] but down-regulated in pine [5]. Similar to the pattern observed in pine, in our study, three genes encoding AQPs (NIP, c85755_g1; PIP, c91691_g1; PIP, c101640_g1) were found to be constitutively down-regulated with increasing drought stress, suggesting that drought suppresses the expression of AQPs depending on the time and degree of stress. This response reflects a mechanism of water conservation via down-regulation of AQP expression to reduce membrane permeability, resulting in the minimization of water flux and scatter in the aboveground parts of Masson pine.

4.2. Transcription Factors Responding to Stress Signals under Light Drought

TFs play a key role in regulating downstream genes involved in adversity stress responses. In this study, 142 transcription factors (TFs) were identified to be differentially expressed (q ≤ 0.05) under drought stress, 87 were up-regulated and 55 were down-regulated (Table S6). Most of these TFs belong to the AP2/EREBP, MYB, WRKY, NAC, and HD-ZIP families. Importantly, some of the induced TFs were enriched in KEGG pathways involved in responses to environmental and physiological signals under light drought (LD).
The enriched KEGG pathway “circadian rhythm-plant” (ko04712) was linked to three TFs: one HY5 gene (c84637_g1) and two LHY genes (c85168_g1 and c91081_g2), which were down-regulated and up-regulated, respectively, under LD but showed no variation under MD and SD, indicating that HY5 and LHY were induced by light drought. HY5 is a bZIP TF that links hormone and light-signaling pathways [24], which play a part in promoting the photomorphogenesis of A. thaliana [25], and negatively regulates light-signaling pathways [26]. Another LHY protein, a TF that is closely related to MYB, is the central oscillator component of the light input pathway [27]. Cañas et al. [11] reported that the LHY gene of P. pinaster, which shows higher expression, might reflect an adaptation to light conditions rather than a transcription factor that functions to regulate diurnal rhythm. However, another analysis in Fraxinus mandshurica demonstrated that the LHY promoter has a pivotal role in initiating systemic responses to adverse stress [28]. According to these studies, it was suggested that HY5 and LHY might be key TFs in the light-signaling network that regulates the circadian rhythm in response to light drought stress in our study. This hypothesis remains to be validated in further studies; however, our findings provide insight into the potential mechanisms of circadian rhythmic gene expression activation associated with coniferous drought conditions.
In addition, we found that four unigenes in the “plant hormone signal transduction” pathway (ko04075), encoding the TFs ERF (c76570_g1), ARF (c83733_g1), and IAA (c77087_g1 and c92989_g1), were significantly up- or down-regulated. ERF, belonging to the AP2 family, is involved in DNA binding, and overexpression of ERF/AP2 has been confirmed to improve plant tolerance to drought in transgenic Virginia pine [29]. In our study, the expression of ERF/AP2 was constitutively up-regulated expression with increasing drought stress, with overexpression under LD versus CK, MD versus LD, and MD versus LD. These results suggest that AP2/ERF is induced by drought stress, and it might enhance drought tolerance in Masson pine. Moreover, several studies have reported that ARF regulates the expression of auxin response genes in conjunction with Aux/IAA repressors [30] and that Aux and IAA function as auxin-induced repressors and modulate the activity of DNA-binding ARFs [31]. Our results indicate that the expression of two IAA genes and an ARF gene were constitutively down-regulated expression with increasing drought stress, with marked repression in the LD versus CK and MD versus LD conditions. It appears that Aux/IAA and ARF may inhibit one another upon the onset of light drought, indicating that TFs related to growth and development in Masson pine needles begin to be inhibited upon light drought. This finding differs from a previous report showing that water stress increased IAA concentrations, thereby inducing epinastic growth in radiata pine [32]. However, the finding agrees with our previous study in which drought stress resulted in significant growth reduction in the aboveground portions of Masson pine, whereas the root growth and root–shoot ratio both significantly increased [9]. The results indicate a growth strategy to reduce aboveground growth and increase root growth, which favors water absorption from the soil and contributes to the adaptation to drought stress [33].

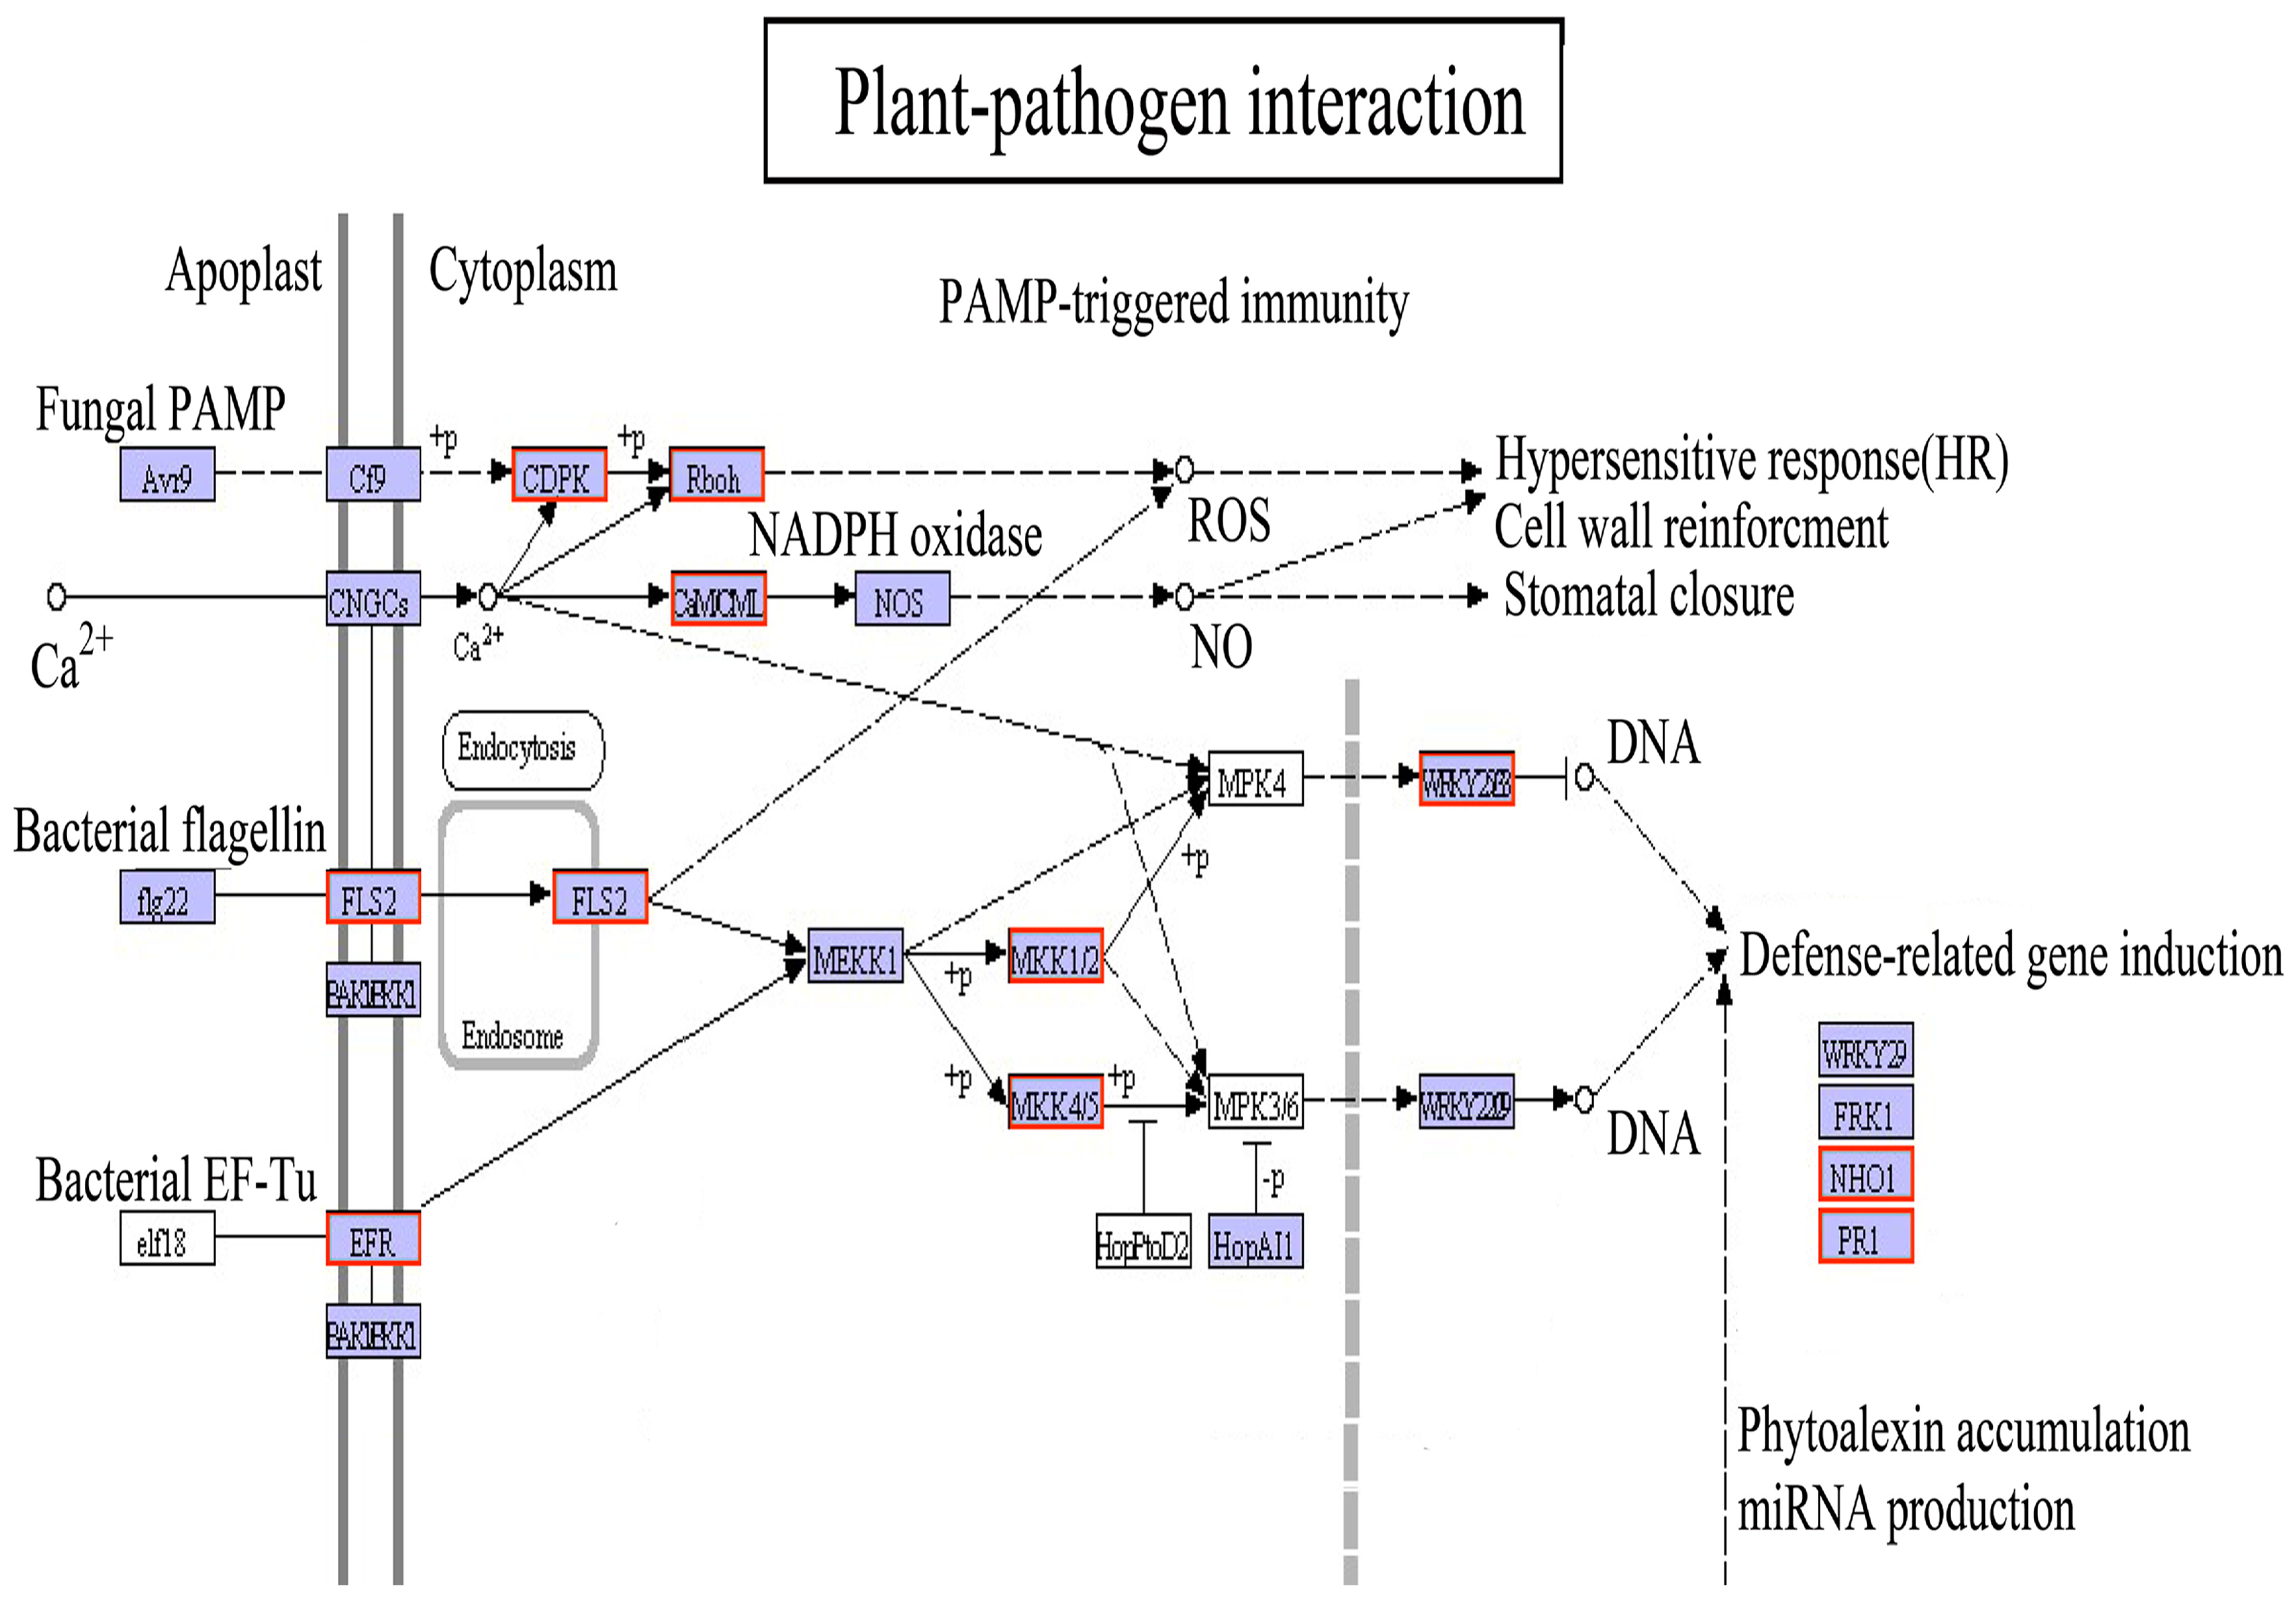
4.3. Defense Response of the Plant–Pathogen Interaction Pathway under Light Drought

The systematic defense response of plants under abiotic stress is an important resistance mechanism of coniferous forests [34]. In our study, the plant–pathogen interaction enriched pathway shown in Figure 5 was strongly activated in Masson pine seedlings under LD (ko04626). First, pathogenic signaling was transmitted to the cytoplasm by the recognition of FLS2 (flagellin-sensitive 2) and EFR (EF-TU receptor). Second, the PTI response was triggered and amplified. FLS2 and EFR were both up-regulated to activate the downstream gene encoding MEKK1 (mitogen-activated protein kinase kinase kinase 1); subsequently, MEKK1 signaling was enhanced to activate two separate pathways for the negative and positive regulation of immunity [35]. Finally, within the cell nucleus, defense-related genes, including one WRKY33 gene (c83644_g4), and its downstream pathogen-resistance genes NHO1 (glycerol kinase) and PR1 (pathogenesis-related protein 1) [36], were up-regulated. To date, WRKY TFs have occasionally been described as having a regulatory role in the defense of conifer species, although a regulatory role for WRKY has been more widely reported that overexpression of WRKY gene enhances the resistance to tolerance and pathogen infection to drought stress in Grapevine [37] and Horse gram [38]. Interestingly, our findings showed that the WRKY gene (c83644_g4) was up-regulated under LD, but showed no changes were observed under MD and SD, indicating that WRKY was induced upon light drought stress. These results provide evidence that WRKYs might play key roles in the signaling and transcriptional regulation of defense responses in Masson pine under mild drought stress.

4.4. ABA Response under Light and Moderate Drought Stress

The plant hormone ABA is known to have a core role in the modulation of plant adaptation to drought stress [39]. Although ABA biosynthesis, signaling and responses are considered to be closely related to drought-resistance mechanisms in plants [40], information regarding the pivotal genes, specific modes and signaling pathways involved in drought resistance in conifers remains lacking. In this study, we observed that a gene encoding NCED (9-cis-epoxycarotenoid dioxygenase) (c71048_g1), which is a crucial enzyme for the synthesis of ABA [41] that is often overexpressed in plants under drought stress [3], was up-regulated under LD. Quan et al. [42] reported that ABAs are important hormones related to drought stress in Masson pine, with ABA content increasing with increasing drought stress. Thus, both ABA accumulation and the expression of a key gene related to ABA synthesis were found to be up-regulated under drought stress in Masson pine. It can be inferred that this up-regulation is beneficial to the development of plant drought tolerance. Moreover, three major components associated with ABA signal transduction were also found to be differentially expressed in this study. A gene encoding PYL (c87460_g1), an ABA receptor that takes part in activating ABA responses [43], was up-regulated under MD versus CK, and MD versus LD. However, a gene encoding PP2C, a type 2C protein phosphatase (c68631_g1) that is a negative regulator that inactivates SnRK2 protein kinases [44], was obviously repressed under MD versus CK, MD versus LD, and SD versus LD. In addition, two genes encoding SnRK2 (c85767_g1 and c85767_g2), which enhance drought tolerance by enhancing ABA signaling [45], were activated under LD. These results indicate that many important genes related to ABA responses, all of which are involved in the ABA signaling pathway and its double-negative regulatory system, promote the interaction between PYL and PP2C, thereby leading to PP2C inhibition and SnRK2 activation in Masson pine. These findings are consistent with those of previous studies in which drought tolerance was putatively linked to ABA signaling networks in plants [46]. In conclusion, the ABA-mediated response pathway was markedly activated under LD and MD; thus, ABA plays a central role in drought stress responses in Masson pine.

4.5. Responses to Oxidative Stress under Moderate and Severe Drought Stress

Drought stress results in the overproduction of ROS in plants [4]. The activation of many antioxidants that occurs due to drought is considered to be a protective mechanism against drought damage [47]. In our previous study, the activity of SOD was found to be markedly increased under LD [9], providing further evidence that the oxidative system might play an essential role in the response to drought stress by regulating antioxidase activity to defend against ROS damage in Masson pine.
Moreover, other ROS-scavenging enzymes were up-regulated in the enriched glutathione metabolism pathway involved in the responses to stress signals under MD and SD (ko00480) in Masson pine. Two glutathione transferases (GST) genes (c92901_g1 and c93725_g3), which play a part in generic detoxification and cell adaptability under stress conditions [48], were constitutively up-regulated under different levels of drought stress in Masson pine. The expression of three GPX genes, namely, c92413_g1, c92413_g2, and c88279_g1, which can reduce H2O2 (hydrogen peroxide) and lipid hydroperoxides in the response to oxidative stress [49], was validated to be constitutively up-regulated with increasing drought stress, suggesting that GPX was activated to enhance abiotic stress tolerance. The expression of a GSR gene (c83219_g1), was upregulated to enhance plant tolerance to stress conditions [50] and was also upregulated under SD, indicating that GSR plays a role in the defense against ROS in Masson pine, even under severe drought conditions. Overall, these results suggest that glutathione is linked to cellular defense mechanisms against stresses caused by drought and oxidants and that GPX, GST and GSR may be positive regulators of drought tolerance in Masson pine.
Interestingly, most of the DEGs were found for the LD treatment, with fewer DEGs observed for the MD and SD treatments. These results suggest that this elite genotype of Masson pine exhibits a positive character of drought resistance in which a systemic response is rapidly activated to prevent damage under light drought stress, which then gradually returns to baseline as an adaptation to drought conditions under moderate and severe drought stress.

5. Conclusions

In this study, biological homeostasis in the Masson pine was reestablished through the collaborative action of physiological and molecular responses and growth under drought stress (Figure 6). Plant growth was slowed as an adaptation to drought stress, marked by down-regulation of the growth elements IAA and ARF. Furthermore, Masson pine exhibited an active defense and protection response that was characterized by a strong capacity for osmotic adjustment and the overexpression of genes related to ABA biosynthesis and signal transduction, and ROS scavenging, and it exhibited a rapid systemic defense against pathogenic effects. In addition, we found that drought stress is linked to the differential expression of TFs that regulate circadian rhythm, which has not previously been described in Pinus spp. These results will serve as a foundation for future transcriptomic research into drought tolerance in Masson pine.

Supplementary Materials

The following are available online at https://www.mdpi.com/1999-4907/9/6/326/s1, Table S1: Primers used in qRT-PCR. (XLS), Table S2: Statistical analysis of unigenes annotated in public databases. (XLS), Table S3: Unigenes differentially expressed between different water stress conditions. (XLS), Table S4: GO enrichment results for DEGs in drought-stressed versus control seedlings. (XLS), Table S5: KEGG pathway enrichment results for DEGs in drought-stressed versus control seedlings. (XLS), Table S6: Transcription factors differentially expressed in drought-stressed versus control seedlings. (XLS).

Author Contributions

M.D. and G.D. conceived and designed the research. M.D. conducted the experiments. G.D. contributed new reagents and analytical tools. M.D. and Q.C. analyzed the data. M.D. wrote the manuscript. All authors read and approved the manuscript.

Funding

The work was supported by grants from the National Natural Science Foundation of China (31660200), National science and technology support project (2015BAD09B0102), Special Core Program of Guizhou Province, P.R. China (20126001), and the Science and Technology Support Project of Guizhou Province (20172525).

Acknowledgments

We would like to thank Novogene Corporation (Beijing, China) for assistance with sequencing services.

Conflicts of Interest

The authors have no conflicts of interest to declare.

References

  1. Bray, E.A. Plant responses to water deficit. Trends Plant Sci. 1997, 2, 48–54. [Google Scholar] [CrossRef]
  2. Golldack, D.; Li, C.; Mohan, H.; Probst, N. Tolerance to drought and salt stress in plants: unraveling the signaling networks. Front. Plant Sci. 2014, 5, 151. [Google Scholar] [CrossRef] [PubMed]
  3. Yamaguchi-Shinozaki, K.; Shinozaki, K. Transcriptional regulatory networks in cellular responses and tolerance to dehydration and cold stresses. Annu. Rev. Plant Biol. 2006, 57, 781–803. [Google Scholar] [CrossRef] [PubMed]
  4. Salo, H.M.; Sarjala, T.; Jokela, A.; Häggman, H.; Vuosku, J. Moderate stress responses and specific changes in polyamine metabolism characterize Scots pine somatic embryogenesis. Tree Physiol. 2016, 36, 392–402. [Google Scholar] [CrossRef] [PubMed]
  5. Lorenz, W.W.; Alba, R.; Yu, Y.-S.; Bordeaux, J.M.; Simões, M.; Dean, J.F.D. Microarray analysis and scale-free gene networks identify candidate regulators in drought-stressed roots of loblolly pine (P. taeda L.). BMC Genom. 2011, 12, 264. [Google Scholar] [CrossRef] [PubMed]
  6. Perdiguero, P.; Soto, Á.; Collada, C. Comparative analysis of Pinus pinea and Pinus pinaster dehydrins under drought stress. Tree Genet. Genomes 2015, 11, 70. [Google Scholar] [CrossRef]
  7. Li, H.; Yao, W.; Fu, Y.; Li, S.; Guo, Q. De novo assembly and discovery of genes that are involved in drought tolerance in Tibetan Sophora moorcroftiana. PLoS ONE 2015, 10, e111054. [Google Scholar] [CrossRef] [PubMed]
  8. Ding, G.; Zhou, Z.; Wang, Z. Cultivation and Utilization of Pulpwood Stand for Pinus massoniana; China Forestry Publishing House: Beijing, China, 2006. [Google Scholar]
  9. Du, M.; Ding, G.; Zhao, X. Responses to continuous drought stress and drought resistance comprehensive evaluation of different Masson pine families. Sci. Silvae Sin. 2017, 53, 21–29. [Google Scholar]
  10. Chen, H.; Yang, Z.; Hu, Y.; Tan, J.; Jia, J.; Xu, H.; Chen, X. Reference genes selection for quantitative gene expression studies in Pinus massoniana L. Trees 2016, 30, 685–696. [Google Scholar] [CrossRef]
  11. Cañas, R.A.; Feito, I.; Fuente-Maqueda, J.F.; Ávila, C.; Majada, J.; Cánovas, F.M. Transcriptome-wide analysis supports environmental adaptations of two Pinus pinaster populations from contrasting habitats. BMC Genom. 2015, 16, 909. [Google Scholar] [CrossRef] [PubMed]
  12. Müller, T.; Ensminger, I.; Schmid, K.J. A catalogue of putative unique transcripts from Douglas-fir (Pseudotsuga menziesii) based on 454 transcriptome sequencing of genetically diverse, drought stressed seedlings. BMC Genom. 2012, 13, 673. [Google Scholar] [CrossRef] [PubMed]
  13. Wang, Y.; Ding, G.J. Physiological responses of mycorrhizal Pinus massoniana seedlings to drought stress and drought resistance evaluation. Ying Yong Sheng Tai Xue Bao 2013, 24, 639–645. [Google Scholar] [PubMed]
  14. Ma, X.; Wang, P.; Zhou, S.; Sun, Y.; Liu, N.; Li, X.; Hou, Y. De novo transcriptome sequencing and comprehensive analysis of the drought-responsive genes in the desert plant Cynanchum komarovii. BMC Genom. 2015, 16, 753. [Google Scholar] [CrossRef] [PubMed]
  15. Grabherr, M.G.; Haas, B.J.; Yassour, M.; Levin, J.Z.; Thompson, D.A.; Amit, I.; Adiconis, X.; Fan, L.; Raychowdhury, R.; Zeng, Q.; et al. Full-length transcriptome assembly from RNA-Seq data without a reference genome. Nat. Biotechnol. 2011, 29, 644–652. [Google Scholar] [CrossRef] [PubMed] [Green Version]
  16. Li, B.; Dewey, C. RSEM: Accurate transcript quantification from RNA-Seq data with or without a reference genome. BMC Bioinform. 2011. [Google Scholar] [CrossRef] [PubMed]
  17. Götz, S.; García-Gómez, J.M.; Terol, J.; Williams, T.D.; Nagaraj, S.H.; Nueda, M.J.; Robles, M.; Talón, M.; Dopazo, J.; Conesa, A. High-throughput functional annotation and data mining with the Blast2GO suite. Nucleic Acids Res. 2008, 36, 3420–3435. [Google Scholar] [CrossRef] [PubMed] [Green Version]
  18. Moriya, Y.; Itoh, M.; Okuda, S.; Yoshizawa, A.C.; Kanehisa, M. KAAS: An automatic genome annotation and pathway reconstruction server. Nucleic Acids Res. 2007, 35 (Suppl. 2), W182–W185. [Google Scholar] [CrossRef] [PubMed]
  19. Young, M.D.; Wakefield, M.J.; Smyth, G.K.; Alicia, O. Gene ontology analysis for RNA-Seq: Accounting for selection bias. Gen. Biol. 2010. [Google Scholar] [CrossRef] [PubMed]
  20. Mao, X.; Cai, T.; Olyarchuk, J.G.; Wei, L. Automated genome annotation and pathway identification using the KEGG Orthology (KO) as a controlled vocabulary. Bioinformatics 2005, 21, 3787–3793. [Google Scholar] [CrossRef] [PubMed] [Green Version]
  21. Fan, F.; Cui, B.; Zhang, T.; Qiao, G.; Ding, G.; Wen, X. The Temporal Transcriptomic Response of Pinus massoniana Seedlings to Phosphorus Deficiency. PLoS ONE 2014, 8, e105068. [Google Scholar] [CrossRef] [PubMed]
  22. Livak, K.J.; Schmittgen, T.D. Analysis of Relative Gene Expression Data Using Real-Time Quantitative PCR and the 2−ΔΔCT Method. Methods 2001, 25, 402–408. [Google Scholar] [CrossRef] [PubMed]
  23. Aroca, R.; Ferrante, A.; Vernieri, P.; Chrispeels, M.J. Drought, abscisic acid and transpiration rate effects on the regulation of PIP aquaporin gene expression and abundance in Phaseolus vulgaris plants. Ann. Bot. 2006, 98, 1301–1310. [Google Scholar] [CrossRef] [PubMed]
  24. Li, J.; Li, G.; Gao, S.; Martinez, C.; He, G.; Zhou, Z.; Huang, X.; Lee, J.H.; Zhang, H.; Shen, Y.; et al. Arabidopsis transcription factor ELONGATED HYPOCOTYL5 plays a role in the feedback regulation of phytochrome a signaling. Plant Cell Online 2010, 22, 3634–3649. [Google Scholar] [CrossRef] [PubMed]
  25. Yamawaki, S.; Yamashino, T.; Nakanishi, H.; Mizuno, T. Functional characterization of HY5 homolog genes involved in early light-signaling in Physcomitrella patens. Biosci. Biotechnol. Biochem. 2011, 75, 1533–1539. [Google Scholar] [CrossRef] [PubMed]
  26. Prasad, B.R.V.; Kumar, S.V.; Nandi, A.; Chattopadhyay, S. Functional interconnections of HY1 with MYC2 and HY5 in Arabidopsis seedling development. BMC Plant Biol. 2012, 12, 37. [Google Scholar] [CrossRef] [PubMed]
  27. Song, H.-R. Interaction between the Late Elongated hypocotyl (LHY) and Early flowering 3 (ELF3) genes in the Arabidopsis circadian clock. Genes Genom. 2012, 34, 329–337. [Google Scholar] [CrossRef]
  28. Wang, X.; Zeng, F.S.; Zhan, Y.G.; He, Z.L. Cloning and functional analysis of the circadian gene LHY promoter in fraxinus mandshurica. Plant Physiol. J. 2014, 50, 1675–1682. [Google Scholar] [CrossRef]
  29. Tang, W.; Charles, T.M.; Newton, R.J. Overexpression of the pepper transcription factor CaPF1 in transgenic virginia pine (Pinus Virginiana Mill.) confers multiple stress tolerance and enhances organ growth. Plant Mol. Biol. 2005, 59, 603–617. [Google Scholar] [CrossRef] [PubMed]
  30. Guilfoyle, T.J.; Hagen, G. Auxin response factors. Curr. Opin. Plant Biol. 2007, 10, 453–460. [Google Scholar] [CrossRef] [PubMed]
  31. Liscum, E.; Reed, J.W. Genetics of Aux/IAA and ARF action in plant growth and development. Plant Mol. Biol. 2002, 49, 387–400. [Google Scholar] [CrossRef] [PubMed]
  32. De Diego, N.; Perez-Alfocea, F.; Cantero, E.; Lacuesta, M.; Moncalean, P. Physiological response to drought in radiata pine: Phytohormone implication at leaf level. Tree Physiol. 2012, 32, 435–449. [Google Scholar] [CrossRef] [PubMed]
  33. Wu, J.; Zhang, Y.; Yin, L.; Qu, J.; Lu, J. Linkage of cold acclimation and disease resistance through plant-pathogen interaction pathway in Vitis amurensis grapevine. Funct. Integr. Genom. 2014, 14, 741–755. [Google Scholar] [CrossRef] [PubMed]
  34. Bonello, P.; Gordon, T.R.; Herms, D.A.; Wood, D.L.; Erbilgin, N. Nature and ecological implications of pathogen-induced systemic resistance in conifers: A novel hypothesis. Physiol. Mol. Plant Pathol. 2006, 68, 95–104. [Google Scholar] [CrossRef]
  35. Kong, Q.; Qu, N.; Gao, M.; Zhang, Z.; Ding, X.; Yang, F.; Li, Y.; Dong, O.X.; Chen, S.; Li, X.; et al. The MEKK1-MKK1/MKK2-MPK4 kinase cascade negatively regulates immunity mediated by a mitogen-activated protein kinase kinase kinase in Arabidopsis. Plant Cell 2012, 24, 2225–2236. [Google Scholar] [CrossRef] [PubMed]
  36. Li, Z.T.; Dhekney, S.A.; Gray, D.J. PR-1 gene family of grapevine: a uniquely duplicated PR-1 gene from a Vitis interspecific hybrid confers high level resistance to bacterial disease in transgenic tobacco. Plant Cell Rep. 2011, 30, 1–11. [Google Scholar] [CrossRef] [PubMed]
  37. Haider, M.S.; Kurjogi, M.M.; Khalil-Ur-Rehman, M.; Fiaz, M.; Pervaiz, T.; Jiu, S.T.; Jia, H.F.; Chen, W.; Fang, J.G. Grapevine immune signaling network in response to drought stress as revealed by transcriptomic analysis. Plant Physiol. Biochem. 2017, 121, 187–195. [Google Scholar] [CrossRef] [PubMed]
  38. Bhardwaj, J.; Chauhan, R.; Swarnkar, M.K.; Chahota, R.K.; Singh, A.K.; Shankar, R.; Yadav, S.K. Comprehensive transcriptomic study on horse gram (Macrotyloma uniflorum): De novo assembly, functional characterization and comparative analysis in relation to drought stress. BMC Genom. 2013, 14, 647. [Google Scholar] [CrossRef] [PubMed]
  39. Min, H.; Chen, C.; Wei, S.; Shang, X.; Sun, M.; Xia, R.; Liu, X.; Hao, D.; Chen, H.; Xie, Q. Identification of drought tolerant mechanisms in maize seedlings based on transcriptome analysis of recombination inbred lines. Front. Plant Sci. 2016, 7, 1080. [Google Scholar] [CrossRef] [PubMed]
  40. Agarwal, P.K.; Jha, B. Transcription factors in plants and ABA dependent and independent abiotic stress signalling. Biol. Plant. 2010, 54, 201–212. [Google Scholar] [CrossRef]
  41. Wang, Z.-Y.; Xiong, L.; Li, W.; Zhu, J.-K.; Zhu, J. The plant cuticle is required for osmotic stress regulation of abscisic acid biosynthesis and osmotic stress tolerance in Arabidopsis. Plant Cell 2011, 23, 1971–1984. [Google Scholar] [CrossRef] [PubMed]
  42. Quan, W.; Ding, G. Dynamic of Volatiles and Endogenous Hormones in Pinus massoniana Needles under Drought Stress. Sci. Silvae Sin. 2017, 53, 49–54. [Google Scholar]
  43. Ma, Y.; Szostkiewicz, I.; Korte, A.; Moes, D.; Yang, Y.; Christmann, A.; Grill, E. Regulators of PP2C phosphatase activity function as abscisic acid sensors. Science 2009, 324, 1064–1068. [Google Scholar] [CrossRef] [PubMed]
  44. Liu, L.; Hu, X.; Song, J.; Zong, X.; Li, D.; Li, D. Over-expression of a Zea mays L. protein phosphatase 2C gene (ZmPP2C) in Arabidopsis thaliana decreases tolerance to salt and drought. J. Plant Physiol. 2009, 166, 531–542. [Google Scholar] [CrossRef] [PubMed]
  45. Zhang, H.; Mao, X.; Wang, C.; Jing, R. Overexpression of a common wheat gene TaSnRK2.8 enhances tolerance to drought, salt and low temperature in Arabidopsis. PLoS ONE 2010, 5, e16041. [Google Scholar] [CrossRef] [PubMed]
  46. Gao, S.-Q.; Chen, M.; Xu, Z.-S.; Zhao, C.-P.; Li, L.; Xu, H.-J.; Tang, Y.-M.; Zhao, X.; Ma, Y.-Z. The soybean GmbZIP1 transcription factor enhances multiple abiotic stress tolerances in transgenic plants. Plant Mol. Biol. 2011, 75, 537–553. [Google Scholar] [CrossRef] [PubMed]
  47. Dziri, S.; Hosni, K. Effects of cement dust on volatile oil constituents and antioxidative metabolism of Aleppo pine (Pinus halepensis) needles. Acta Physiol. Plant. 2012, 34, 1669–1678. [Google Scholar] [CrossRef]
  48. Zeng, Q.-Y.; Lu, H.; Wang, X.-R. Molecular characterization of a glutathione transferase from Pinus tabulaeformis (Pinaceae). Biochimie 2005, 87, 445–455. [Google Scholar] [CrossRef] [PubMed]
  49. Noctor, G.; Gomez, L.; Vanacker, H.; Foyer, C.H. Interactions between biosynthesis, compartmentation and transport in the control of glutathione homeostasis and signalling. J. Exp. Bot. 2002, 53, 1283–1304. [Google Scholar] [CrossRef] [PubMed] [Green Version]
  50. Rao, A.S.V.C.; Reddy, A.R. Glutathione reductase: A putative redox regulatory system in plant cells. In Sulfur Assimilation and Abiotic Stress in Plants; Khan, N.A., Singh, S., Umar, S., Eds.; Springer: Berlin, Germany, 2008; pp. 111–147. [Google Scholar]
Figure 1. Phenotypic variation of Masson pine seedlings under different soil moisture conditions. CK, well-watered control; LD, light drought; MD, moderate drought; and SD, severe drought.
Forests 09 00326 g001
Figure 2. Distribution of assembled unigenes and the number of assembled unigenes of each length.
Forests 09 00326 g002
Figure 3. Venn diagram and cluster analysis of differentially expressed genes in three comparisons. (A) Venn diagram showing that a total of 4300 unigenes were identified as differentially expressed in the three comparisons (LD, MD and SD versus CK); the number of DEGs in each comparison are shown in each circle; the number of overlapping regions represent the 687 DEGs that were found in each comparison. (B) A cluster analysis of differentially expressed genes is shown in the right panel; red indicates up-regulated genes and blue indicates down-regulated genes.
Forests 09 00326 g003
Figure 4. Expression changes of nine randomly selected unigenes as determined by qRT-PCR results and DGE sequencing data. The x-axis values indicate the different water content conditions. The y-axis values represent the change in expression under the various drought stress conditions relative to the well-watered control condition. Data represent the fold changes of expression for each unigene in the drought treatment relative to control conditions. Error bars represent standard deviations. Blue indicates the RNA-Seq results, and red indicates the qRT-PCR results.
Forests 09 00326 g004
Figure 5. Unigenes inferred to be involved in the plant–pathogen interaction pathway. Blue inside the boxes indicates unigenes predicted to be involved in the pathway. White inside the boxes indicates unigenes that were not identified in the expression profile analysis. Red in the borders indicates that the genes increased expression under drought stress relative to the well-watered condition.
Forests 09 00326 g005
Figure 6. A model of different adaptive strategies regulated by drought-responsive genes in Masson pine. Red or green inside the white boxes indicates unigenes that showed increased or decreased expression, respectively. Blue inside the boxes indicates different adaptive strategies. Red inside the boxes indicates that the biological function was activated. Green inside the boxes indicates that the biological function was repressed.
Forests 09 00326 g006

