1. Introduction
With an increasing demand for large-section drying and high-quality square timber [
1,
2], high quality, rapid, and energy-saving drying technology is increasingly important and has become a pressing problem that needs to be addressed [
3]. High-frequency heating drying is an ideal drying method for large-section wood with good permeability because the characteristics of the method include integrity, instantaneity, and high efficiency, and thus, high-frequency heating drying has gradually attracted the attention of scholars at home and abroad [
4,
5,
6]. Timber temperature is an important process control parameter during high-frequency heating drying. The distribution and variation of wood temperature affect both the drying speed and the drying quality of wood [
7]. An in-depth study of the heat transfer mechanism of high-frequency heating of wood and an accurate understanding of the temperature distribution of wood and its changing rules during the drying process are greatly significant.
Avramidis [
8] and Zhang [
9] of Canada and Kawai [
10] of Japan used fiber optic temperature sensors to measure the temperature of the core and surface of wood during microwave or high-frequency heating and qualitatively analyzed the influences of temperature and the moisture content. Cai [
11] used fiber optic temperature sensors and platinum resistance (Pt100) to ascertain the 3-D temperature distribution of wood during high-frequency heating and to determine the influential factors; the influences of temperature distribution and its relationship with moisture distribution in a high-frequency vacuum field were also studied; on this basis, the relationship among the internal temperature of wood and the high-frequency power and emission time was studied, and the method for calculating the heat flux of high-frequency heating was established [
12,
13,
14]. However, because wood is a heterogeneous organic organism with large variability [
15], the temperature distribution and its rules change inside the wood during high-frequency heating, and drying is very complicated. It is not completely intuitive to reflect the heat transfer law of wood. The mathematical model can intuitively reflect the heat transfer rules of wood in the drying process [
16,
17], and the temperature distribution and changes in the interior of wood can be understood. At present, there has been much research on the heat transfer law of wood in the conventional drying process. However, there is little research on the high heating temperature field model of wood.
In view of this, this paper established the finite element model of high-frequency heating of wood, used a finite element simulation method to study the heat transfer characteristics of wood, and simulated the variation law of the temperature distribution in wood during high-frequency heating. This study provides a scientific basis for further study of the heat and mass transfer law of wood in high-frequency heating drying, presents an optimized and reliably implemented drying process, and has important guiding significance for the production practice of high-frequency heating drying. The main contents of this paper are as follows: (1) a simulation model of the temperature field of wood high-frequency heating is constructed using the finite element method; (2) the feasibility of the model is verified through experiments, and the heat transfer mechanism of wood high-frequency heating is analyzed; and (3) model error analysis is presented.
2. Materials and Methods
2.1. Model Development
Using the model construction principles of easy-to-difficult and simple-to-complex, first, a model was built by considering only the high-frequency heating and thermoelectric coupling (temperature field simulation) of wood. Thereafter, the models of heat and mass transfer, stress-strain, and wood anisotropy were gradually considered in the follow-up study.
To reasonably simplify the process of solving the high-frequency heating model, the following assumptions were made about the structure and properties of wood: (1) the initial temperature and initial moisture content inside the dry sample are evenly distributed; (2) the structural, physical, and chemical properties of wood are symmetrical, and the central layer is the adiabatic surface in the thickness direction; (3) the wood solid skeleton is rigid and does not shrink in the heating process; (4) the upper, lower, and side surfaces of the stack have the same external environment, implying that the surface heat transfer coefficient is the same for all surfaces; (5) the external environment does not change with wood heating, signifying that parameters such as the surface heat transfer coefficient and ambient temperature are constant.
2.1.1. Geometric Model
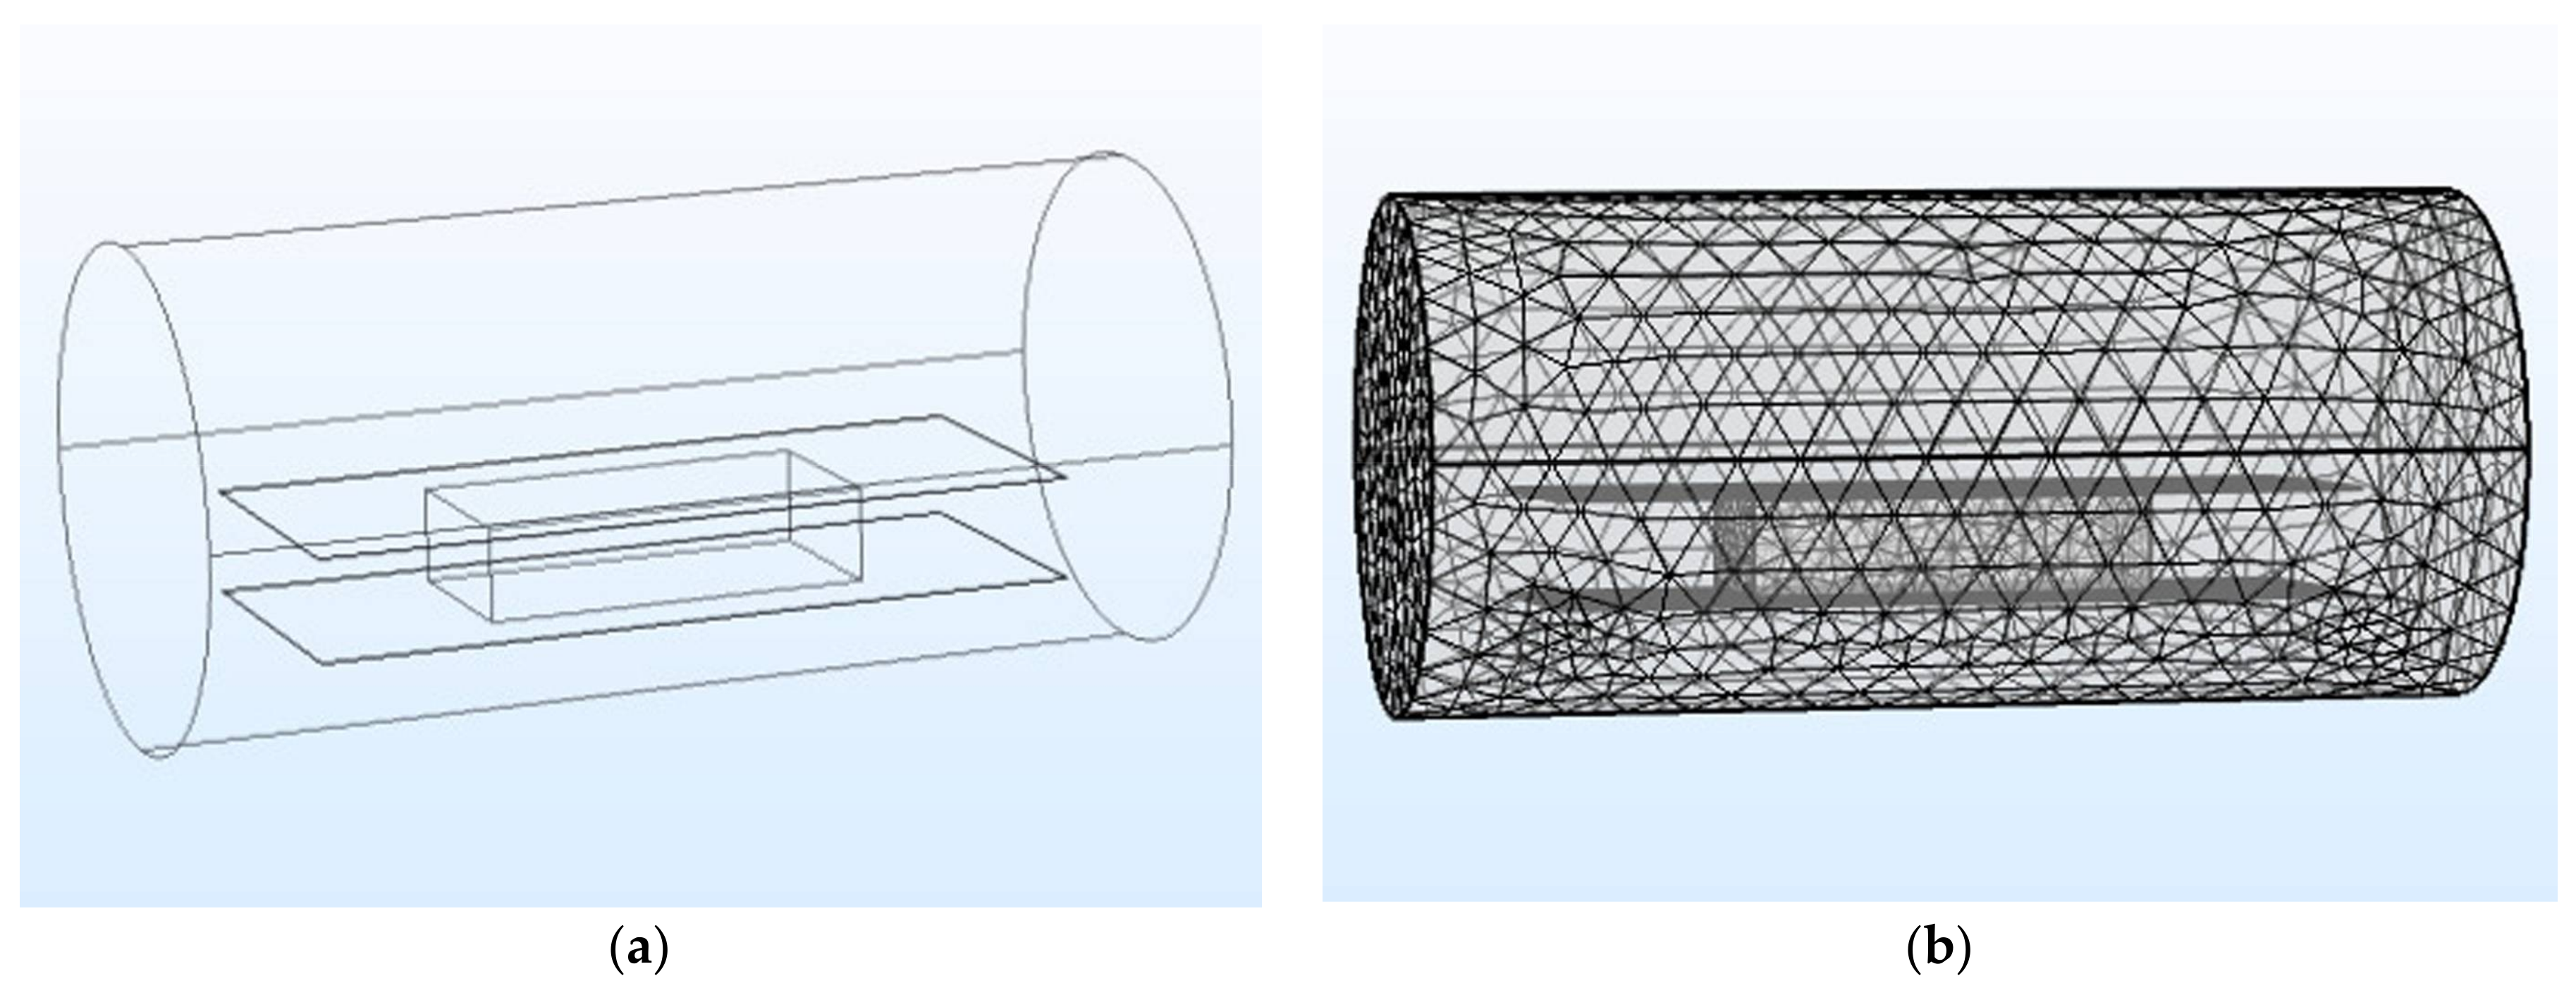
Finite element simulation software (COMSOL5.2a) (COMSOL Multiphysics, Burlington, CO, USA) was used to simulate the high-frequency heating process. As shown in
Figure 1a, a geometric model of high-frequency heating was developed according to the actual size of the high-frequency vacuum drying device. The model structure consisted of a high-frequency vacuum drying tank (640 (diameter) × 1350 (depth) mm), parallel top and bottom plates (1000 × 400 × 1.3 mm), and heated timber (500 × 240 × 120 mm). The sample was placed at the geometric center of the upper and lower plates.
2.1.2. Governing Equations
The electric field intensity and distribution in the heating process can be represented by Maxwell’s equation [
18]:
where
is the electrical conductivity of wood (S/m),
,
is the vacuum dielectric constant,
is the dielectric constant of wood, and
V is the electric potential across the electrode gap (V).
The heat conduction inside the piles is governed by Fourier formula:
where
is the instant heating rate in stack (°C/S),
is the thermal diffusivity (m
2/s),
is the density (kg/m
3),
Cp is the specific heat (J/(kg·°C)), and
P is the power conversion in stack per unit volume (W/m
3).
The conversion of electromagnetic energy to thermal energy is represented by the following equation [
19]:
where
f is the working frequency of the RF equipment,
is the loss factor of wood, and
E is the electric field intensity in the stack.
2.1.3. Plate Voltage
Volume power density is given by [
20]:
The volume power density can also be expressed as [
21]:
where
Erms is the RMS value of the electric field, equal to
times the amplitude of the electric field, and
Em is the electric field value applied to the sample.
The voltage applied to the electrode can be expressed as [
22]:
where
dair is the air gap between the plates and dm is the thickness of the test piece in the vertical direction while
E0 and
Em represent the electric field strength applied to the air gap and the test piece, respectively.
E0 can be in terms of
Em via eq—
Simultaneously above all types, the plate voltage can be expressed:
2.1.4. Initial and Boundary Conditions
The high-frequency vacuum tank was considered to be electrically insulated. The initial temperatures of all of the structures were taken to be room temperature (23 °C) in the model. The heat transfer coefficient between wood and the environment was taken to be 12 W/(m
2·°C) [
23]. The upper plate was set as the electromagnetic wave emitter, and the lower plate was set as the ground electrode. The voltage between the upper and lower plates was considered to be uniformly distributed, and the voltage was considered constant when the wood moisture was constant during high-frequency heating. The plate voltage was taken to be 1000 V [
13].
Table 1 shows the other characteristic parameters of the material involved in the model.
2.1.5. Mesh Generation and Simulation Procedure
In the model, the mesh generation of the stack was selected as “fine” to improve the simulation accuracy. The rest of the model used the “normal” mesh size to improve the computational efficiency (
Figure 1b). The joule heating module of the finite element simulation software (COMSOL5.2a) was selected for solving the coupling of electromagnetic wave heating and heat transfer equations. The software was run on workstations (Dell, dual-core 2 GHz processor, 4 GM RAM, Windows 8 64-bit operating system).
2.2. Model Validation
2.2.1. Test Material
In this study, Mongolian pine timber (
Pinus sylvestris var.
mongholica Litv.) with pith was selected as the test object. Six pieces of the same material with the same moisture content, same properties, and no cracking, decaying, or deformation were selected and processed into a square-shaped material with the size of 120 mm × 120 mm × 500 mm. High-frequency drying experiments were carried out, and the high-frequency heating rates of the samples were recorded when the samples were dried until the moisture contents were 65%, 55%, 45%, 35%, 25%, and 15%. In addition, the temperature distribution was also recorded in the early stage of drying (65%), near the fiber saturation point (35%), and in the later stage of drying (15%). Two samples were used for testing the moisture content and temperature in each experiment, and the experiment was replicated three times under the same conditions. The physical parameters of wood with different moisture contents are presented in
Table 2.
2.2.2. Temperature Distribution Detection
As shown in
Figure 2, a fiber optic temperature detection system was used to perform an on-line inspection and to record the temperature changes at the seven measurement points on the center section of the sample. The heating temperature of the test was set between 50–55 °C [
24]. When the test center reached the set temperature, the test was ended and the heating time and weight of the test piece were recorded.
2.2.3. Moisture Content Distribution Detection
When the stack was dried to moisture contents of 65% and 15%, test material for the moisture content distribution was taken out, a test piece of the stratified moisture content (20 mm thickness in the fiber direction) was cut and then put back into its original place after end coating. The dimensions of the moisture content distribution test piece were 20 × 120 × 120 mm. As shown in
Figure 3, the test piece was underlined, numbered, and cleaved into 25 samples along the marking [
25]. The moisture content of each sample was measured using an absolute drying weight method to draw a moisture content distribution map of the test material.
2.2.4. Influence of Dielectric Properties on the Heating Rate
The dielectric properties of samples varied in the model, and the influence on the heating rate was studied.
(1) When the permittivity of the test material was 10, the loss factor parameters (0.1, 0.3, 0.5, 0.7, and 0.9) changed, whereas the other physical parameters remained constant. The influence of the loss factor on the heating rate was studied separately.
(2) When the material loss factor was 0.2, the dielectric constant parameters (2, 10, 18, 26, and 34) changed, whereas the other physical parameters remained constant. The influence of the dielectric constant on the heating rate was studied separately.
2.2.5. Model Test Verification
(1) To verify the accuracy of the finite element simulation model, the root mean square error (RMSE) was used to statistically test the difference between the simulated and measured temperature changes at different moisture contents.
where
Ts is the simulated temperature in °C,
Tm is the measured temperature at the selected location in wood in °C,
i is the data node number, and
N is the total number of data points.
(2) To establish the feasibility of the model for analyzing the heating rate of wood during the high-frequency drying process, the error of simulated and measured heating rates at different moisture contents was compared using: error = |(measured value-calculated value)/measured value|.
(3) To establish the feasibility of the model for analyzing the variation of the temperature distribution in the timber during the high-frequency drying process, Matlab (MathWorks, Natick, MA, USA) was used to fit the temperature profile using the temperature values of the measuring points of the tested samples, and the fitted profiles were compared with the simulated temperature profiles.
(4) Through the experimental verification of the high-frequency heating temperature field model of wood with different moisture contents, it was established that the model could be used to analyze the temperature field inside the wood at different drying stages, and the error was analyzed.
3. Results and Discussion
3.1. Simulation Results
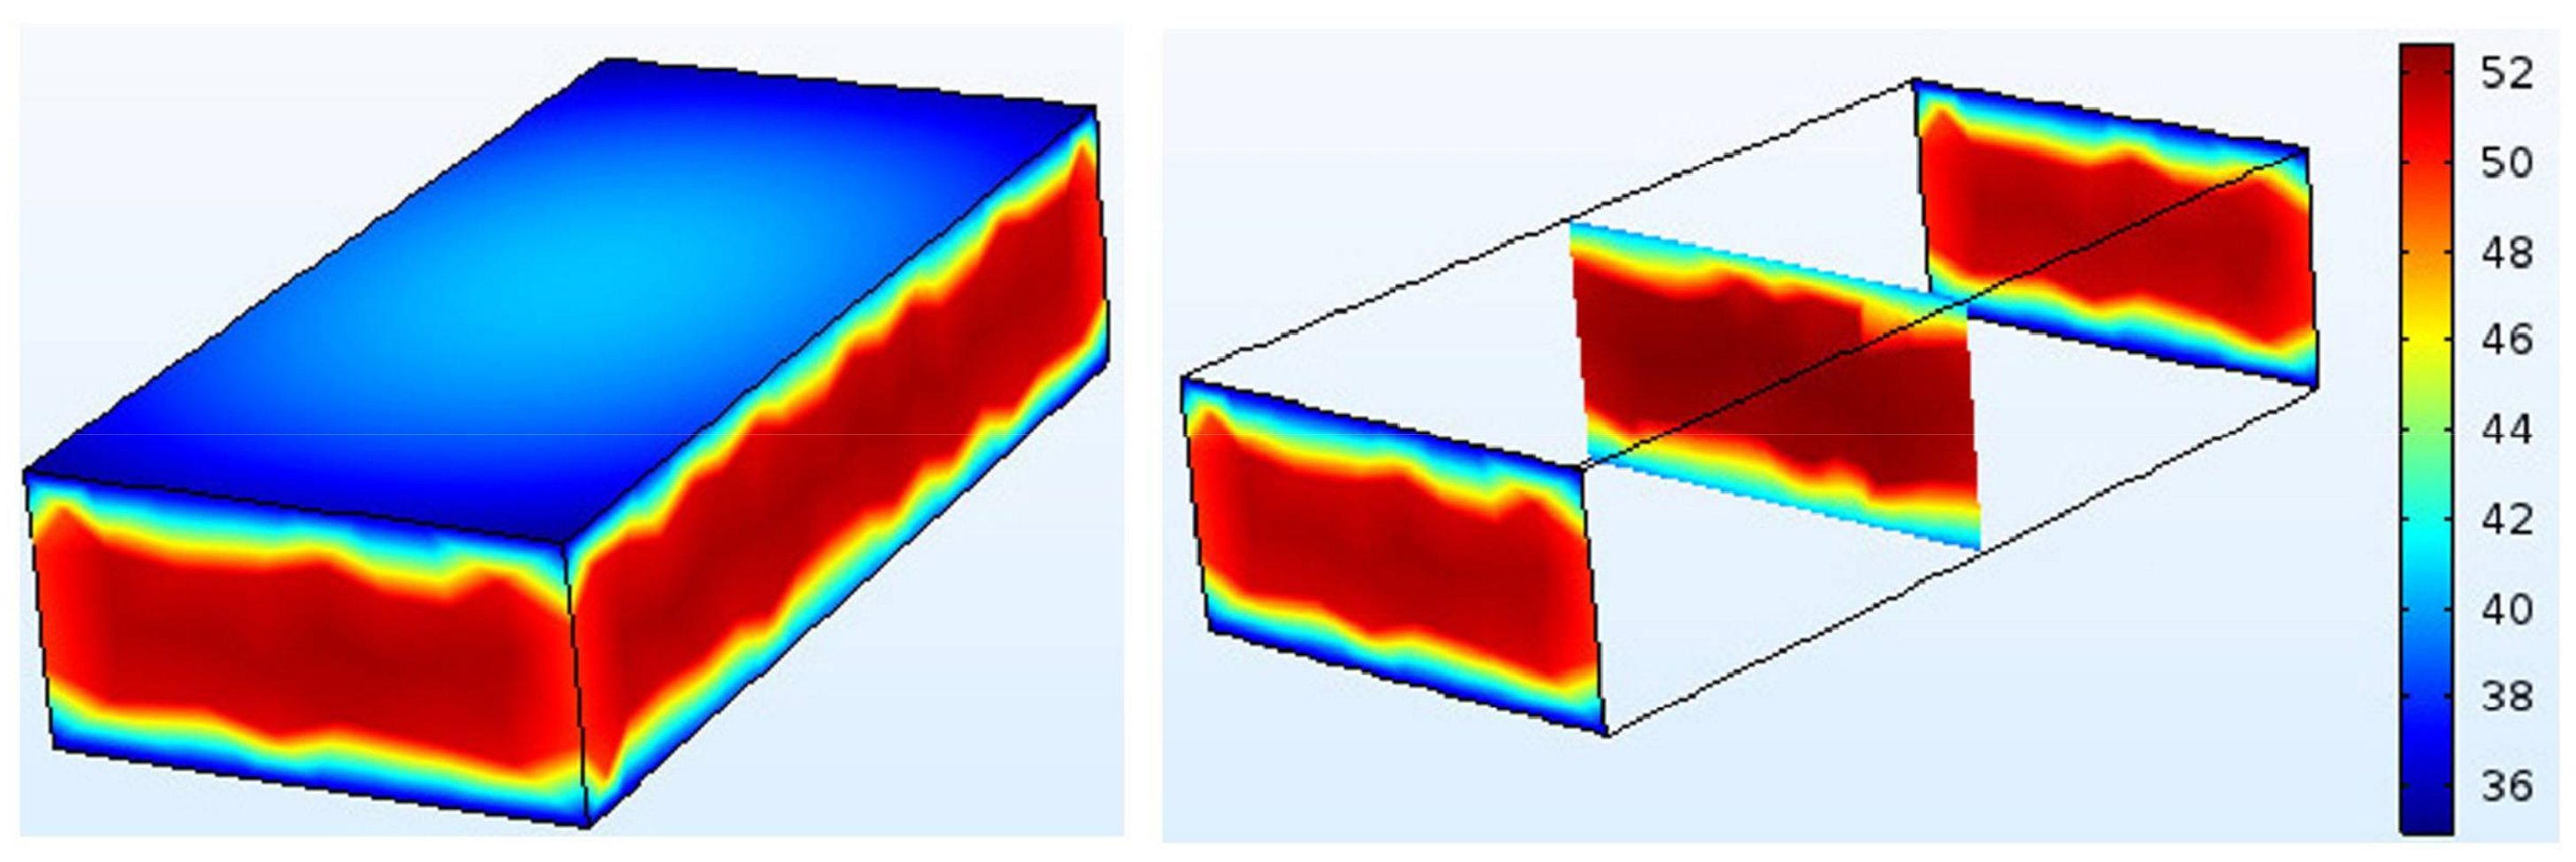
Figure 4 shows the analog high-frequency heating temperature profile of the test material with a moisture content of 65%. Along the thickness direction, the temperature gradually decreased from the center toward both sides. Along the axial direction, the temperature also gradually decreased from the center toward both sides. Thus, a temperature gradient distribution with high internal and low external temperatures formed and was conducive to water discharge.
3.2. Comparison of Simulated and Measured Heating Rate under Different Moisture Contents
As shown in
Table 3, the RMSE values for simulated and measured temperature with different water contents ranged from 0.0074 to 0.074, which suggests that the model was fairly accurate.
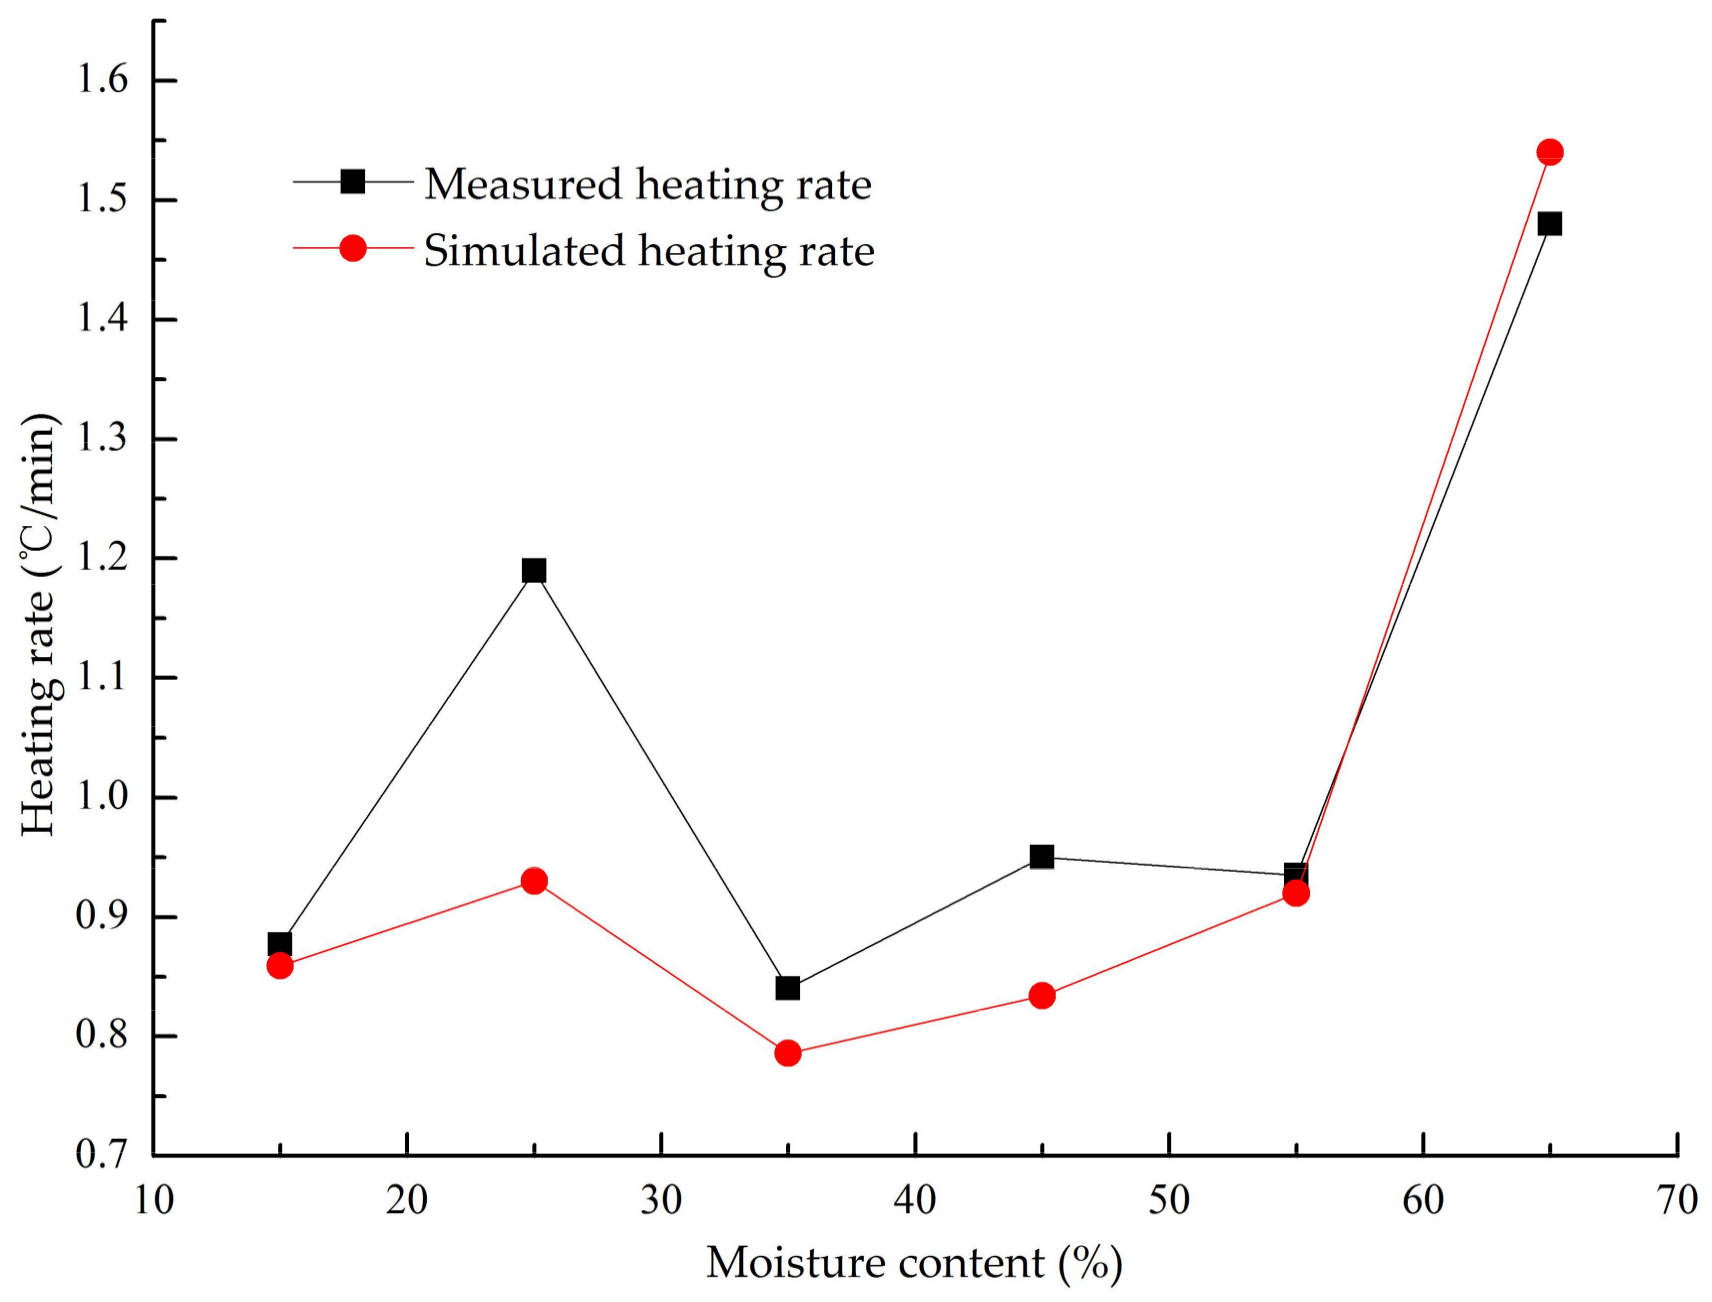
As shown in
Figure 5, as the moisture content decreased, the heating rate first decreased and then increased and then decreased again. There was no clear linear relationship between the high-frequency heating rate and the moisture content of the wood. The reason for this phenomenon was that the specific heat of water was much larger than that of the wood itself, and hence, the absorbed energy of heating was greater; therefore, the heating rate was not necessarily fast when the moisture content was high [
7]. Also, the dielectric properties of wood had a great influence on the high-frequency heating rate. As shown in
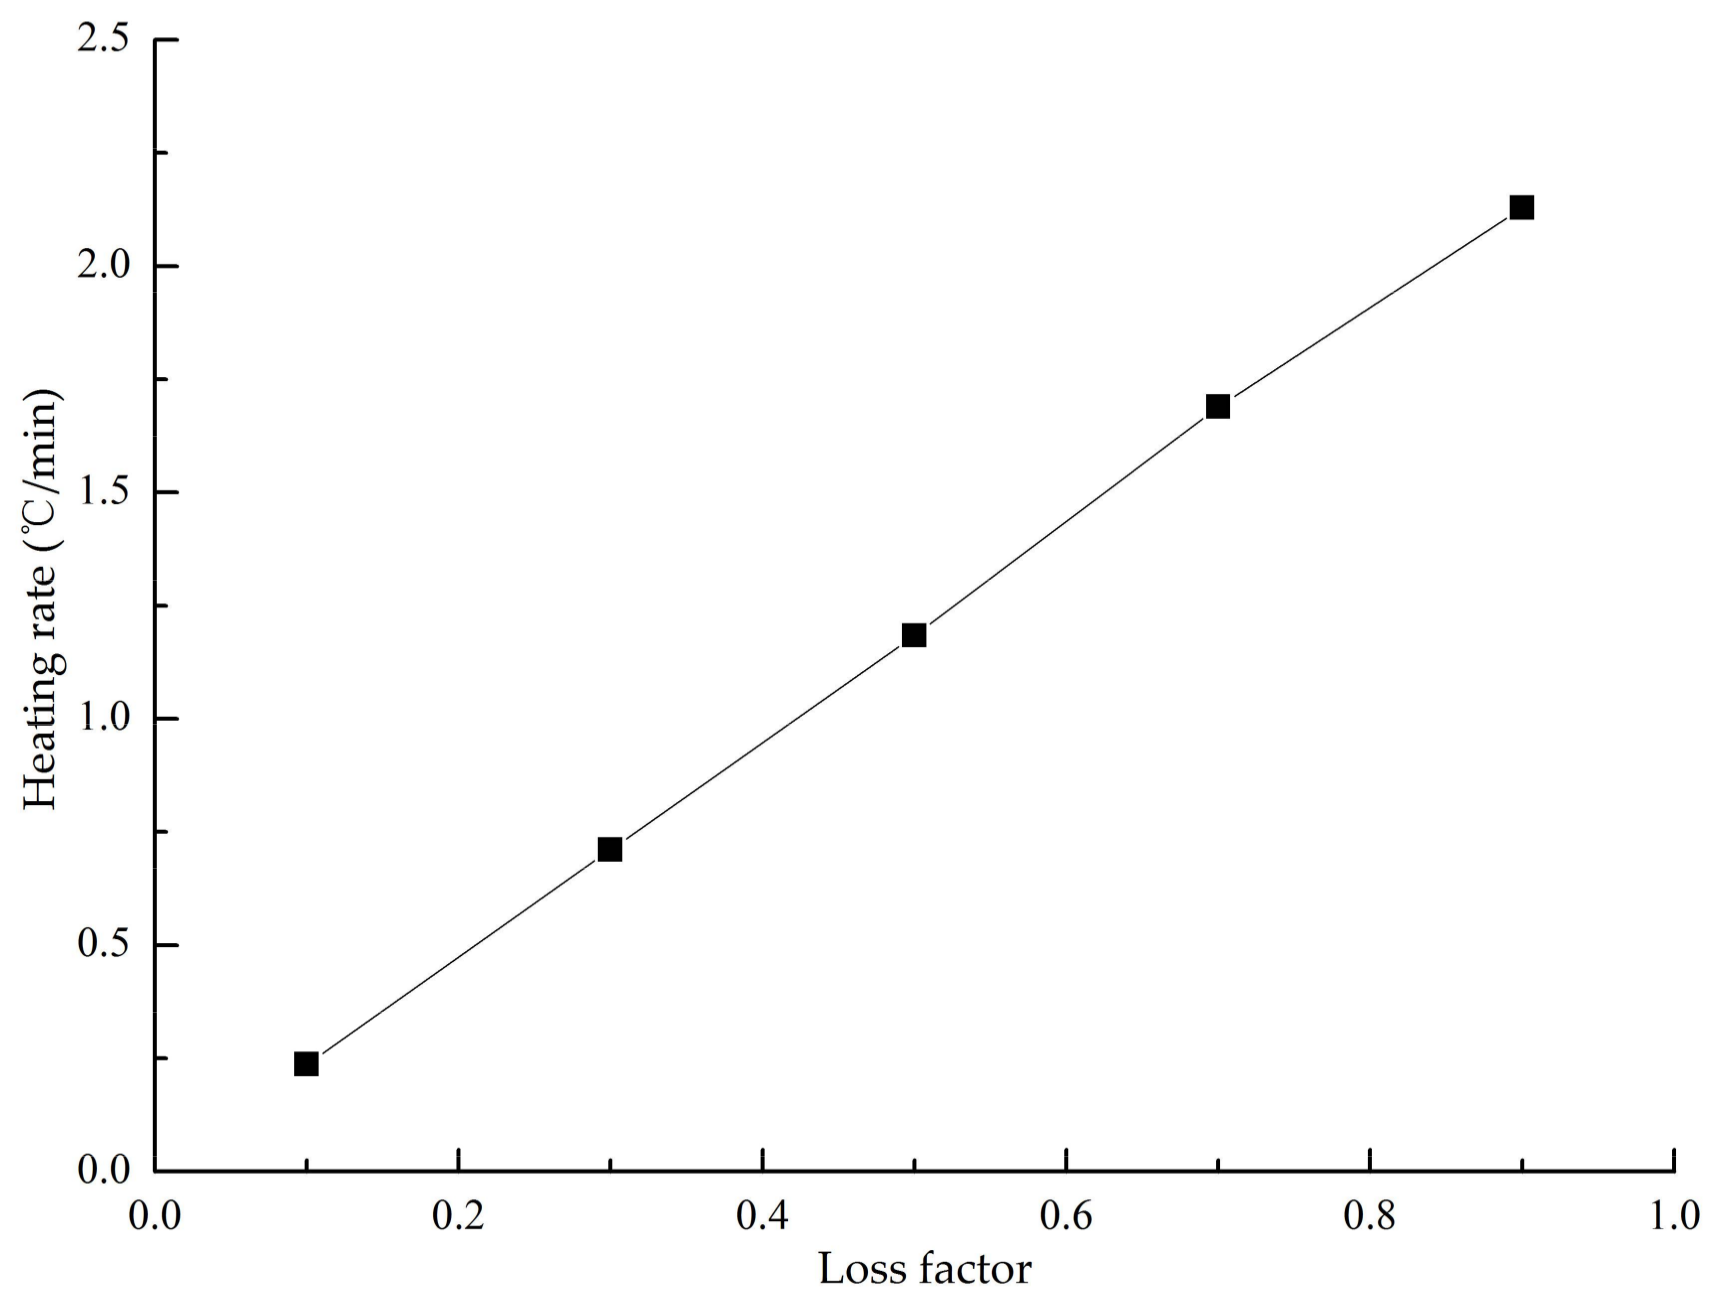
Figure 6, when the loss factor was fixed, the heating rate was negatively correlated with the dielectric constant of wood. As shown in
Figure 7, when the dielectric constant was fixed at a particular value, the heating rate and the loss factor were positively correlated. However, the dielectric constant and loss factor of wood increased with an increase in the moisture content. Therefore, the relationship between the high-frequency heating rate and the moisture content of the test material is complex and is not a simple linear relationship, and further research is required.
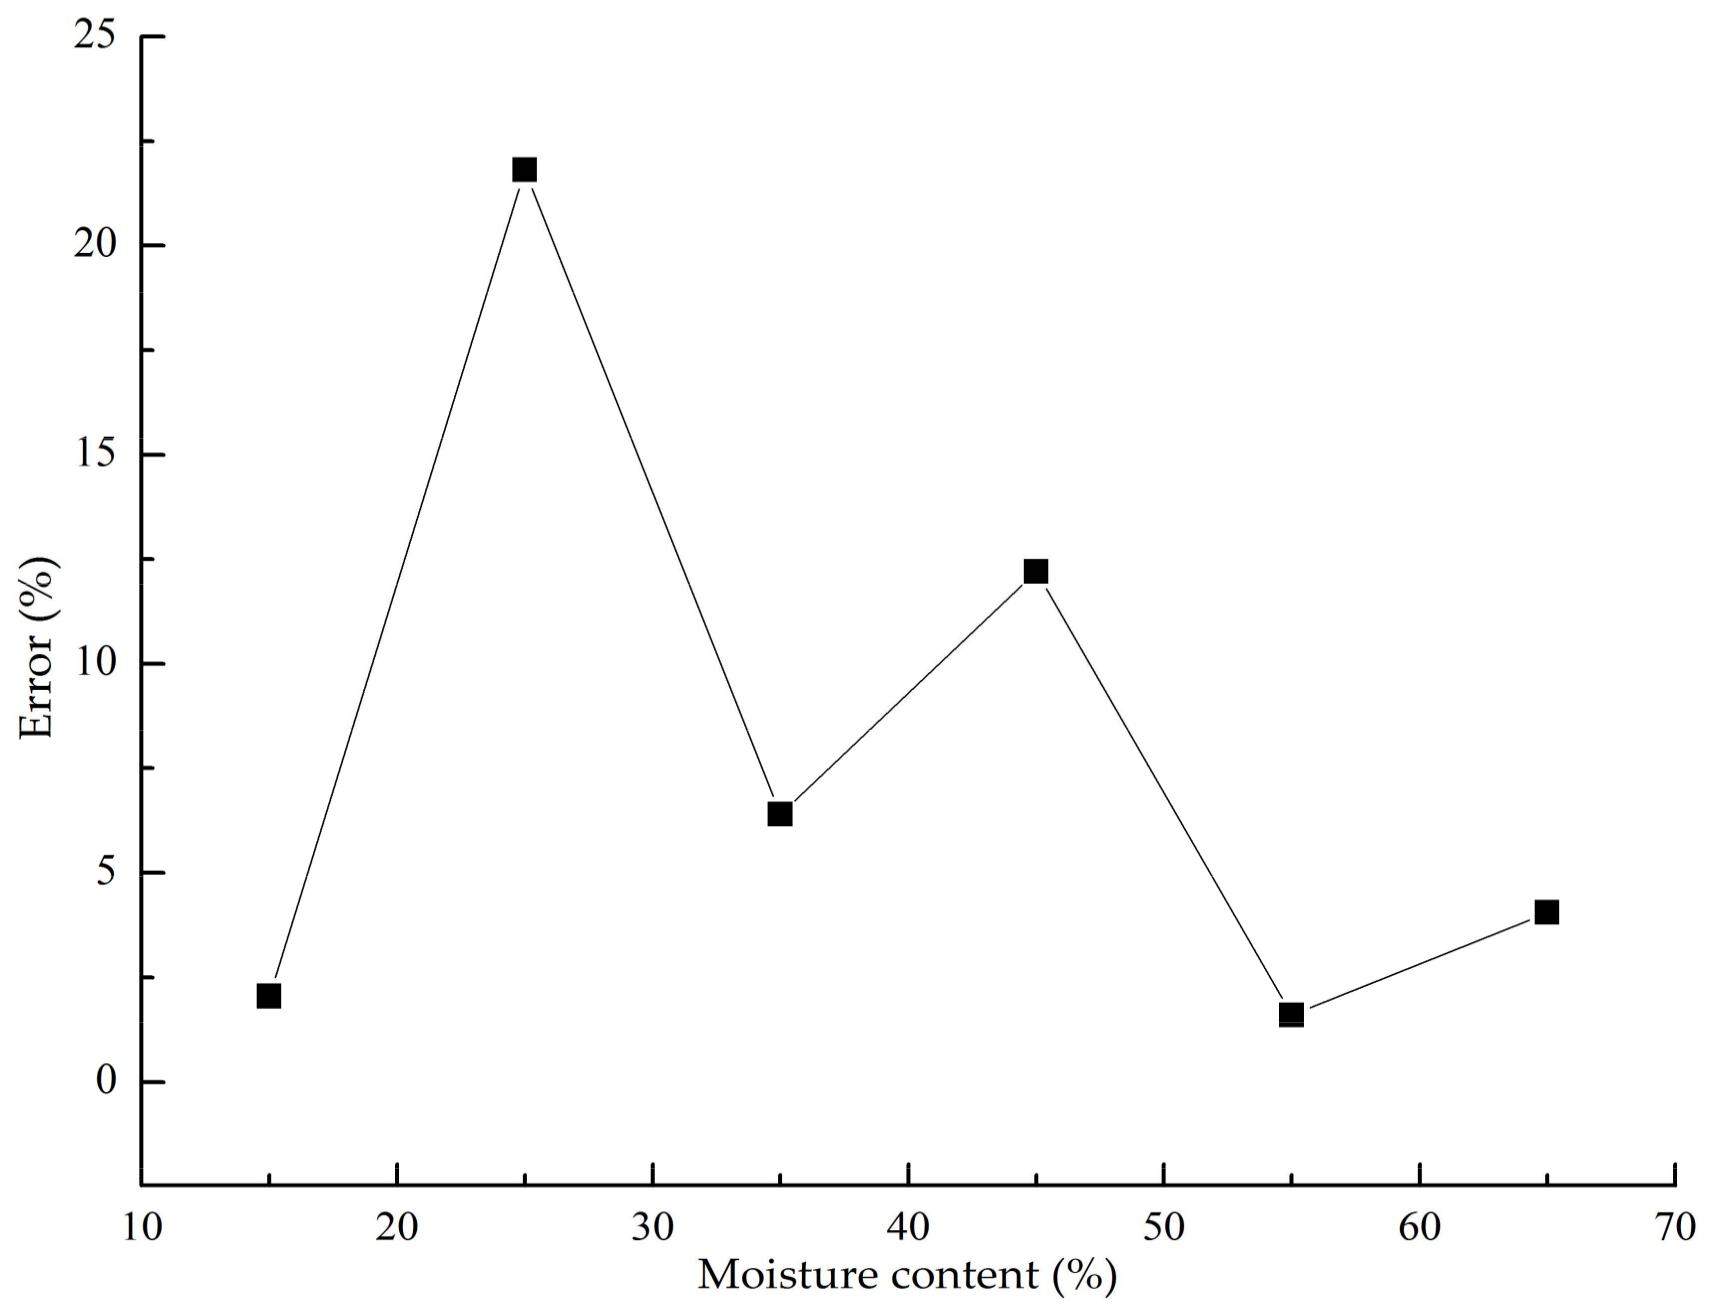
Comparing the error between the simulated and measured heating rate (
Figure 8), the accuracy of the early and later stage of drying was higher where the error was between 2% and 4%, whereas the highest error was 21.8% near the fiber saturation point. This was because the fiber saturation point is a critical state and a turning point in the nature of the wood, and it is closely related to the thermal conductivity and electrical conductivity of wood [
26].
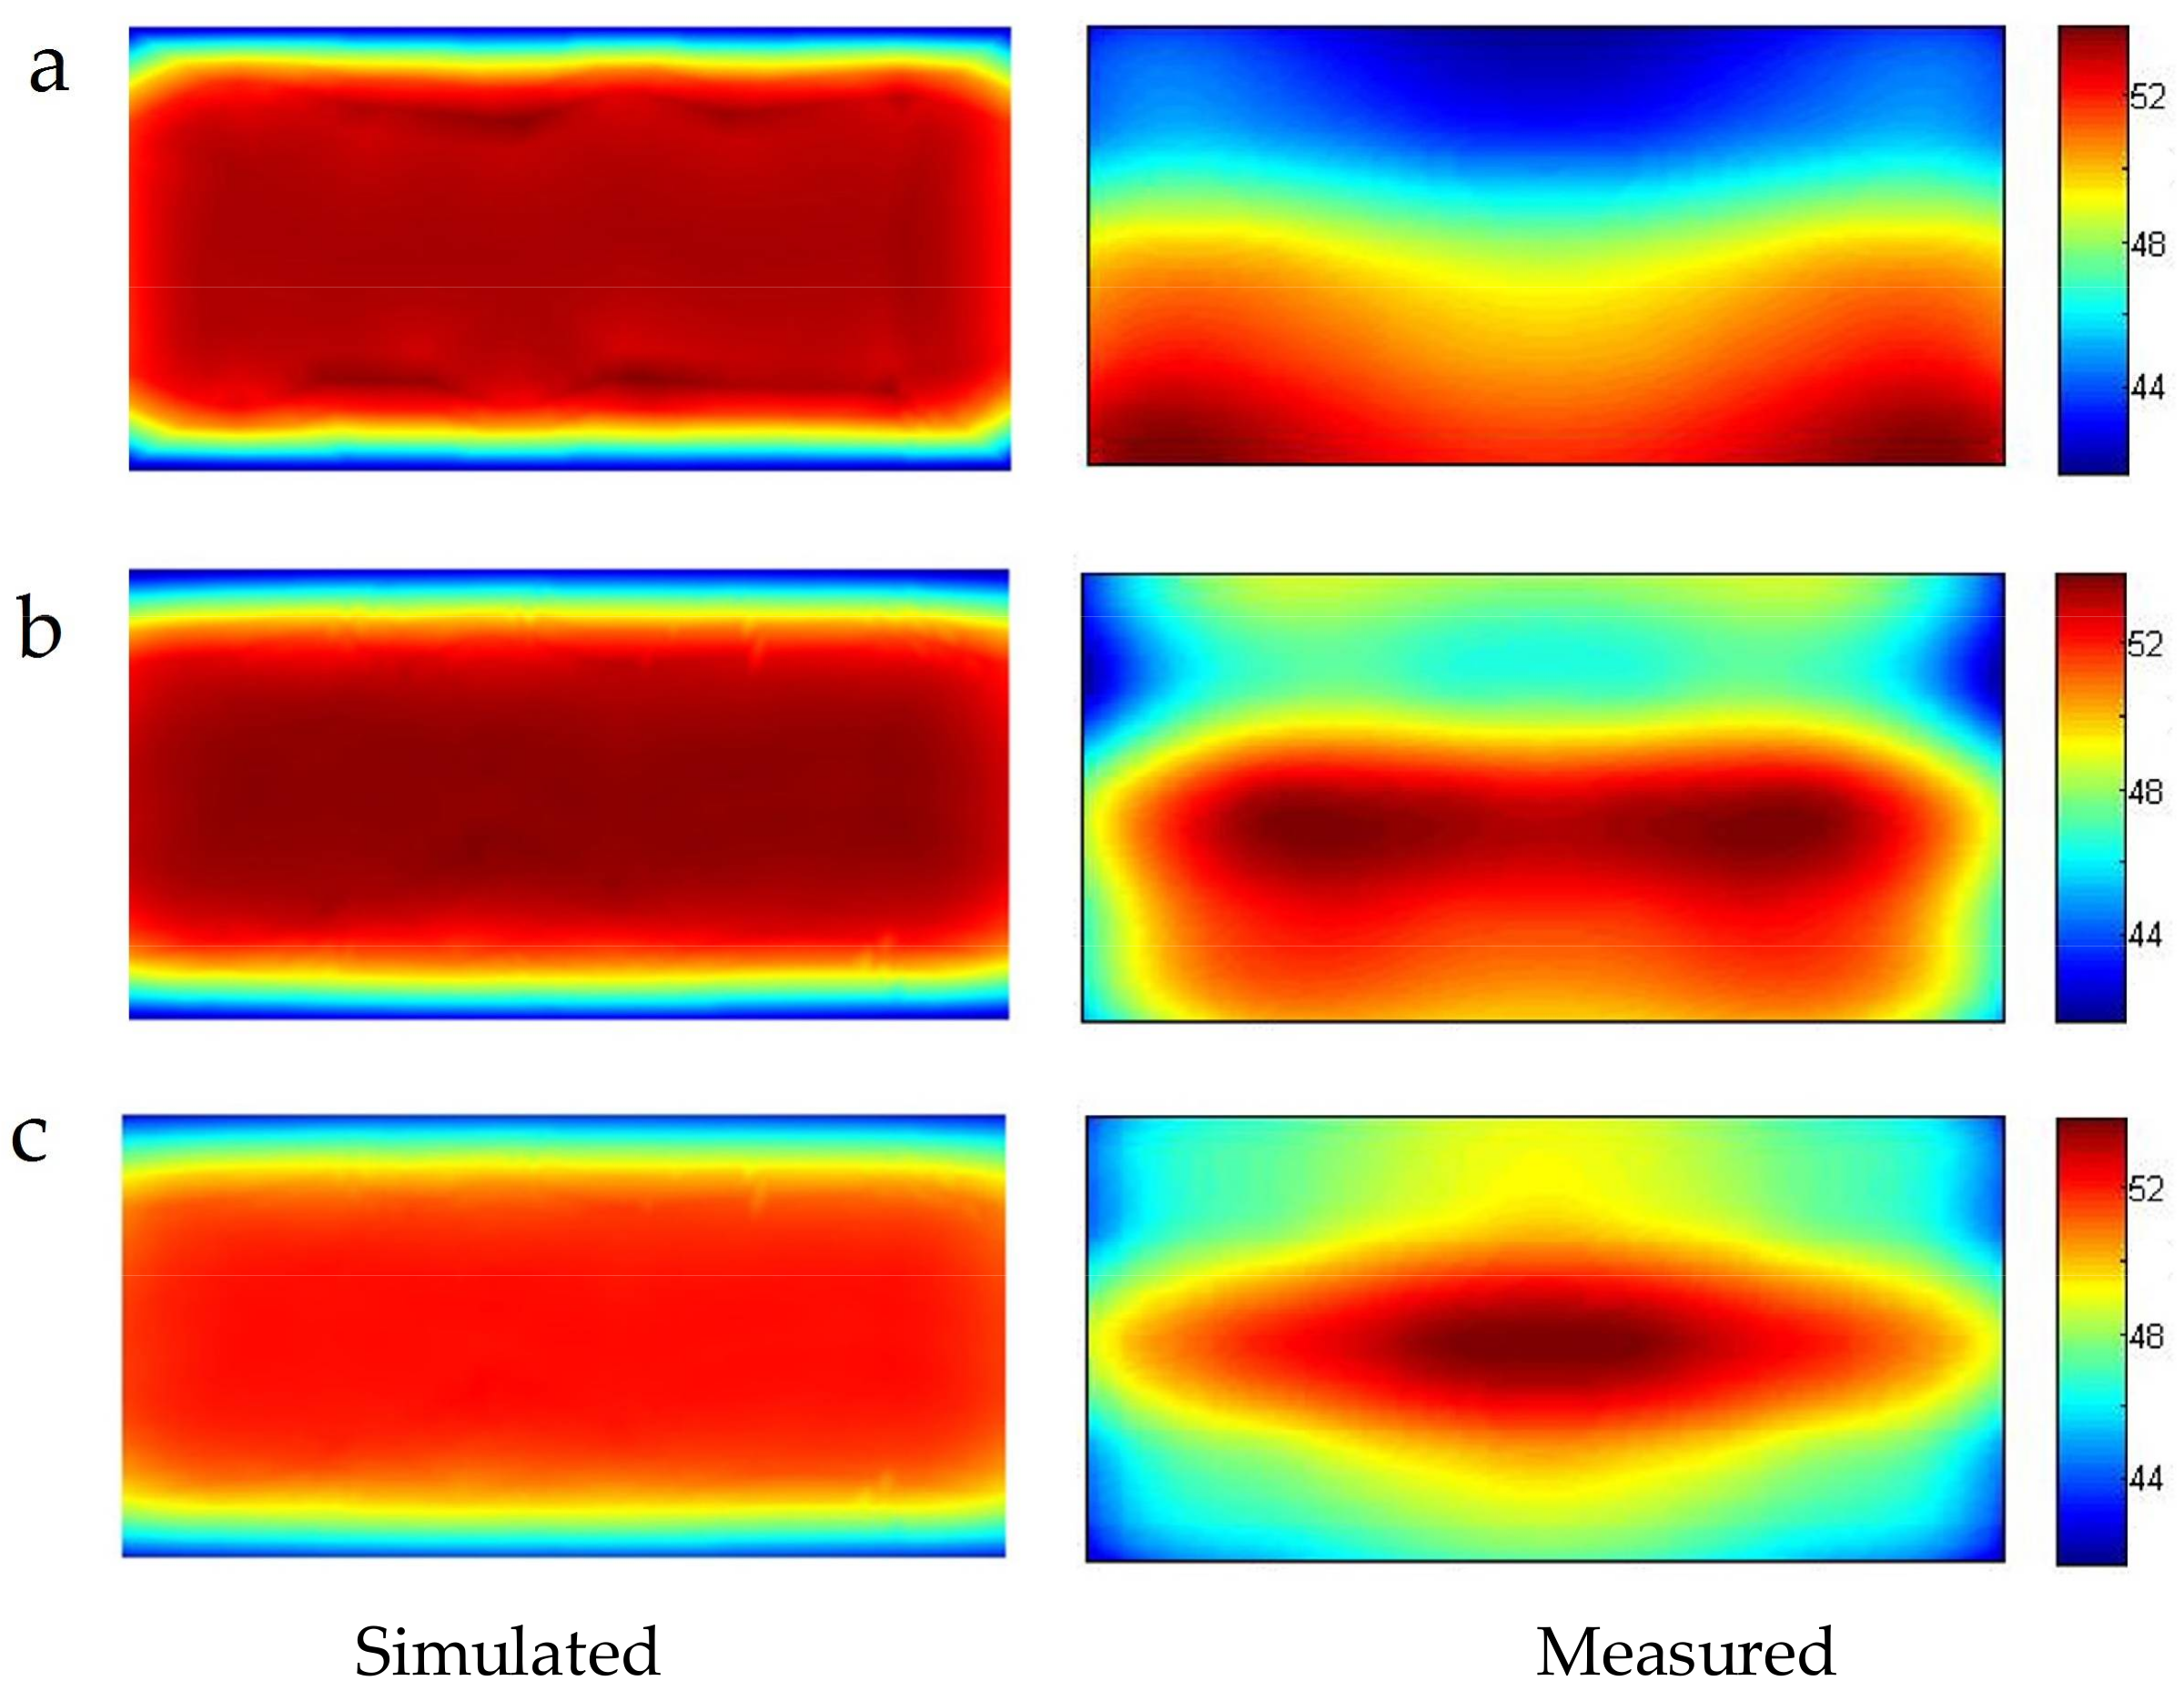
3.3. Comparison of Simulated and Measured Temperature Distribution under Different Moisture Contents
As shown in
Figure 9, the simulated and measured temperature distributions of the central section with different moisture contents (65%, 35%, and 15%) are compared and analyzed. In the early drying stage, the simulated and measured temperature distributions matched poorly, whereas at the later drying stage, they matched well. As the moisture content decreased, the temperature uniformity of the test material gradually increased, as suggested by the measured temperature distribution. This is because the moisture content of the test material was gradually distributed more uniformly because of the process of high-frequency drying.
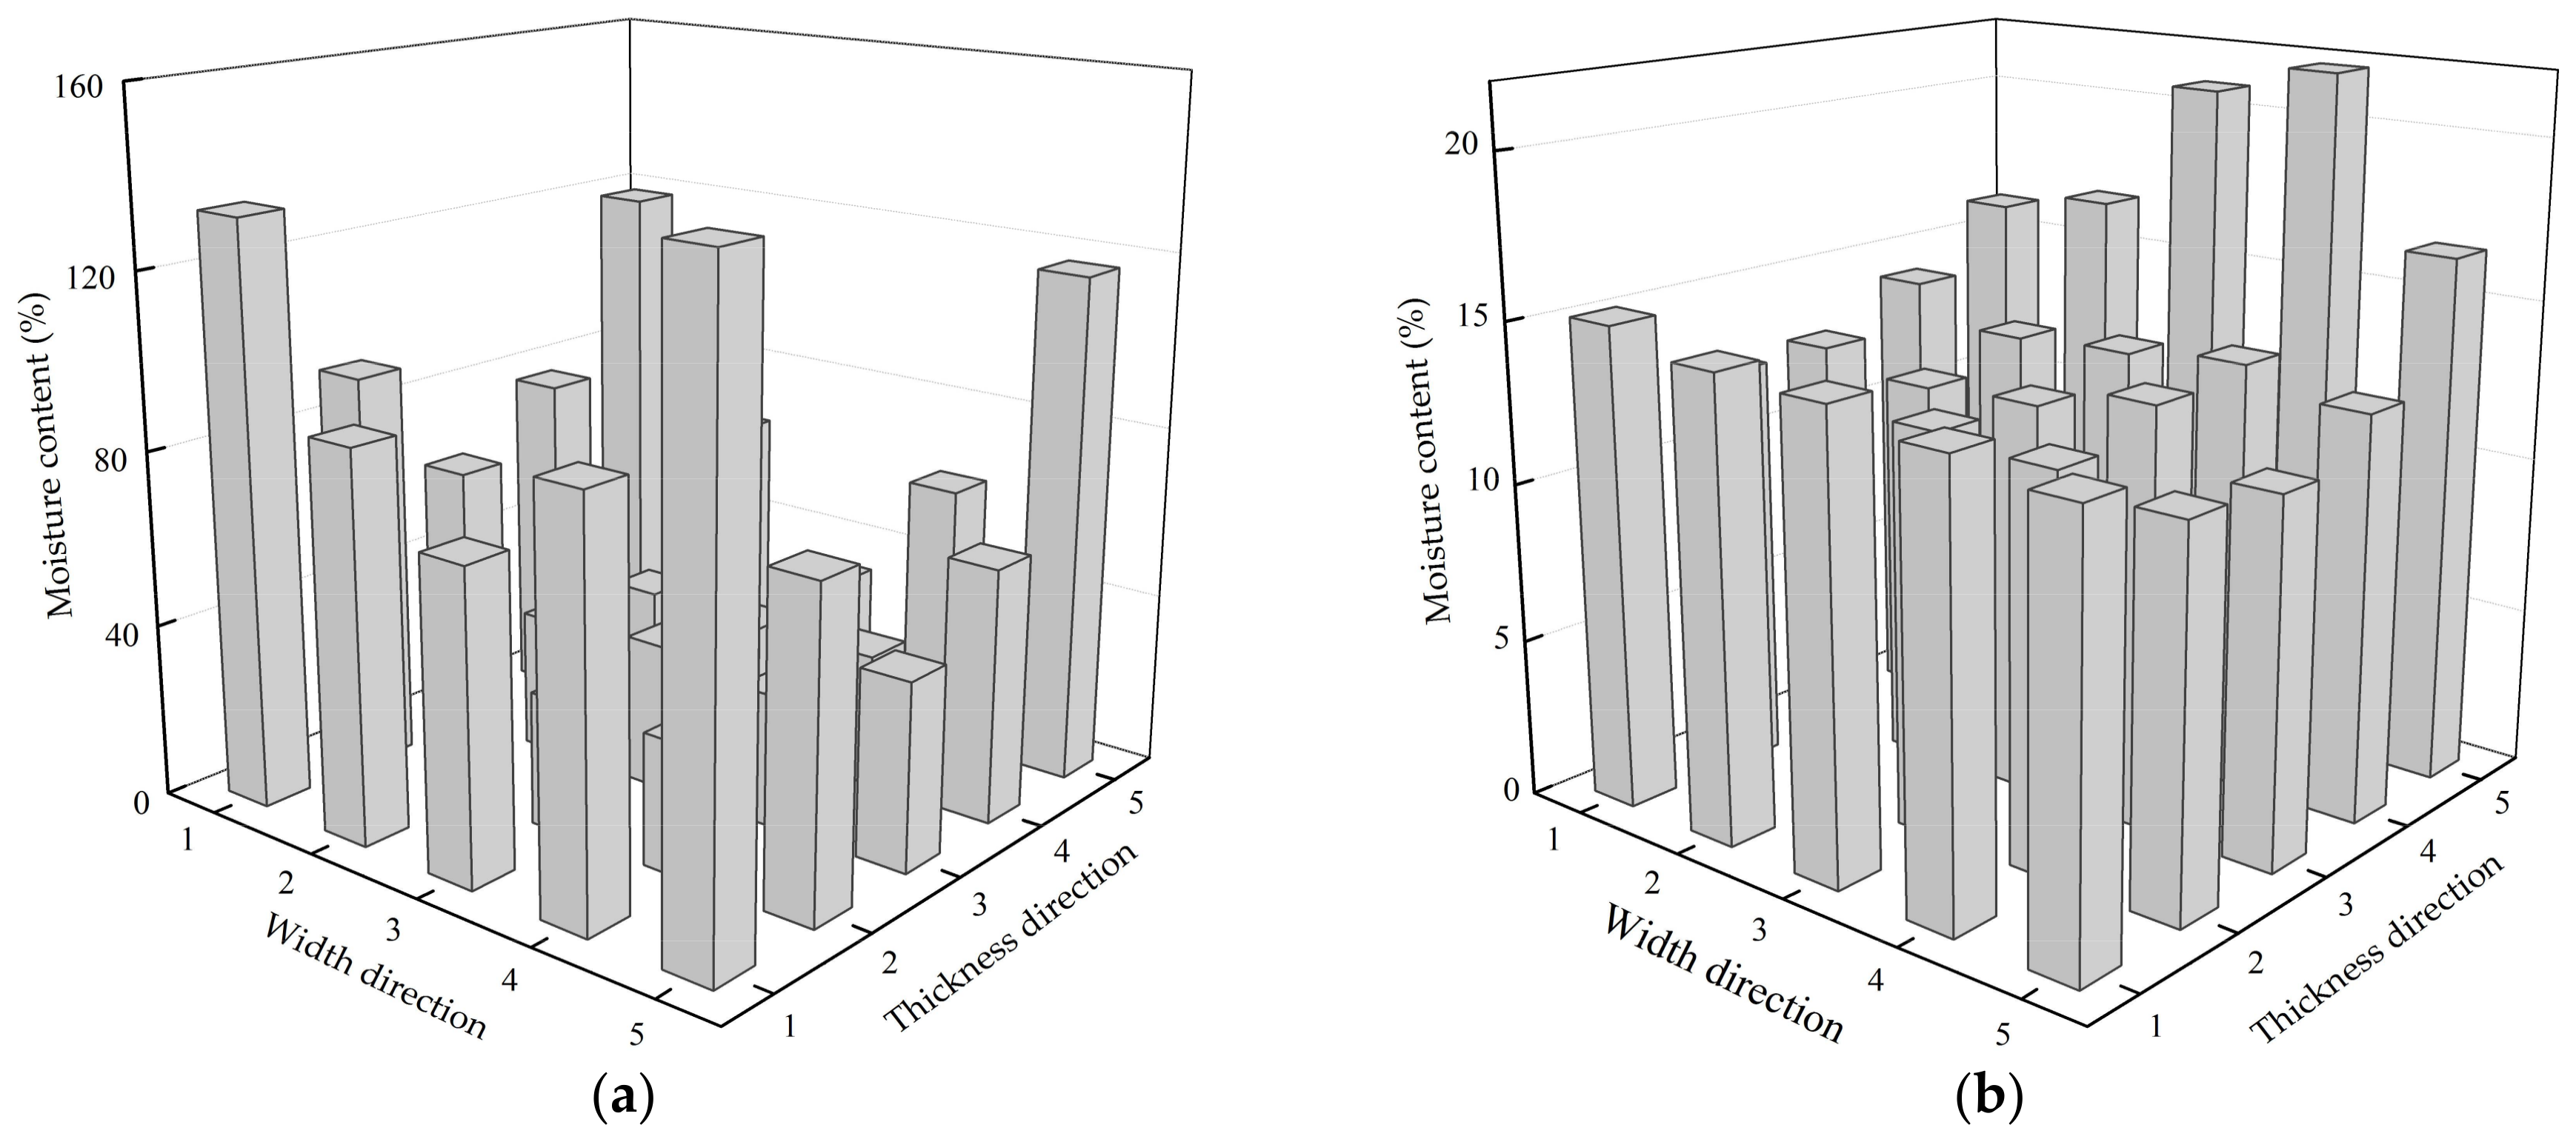
As shown in
Figure 10a, the moisture content of the test material was extremely unevenly distributed in the early stage of drying. The moisture content gradually decreased from the surface of the test specimen to the core layer. The moisture content of the surface was as high as 140%, whereas that in the center was only 30%. It was difficult to successfully incorporate the assumption of uniform material and moisture distribution, so the simulation and the measured temperature distribution matched poorly.
As shown in
Figure 10b, the moisture content of the test material was more evenly distributed in the later stages of drying. The moisture content of the test material in contact with the plate was higher than that of the other parts, whereas that in contact with the lower plate was the highest. This is because the plate that is in close contact with the specimen forms water condensate, which leads to really high moisture content on the specimen surface [
27]. The distribution of the moisture content in the later stage of drying was improved compared to the previous stage; this is more in line with the model assumptions, and hence, the simulated and measured temperature distribution matched better.
At the same time, when the high-frequency generator was used with constant power and frequency, more moisture in the material resulted in shallower penetration depth of high-frequency electromagnetic waves. A high moisture content in the early stage of drying was not conducive to electromagnetic waves penetrating the wood; therefore, it was performed in the later stage of drying, and high-frequency heating forms more easily inside and outside the lower temperature gradient [
28].
3.4. Error Analysis
In the process of high-frequency drying, the temperature distribution in wood was extremely complicated and was influenced by the uniformity of the high-frequency field distribution, differences in dielectric properties of different parts of wood, and heat dissipation at the wood surface [
29].
The primary factors causing the differences between the numerical simulation results and experimental test results are as follows: (1) numerical simulation was based on a variety of assumptions, and the mathematical model itself needs to be further improved [
30]; (2) the thermal parameters of wood in the paper are taken from the previous literature and have slight deviations from the actual situation; (3) for the actual measurement error, the temperature measurement points could be increased to improve the accuracy of temperature detection; and (4) the measurement accuracy of upper plate voltage. The plate voltage in the simulation process used a fixed value; however, the voltage of the actual heating process constantly changed with the drying, and the impact factors were complex.
Wood itself is a heterogeneous organic organism with great variability. There is a large difference in the dielectric properties of various parts of wood, and this leads to differences in high-frequency absorption capacity. Therefore, the temperature distribution inside wood might be more complicated during the actual high-frequency drying [
15]. All of these discussed factors led to the differences between the numerical simulation and measured results. As shown by comparative analysis of the experimental and calculated results, the mathematical model of heat transfer was fairly valid, and the simulation results are credible.
4. Conclusions
Based on the Maxwell equation and heat transfer equation, a three-dimensional temperature distribution model of wood during high-frequency heating was established using the finite element method.
The model accuracy was good for predicting changes in the heating rate and temperature. The high-frequency heating process of wood was fairly well predicted, and the various factors that influence changes in temperatures of the test material were more intuitively understood. In the early stages of drying, the failure to completely consider the actual differences in the moisture content distribution of samples led to a poor matching of simulated and measured temperature distribution maps. As drying progressed, the moisture content tended to be uniform and more in line with the model assumptions in the later stage of drying, and hence, the simulated and measured temperature distribution matched better.
The temperature field model could directly describe the temperature distribution characteristics of wood after high-frequency heating. The temperature variation characteristics of the surface and interior of wood could be understood using the model, and the theoretical and the experimental values showed good consistency. The predicted results of the model could be used to reduce the labor and time of the test. The established temperature field model provides the basic data and theoretical basis for improving the temperature uniformity of wood during high-frequency heating and for optimizing the quality of dried wood.


