Article

Spatial Variation in Leaf Stable Carbon Isotope Composition of Three Caragana Species in Northern China

1
Institute of Environmental Engineering, Ningxia University, Yinchuan 750021, China
2
Ningxia (China-Arab) Key Laboratory of Resource Assessment and Environmental Regulation in Arid Regions, Ningxia University, Yinchuan 750021, China
3
School of Life Science, Ningxia University, Yinchuan 750021, China
4
College of Resources and Environmental Science, Ningxia University, Yinchuan 750021, China
*
Author to whom correspondence should be addressed.
Forests 2018, 9(6), 297; https://doi.org/10.3390/f9060297
Submission received: 30 March 2018 / Revised: 18 May 2018 / Accepted: 22 May 2018 / Published: 25 May 2018
(This article belongs to the Special Issue Isotope Application in Forest Growth Assessment)

Abstract

:
Leaf stable carbon isotope (δ13C) composition provides comprehensive insight into plant carbon cycles and water use efficiency and has also been widely used to evaluate the response of plants to environmental change. In the present study, leaf δ13C was analyzed in samples of Caragana microphylla Lam., C. liouana Zhao, and C. korshinskii Kom. from 38 populations. These species provide great environmental benefits and economic value and are distributed east to west continuously across northern China. We studied the relationship of δ13C to altitude, mean annual precipitation (MAP), mean annual temperature (MAT), mean annual relative humidity (RH), leaf nitrogen (N), and phosphorus (P) concentrations to examine the patterns and controls of leaf δ13C variation in each species. Results indicated that, across the three species, leaf δ13C significantly decreased with MAP, RH, and leaf N and P concentrations, while it increased with altitude and MAT. However, patterns and environmental controls of leaf δ13C varied proportionally with species. C. korshinskii was mainly controlled by MAP and leaf N concentration, C. liouana was controlled by both MAT and MAP, and C. microphylla was mainly controlled by MAT. Further analysis indicated significant differences in leaf δ13C between species, which tended to increase from C. microphylla to C. korshinskii. Overall, these results suggest that the three Caragana species may respond differently to future climate change due to different controlling factors on leaf δ13C variation, as well as differentiation in water use efficiency, which likely contributes to the geographical distribution of these species.

1. Introduction

Leaf carbon isotope composition (δ13C) provides comprehensive insight into how plants interact with and respond to their biotic and abiotic environments, and also enhances our understanding of ecosystem carbon cycles [1,2]. As such, being able to assess the spatial variability of leaf δ13C across environmental gradients and identifying the patterns and controls of leaf δ13C would improve our understanding of how individual plants and ecosystems may respond and adapt to future global changes, including climate warming, atmospheric CO2 enrichment, shifts in precipitation, and N deposition [2,3,4,5]. Studies on this topic have recently received increasing attention [6,7,8,9,10].
Leaf δ13C is largely related to the ratio of CO2 partial pressure inside the leaf and ambient air (ci/ca) [11,12], which is driven by stomatal conductance and photosynthetic processes [11,12]. It has been shown in several studies that there is a strong positive correlation between δ13C and plant water use efficiency (WUE) via ci/ca [11,12,13], which suggests that leaf δ13C can be measured as a proxy for plant WUE [14,15,16,17,18,19,20,21]. WUE reflects the balance between carbon fixation and the amount of water consumed by plants. Therefore, WUE is one of the most indicative traits of survival capacity during drought [11,12,14]. Previous studies have shown that the WUE and the ability to tolerate low soil availability or compete for such resources differ between plant species [9,10]. For example, plants with higher δ13C or WUE tend to experience greater survival during drought conditions than those with lower δ13C or WUE [10,16,19].
Any factor that affects stomatal aperture or carboxylation ultimately influences the amount of δ13C in tissue. In particular, climatic factors including precipitation and temperature have been regularly reported to show strong negative correlations with leaf δ13C [15,19,22,23,24]. Other studies report that plant δ13C correlates with altitude [10,14,18,25]. However, the response of plant δ13C to altitude remains controversial and unresolved [22,25,26,27,28], with studies having found that leaf δ13C increases [28], decreases, or remains constant [27] with increasing altitude. That leaf δ13C varies nonlinearly with altitude has also been reported [25].
Nitrogen (N) and phosphorus (P) are essential elements for plants to function. For example, enzymes such as RuBP carboxylase contain large quantities of N [29]. An increase in photosynthesis might induce less discrimination against δ13C and therefore lead to higher δ13C. Consequently, a considerable number of studies have found a positive correlation between leaf N concentration and δ13C [30,31,32,33,34]. However, negative correlations and no correlation have also been reported [35,36,37,38]. P indirectly affects plant photosynthesis and subsequently leaf δ13C because P is one of the key components in enzymes associated with the Calvin cycle and the synthesis of protein, RNA, and DNA [34,35,36,37,38]. However, research relating leaf P to δ13C is limited and the findings are inconsistent. Studies have found that the correlation between P and δ13C can be positive [39], negative [40,41], or completely unrelated [42]. Further, studies have also indicated that the patterns of leaf δ13C across environmental gradients differ with plant genus [9], species [8,25], and plant functional group [14,19,28,43,44]. Therefore, these conflicting results suggest that patterns of leaf δ13C are variable with respect to leaf nutrients, and climatic and geographic variables, and that further research is needed to understand the interactions between plant δ13C and environmental factors for a single genus or species.
In arid and semi-arid regions, the availability of water, nutrients, and temperature are crucial for determining plant performance, abundance, and distribution [1,2]. Particularly, regions in northern China that are characterized by drastic changes in precipitation, temperature, and soil nutrient availability from east to west offer an ideal ‘natural experiment’ to explore spatial patterns and environmental drivers of leaf δ13C in local plant species. In these regions, the genus Caragana exemplifies a combination of important environmental benefactors and valued economic resources for its role in sand fixation and as fodder [45,46,47,48,49,50]. Caragana microphylla Lam., C. liouana Zhao, and C. korshinskii Kom.are three of the most common species in the desert region of the Inner Mongolian Plateau of northern China. Interestingly, these three species have been identified as being derived from the same ancient species, undergoing divergent speciation during the Qinghai-Tibetan Plateau uplift and the Asian interior aridification [45]. To date, these three species have dominantly occupied distinct desert regions on the Inner Mongolian Plateau and form obvious spatially distinct distributions from east to west [45,46]. Previously, we have found that these three species diverge substantially in growth and physiological parameters in response to drought stress during a controlled experiment. C. korshinskii appeared to be the most drought-tolerant species with a superior growth rate and water use efficiency compared to the other two species [51,52]. As such, evaluating the patterns and environmental controls of δ13C in these three species will not only help predict how these species respond to future climate change, but will also provide evidence for the physiological mechanisms underlying the distribution pattern of these three closely related Caragana species.
In this study, we collected leaf samples of three Caragana species along an east to west transect in northern China and measured leaf δ13C. Our objectives were to (1) quantify the variation in leaf δ13C of the three species along the environmental gradients and determine the patterns and environmental controls of leaf δ13C; and (2) test whether there were differences in leaf δ13C between the three species and whether these differences corresponded with their geographical distributions.

2. Materials and Methods
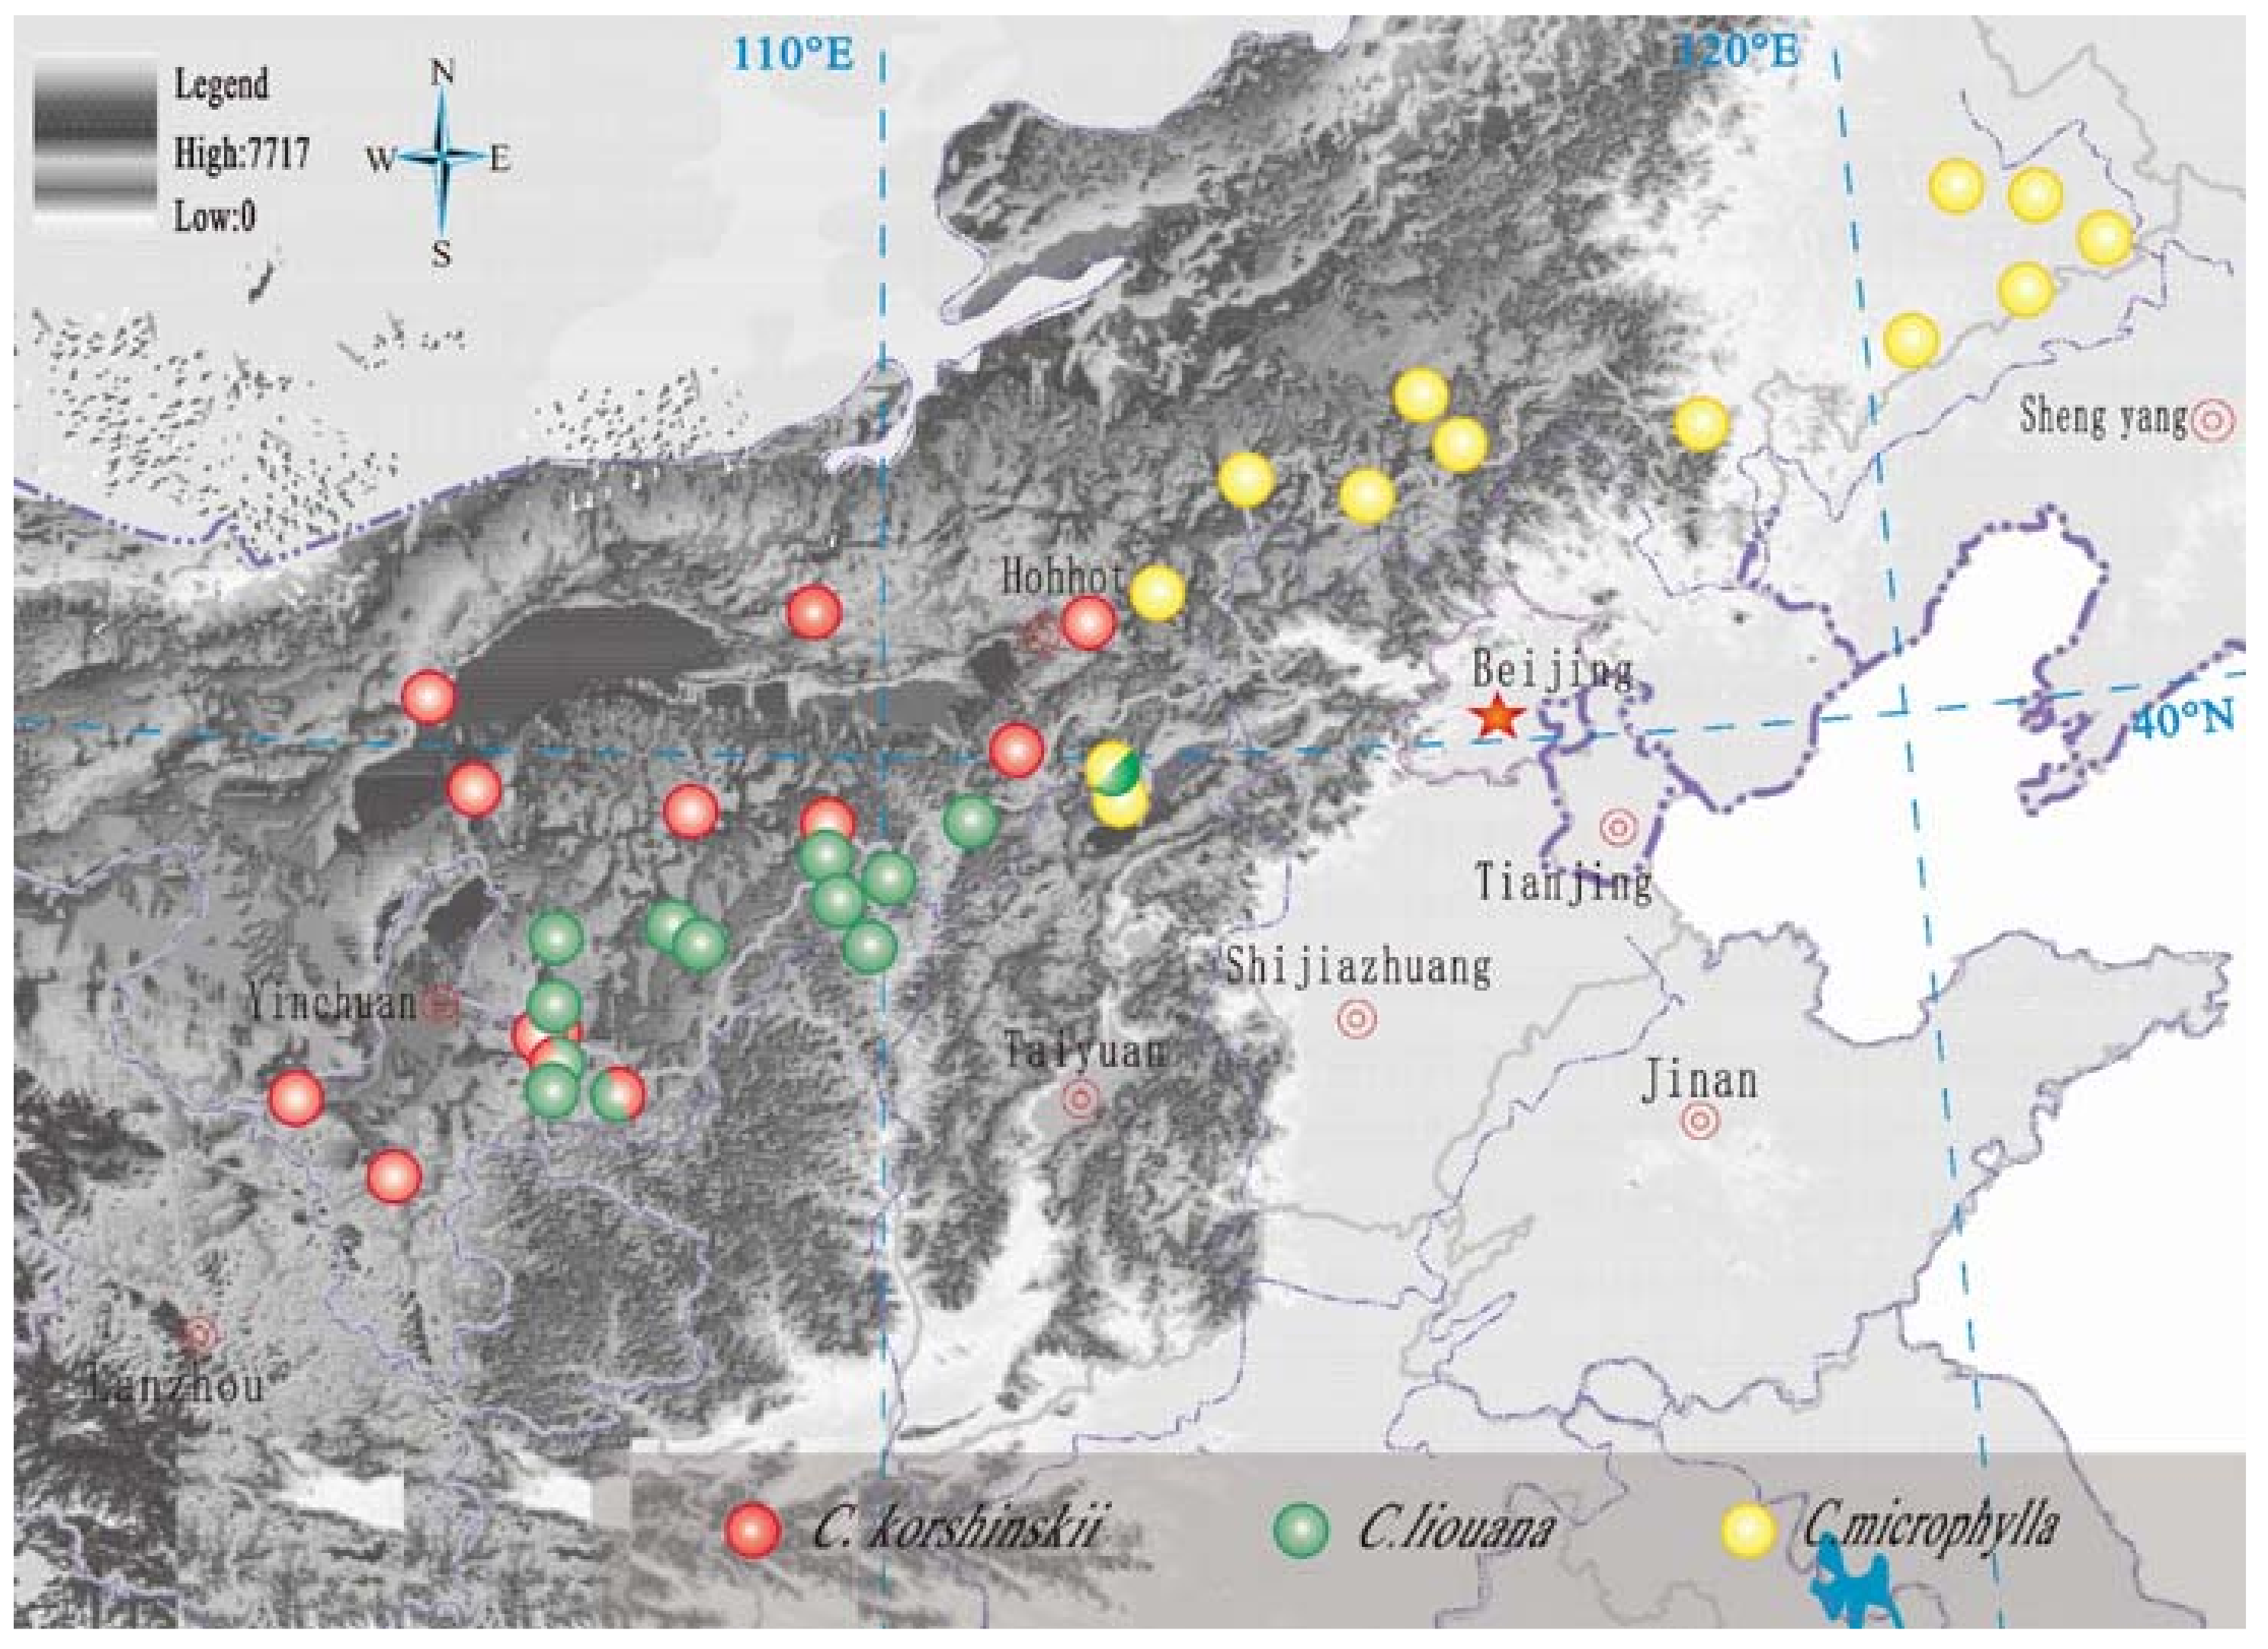
2.1. Study Area

This study was conducted along an east to west transect in arid and semi-arid regions of northern China, starting in Bayannaoer City and ending in the Khorchin District in the Nei Mongol Autonomous Region (Figure 1). The longitude of the transect covered approximately 16°, ranging from 104°57′ E to 122°28′ E, and the latitude ranged from 37°20′ N to 43°63′ N. Altitude varied from 227 to 1789 m above sea level. The climate was characterized as predominantly arid and semi-arid continental. Mean annual precipitation (MAP) ranged from 87.2 to 434.4 mm and mean annual air temperature (MAT) ranged from 1.4 to 8.4 °C (in supplementary file, Table S1).

2.2. Sampling and Measurements

In August 2015, leaf samples were collected from 38 populations (12 for C. korshinskii, 13 for C. liouana, and 13 for C. microphylla) along the east to west transect in northern China (Figure 1). At each sampling site, fully expanded sun-exposed leaves were collected from four different individual plants 5 m apart from each other and pooled into one sample, which means that three replicates were collected for each population. All samples were collected from robust mature plants that grew in unshaded habitats. Plant samples collected at each site were placed in paper envelopes, rinsed with deionized water to remove dust particles, and dried at 65 °C for 48 h to a constant weight in the oven upon returning to the laboratory. After grinding with a ball mill, they were stored in plastic bags until further analysis. Leaf δ13C values were determined from 5–6 mg of homogeneously ground material from each replicate using an isotope ratio mass spectrometer (Finnigan MAT-253, Thermo Electron, Gormley, ON, Canada). The stable carbon isotope ratio (δ13C, ‰) of each sample was calculated as δ13C (‰) = (Rsample/Rstandard − 1) × 1000, where Rsample and Rstandard represent the 13C/12C ratio in the leaf sample and standard, respectively. Nitrogen (N) concentrations in leaf samples were simultaneously determined. Leaf phosphorus concentrations were measured colorimetrically using molybdenum blue spectrophotometry (6505 UV spectrophotometer, Jenway, Stone, UK).

2.3. Meteorological Data

The latitude, longitude, and altitude of each sampling location was recorded using a GPS (Global Positioning System) (eTrex Venture, Garmin, Olathe, KS, USA). MAP, MAT, and mean annual relative humidity (RH) of each sampling site were provided by the IWMI (International Water Management Institute) online climate summary service portal (http://wcatlas.iwmi.org/Default.asp), based on geographical coordinates (latitude and longitude). Detailed geographical and environmental information is presented in Table S1.

2.4. Data Analysis

Statistical analyses were carried out using the SPSS 16.0 package (IBM, Chicago, IL, USA). Due to the difference in sample size between the three species, we performed a standardized z-score normalization for the climate and leaf trait data before it was analyzed with the Pearson correlation analysis, regression analysis, and one-way analysis of variance (ANOVA). The normal distribution of measured variables was tested and the data with a normal distribution was analyzed using ANOVA and Tukey’s post hoc test, while the non-normal distribution data was analyzed using the non-parametric Mann-Whitney test to determine the difference in leaf δ13C between species. The regression analysis was applied to investigate the relationship between leaf δ13C and variables including climatic factors, altitude, and leaf N and P concentrations. Multiple regressions, using a stepwise selection procedure based on Akaike information criteria (AIC), were applied to define the contribution of altitude, MAP, MAT, RH, and N and P concentrations to the variation in leaf δ13C among the three Caragana species. A p-value of <0.05 was considered statistically significant.

3. Results

3.1. Variation across the Sites in Climate and Leaf Nutrient Composition of Three Caragana Species

Climatic variables varied significantly among populations and among species (Table 1, Table S1). C. korshinskii showed a significantly higher mean population MAP than C. liouana or C. microphylla. The mean population MAT of C. microphylla appeared to be significantly lower than for C. korshinskii and C. liouana, but RH was significantly higher. In addition, mean population leaf N and P concentrations of C. korshinskii exhibited significantly higher values than those of C. liouana and C. microphylla (Table 1).

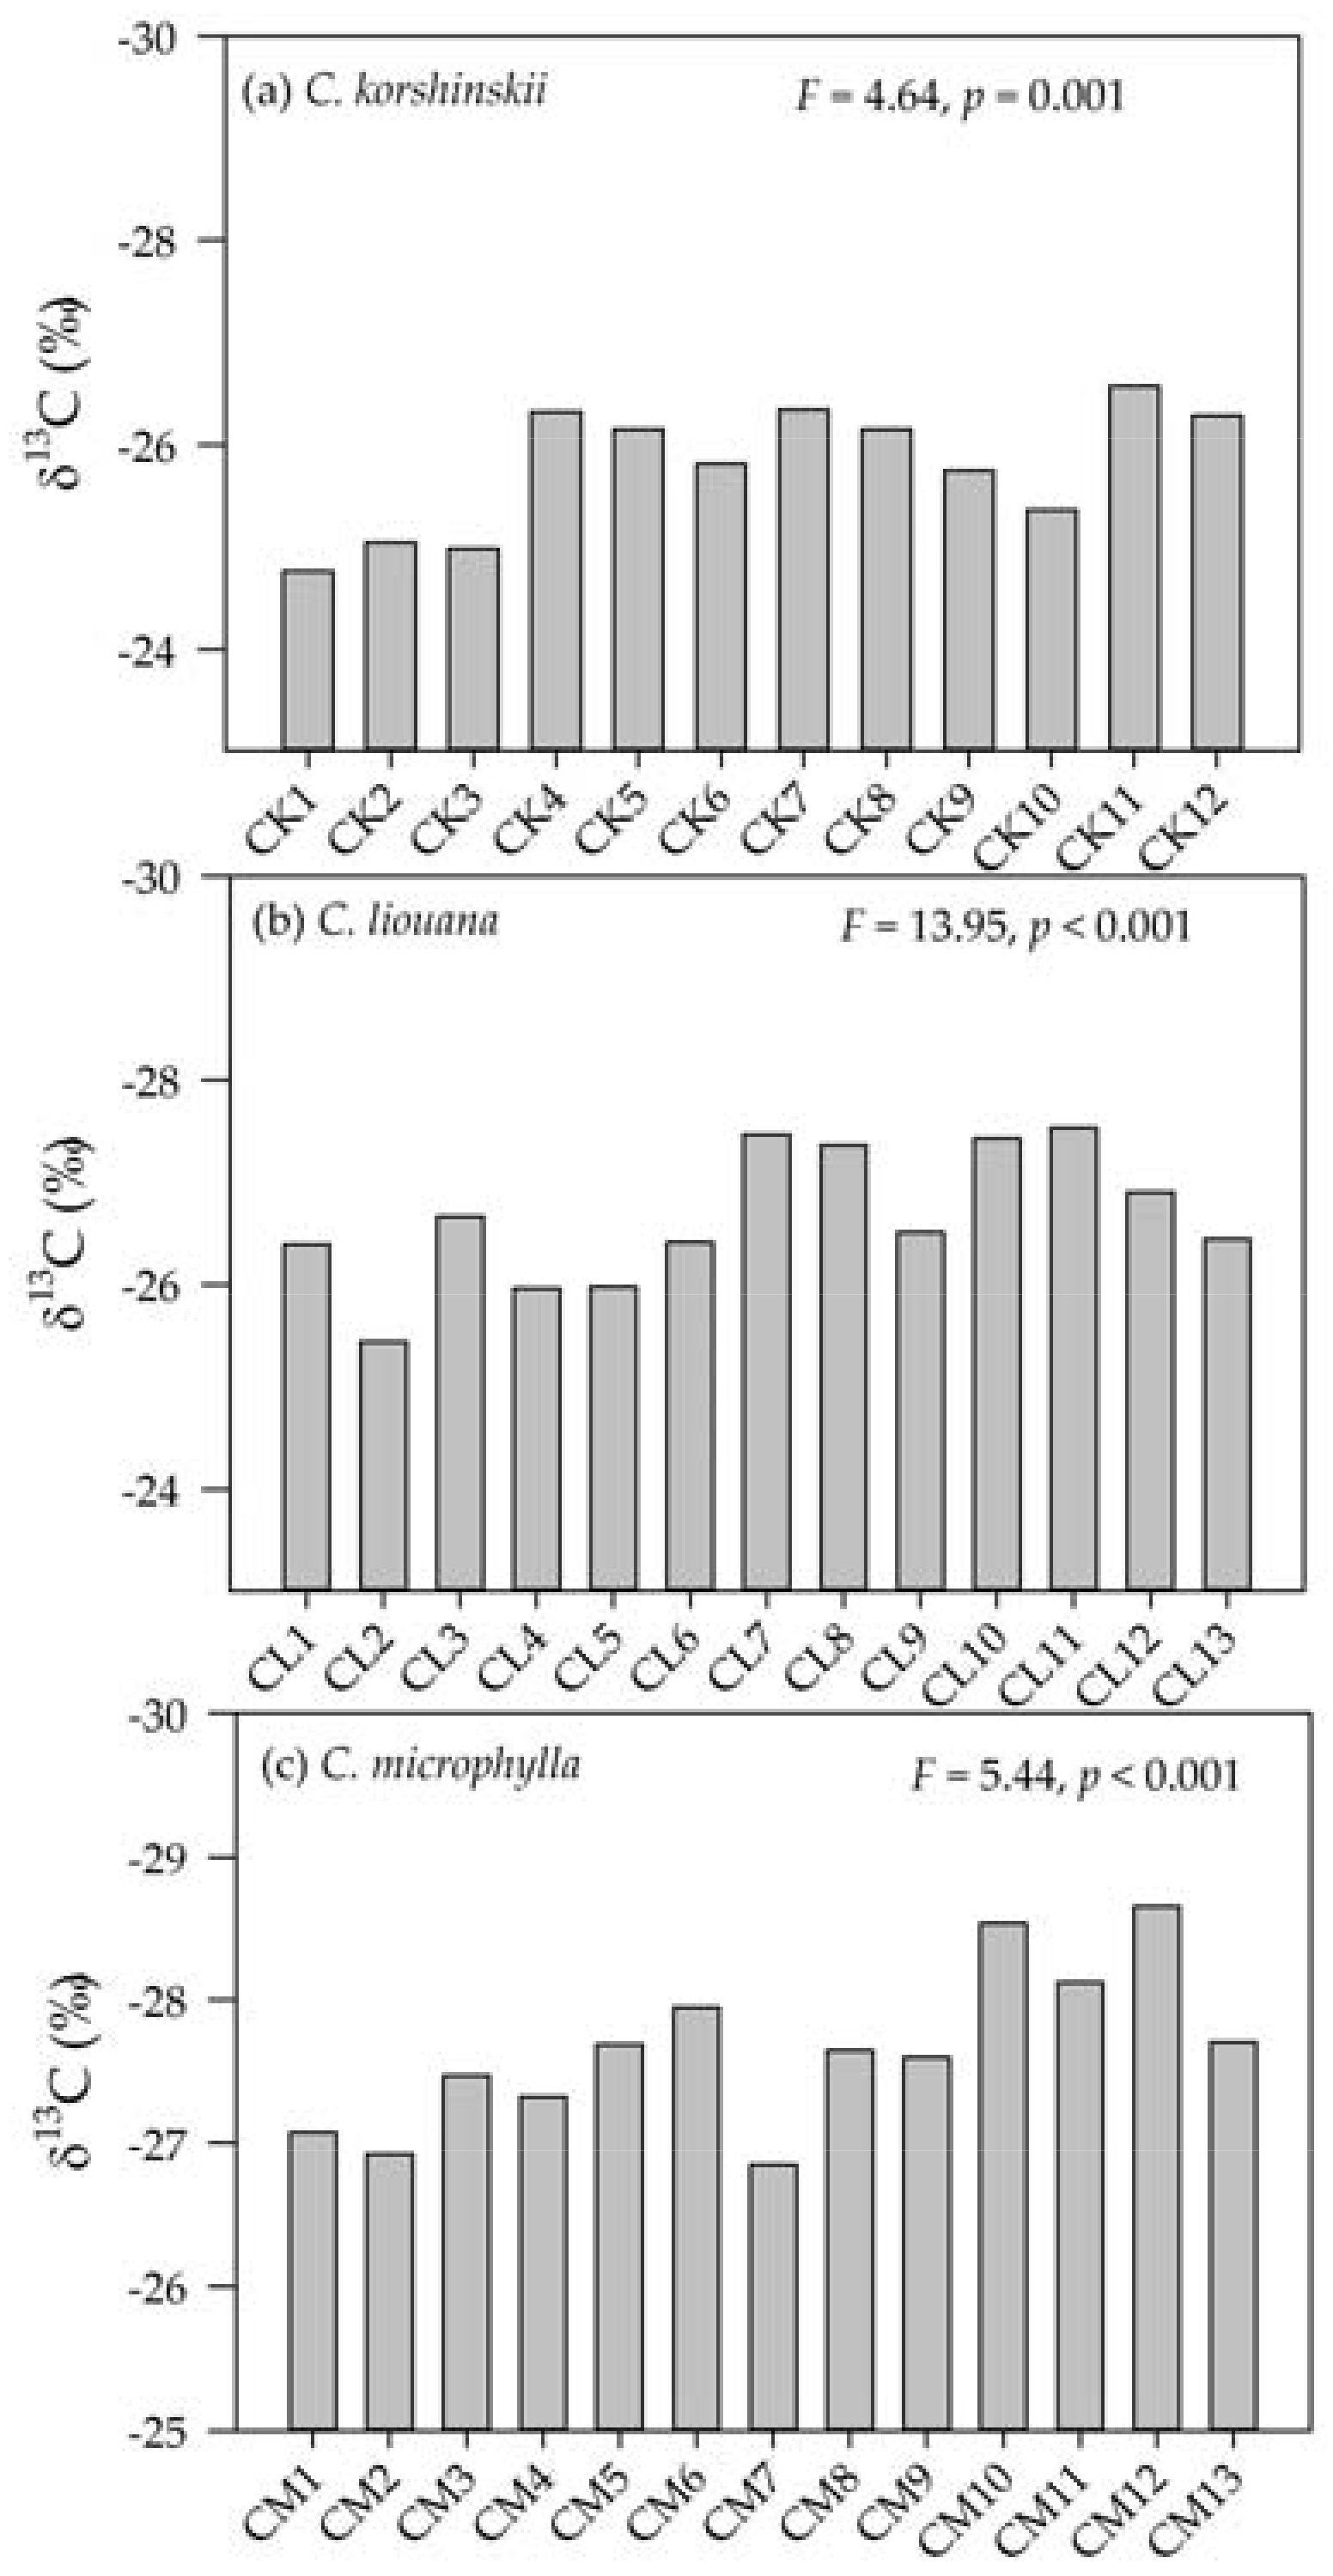
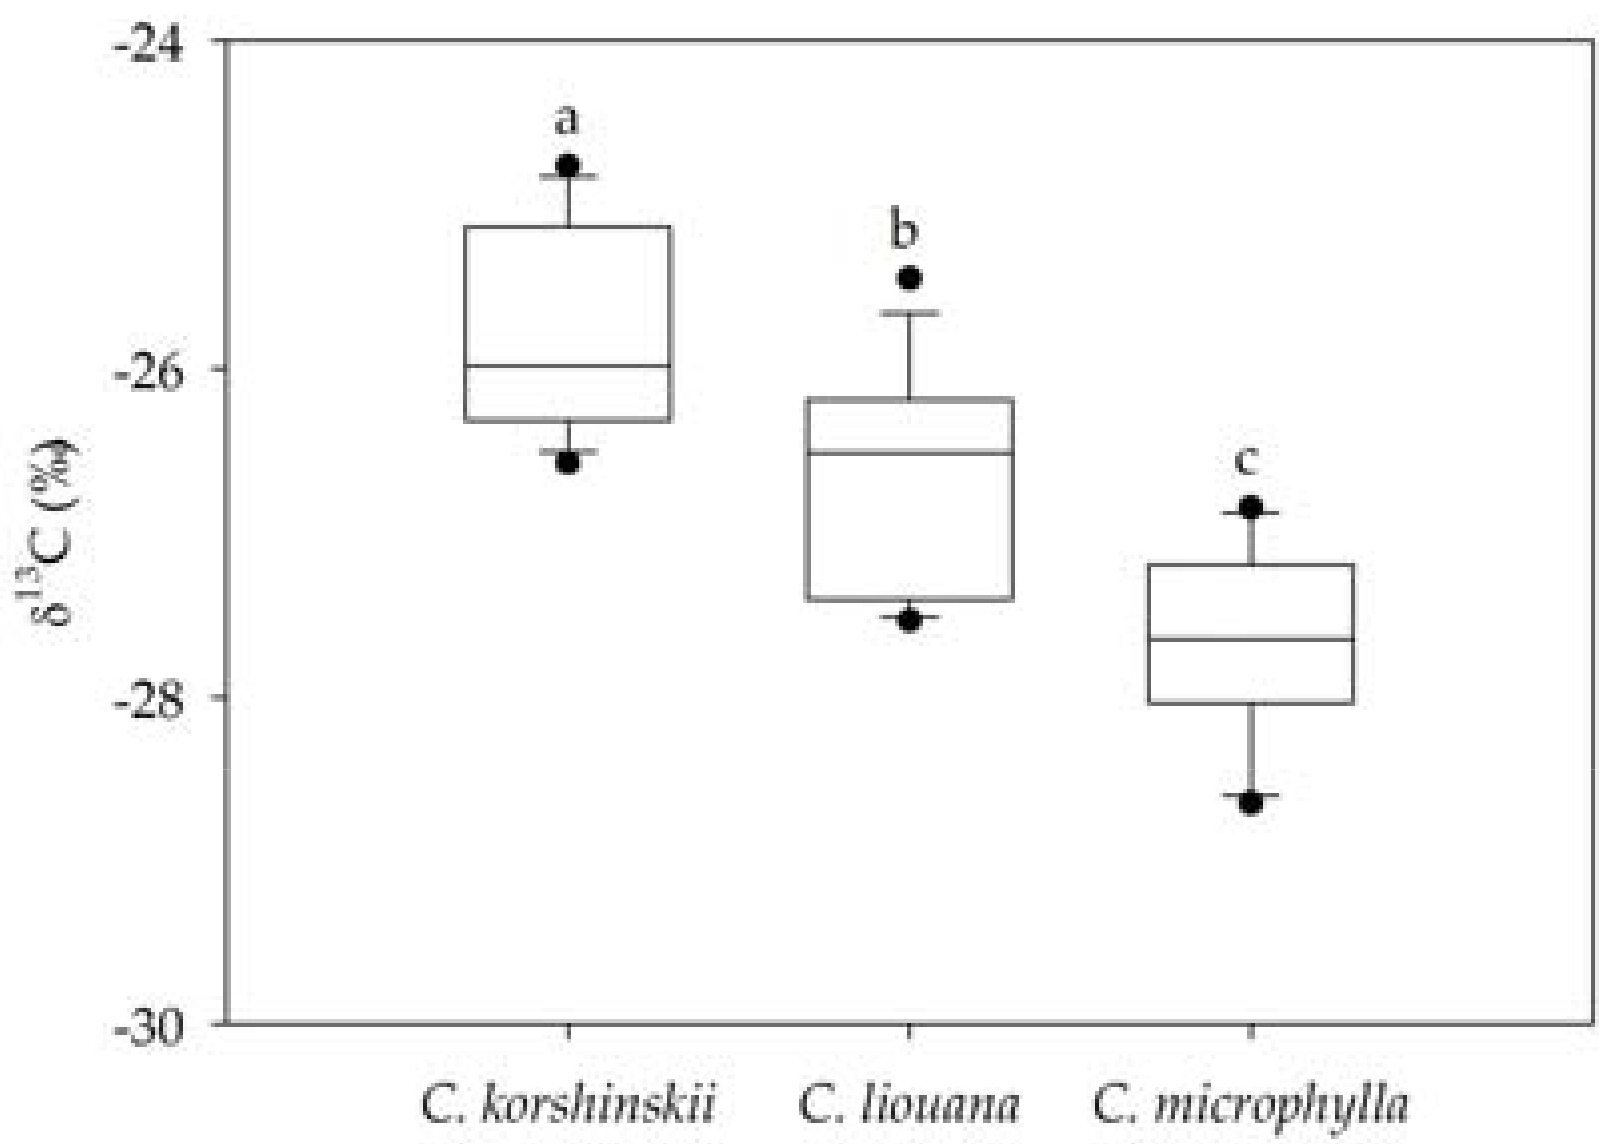
3.2. Variation in Leaf δ13C within and Among Species

Leaf δ13C showed substantial variability among populations for each of the three species, with C. korshinskii ranging from −26.57 to −24.77‰, C. liouana from −27.53 to −25.45‰, and C. microphylla from −28.65 to −26.85‰ (Figure 2, p < 0.001). Differences in δ13C between species were also significant, with the highest mean δ13C (−25.79 ± 0.61‰) found in C. korshinskii, C. liouana having an intermediate mean (−26.66 ± 0.65‰), and the lowest mean found in C. microphylla (−27.66 ± 0.56‰) (Figure 3).

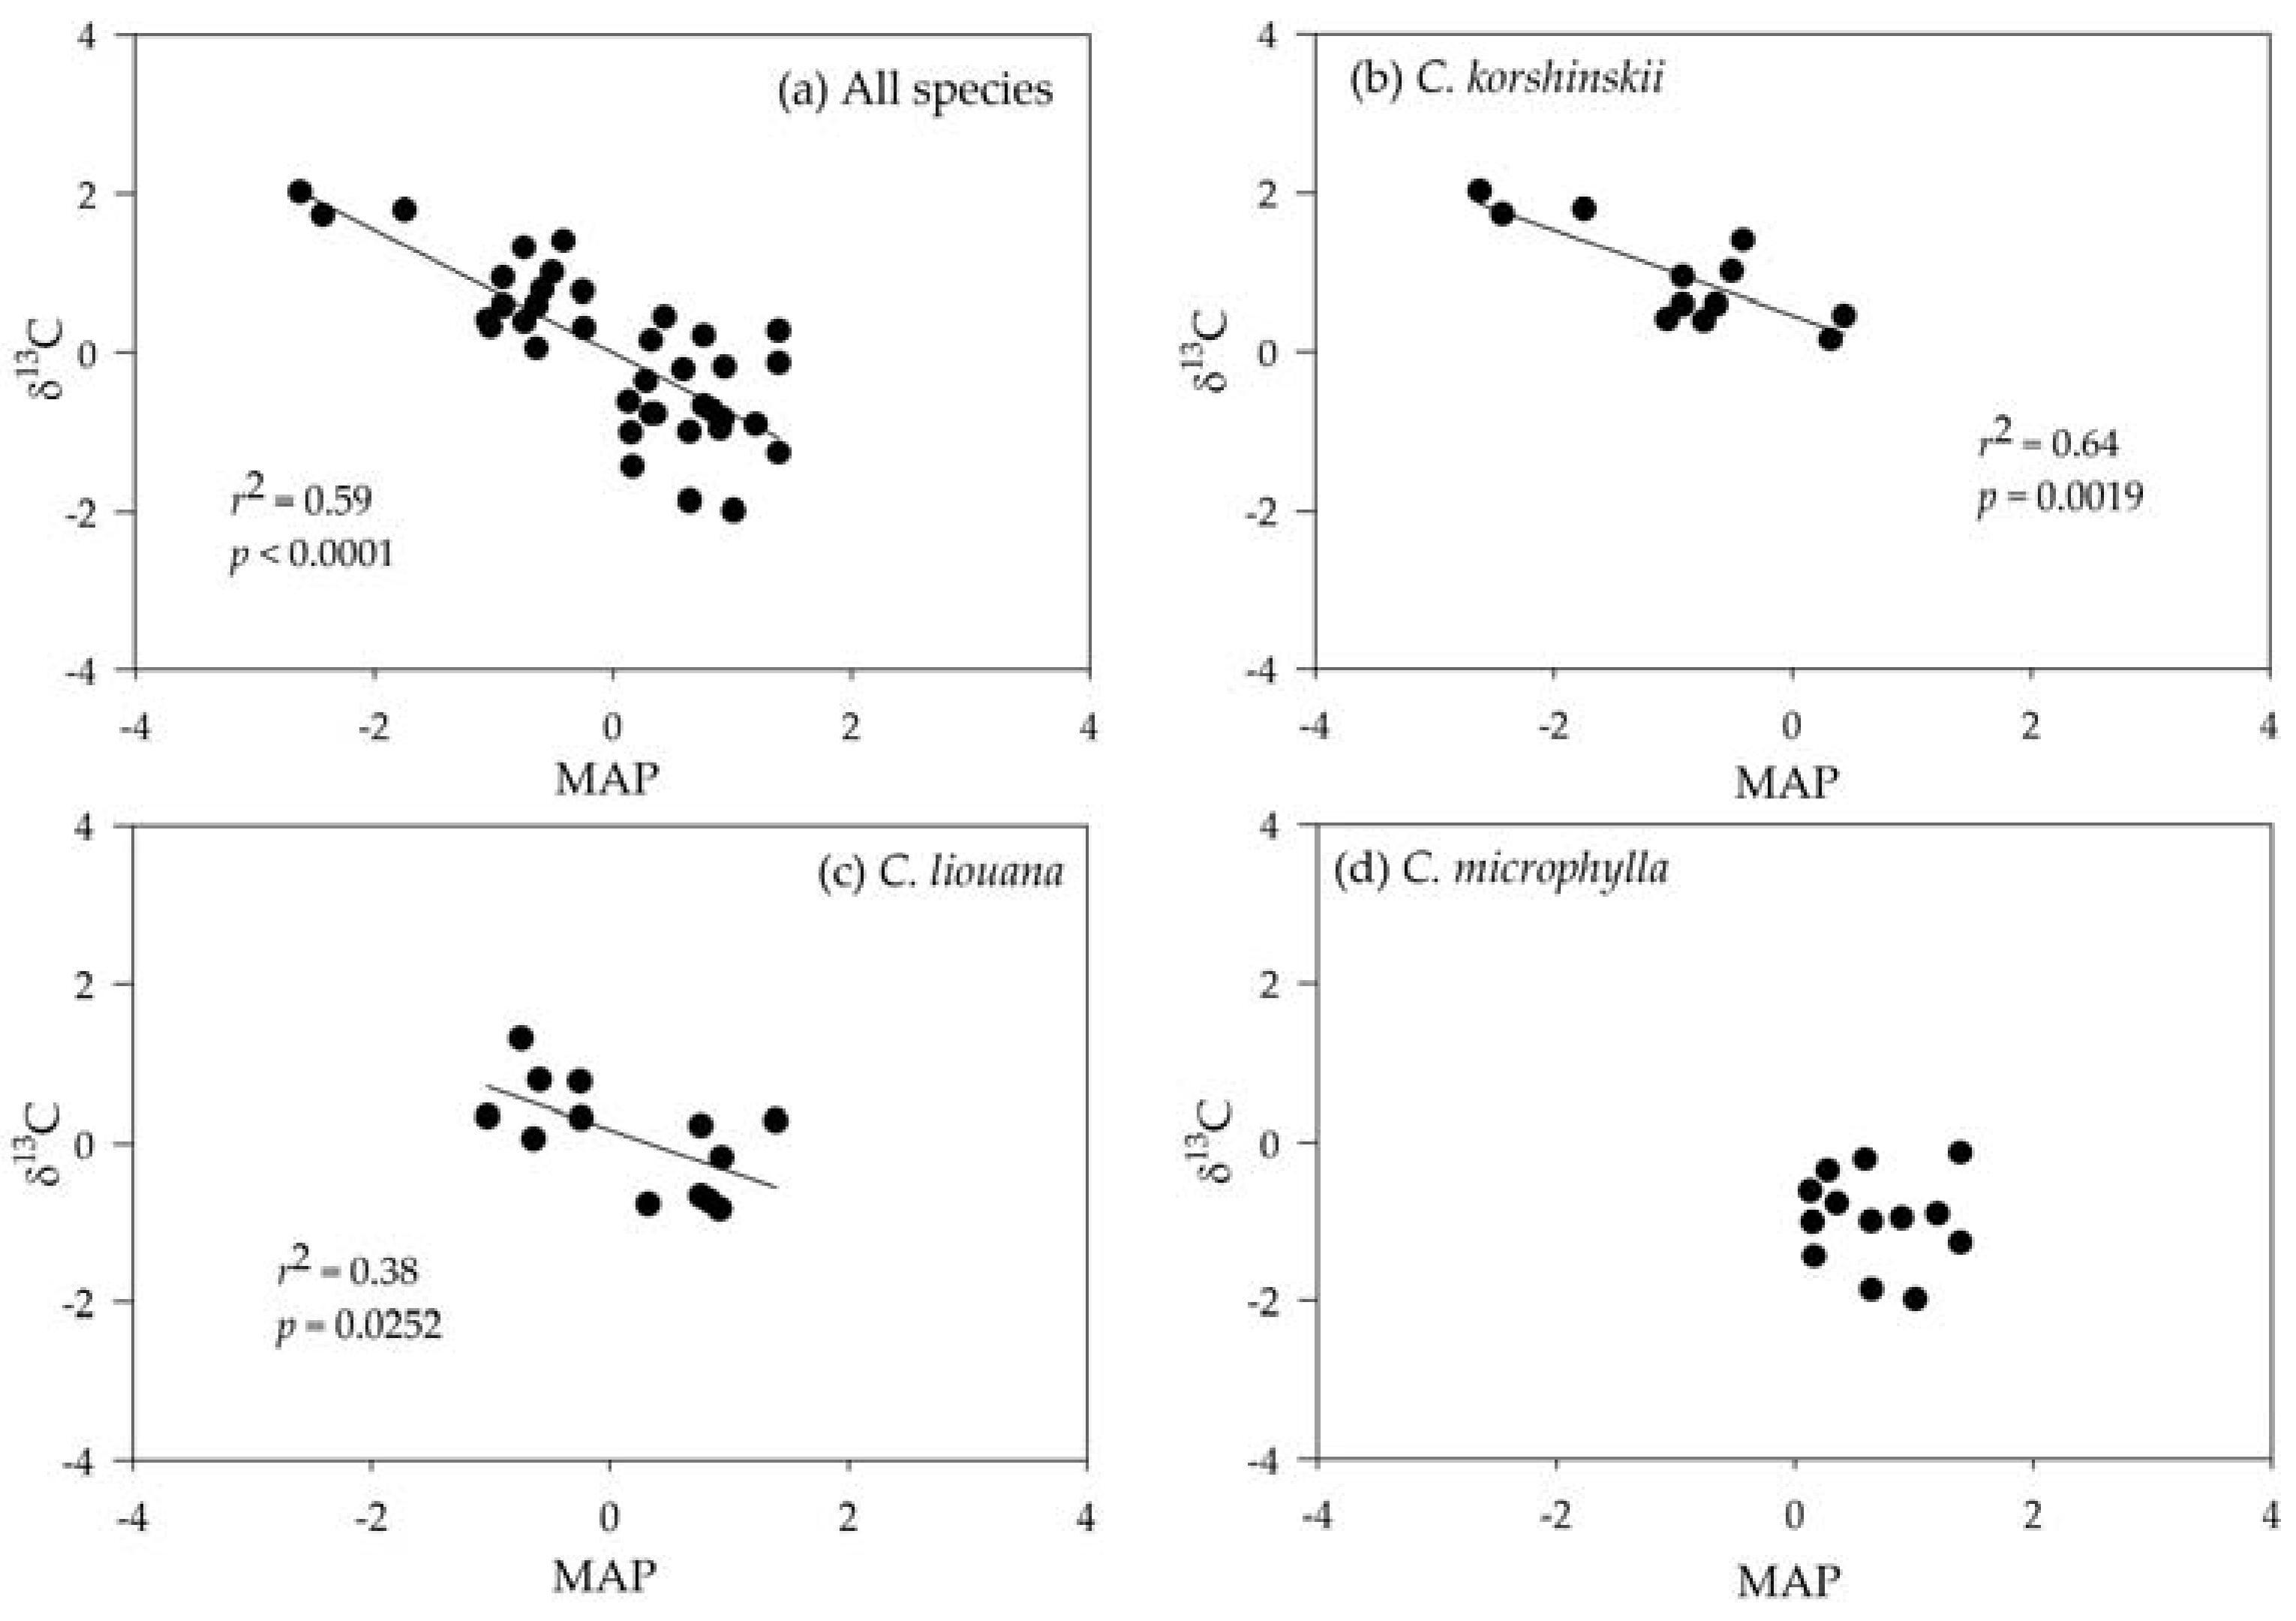
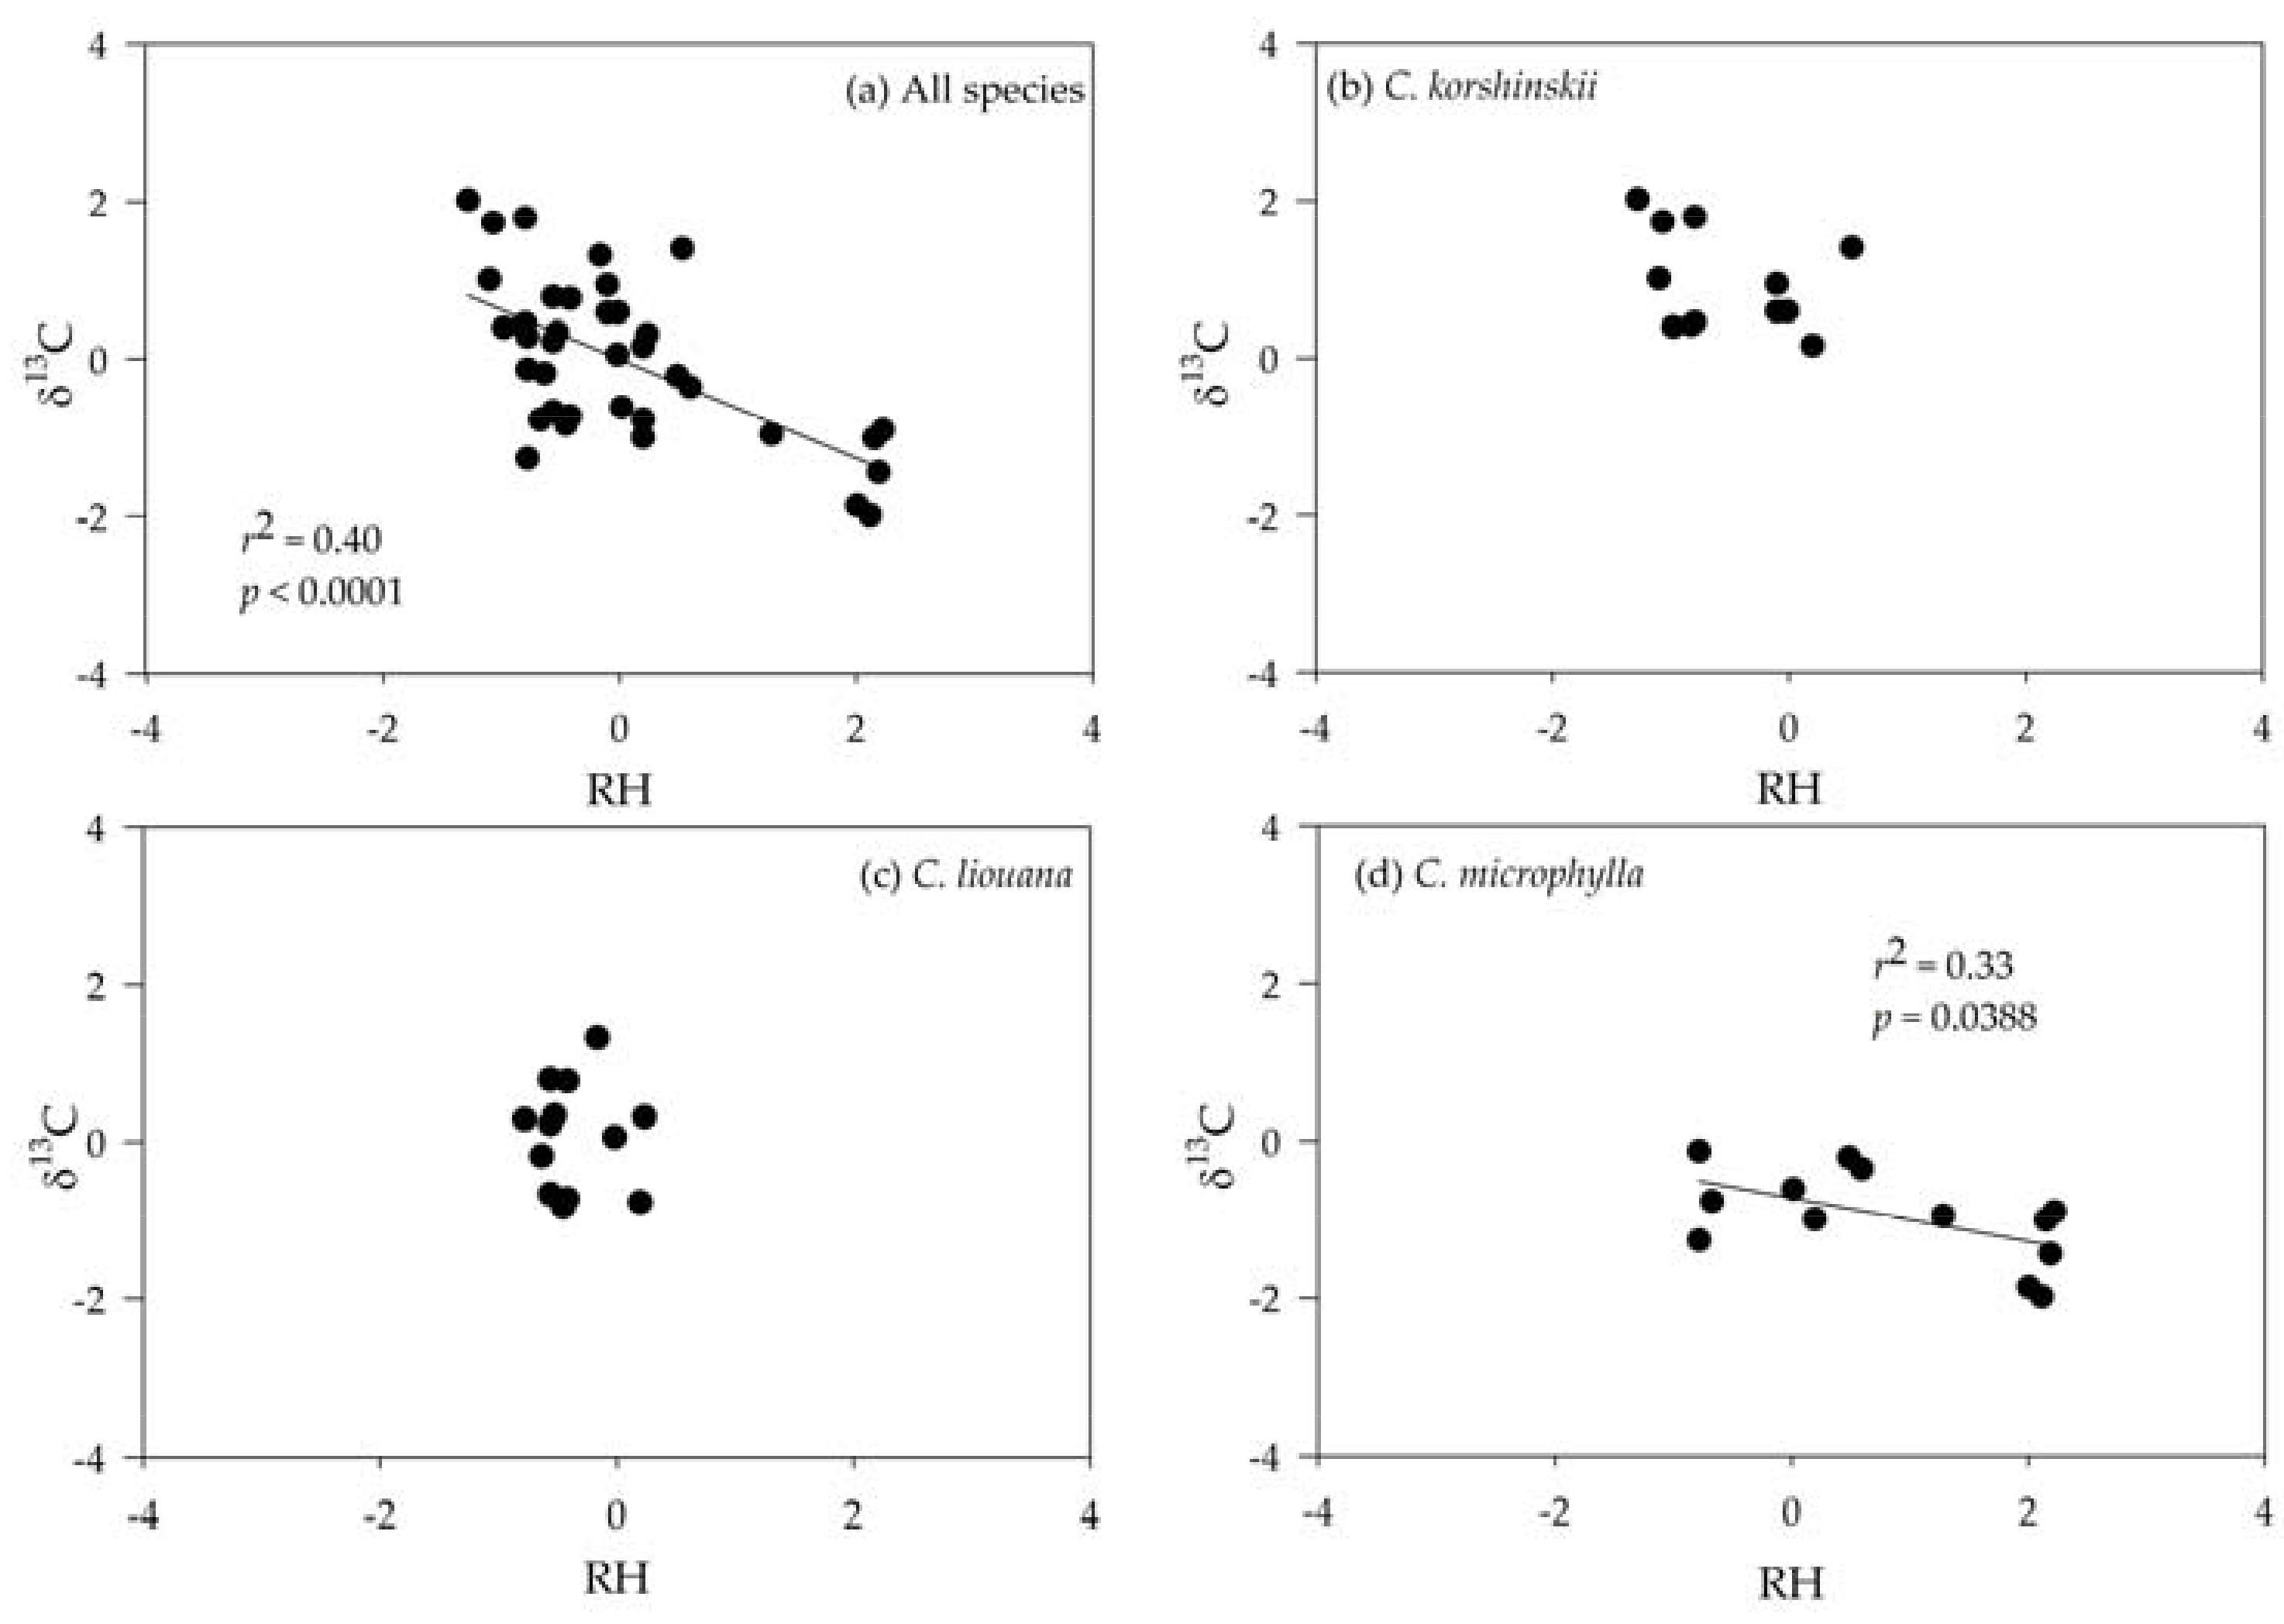
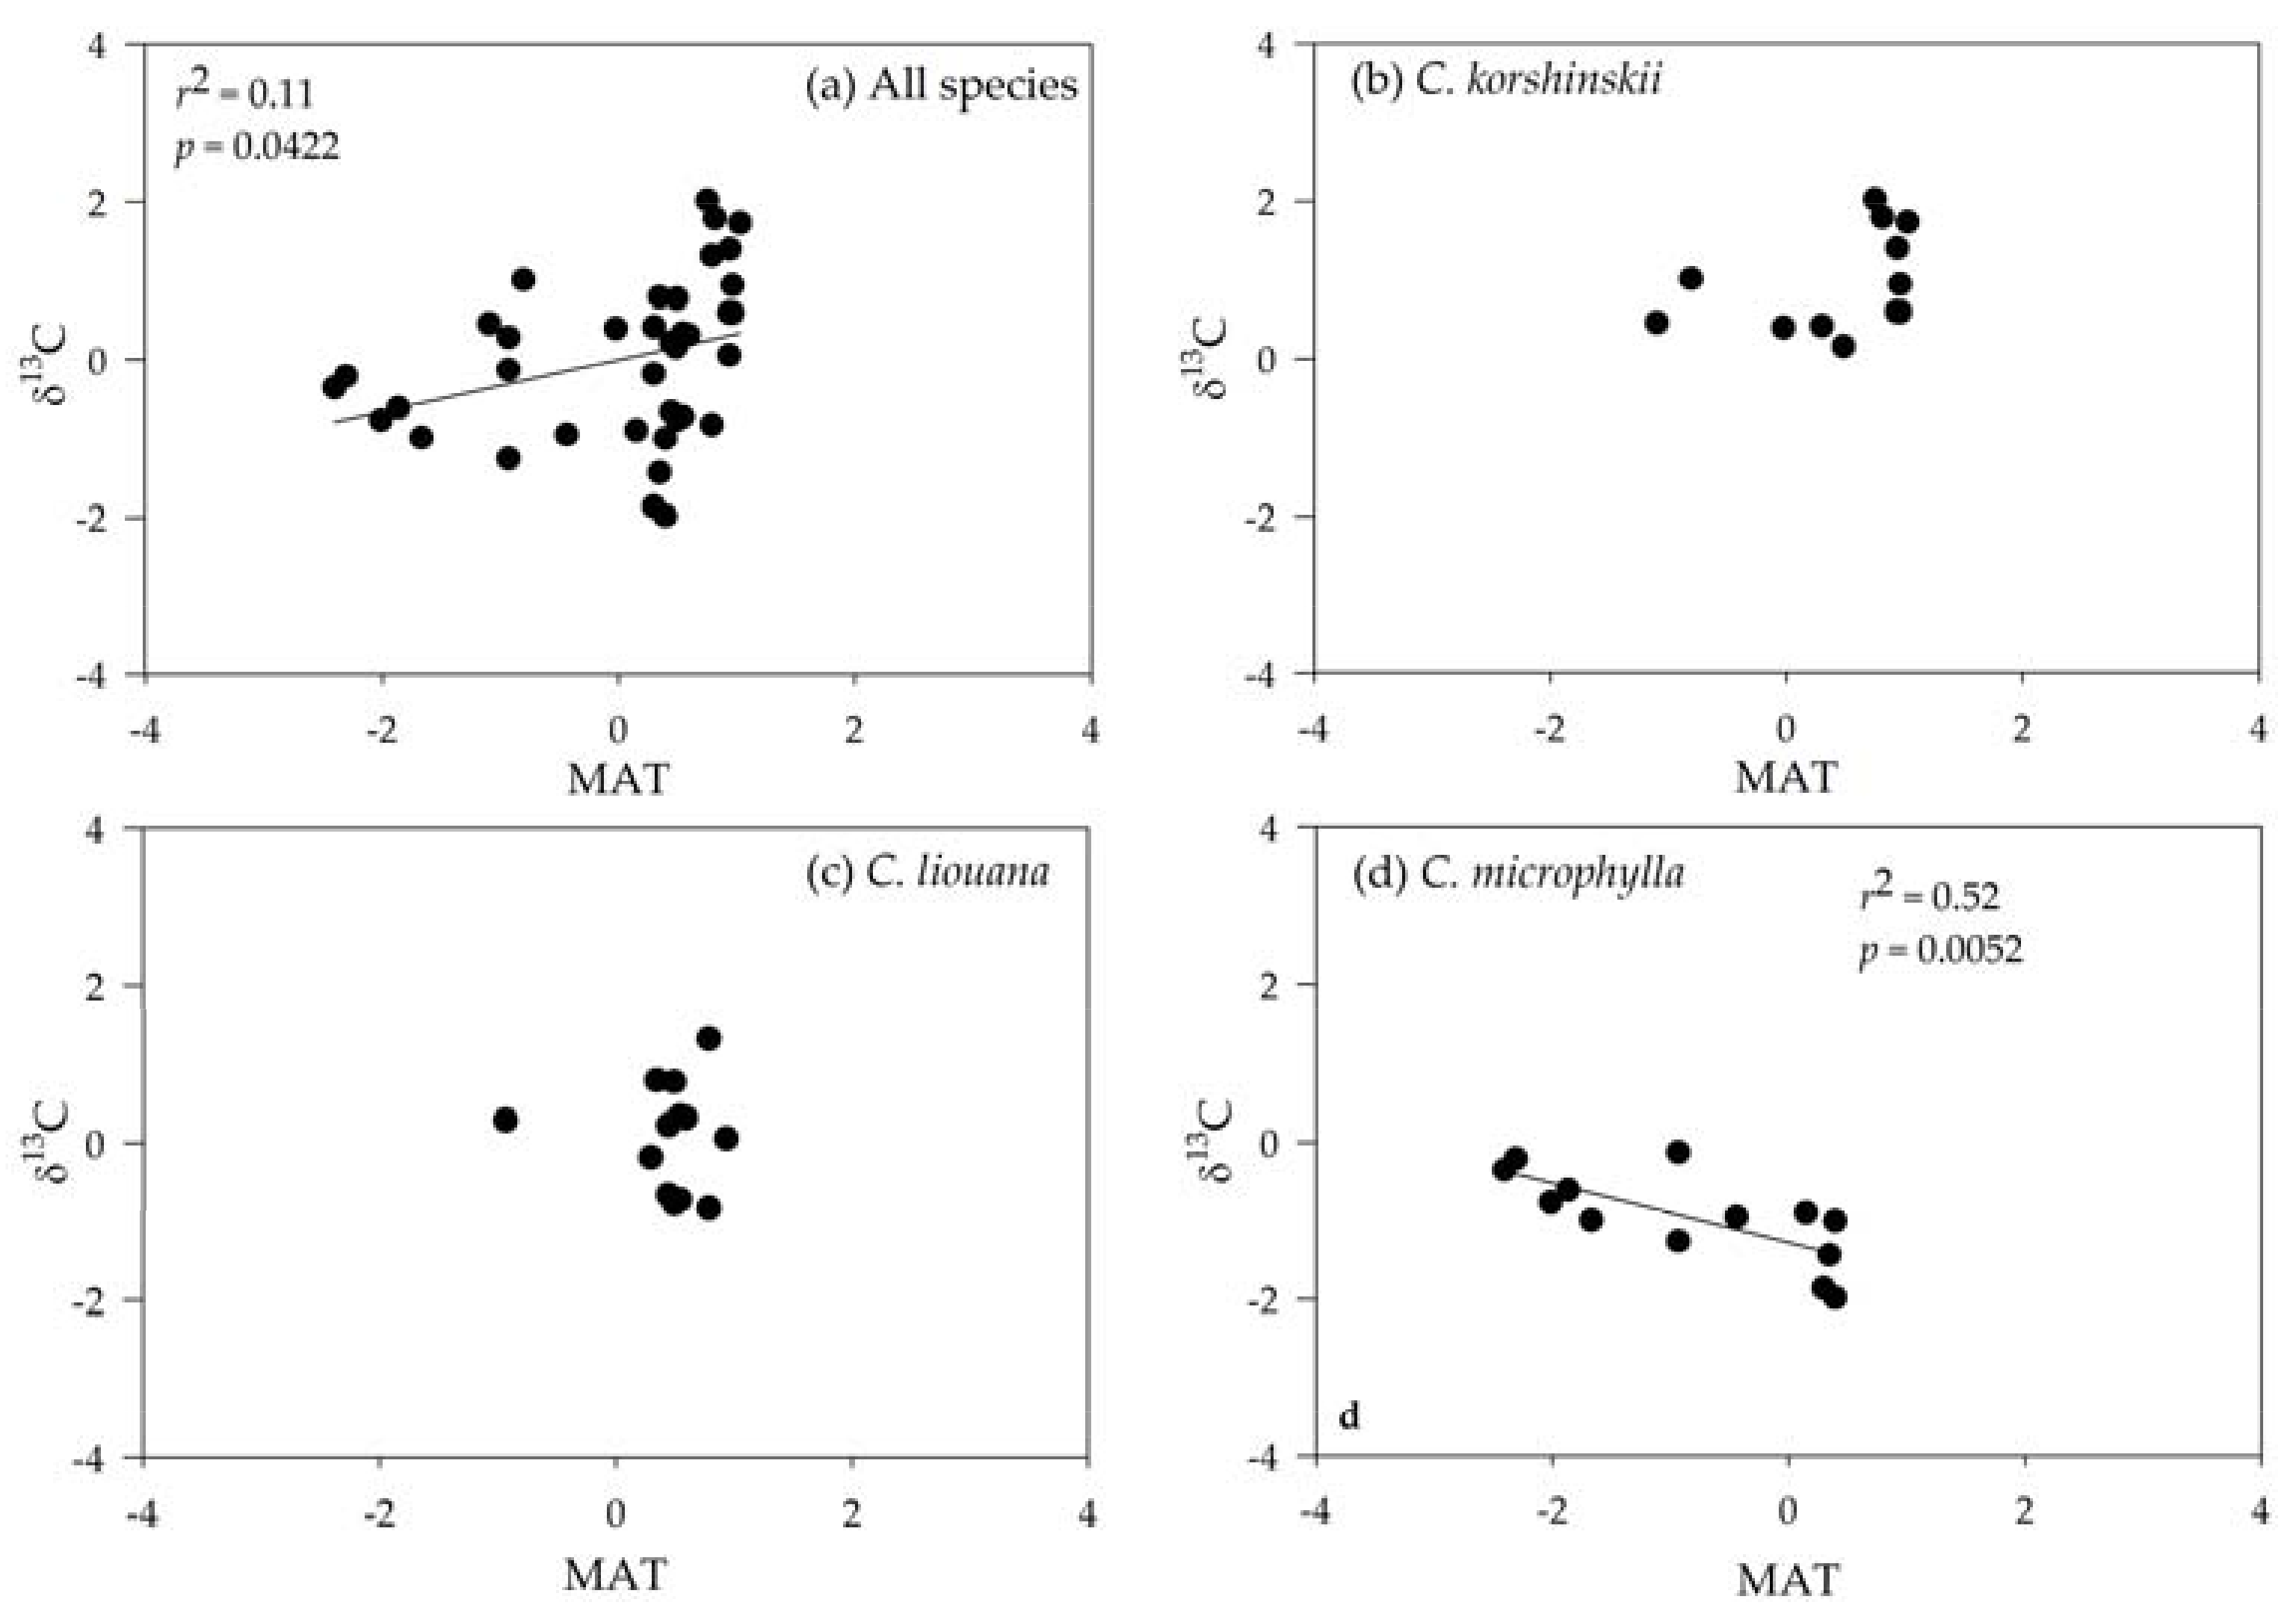
3.3. Correlating Leaf δ13C with Climatic Variables

For all leaf samples, leaf δ13C was negatively correlated with climatic variables, i.e., MAP and RH (Figure 4 and Figure 5), but positively related to MAT (Figure 6). However, the specific patterns of leaf δ13C varied with species. A significant negative correlation between MAP and leaf δ13C was only observed in C. korshinskii and C. liouana (Figure 4b,c), while MAT and RH negatively correlated with δ13C only in C. microphylla (Figure 5d and Figure 6d). When examining the relationship between RH and leaf δ13C in all three species, the relationship was only significant for C. microphylla (Figure 5d).

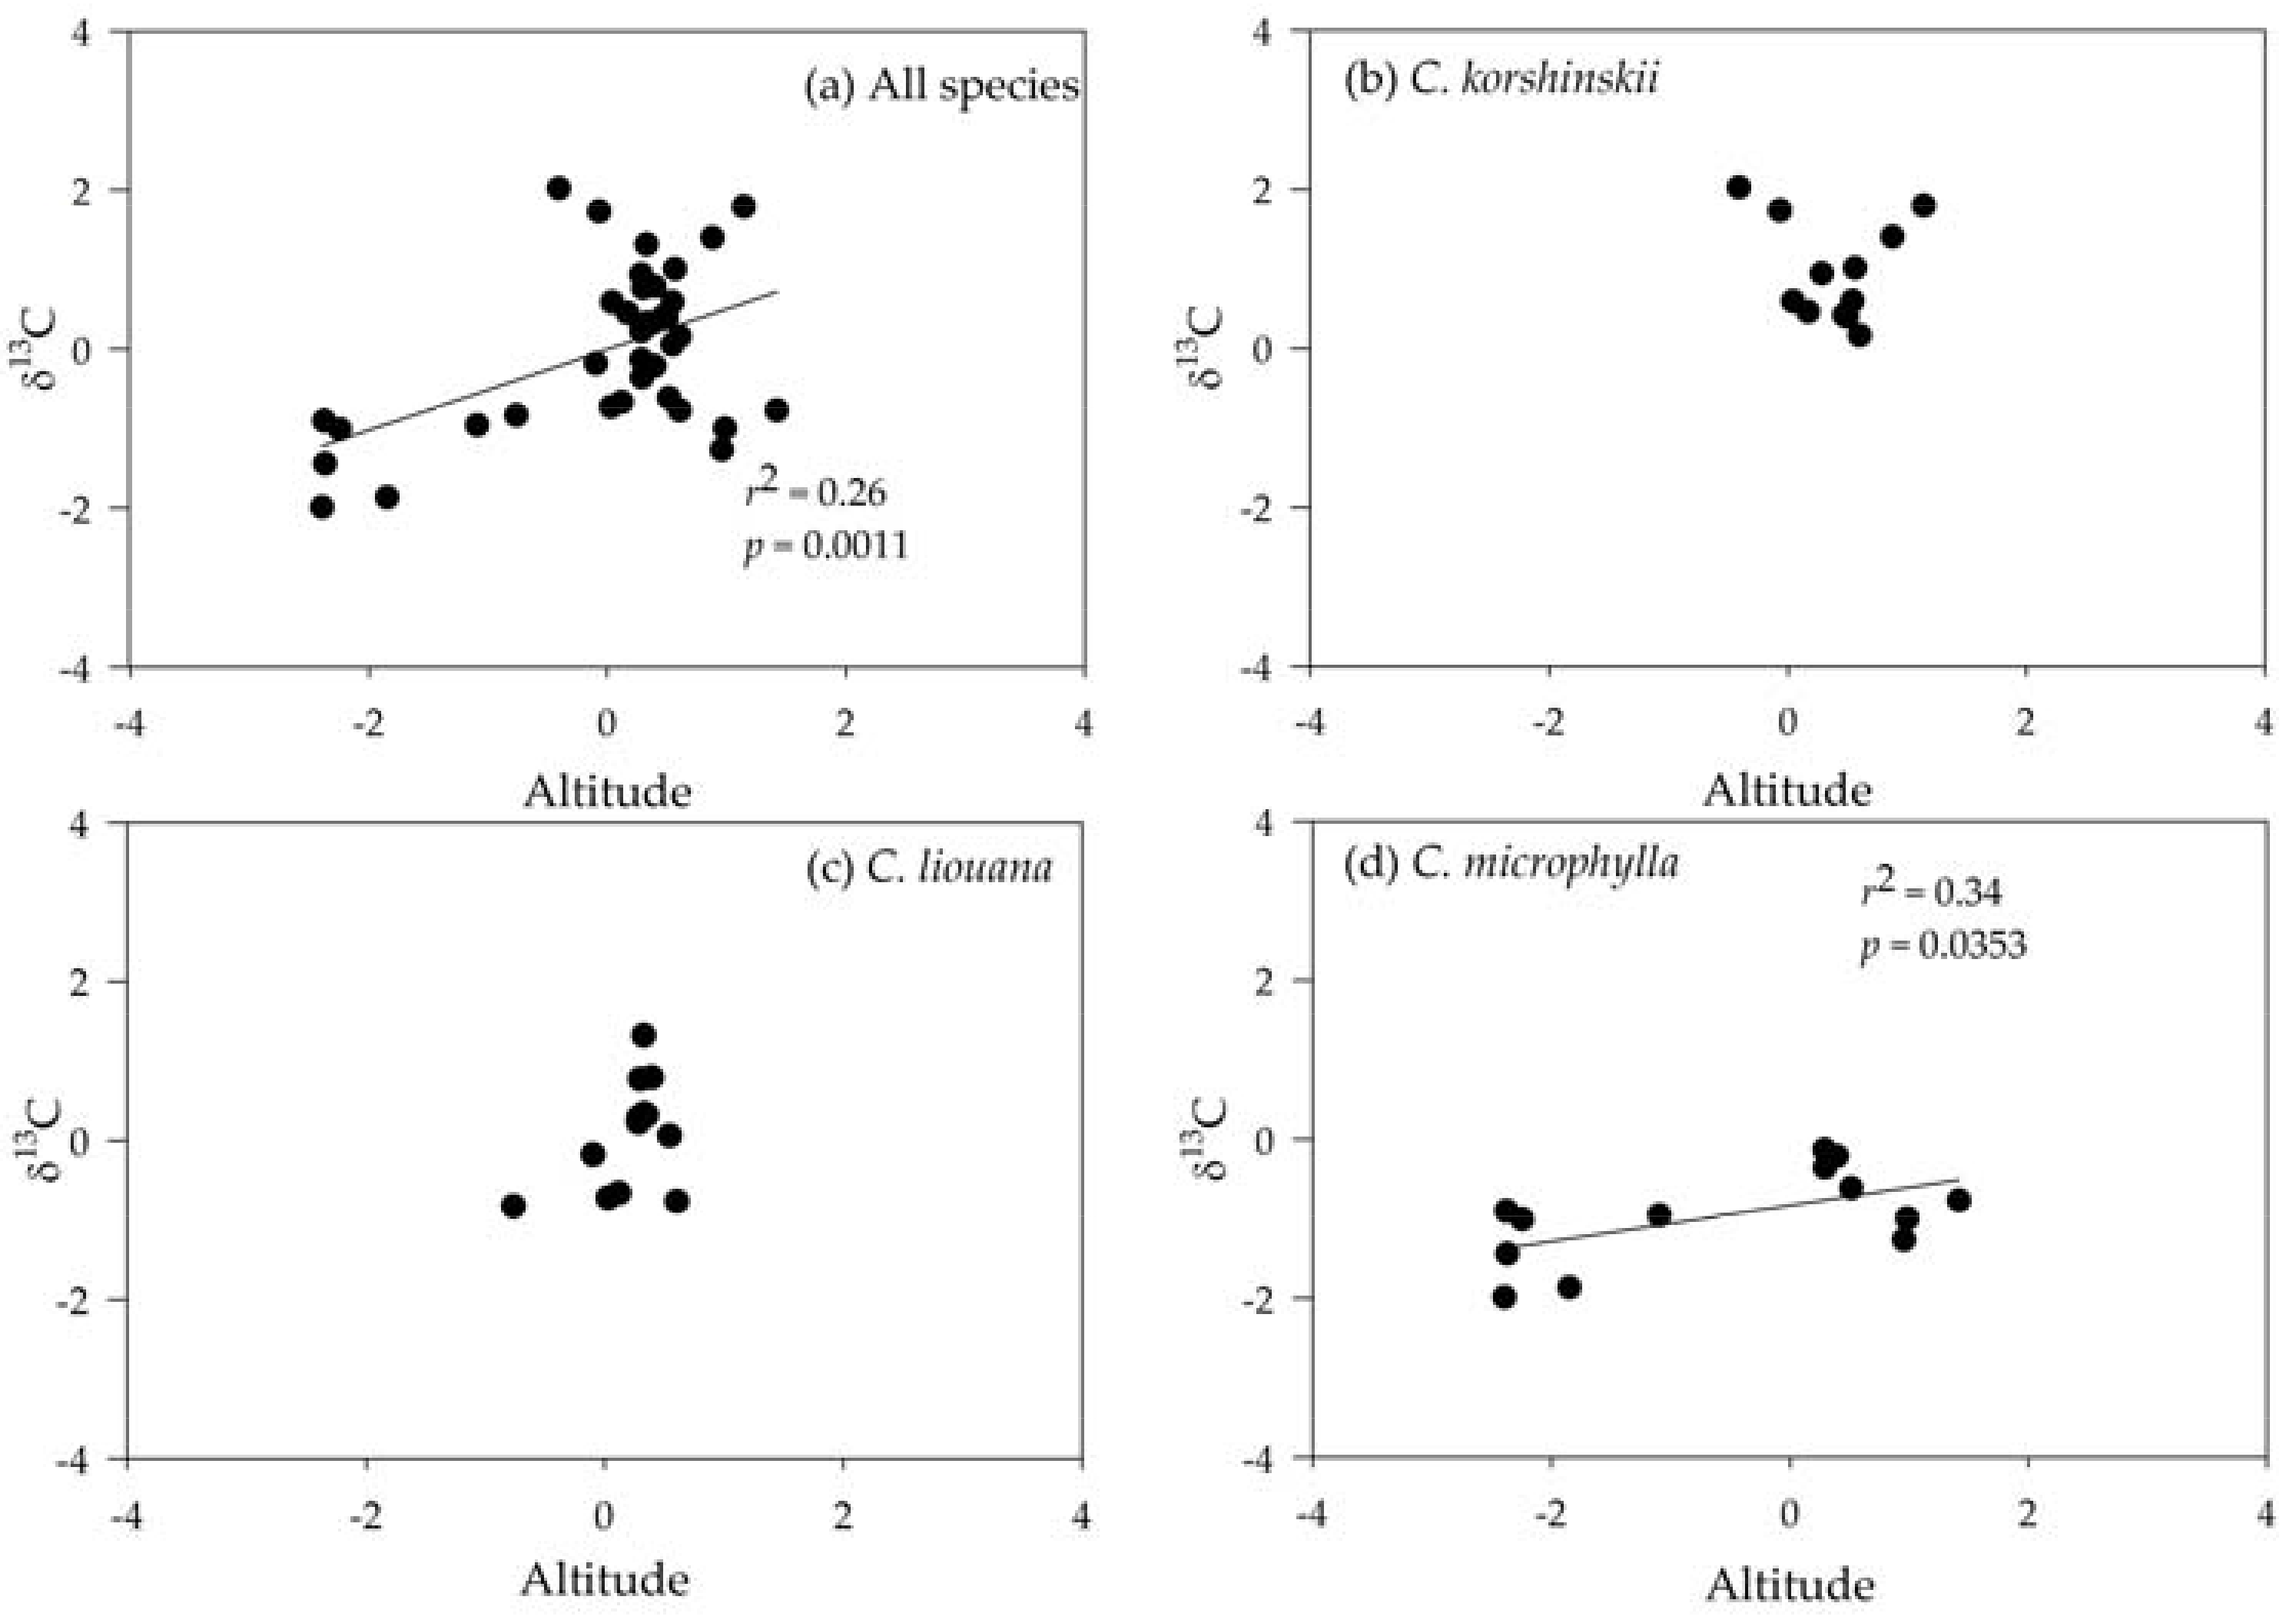
3.4. Correlating Leaf δ13C with Altitude

For all leaf samples, leaf δ13C was positively correlated with altitude (Figure 7). However, the altitudinal patterns of leaf δ13C varied with species and the relationship was only significant in C. microphylla (Figure 7d). Altitude was negatively correlated with RH (p < 0.001) for all species, and was significantly negatively correlated with both MAT and RH for C. microphylla (p < 0.001) (Table 2).

3.5. Correlating Leaf δ13C with Leaf Nutrient Concentrations

In all leaf samples, both leaf N and P concentrations were significantly negatively correlated with leaf δ13C (Table 3). However, nutrient patterns did not differ among species as the leaf δ13C showed no significant relationship between leaf N and P concentrations for each species (Table 3).

3.6. Relationship between Leaf δ13C and Climatic Variables, Altitude, and Leaf Nutrients

Multiple regressions indicated that MAP and RH both contributed to the variation of leaf δ13C across all populations, while MAP and RH were dominant in influencing the variation of leaf δ13C for C. korshinskii, MAP and MAT contributed to variation in leaf δ13C of C. liouana, and MAT mainly controlled leaf δ13C variation of C. microphylla (Table 4).

4. Discussion

4.1. Variation in Leaf δ13C of Three Caragana Species along the Transect

It has been reported that foliar δ13C varies in C3 plants from −20‰ to −35‰ (mean −26‰) [53], and that foliar δ13C in C3 desert plants ranges from −21‰ to −29‰ [54,55]. Consistent with these studies, we found here that leaf δ13C of the three Caragana species varied widely along the arid and semi-arid transect, ranging from −28.65‰ to −24.77‰ (mean −26.73‰). In addition, populations of each species differed significantly in leaf δ13C, which is consistent with many other studies [6,7,8,9,10,25]. Generally, leaf δ13C is related to the ratio of CO2 partial pressure inside the leaf and ambient air (ci/ca) and has been found to be strongly affected by many factors, such as precipitation [16], temperature [19], irradiance [56], and leaf intrinsic traits such as leaf N and P concentrations [33,34,35,40,41,42]. In our study, there were substantial differences in these factors across sampling sites for each species (Table 1, Table S1), which might account for the large variation in leaf δ13C among populations of each species.
Leaf δ13C for all Caragana species was negatively correlated with MAP (Figure 4a), which is consistent with findings from many previous studies [9,18,19,26]. This occurs because water limitation caused by low precipitation can lead to stomatal closure and lowered discrimination against the heavy isotope of CO2 (13C), thus leading to an increase in δ13C [57]. However, among the three species, C. korshinskii and C. liouana showed significant negative correlations with MAP while no significant correlation was found for C. microphylla (Figure 4b–d). One study has shown that leaf δ13C decreases with MAP, but only below a certain value. Above this value, δ13C shows no significant change [58]. However, the MAP ranges in regions where C. microphylla was observed in our study (from 325 to 434 mm) were much lower than the above-reported threshold point [58]. We thus speculate from this narrow precipitation range that water availability was not the key factor influencing WUE and plant growth for C. microphylla. This conclusion was further supported by the stepwise regression, which indicated that MAP was the main determinant for the variation of leaf δ13C for C. korshinskii and C. liouana, but not for C. microphylla (Table 4).
Temperature is another important climatic factor influencing plant photosynthesis, and thus leaf δ13C [14]. Previous studies have found either negative, positive, or inconclusive relationships between leaf δ13C and temperature [19,59,60]. In our present study, we found that leaf δ13C increased with MAT along the arid and semi-arid transect across all populations. In these regions, we found that MAT showed a significant negative correlation with MAP (r = −0.52; p = 0.0056). The increase in temperature, decrease in precipitation, and their interaction effect profoundly influenced leaf δ13C, resulting in reduced ci, and thus increasing leaf δ13C [61]. Considering each species separately, only the leaf δ13C of C. microphylla showed a significant negative correlation with MAT (Figure 6). This result was inconsistent with findings from one previous study [19]. One explanation for such a negative correlation might be that the increased leaf thickness found in cold environments increases internal mesophyll resistance and reduces ci/ca, thus increasing δ13C values [14]. Also, half of the sites had MATs below 5 °C and low temperatures increase the probability of cold-induced droughts that cause stomatal closure and increase δ13C [62]. C. korshinskii and C. liouana mainly occurred in regions with a narrow range (4 to 8 °C) of MAT, so their photosynthetic rates were probably less affected by temperature [19]. Furthermore, results from the stepwise regression confirmed that MAT was the main contributor to the variation of leaf δ13C in C. microphylla, but not for C. korshinskii or C. liouana (Table 4).
Leaf N and P concentrations have been previously reported to correlate positively with leaf δ13C because of their vital role in plant photosynthesis [29,30,31,32,33,34]. Nevertheless, our results indicated that leaf δ13C showed a negative relationship with N and P concentrations for all species, which has also been observed in several previous studies [28,40,41,63,64,65]. Moreover, the negative correlation between leaf δ13C and leaf N concentration is reported to be independent of functional group, vegetation type, and altitude, suggesting that this is a general trend for plants [66,67]. Other studies have interpreted the negative correlation between leaf δ13C and leaf N concentration as an autocorrelation due to low water availability in semi-arid environments [63,67]. The negative correlation between leaf δ13C and P was likely linked to the movement of P from soil to root surfaces, which partially depends on the mass flow of the soil solution that is caused by plant transpiration [67,68,69]. However, we found that leaf δ13C showed no significant relationship with leaf N and P across sampling sites for either species (Table 3), which might imply that the variation in leaf δ13C values was more likely caused by stomatal limitations within each species, rather than N- and P-related changes in photosynthetic efficiency [67,68,69,70].
Altitudinal patterns of leaf δ13C are complicated because many interrelated abiotic factors vary with altitude, including temperature, precipitation, relative humidity, and atmospheric CO2 pressure, as well as with leaf intrinsic traits, like leaf N and P concentrations [8,12,14,71]. In agreement with many previous results [14,42,71], the leaf δ13C of the combined data and that of C. microphylla were positively correlated with altitude, but the leaf δ13C of C. korshinskii and C. liouana were unrelated to altitude (Figure 7), possibly because the growth range of C. microphylla covers a wide altitudinal gradient (227–1789 m asl) compared to the other two species (1039–1456 m asl for C. korshinskii; 893–1456 m asl for C. liouana). The leaf δ13C of all populations was positively correlated to elevation, which may have been because altitude was strongly negatively correlated with RH (r = −0.780, p < 0.001; Table 2). RH in turn showed a significant negative correlation with leaf δ13C (Figure 5). The positive correlation found between the leaf δ13C of C. microphylla and altitude was owed to altitude being significantly and negatively correlated with both MAT and RH (Table 2). Additionally, altitude showed no significant relationship with MAP, MAT, RH, and leaf N and P concentrations for C. korshinskii and C. liouana, likely accounting for the insignificant correlation between leaf δ13C and altitude (Table 2). Similar results were also found in a previous study [27].

4.2. Difference in WUE between the Three Caragana Species: Implications for Their Geographical Distribution

Alternative distributions, a situation in which one species replaces another in an ecosystem geographically, is a common phenomenon in closely related plant species [45,72,73]. Still, a primary focus in ecology remains fixed on understanding the underlying mechanisms governing species’ geographic distributions [74]. It is now generally accepted that the distribution patterns of plant species reflect an evolutionary response to long-term environmental change, which can be partially shaped by environmental gradients and partially by characteristics of a plant species [72,73,74,75]. Therefore, here we firstly determined the key environmental factors that control variation in the leaf δ13C of all species by relating leaf δ13C of all samples to MAP, MAT, RH, altitude, and leaf N and P, which are reported to be crucial factors influencing plant distribution [1,4,5,10,12,14,70]. The results indicated that, although leaf δ13C decreased significantly with MAP, RH, and leaf N and P concentrations and increased with MAT and altitude across all species, the multiple regressions suggest that MAP and RH are the primary determinant factors controlling the variation of leaf δ13C (Table 4). These results support previous conclusions that water availability, which is closely related to MAP and RH, appears to be a selective force playing an important role in shaping the distribution of C. korshinskii, C. liouana, and C. microphylla from east to west in northern China [53].
Secondly, to assess the impact of a species physiology on its spatial distribution, it is essential to compare tolerance in conditions of limited water availability between species. As previously reported, leaf δ13C is related to WUE and plants with higher δ13C or WUE tend to have a higher drought tolerance during periods of low water availability [10,16,19,23]. The present results indicated that the mean leaf δ13C was highest in C. korshinskii, intermediate in C. liouana, and lowest in C. microphylla, with the differences being significant (Figure 3), which is consistent with results from previous studies [51,52]. Although the growth range of C. microphylla occurs across a relatively wider altitudinal and temperature gradient, the pluviometric range is limited and tends to be higher than the growth ranges of the other two species, which probably results in lower values of δ13C for C. microphylla than in the other two species. The growth range of C. korshinskii appears to be characterized by lower precipitation than the area where C. liouana grows (Table 1, Table S1), which results in the highest values of leaf δ13C among the three species. In a previous study examining the ecophysiological responses of these three species to water stress [51], we also found that C. korshinskii exhibits lower sensitivity of the photosynthetic rate and growth, a lower specific leaf area, higher biomass allocation to roots, and higher levels of water use efficiency to drought compared with the other two species. Taken together, these results support differentiation in drought tolerance among the three species because of long-term adaptation to distinct water availability conditions. C. microphylla, C. liouana, and C. korshinskii showed an increasing sequential drought tolerance, consistent with their distinct geographical distributions from east to west in northern China.

5. Conclusions

Across species, leaf δ13C significantly decreased with MAP, RH, and leaf N and P concentrations and increased with altitude and MAT. However, patterns and environmental controls of leaf δ13C varied with species; where C. korshinskii was mainly controlled by MAP and leaf N concentration, C. liouana was controlled by both MAT and MAP, and C. microphylla was mainly controlled by MAT. These findings are essential in improving predictions of how each species will respond to future climate change accompanied by increasing temperature and more frequent drought events in dry areas. Regardless of species, MAT and RH are important determinant factors influencing variation in leaf δ13C along the study transect. We further found that C. microphylla, C. liouana, and C. korshinskii, showed an increasing sequential drought tolerance, as reflected by their integrated WUE (leaf δ13C) and consistent with their distinct geographical distributions from east to west in northern China.

Supplementary Materials

The following is available online at https://www.mdpi.com/1999-4907/9/6/297/s1, Table S1: Spatial and climate data for each sampling site of the three Caragana species.

Author Contributions

The authors’ responsibilities were as follows: T.X. and W.L. conceived and designed the research; F.M., Z.Z., G.X., and J.H. performed the research; F.M., J.L., and B.J. analyzed the data; F.M. contributed reagents/materials/analysis tools; F.M. and W.L. wrote the manuscript.

Funding

This research was funded by Major Innovation Projects for Building First-class Universities in China’s Western Region [ZKZD2017004].

Acknowledgments

We are grateful for the constructive comments by two anonymous reviewers. We would also like to thank Elizabeth Tokarz at the Yale University for her assistance with English language and grammatical editing of the manuscript.

Conflicts of Interest

The authors declare no conflict of interest.

References

  1. Easterling, D.R.; Meehl, G.A.; Parmesan, C.; Changnon, S.A.; Karl, T.R.; Mearns, L.O. Climate extremes: Observations, modeling, and impacts. Science 2000, 289, 2068–2074. [Google Scholar] [CrossRef] [PubMed]
  2. Dawson, T.E.; Mambelli, S.; Plamboeck, A.H.; Templer, P.H.; Tu, K.P. Stable isotopes in plant ecology. Annu. Rev. Ecol. Syst. 2002, 33, 507–559. [Google Scholar] [CrossRef]
  3. Knapp, A.K.; Beier, C.; Briske, D.D.; Classen, A.T.; Luo, Y.Q.; Reichstein, M.; Smith, M.D.; Bell, J.E.; Fay, P.A.; Heisler, J.L.; et al. Consequences of more extreme precipitation regimes for terrestrial ecosystems. BioScience 2008, 58, 811–821. [Google Scholar] [CrossRef]
  4. Ma, J.Y.; Sun, W.; Sun, H.L.; Wang, S.M. Stable carbon isotope characteristics of desert plants in the Junggar Basin, China. Ecol. Res. 2012, 27, 115–124. [Google Scholar] [CrossRef]
  5. Swap, R.J.; Aranibar, J.N.; Dowty, PR.; Gilhooly, W.P., III; Macko, S.A. Natural abundance of 13C and 15N in C3 and C4 vegetation of southern Africa: Patterns and implications. Glob. Chang. Biol. 2004, 10, 350–358. [Google Scholar] [CrossRef]
  6. Li, Z.; Yang, L.; Lu, W.; Guo, W.; Gong, X.; Xu, J.; Yu, D. Spatial patterns of leaf carbon, nitrogen stoichiometry and stable carbon isotope composition of Ranunculus natans C.A. Mey. (Ranunculaceae) in the arid zone of northwest China. Ecol. Eng. 2015, 77, 9–17. [Google Scholar] [CrossRef]
  7. Liu, X.; Su, Q.; Li, C.; Zhang, Y.; Wang, Q. Responses of carbon isotope ratios of C3 herbs to humidity index in northern China. Turk. J. Earth Sci. 2014, 23, 100–111. [Google Scholar] [CrossRef]
  8. Peri, P.L.; Ladd, B.; Pepper, D.A.; Bonser, S.P.; Laffan, S.W.; Amelung, W. Carbon (δ13C) and nitrogen (δ15N) stable isotope composition in plant and soil in Southern Patagonia’s native forests. Glob. Chang. Biol. 2012, 18, 311–321. [Google Scholar] [CrossRef]
  9. Wang, C.; Liu, D.; Luo, W.; Fang, Y.; Wang, X.; Lü, X.; Jiang, Y.; Han, X.G.; Bai, E. Variations in leaf carbon isotope composition along an arid and semi-arid grassland transect in Northern China. J. Plant Ecol. 2016, 112, 576–585. [Google Scholar] [CrossRef]
  10. Chen, L.T.; Flynn, D.F.; Zhang, X.W.; Gao, X.L.; Lin, L.; Luo, J.; Zhao, C.M. Divergent patterns of foliar δ13C and δ15N in Quercus aquifolioides with an altitudinal transect on the Tibetan Plateau: An integrated study based on multiple key leaf functional traits. J. Plant Ecol. 2015, 8, 303–312. [Google Scholar] [CrossRef]
  11. Farquhar, G.D.; Hubick, K.; Condon, A.G.; Richards, R.A. Carbon isotope fractionation and plant water-use efficiency. In Stable Isotopes in Ecological Research; Rundel, P.W., Ehleringer, J.R., Nagy, K.A., Eds.; Springer: New York, NY, USA, 1989; pp. 21–40. [Google Scholar]
  12. Warren, C.R.; McGrath, J.F.; Adams, M.A. Water availability and carbon isotope discrimination in conifers. Oecologia 2001, 127, 476–486. [Google Scholar] [CrossRef] [PubMed]
  13. Fleck, I.; Peña-Rojas, K.; Aranda, X. Mesophyll conductance to CO2 and leaf morphological characteristics under drought stress during Quercus ilex L. resprouting. Ann. For. Sci. 2010, 67, 308. [Google Scholar] [CrossRef]
  14. Körner, C.H.; Farquhar, G.D.; Wong, S.C. Carbon isotope discrimination by plants follows latitudinal and altitudinal trends. Oecologia 1991, 88, 30–40. [Google Scholar] [CrossRef] [PubMed]
  15. Zheng, S.; Shangguan, Z. Spatial patterns of foliar stable carbon isotope compositions of C3 plant species in the Loess Plateau of China. Ecol. Res. 2007, 22, 342–353. [Google Scholar] [CrossRef]
  16. Diefendorf, A.F.; Mueller, K.E.; Wing, S.L.; Koch, P.L.; Freeman, K.H.; Hayes, J.M. Global patterns in leaf 13C discrimination and implications for studies of past and future climate. Proc. Natl. Acad. Sci. USA 2010, 107, 5738–5743. [Google Scholar] [CrossRef] [PubMed]
  17. Chamaillard, S.; Fichot, R.; Vincentbarbaroux, C.; Bastien, C.; Depierreux, C.; Dreyer, E.; Villar, M.; Brignolas, F. Variations in bulk leaf carbon isotope discrimination, growth and related leaf traits among three Populus nigra L. populations. Tree Physiol. 2011, 31, 1076–1087. [Google Scholar] [CrossRef] [PubMed]
  18. Zhou, Y.C.; Fan, J.W.; Zhang, W.Y.; Harris, W.; Zhong, H.P.; Hu, Z.M.; Song, L.L. Factors influencing altitudinal patterns of C3 plant foliar carbon isotope composition of grasslands on the Qinghai-Tibet Plateau, China. Alp. Bot. 2011, 121, 79–90. [Google Scholar] [CrossRef]
  19. Wang, N.; Xu, S.S.; Jia, X.; Gao, J.; Zhang, W.P.; Qiu, Y.P.; Wang, G.X. Variations in foliar stable carbon isotopes among functional groups and along environmental gradients in China—A meta-analysis. Plant Biol. 2013, 15, 144–151. [Google Scholar] [CrossRef] [PubMed]
  20. Sun, L.K.; Liu, W.Q.; Liu, G.X.; Chen, T.; Zhang, W.; Wu, X.K.; Zhang, G.S.; Zhang, Y.H.; Li, L.; Zhang, B.G.; et al. Temporal and spatial variations in the stable carbon isotope composition and carbon and nitrogen contents in current-season twigs of Tamarix chinensis Lour. and their relationships to environmental factors in the Laizhou Bay wetland in China. Ecol. Eng. 2016, 90, 417–426. [Google Scholar] [CrossRef]
  21. Aguilar-Romero, R.; Pineda-Garcia, F.; Paz, H.; González-Rodríguez, A.; Oyama, K. Differentiation in the water-use strategies among oak species from central Mexico. Tree Physiol. 2017, 37, 915–925. [Google Scholar] [CrossRef] [PubMed]
  22. Luo, J.X.; Zang, R.G.; Li, C.Y. Physiological and morphological variations of Picea asperata populations originating from different altitudes in the mountains of southwest China. For. Ecol. Manag. 2006, 221, 285–290. [Google Scholar] [CrossRef]
  23. Prentice, I.C.; Meng, T.T.; Wang, H.; Harrison, S.P.; Ni, J.; Wang, G.H. Evidence of a universal scaling relationship for leaf CO2 drawdown along an aridity gradient. New Phytol. 2011, 190, 169–180. [Google Scholar] [CrossRef] [PubMed] [Green Version]
  24. Wei, H.; Wu, B.; Yang, W.; Luo, T. Low rainfall induced shift in leaf trait relationship within species along a semi-arid sandy land transect in northern China. Plant Biol. 2011, 13, 85–92. [Google Scholar] [CrossRef] [PubMed]
  25. Zhao, C.M.; Chen, L.T.; Ma, F.; Yao, B.Q.; Liu, J.Q. Altitudinal differences in the leaf fitness of juvenile and mature alpine spruce trees (Picea crassifolia). Tree Physiol. 2008, 28, 133–141. [Google Scholar] [CrossRef] [PubMed]
  26. Zhang, J.W.; Marshall, J.D. Population differences in water use efficiency of well-watered and water-stressed western larch seedlings. Can. J. Forest Res. 1994, 24, 92–99. [Google Scholar] [CrossRef]
  27. Friend, A.D.; Woodward, F.I.; Switsuer, V.R. Field measurements of photosynthesis stomatal conductance, leaf nitrogen and δ13C along altitudinal gradients in Scotland. Funct. Ecol. 1989, 3, 117–122. [Google Scholar] [CrossRef]
  28. Hultine, D.R.; Marshall, J.D. Altitude trends in conifer leaf morphology and stable carbon isotope composition. Oecologia 2000, 123, 32–40. [Google Scholar] [CrossRef] [PubMed]
  29. Sparks, J.; Ehleringer, J. Leaf carbon isotope discrimination and nitrogen content for riparian trees along elevational transects. Oecologia 1997, 109, 362–367. [Google Scholar] [CrossRef] [PubMed]
  30. Hamerlynck, E.P.; Huxman, T.E.; McAuliffe, J.R.; Smith, S.D. Carbon isotope discrimination and foliar nutrient status of Larrea tridentata (creosote bush) in contrasting Mojave desert soils. Oecologia 2004, 138, 210–215. [Google Scholar] [CrossRef] [PubMed]
  31. Springer, C.J.; Delucia, E.H.; Thomas, R.B. Relationships between net photosynthesis and foliar nitrogen concentrations in a loblolly pine forest ecosystem grown in elevated atmospheric carbon dioxide. Tree Physiol. 2005, 25, 385–394. [Google Scholar] [CrossRef] [PubMed]
  32. Domingues, T.F.; Meir, P.; Feldpausch, T.R.; Saiz, G.; Veenendaal, E.M.; Schrodt, F.; Bird, M.; Djagbletey, G.; Hien, F.; Compaore, H. Co-limitation of photosynthetic capacity by nitrogen and phosphorus in West Africa woodlands. Plant Cell Environ. 2010, 33, 959–980. [Google Scholar] [CrossRef] [PubMed]
  33. Walia, A.; Guy, R.D.; White, B. Carbon isotope discrimination in western hemlock and its relationship to mineral nutrition and growth. Tree Physiol. 2010, 30, 728–740. [Google Scholar] [CrossRef] [PubMed]
  34. Walker, A.P.; Beckerman, A.P.; Gu, L.; Kattge, J.; Cernusak, L.A.; Domingues, T.F.; Scales, J.C.; Wohlfahrt, G.; Wullschleger, S.D.; Woodward, F.I. The relationship of leaf photosynthetic traits-Vcmax and Jmax-to leaf nitrogen, leaf phosphorus, and specific leaf area: A meta-analysis and modeling study. Ecol. Evol. 2014, 4, 3218–3235. [Google Scholar] [CrossRef] [PubMed]
  35. Cordell, S.; Goldstein, G.; Meinzer, F.C.; Handley, L.L. Allocation of nitrogen and carbon in leaves of Metrosiderospolymorpha regulates carboxylation capacity and δ13C along an altitudinal gradient. Funct. Ecol. 1999, 13, 811–818. [Google Scholar] [CrossRef]
  36. Kloeppel, B.D.; Gower, S.T.; Treichel, I.W.; Kharuk, S. Foliar carbon isotope discrimination in Larix species and sympatric evergreen conifers: A global comparision. Oecologia 1998, 114, 153–159. [Google Scholar] [CrossRef] [PubMed]
  37. Damesin, C.; Rambal, S.; Joffre, R. Between-tree variations leaf δ13C of Quercus pubescens and Quercus ilex among Mediterranean habitats with different water availability. Oecologia 1997, 111, 26–35. [Google Scholar] [CrossRef] [PubMed]
  38. Warren, C.R.; Adams, M.A. Phosphorus affects growth and partitioning of nitrogen to Rubisco in Pinus pinaster. Tree Physiol. 2002, 22, 11–19. [Google Scholar] [CrossRef] [PubMed]
  39. Ma, J.; Chen, F.; Xia, G.; Su, H.; Duan, Z.; Wang, G. Correlations between leaf δ13C and physiological parameters of desert plant Reaumuria soongorica. Chin. J. Appl. Ecol. 2008, 19, 1166–1171. [Google Scholar]
  40. Li, S.J.; Zhang, Y.F.; Chen, T. Relationships between foliar stable carbon isotope composition and environmental factors and leaf element contents of Pinus tabulaeformis in northwestern China. Chin. J. Plant Ecol. 2011, 35, 596–604. [Google Scholar] [CrossRef]
  41. Zhou, Y.C.; Fan, J.W.; Harris, W.; Zhong, H.P.; Zhang, W.Y.; Cheng, X.L. Relationships between C3 plant foliar carbon isotope composition and element contents of grassland species at high altitudes on the Qinghai-Tibet Plateau, China. PLoS ONE 2013, 8, e60794. [Google Scholar] [CrossRef] [PubMed]
  42. Merah, O. Carbon isotope discrimination and mineral composition of three organs in durum wheat genotypes grown under Mediterranean conditions. C. R. Acad. Sci. Ser. III 2001, 324, 355–363. [Google Scholar] [CrossRef]
  43. Chen, S.P.; Bai, Y.F.; Lin, G.H.; Han, X.G. Variations in life-form composition and foliar carbon isotope discrimination among eight plant communities under different soil moisture conditions in the Xilin River Basin, Inner Mongolia, China. Ecol. Res. 2005, 20, 167–176. [Google Scholar] [CrossRef]
  44. Van de Water, P.K.; Leavitt, S.W.; Betancourt, J.L. Leaf δ13C variability with elevation, slope aspect, and precipitation in the southwest United States. Oecologia 2002, 132, 332–343. [Google Scholar] [CrossRef] [PubMed]
  45. Zhang, M.L.; Fritsch, P.W. Evolutionary response of Caragana (Fabaceae) to Qinghai–Tibetan Plateau uplift and Asian interior aridification. Plant Syst. Evol. 2010, 288, 191–199. [Google Scholar] [CrossRef]
  46. Ma, C.C.; Gao, Y.B.; Guo, H.Y.; Wang, J.L.; Wu, J.B.; Xu, J.S. Physiological adaptations of four dominant Caragana species in the desert region of the Inner Mongolia Plateau. J. Arid Environ. 2008, 72, 247–254. [Google Scholar] [CrossRef]
  47. Meng, Q.X.; Niu, Y.; Niu, X.W.; Roubin, R.H.; Hanrahan, J.R. Ethnobotany, phytochemistry and pharmacology of the genus Caragana used in traditional Chinese medicine. J. Ethnopharmacol. 2009, 124, 350–368. [Google Scholar] [CrossRef] [PubMed]
  48. Niu, X.F.; Li, Y.M.; Hu, H.; Liu, X.; Qi, L. Chemical constituents from Caragana tangutica. Biochem. Syst. Ecol. 2013, 51, 288–290. [Google Scholar] [CrossRef]
  49. Na, X.F.; Xu, T.T.; Li, M.; Ma, F.; Kardol, P. Bacterial diversity in the rhizosphere of two phylogenetically closely related plant species across environmental gradients. J. Soils Sediments 2016, 17, 1–11. [Google Scholar] [CrossRef]
  50. Na, X.F.; Li, X.R.; Zhang, Z.Y.; Li, M.; Kardol, P.; Xu, T.T.; Wang, M.; Cao, X.N.; Ma, F. Bacterial community dynamics in the rhizosphere of a long-lived, leguminous shrub across a 40-year age sequence. J. Soils Sediments 2017, 1, 1–9. [Google Scholar] [CrossRef]
  51. Ma, F.; Na, X.F.; Xu, T.T. Drought responses of three closely related Caragana species: Implication for their vicarious distribution. Ecol. Evol. 2016, 6, 2763–2773. [Google Scholar] [CrossRef] [PubMed]
  52. Ma, C.C.; Gao, Y.B.; Guo, H.Y.; Wang, J.L. Photosynthesis, transpiration, and water use efficiency of Caragana microphylla, C. intermedia, and C. korshinskii. Photosynthetica 2004, 43, 65–70. [Google Scholar] [CrossRef]
  53. O’Leary, M.H. Carbon isotopes in photosynthesis (fractionation techniques may reveal new aspects of carbon dynamics in plants). BioScience 1988, 38, 328–336. [Google Scholar]
  54. Ehleringer, J.R.; Cooper, T.A. Correlations between carbon isotope ratio and microhabit in desert plants. Oecologia 1988, 76, 562–566. [Google Scholar] [CrossRef] [PubMed]
  55. Rundel, P.W.; Esler, K.J.; Cowling, R.M. Ecological and phylogenetic patterns of carbon isotope discrimination in the winter-rain-fall flora of the Richterveld, South Africa. Plant Ecol. 1999, 142, 133–148. [Google Scholar] [CrossRef]
  56. Vitoria, A.P.; Vieira, T.D.O.; Camargo, P.D.B.; Santiago, L.S. Using leaf δ13C and photosynthetic parameters to understand acclimation to irradiance and leaf age effects during tropical forest regeneration. Forest Ecol. Manag. 2016, 379, 50–60. [Google Scholar] [CrossRef]
  57. Stewart, G.R.; Turnbull, M.H.; Schmidt, S.; Erskine, P.D. 13C natural abundance in plant communities along a rainfall gradient: A biological integrator of water availability. Aust. J. Plant Physiol. 1995, 22, 51–55. [Google Scholar] [CrossRef]
  58. Leffler, A.J.; Enquist, B.J. Carbon isotope composition of tree leaves from Guanacaste, Costa Rica: Comparison across tropical forests and tree life history. J. Trop. Ecol. 2002, 18, 151–159. [Google Scholar] [CrossRef]
  59. Troughton, J.H.; Card, K.A. Temperature effects on the carbon isotope ratio of C3, C4 and crassulacean-acid-metabolism (CAM) plants. Planta 1975, 123, 185–190. [Google Scholar] [CrossRef] [PubMed]
  60. Welker, J.M.; Wookey, P.A.; Parsons, A.N.; Press, M.C.; Callaghan, T.V.; Lee, J.A. Leaf carbon isotope discrimination and vegetative responses of Dryas octopetala to temperature and water manipulations in a High Arctic polar semidesert, Svalbard. Oecologia 1993, 95, 463–469. [Google Scholar] [CrossRef] [PubMed]
  61. Xu, X.; Yang, F.; Xiao, X.; Zhang, S.; Korpelainen, H.; Li, C. Sex-specific responses of Populus cathayana to drought and elevated temperatures. Plant Cell Environ. 2008, 31, 850–860. [Google Scholar] [CrossRef] [PubMed]
  62. Morecroft, M.D.; Woodward, F. Experiments on the causes of altitudinal differences in the leaf nutrient contents, size and δ13C of Alchemilla alpina. New Phytol. 1996, 134, 471–479. [Google Scholar] [CrossRef]
  63. Tsialtas, J.T.; Handley, L.L.; Kassioumi, M.T.; Veresoglou, D.S.; Gagianas, A.A. Interspecific variation in potential water-use efficiency and its relation to plant species abundance in a water-limited grassland. Funct. Ecol. 2001, 15, 605–614. [Google Scholar] [CrossRef]
  64. Cordell, S.; Goldstein, G.; Mueller-Dombois, D.; Webb, D.; Vitousek, P.M. Physiological and morphological variation in Metrosideros polymorpha, a dominant Hawaiian tree species, along an altitudinal gradient: The role of phenotypic plasticity. Oecologia 1998, 113, 188–196. [Google Scholar] [CrossRef] [PubMed]
  65. Li, J.Z.; Wang, G.A.; Zhang, R.N.; Li, L. A negative relationship between foliar carbon isotope composition and mass-based nitrogen concentration on the eastern slope of Mount Gongga, China. PLoS ONE 2016, 11, E0166958. [Google Scholar] [CrossRef] [PubMed]
  66. Zhou, Y.C.; Cheng, X.L.; Fan, J.W.; Harris, W. Relationships between foliar carbon isotope composition and elements of C3 species in grasslands of Inner Mongolia, China. Plant Ecol. 2016, 217, 883–897. [Google Scholar] [CrossRef]
  67. Cernusak, L.A.; Winter, K.; Aranda, J.; Turner, B.L.; Marshall, J.D. Transpiration efficiency of a tropical pioneer tree (Ficus insipida) in relation to soil fertility. J. Exp. Bot. 2007, 58, 3549–3566. [Google Scholar] [CrossRef] [PubMed]
  68. Cramer, M.D.; Hawkins, H.J.; Verboom, G.A. The importance of nutritional regulation of plant water flux. Oecologia 2009, 161, 15–24. [Google Scholar] [CrossRef] [PubMed]
  69. Qiu, Q.; Li, J.Y.; Wang, J.H.; Wang, N.; Sun, K.; Jia, Z.R.; Dong, L.; Pan, X. Relationship on leaf δ13C and nutrients in leaf and soil of different Nitraria tangutorum populations in Tsaidam Basin. Acta Bot. Boreali-Occident. Sin. 2013, 33, 2301–2308. [Google Scholar]
  70. Li, J.; Wang, G.; Liu, X.; Han, J.; Liu, M.; Liu, X. Variations in carbon isotope ratios of C3 plants and distribution of C4 plants along an altitudinal transect on the eastern slope of mount Gongga. Sci. China Ser. D 2009, 52, 1714–1723. [Google Scholar] [CrossRef]
  71. Zhu, Y.; Siegwolf, R.T.W.; Durka, W.; Körner, C. Phylogenetically balanced evidence for structural and carbon isotope responses in plants along elevational gradients. Oecologia 2010, 162, 853–863. [Google Scholar] [CrossRef] [PubMed]
  72. Zhang, M.L. Studies on geographical distribution pattern of the subgenus Pogonophace (Fabaceae: Astragalus) in China using GIS technique. Acta Bot. Sin. 2000, 42, 849–854. [Google Scholar]
  73. Zhu, H.; Ma, Y.X.; Yan, L.C.; Hu, H. The relationship between geography and climate in the generic-level patterns of Chinese seed plants. Acta Phytotaxon. Sin. 2007, 45, 134–166. [Google Scholar]
  74. Thompson, J.; Charpentier, A.; Bouguet, G.; Charmassona, F.; Rosetb, S.; Buatoisa, B.; Vernetd, P.; Gouyone, P.H. Evolution of a genetic polymorphism with climate change in a Mediterranean landscape. Proc. Natl. Acad. Sci. USA 2013, 110, 2893–2897. [Google Scholar] [CrossRef] [PubMed]
  75. Pyke, C.R.; Condit, R.; Aguilar, S.; Lao, S. Floristic composition across a climatic gradient in a neotropical lowland forest. J. Veg. Sci. 2001, 12, 553–566. [Google Scholar] [CrossRef]
Figure 1. Locations of the sampling populations of three different Caragana species (C. microphylla Lam., C. liouana Zhao and C. korshinskii Kom.) in arid and semi-arid regions of northern China.
Forests 09 00297 g001
Figure 2. Population variation in leaf δ13C for each of the three Caragana species (a), C. korshinskii, CK1-CK12; (b) C. liouana, CL1-CL13; (c) C. microphylla, CM1-CM13.
Forests 09 00297 g002
Figure 3. Difference in leaf carbon isotope composition (δ13C) between three Caragana species collected along environmental gradients in northern China. Different letters indicate significant differences between means (p < 0.05).
Forests 09 00297 g003
Figure 4. Relationship between leaf δ13C and mean annual precipitation (MAP) for all species (a), C. korshinskii (b), C. liouana (c), and C. microphylla (d). Linear fits, correlation coefficients, and p-values are shown.
Forests 09 00297 g004
Figure 5. Relationship between leaf δ13C and relative humidity (RH) for all species (a), C. korshinskii (b), C. liouana (c), and C. microphylla (d). Linear fits, correlation coefficients, and p-values are shown.
Forests 09 00297 g005
Figure 6. Relationship between leaf δ13C and mean annual temperature (MAT) for all species (a), C. korshinskii (b), C. liouana (c), and C. microphylla (d). Linear fits, correlation coefficients, and p-values are shown.
Forests 09 00297 g006
Figure 7. Correlation between leaf δ13C and altitude for all species (a), C. korshinskii (b), C. liouana (c), and C. microphylla (d). Linear fits, correlation coefficients, and p-values are shown.
Forests 09 00297 g007
Table 1. Mean values of geographical and environmental variables and leaf nutrient concentrations across sites for each Caragana species. Mean values followed by different letters indicate significant differences between means in each row (p < 0.05).
VariablesC. korshinskiiC. liouanaC. microphylla
Mean ± SDMean ± SDMean ± SD
Altitude (m)1368.8 ± 173.1 a 1293.2 ± 142.9 a971.9 ± 612.7 b
MAP (mm)232.9 ± 81.6 b330.2 ± 69.1 a372.9 ± 40.0 a
MAT (°C)7.2 ± 1.5 b7.2 ± 0.9 b4.6 ± 2.2 a
RH (%)55.5 ± 0.6 b56.0 ± 0.9 b59.3 ± 3.3 a
Leaf N (mg∙g−1)32.62 ± 4.59 b38.32 ± 1.89 a39.76 ± 2.6 a
Leaf P (mg∙g−1)1.38 ± 0.23 b1.70 ± 0.17 a1.71 ± 0.24 a
MAP: mean annual precipitation; MAT: mean annual temperature; RH: mean annual relative humidity; SD: standard deviation.
Table 2. Correlating altitude with mean annual precipitation (MAP), mean annual temperature (MAT), relative humidity (RH), and leaf N and P concentrations for C. korshinskii, C. liouana, and C. microphylla. The symbol *** indicates statistical significance at p < 0.001.
SpeciesMAPMATRHNP
All species−0.274−0.193−0.780 ***−0.099−0.267
C. korshinskii0.2390.0480.2910.3440.388
C. liouana−0.510−0.0900.400−0.0170.294
C. microphylla0.020−0.890 ***−0.947 ***0.400−0.344
Table 3. Regression equations for leaf δ13C values against leaf N and P concentrations for C. korshinskii, C. liouana, and C. microphylla.
Nutrient VariablesSpeciesStatistic
Sloper2p-Value
Leaf NAll species−0.110.260.0010
C. korshinskii−0.100.030.6026
C. liouana−0.250.030.6061
C. microphylla0.460.230.0975
Leaf P All species−0.440.200.0051
C. korshinskii−0.240.120.2760
C. liouana0.140.020.6625
C. microphylla−0.030.0020.8936
Table 4. Results from multiple stepwise regressions testing relationships between leaf δ13C and mean annual precipitation (MAP), mean annual temperature (MAT), relative humidity (RH), and leaf N concentration for C. korshinskii, C. liouana, and C. microphylla. The most parsimonious model was found by selecting variables using a stepwise selection procedure based on Akaike information criteria (AIC). F- and p-values are shown for each species, along with standardized coefficients and r2 for the regressions.
Speciesa (Constant)bx1 (MAP)Standardized Coefficientscx2 (MAT)Standardized Coefficientsdx3 (RH)Standardized Coefficientsex4 (N)Standardized CoefficientsFp Regressionr2
All species−16.37−0.01−0.63
p < 0.001
−0.14−0.41
p < 0.001
49.78<0.0010.74
C. korshinskii−26.22−0.01−1.15
p < 0.001
0.080.56
p = 0.013
21.08<0.0010.82
C. liouana−21.00−0.01−0.91
p = 0.003
−0.39−0.55
p = 0.045
7.290.0110.59
C. microphylla−26.84 −0.18−0.72
p = 0.005
12.030.0050.52
The regression models are y = a + bx1 + cx2 + dx3 + ex4. x1, x2, x3, and x4 are MAP, MAT, RH, and leaf N concentration, respectively.

