Article

Allometric Equations for Predicting Culm Surface Area of Three Bamboo Species (Phyllostachys spp.)

1
Faculty of Environmental and Symbiotic Sciences, Prefectural University of Kumamoto, 3-1-100 Tsukide, Higashi-ku, Kumamoto 862-8502, Japan
2
Office for Campus Planning, Kyushu University, 744 Motooka, Nishi-ku, Fukuoka 819-0395, Japan
3
Faculty of Engineering, Hokkaido University, Kita-13, Nishi-8, Kita-ku, Sapporo, Hokkaido 060-8628, Japan
4
Department of Environmental Sciences, University of Yamanashi, 4-4-37 Takeda, Kofu, Yamanashi 400-8510, Japan
*
Author to whom correspondence should be addressed.
Forests 2018, 9(6), 295; https://doi.org/10.3390/f9060295
Submission received: 12 May 2018 / Revised: 24 May 2018 / Accepted: 24 May 2018 / Published: 25 May 2018
(This article belongs to the Section Forest Inventory, Modeling and Remote Sensing)

Abstract

:
It is strongly debated whether bamboo forest ecosystems are a carbon sink or a carbon source because of insufficient knowledge regarding carbon loss via CO2 emissions from these forests. The surface area (S) of bamboo culms (stems) is important for estimating culm respiration, a major component of carbon cycling in bamboo forests. However, few studies have attempted to formulate predictive equations for S. In this study, we developed allometric equations for predicting S in three bamboo species grown in Kyushu Island, western Japan: Phyllostachys pubescens Mazel ex Houz., P. bambusoides Sieb. et Zucc. and P. nigra var. henonis. We used a power equation between S and diameter at breast height (D) and a linear equation between S and D × total culm length (H). The results indicated that P. bambusoides and P. nigra shared common site-independent equations. In contrast, P. pubescens required species-specific equations due to interspecific variation in culm slenderness and tapering. We also found that D was a better predictive variable than DH when quantifying S because of its satisfactory predictive performance and simplicity. These findings will be beneficial for evaluating the contribution of bamboo forest ecosystems to carbon cycling.

1. Introduction

Bamboo (family: Poaceae, subfamily: Bambusoideae) is a diverse plant group with nearly 1500 species across approximately 119 genera and is native to all continents except Antarctica and Europe [1,2]. Bamboo forests cover roughly 31.5 million hectares worldwide [2,3] and occupy approximately 1% of the total global forested area [4]. International interest in bamboo has rapidly increased because of its highly versatility, fast growth and environmentally friendly characteristics [4,5,6].
Many studies in the past decade have shown the potential of bamboo forests as a carbon sink (a process that removes carbon dioxide from the atmosphere) [6,7,8,9,10,11]. Nevertheless, there remains considerable debate whether bamboo forest ecosystems are a carbon sink or a carbon source (a process of releasing carbon dioxide to atmosphere) [12,13,14]. One possible reason for this uncertainty is insufficient knowledge regarding carbon loss via CO2 emissions from bamboo forests [14].
Bamboo forests release CO2 into the atmosphere through respiration of the culm (stem), leaves, branches and soil, including roots [10,14,15,16,17]. In particular, culm respiration (RC) is a major component of carbon cycling in bamboo forests, accounting for nearly 30% of aboveground respiration [18,19]. RC can be quantified by scaling the point-measured respiration rate per unit area (RAREA) up to the individual- or stand-level with the culm surface area (S), i.e., RC = S × RAREA. This convenient approach is widely used to quantify the stem respiration of a tree as well as RC [20,21,22,23].
During this scaling, errors in S and RAREA can increase errors in the RC estimate [24]. For bamboo, a reliable RAREA must consider vertical variation, culm size and age, and response to temperature change [14,19]. By contrast, previous studies have not focused on the quantification of S. A previous study assumed cone geometry for culms when estimating RC in a bamboo forest [19]. However, this simplistic assumption is violated when quantifying S [25]. Because small errors in S could lead to large errors in scaled-up RC [24], S must be characterized accurately and precisely.
In general, measuring the surface area of a stem or culm requires time and labor-intensive destructive sampling [26]. Therefore, many allometric equations have been developed to estimate stem surface area in various tree species based on commonly measured tree attributes such as diameter at breast height and total tree height [27,28,29,30,31]. Numerous equations have also been derived for estimating culm biomass or volume of bamboo species [11,32,33,34,35,36,37,38], but only one study has investigated how S is related to other culm dimensions [39]. In Phyllostachys pubescens Mazel ex Houz., a common bamboo species in Asia with high potential for carbon sequestration [6,9,10,40], a power equation described the relationship between S and external culm diameter at breast height (D) [39]. In addition, a linear equation was suitable for representing the relationship between S and the product of D times total culm length (H) [39]. However, to our knowledge, no other allometric equations for predicting S are found in the literature, raising the question whether such predictive equations are site- and species-specific. If they are specific, destructive sampling is required for every site and species for which an equation is developed. In contrast, generic equations can be applied to multiple sites and species, which results in efficient RC prediction.
The objective of this study was to develop allometric equations for predicting S in three bamboo species grown in Kyushu Islands, southern Japan: P. pubescens, P. bambusoides Sieb. et Zucc. and P. nigra var. henonis, which are called the three major useful bamboos in Japan [34,41]. In Japan, bamboo forests are estimated to cover more than 150,000 ha [42,43]; these three species account for more than 99% [44]. Hence, developing allometric equations is helpful to evaluating the potential of the bamboo forests as a carbon sink. The findings obtained in this study will also be beneficial when determining equations for S of other bamboo species in other countries. Specifically, we address the following questions regarding our newly developed allometric equations for S:
(1)
Are the allometric equations site-specific?
(2)
Are the allometric equations species-specific?
(3)
What predictive variable is optimal for S prediction?

2. Materials and Methods

2.1. Study Sites

Data used here were gathered in Kyushu Islands, western Japan, which is situated between latitudes 30°59′ N to 33°58′ N and longtitudes 129°33′ E to 132°5′ E. Phyllostachys pubescens and P. bambusoides data were collected in a suburban forest of Toshima Mountain, located in eastern Kumamoto City, Kumamoto Prefecture, western Japan (32°49′ N, 130°48′ E, 80–90 m a.s.l.; hereafter TO). Average annual temperature and rainfall between 1981 and 2010 at the nearest observatory were 16.9 °C and 1986 mm, respectively [45]. The soil type was classified as ando soil [46]. Stands of both species were located adjacent to each other across an approach to Toshima Shrine at the foot of Mt. Toshima. These sites were originally used for upland farming until a few decades ago and became bamboo stands after the planting of bamboo and subsequent abandonment [33,35,36].
Phyllostachys nigra data were collected from two sites: the campus of Fukuoka University of Education in eastern Munakata City, Fukuoka Prefecture (33°48′ N, 130°36′ E, 50 m a.s.l.; MU) and the Ito campus of Kyushu University in western Fukuoka City, Fukuoka Prefecture, western Japan (33°36′ N, 130°13′ E, 60 m a.s.l.; IT). Average annual temperature, rainfall and soil type were, respectively, 15.6 °C, 1640 mm and a brown forest soil for MU and 16.1 °C, 1677 mm and a gley soil or brown forest soil for IT [45,46]. Both sites were very dense, and no other vegetation was found on their forest floors [34,35].

2.2. Field Measurements

For each site, healthy, living culm samples were felled at ground level after the growing (elongation) period from October to January [47]. In total, 200 culm samples were gathered from each of the P. pubescens and P. bambusoides stands in TO, while 60 and 110 culms were collected from P. nigra stands in MU and IT, respectively. Total culm length (H) and external culm diameter at breast height (D) were directly measured with a tape measure to the nearest 0.1 m and a digital caliper to the nearest 0.1 cm, respectively. To quantify S accurately and efficiently, external culm diameters at 10 successive points were measured with a caliper to the nearest 0.1 cm [25]. The measurement points were located along the culm at equal intervals of one tenth of the direct measured H. It should be noted that the ages of sample culms were not recorded in our sampling. However, this did not distort our results because of the following reasons: (1) the bamboo culms attain maximum total culm length by completing culm elongation [6,48,49], (2) the lack of vascular cambium results in no secondary growth of the culm after the elongation period [50,51], and thus (3) the relationships of S to other culm dimensions do not vary with culm age after completing elongation. The dendrometric parameters of sample culms are shown in Table 1.

2.3. Analyses Methods

For all culm samples, S was calculated from H and successive diameters measured at one-tenth intervals of H using the sectional measurement method [25,39]. Similarly, apparent culm volume (V) [52,53] was computed with the same method [33,34,35,36]. To improve the reliability of the allometric equations, we also used published data on D, H, S and V of P. bambusoides from three sites [54]: Fukuoka (FU; n = 122), Kitakyushu (KI; n = 102) and Hisayama (HI; n = 96), Fukuoka Prefecture. Therefore, as shown in Table 1, the resulting total number of samples was 890 (200 for P. pubescens from one site, 520 for P. bambusoides from four sites and 170 for P. nigra from two sites). Despite the reliable data of site location, the soil type was estimated to be brown forest soil or ando soil [46]. These data were used previously to develop height-diameter curves, two-way volume equations and one-way volume tables [33,34,35,36,55]. Furthermore, a part of the P. pubescens data (150 of 200 culms) was used to determine predictive equations for S [39].
For each species and site, samples were randomly split into modeling and validation data. The former was used to develop allometric equations for S, while the latter was used independently to test the predictive performance. Scatterplots of H and D for both datasets were very similar (data not shown), suggesting that robust conclusions could be reached from the validation.
We used the following two allometric equations:
S = αDβ,
and
S = γDH,
where α, β and γ are the parameters [27,39]. Phyllostachys bambusoides and P. nigra data were gathered from multiple sites, which allowed us to test whether the allometric equations were site-specific. In addition, P. bambusoides and P. nigra had similar culm taper [34], suggesting that they should share a common allometric equation for S. Furthermore, if the equations for the three species are generic, it is not necessary to develop the equations for each species by tedious destructive sampling. For these reasons, the allometric equations were determined for (1) each species and site (hereafter site-specific equation), (2) each species (species-specific equation), (3) P. bambusoides and P. nigra (common equation) and (4) all species (generic equation) (see Table 2). Goodness of fit was evaluated with the adjusted coefficient of determination (r2), root mean square error (RMSE) and Akaike’s Information Criteria (AIC).
As a preliminary analysis for examining the validity of Equation (2), we also tested the following three equations:
S = γDH + δ,
S = γ(DH)δ,
and
S = γDδHε,
where γ, δ and ε are the parameters. Values of δ in Equations (3) and (4) were not significantly different from zero and unity, respectively. In addition, neither δ nor ε in Equation (5) differed significantly from unity. These facts imply that these three equations are essentially identical to Equation (2), which also exhibited smaller AIC values. Hence, we selected Equation (2) as the predictive equation with two variables (D and H).
Using validation data, S was predicted by substituting measured D and H into the determined equations. Accuracy and precision were then evaluated with average relative error (%AE) and relative root mean square error (%RMSE), respectively. These were defined as:
% AE = 100 × n { ( S predicted S observed ) / S observed } / n ,
and
% RMSE = 100 × n ( S predicted S observed ) 2 / n / S average ,
where Spredicted and Sobserved are predicted and observed S, respectively; n is the number of culm samples; and Saverage is the average Sobserved values. Differences between Spredicted and Sobserved were examined with a Wilcoxon signed rank test.
To compare culm characteristics, height to diameter ratio (HDR) [56] and breast height form-factor for apparent culm volume (λb) [57] were calculated from modeling data. The former is known as a slenderness coefficient, whereas the latter is a measure of culm tapering. λb was calculated as:
λb = 4VD2H.
Culms with higher HDR and λb are more slender and non-tapering, respectively. These values were compared using Tukey’s HSD test. All statistical analyses were performed using R software version 3.4.3 [58], and p < 0.05 was considered significant.

3. Results and Discussion

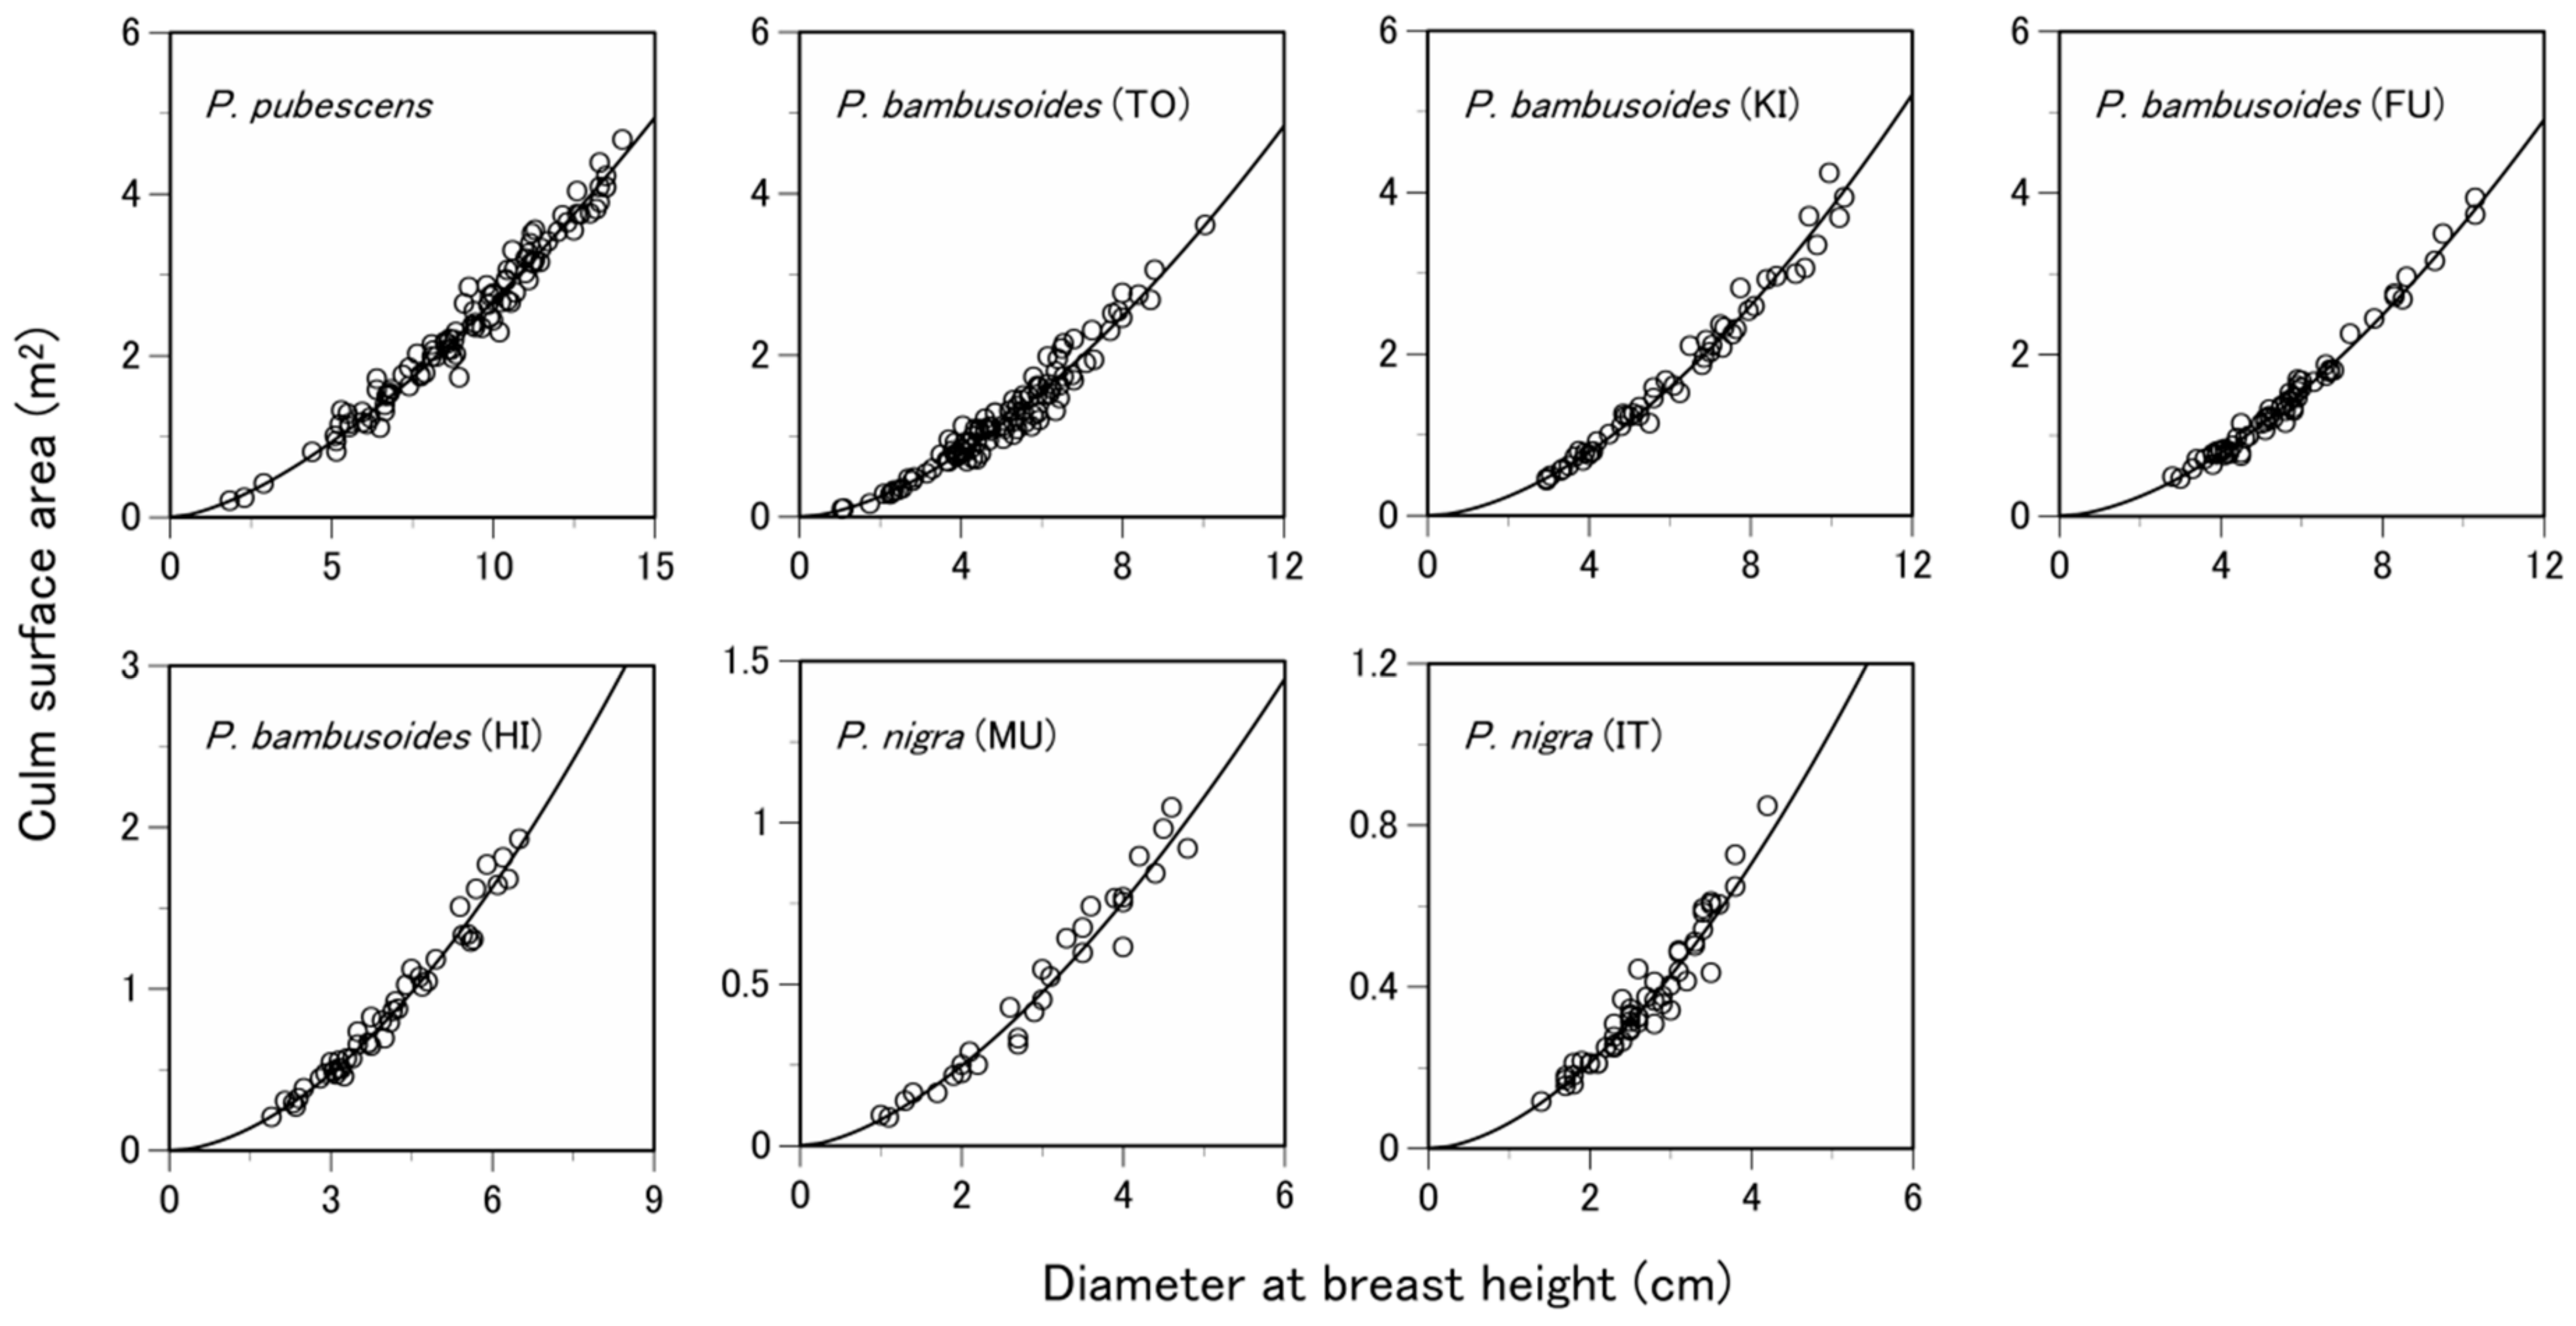
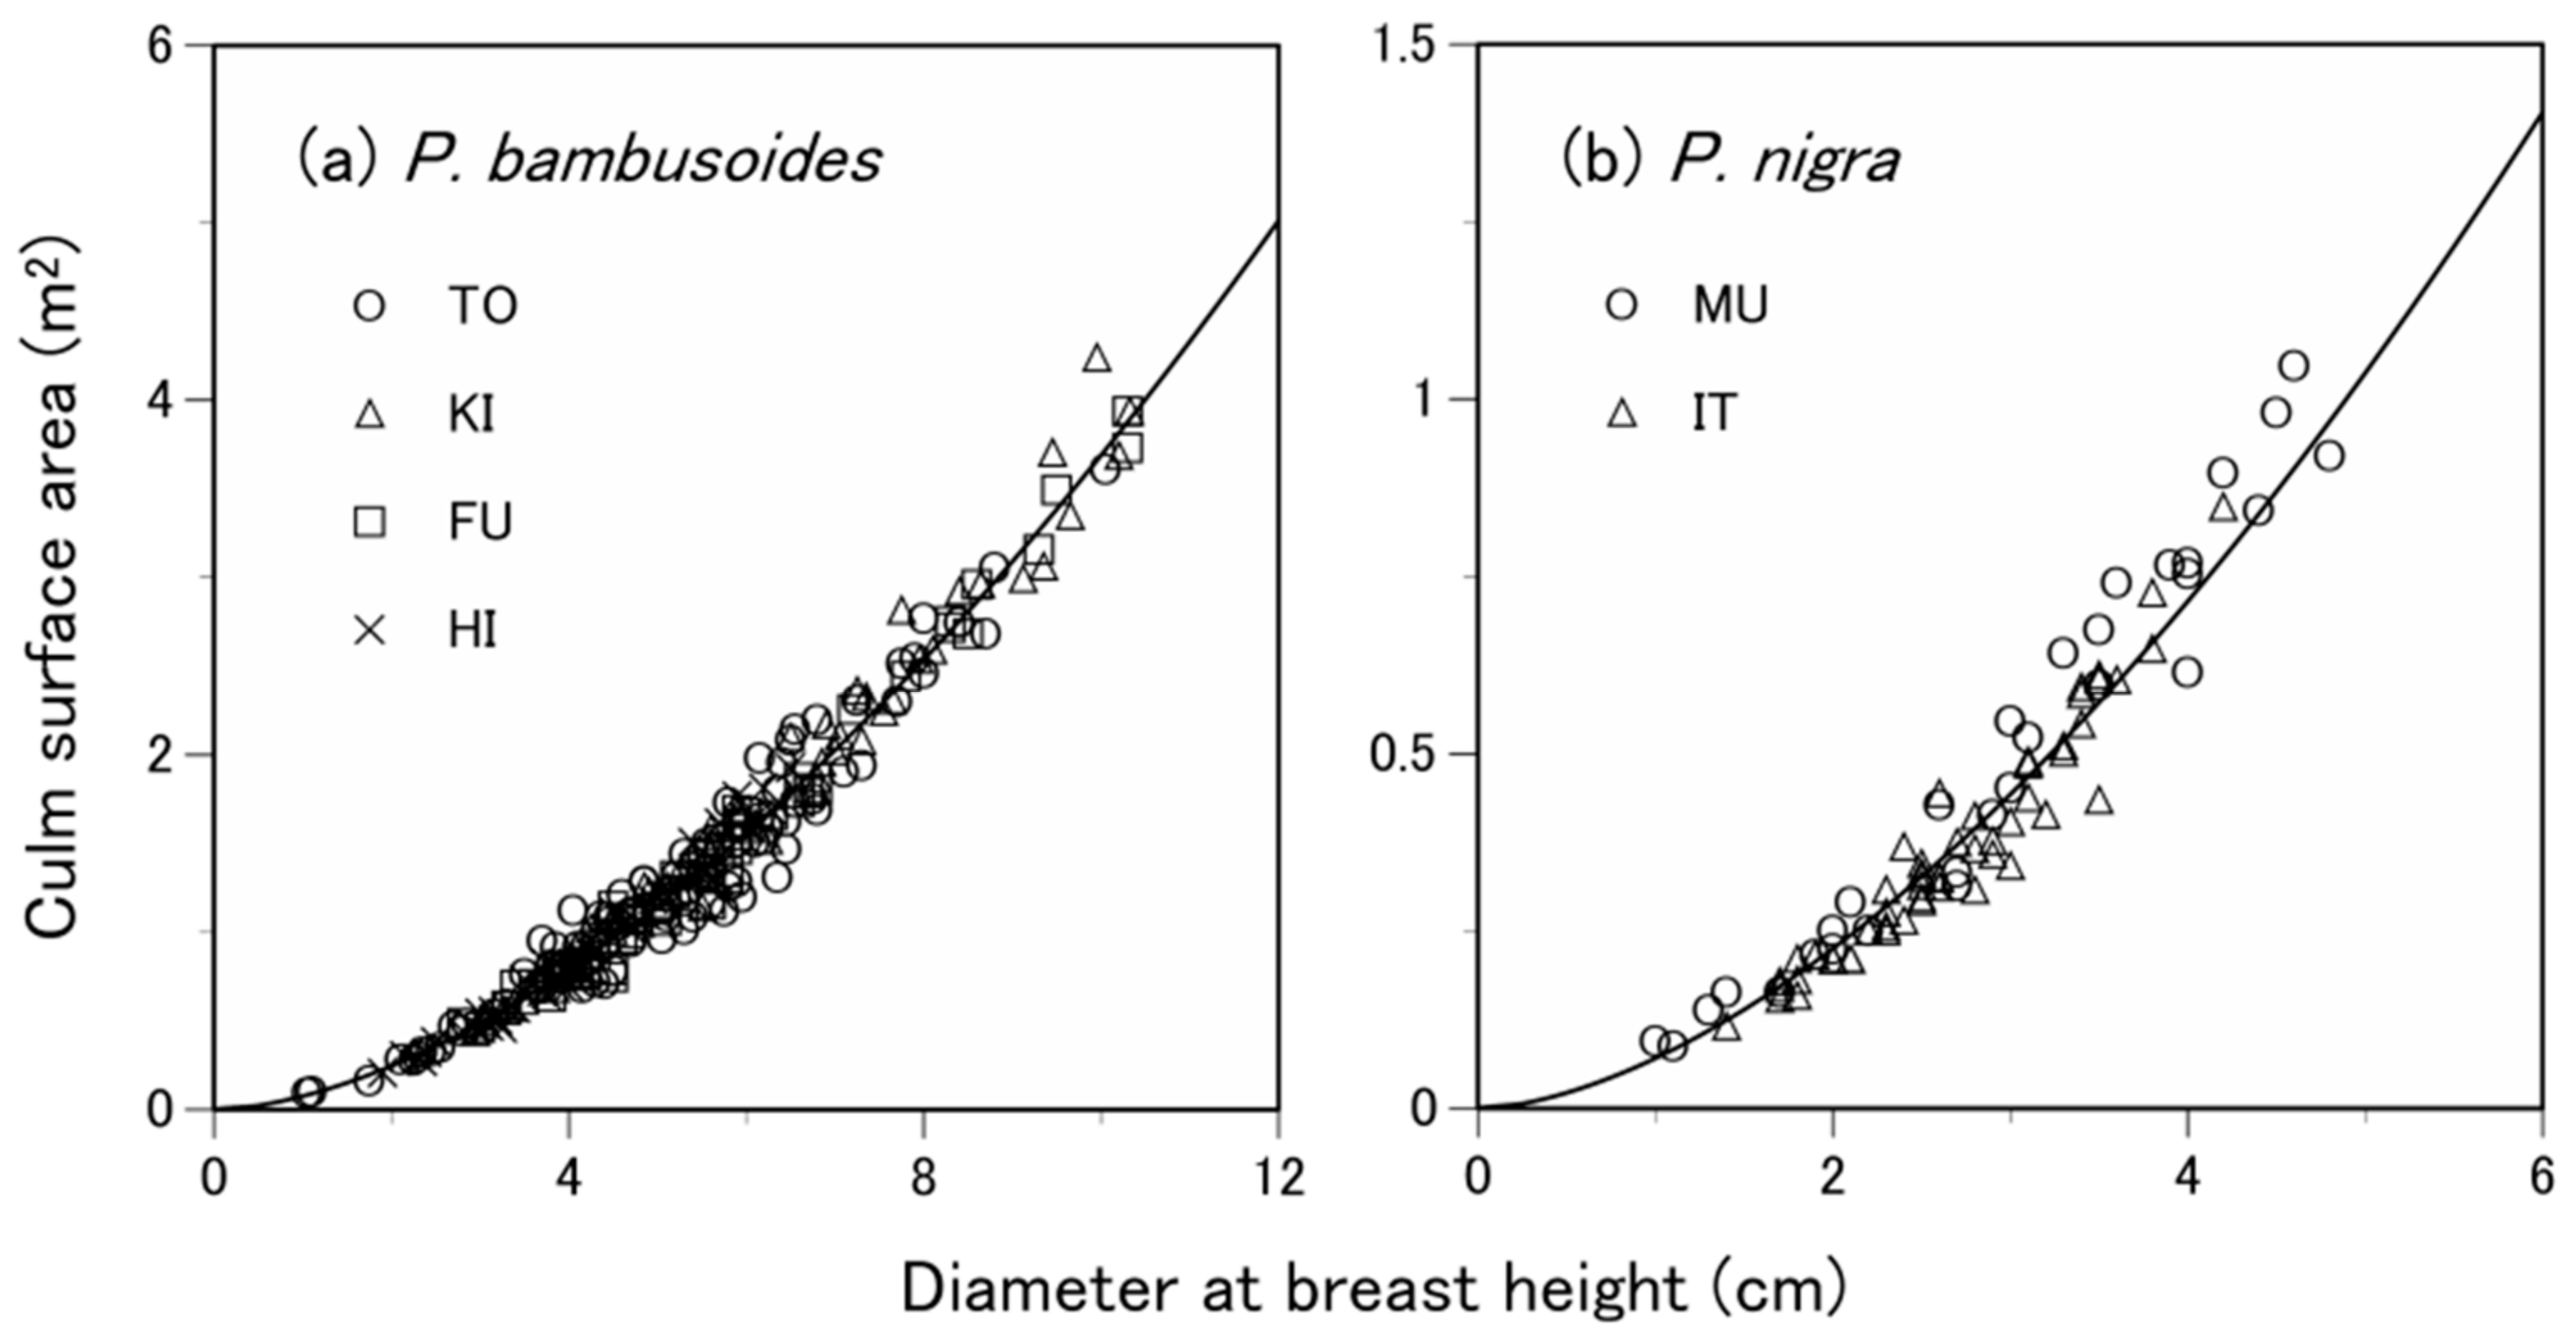
3.1. Are the Allometric Equations Site-Specific?

Figure 1 shows the relationship between S and D for each species and site. The parameter estimates and fit statistics of the developed equations are summarized in Table 3. The relationship between S and D can be described by a power equation for all species and sites (r2 > 0.94). The relationship between S and DH can also be expressed by a linear equation (r2 > 0.99; Figure 2). For all species and sites, %AE of the site-specific equations was small (less than ±3%; Table 4). Hence, Equations (1) and (2) are acceptable as the predictive equations for every species and sites examined in this study.
In P. bambusoides and P. nigra, a single, site-independent power equation represented the relationship between S and D (Figure 3). The values of r2 and RMSE of the power equation were, respectively, 0.98 and 0.131 m2 for P. bambusoides and 0.95 and 0.051 m2 for P. nigra. The relationship between S and DH was fitted by a single linear equation for both species, with r2 = 0.99 for both species (Figure 4). RMSE was 0.069 m2 for P. bambusoides and 0.017 m2 for P. nigra. Site- and species-specific equations for both species had comparable fit statistics and predictive performance, suggesting that separate equations are not necessary for different P. bambusoides and P. nigra sites. Therefore, the answer to the first question is that allometric equations for P. bambusoides and P. nigra are not site-specific. However, further studies are necessary to verify whether equations for P. pubescens are site-specific, as our data were insufficient to clarify this point.

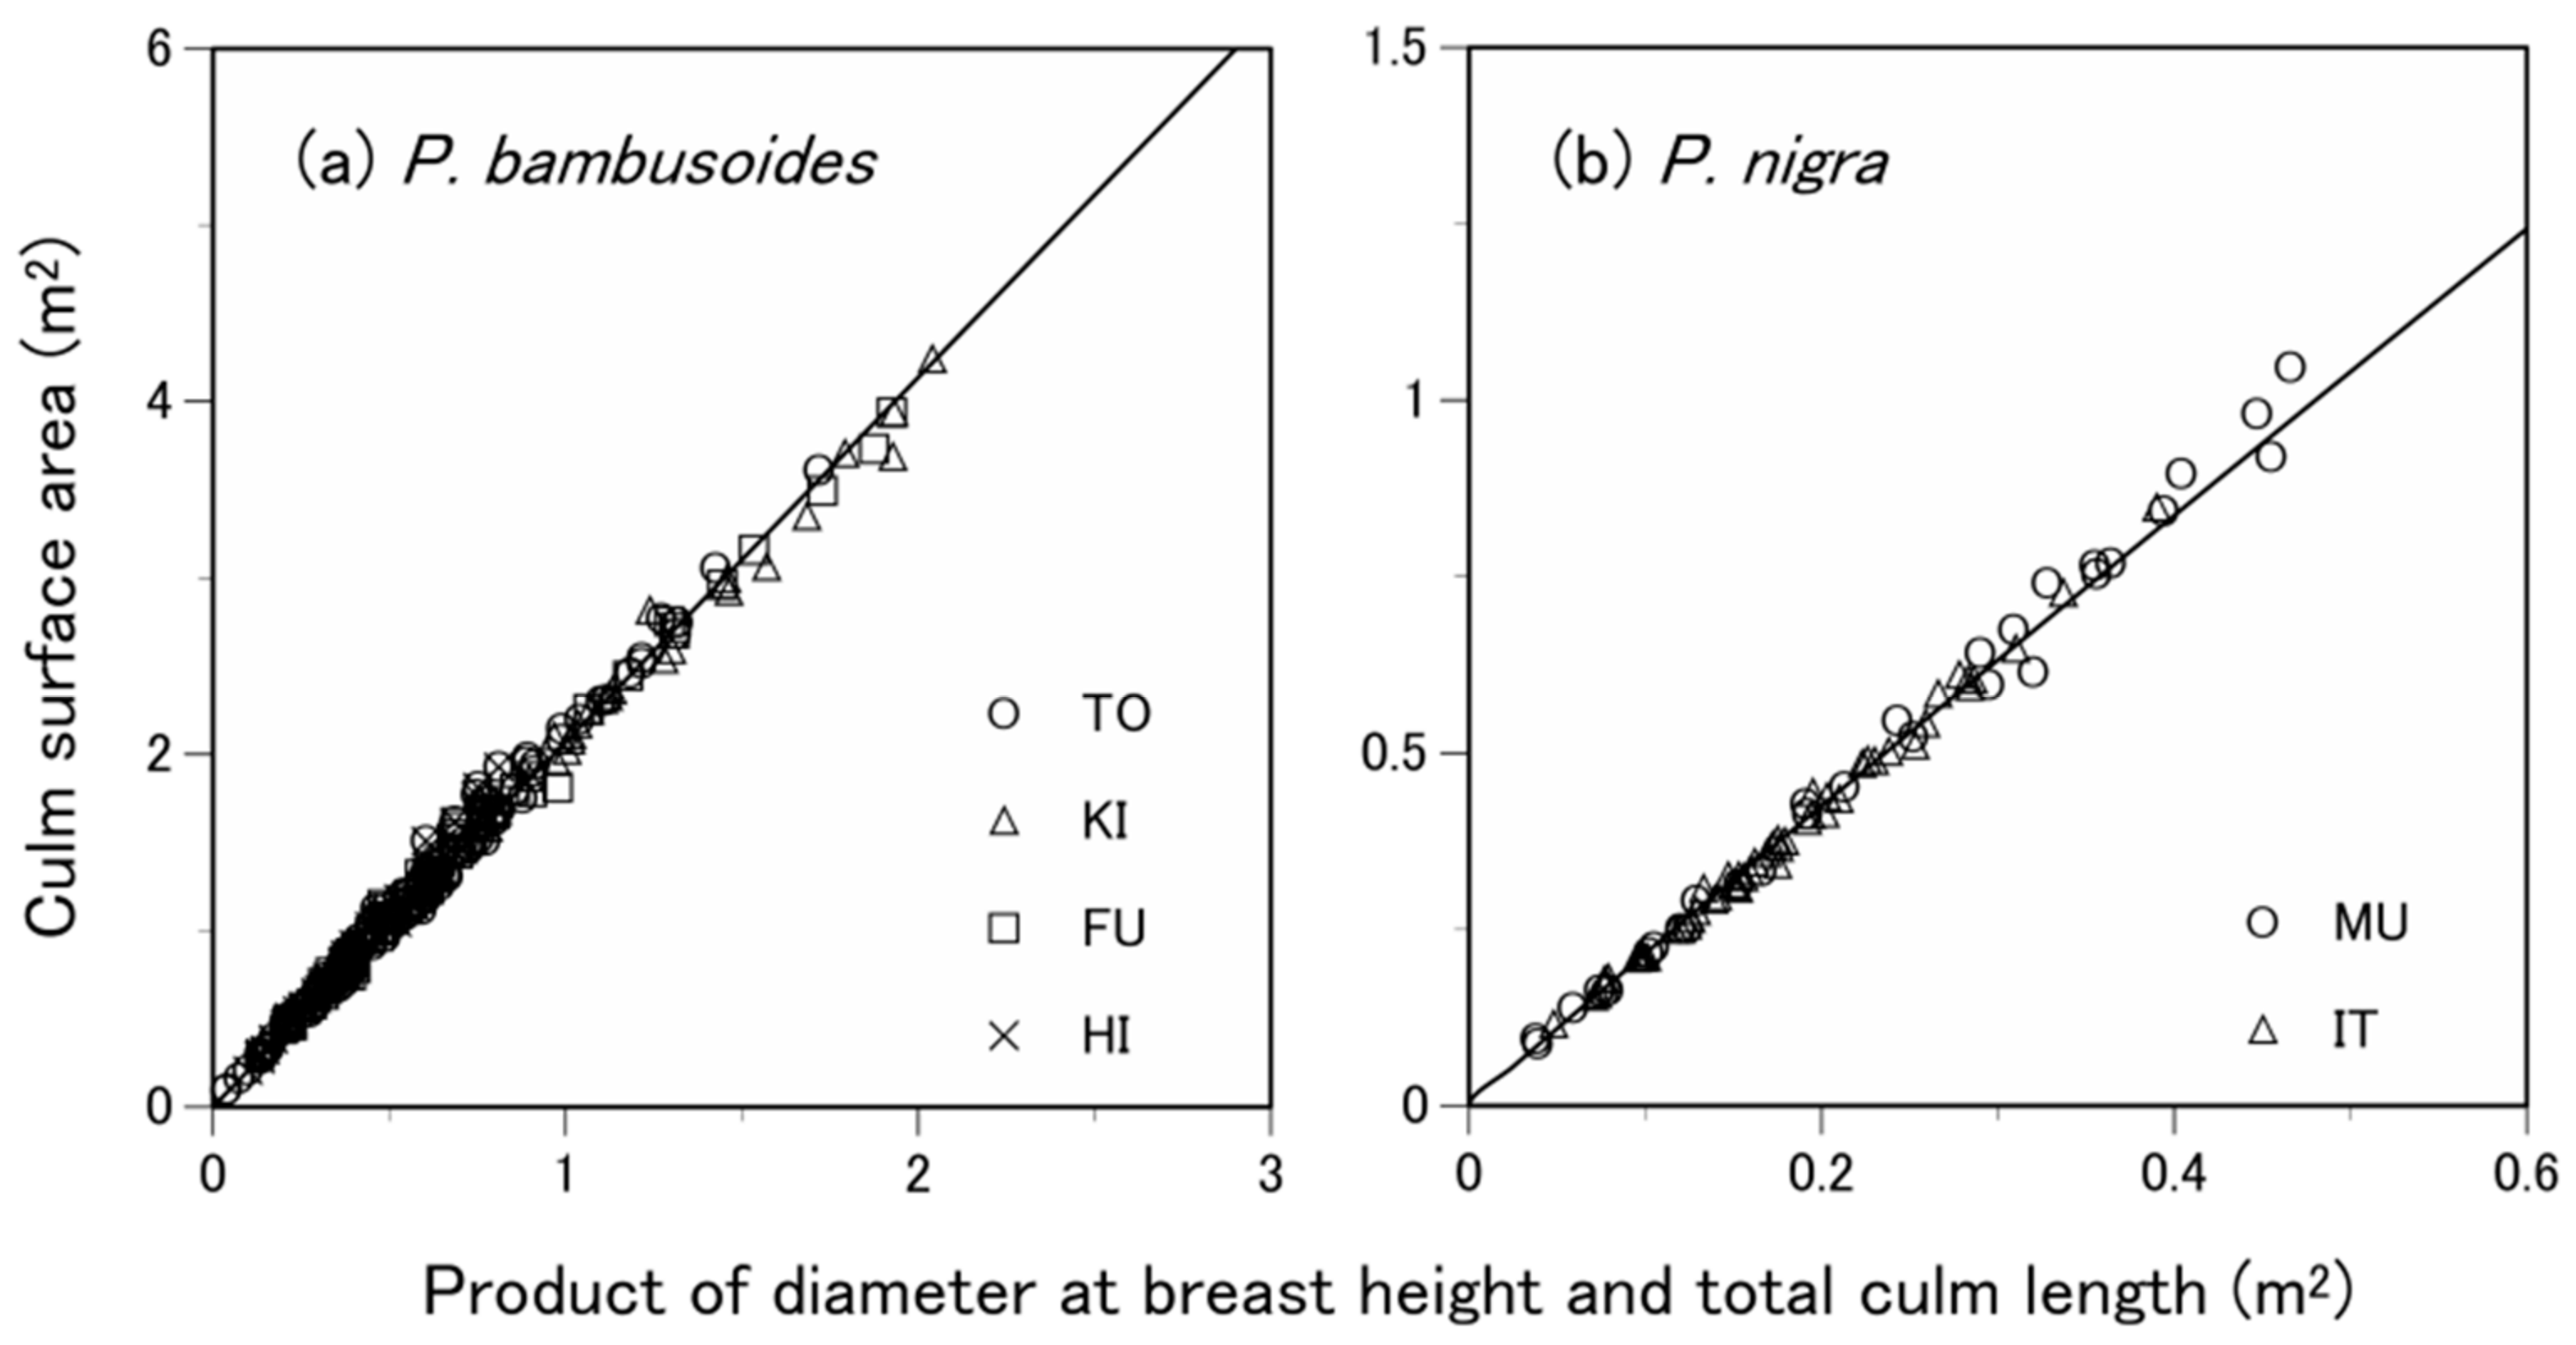
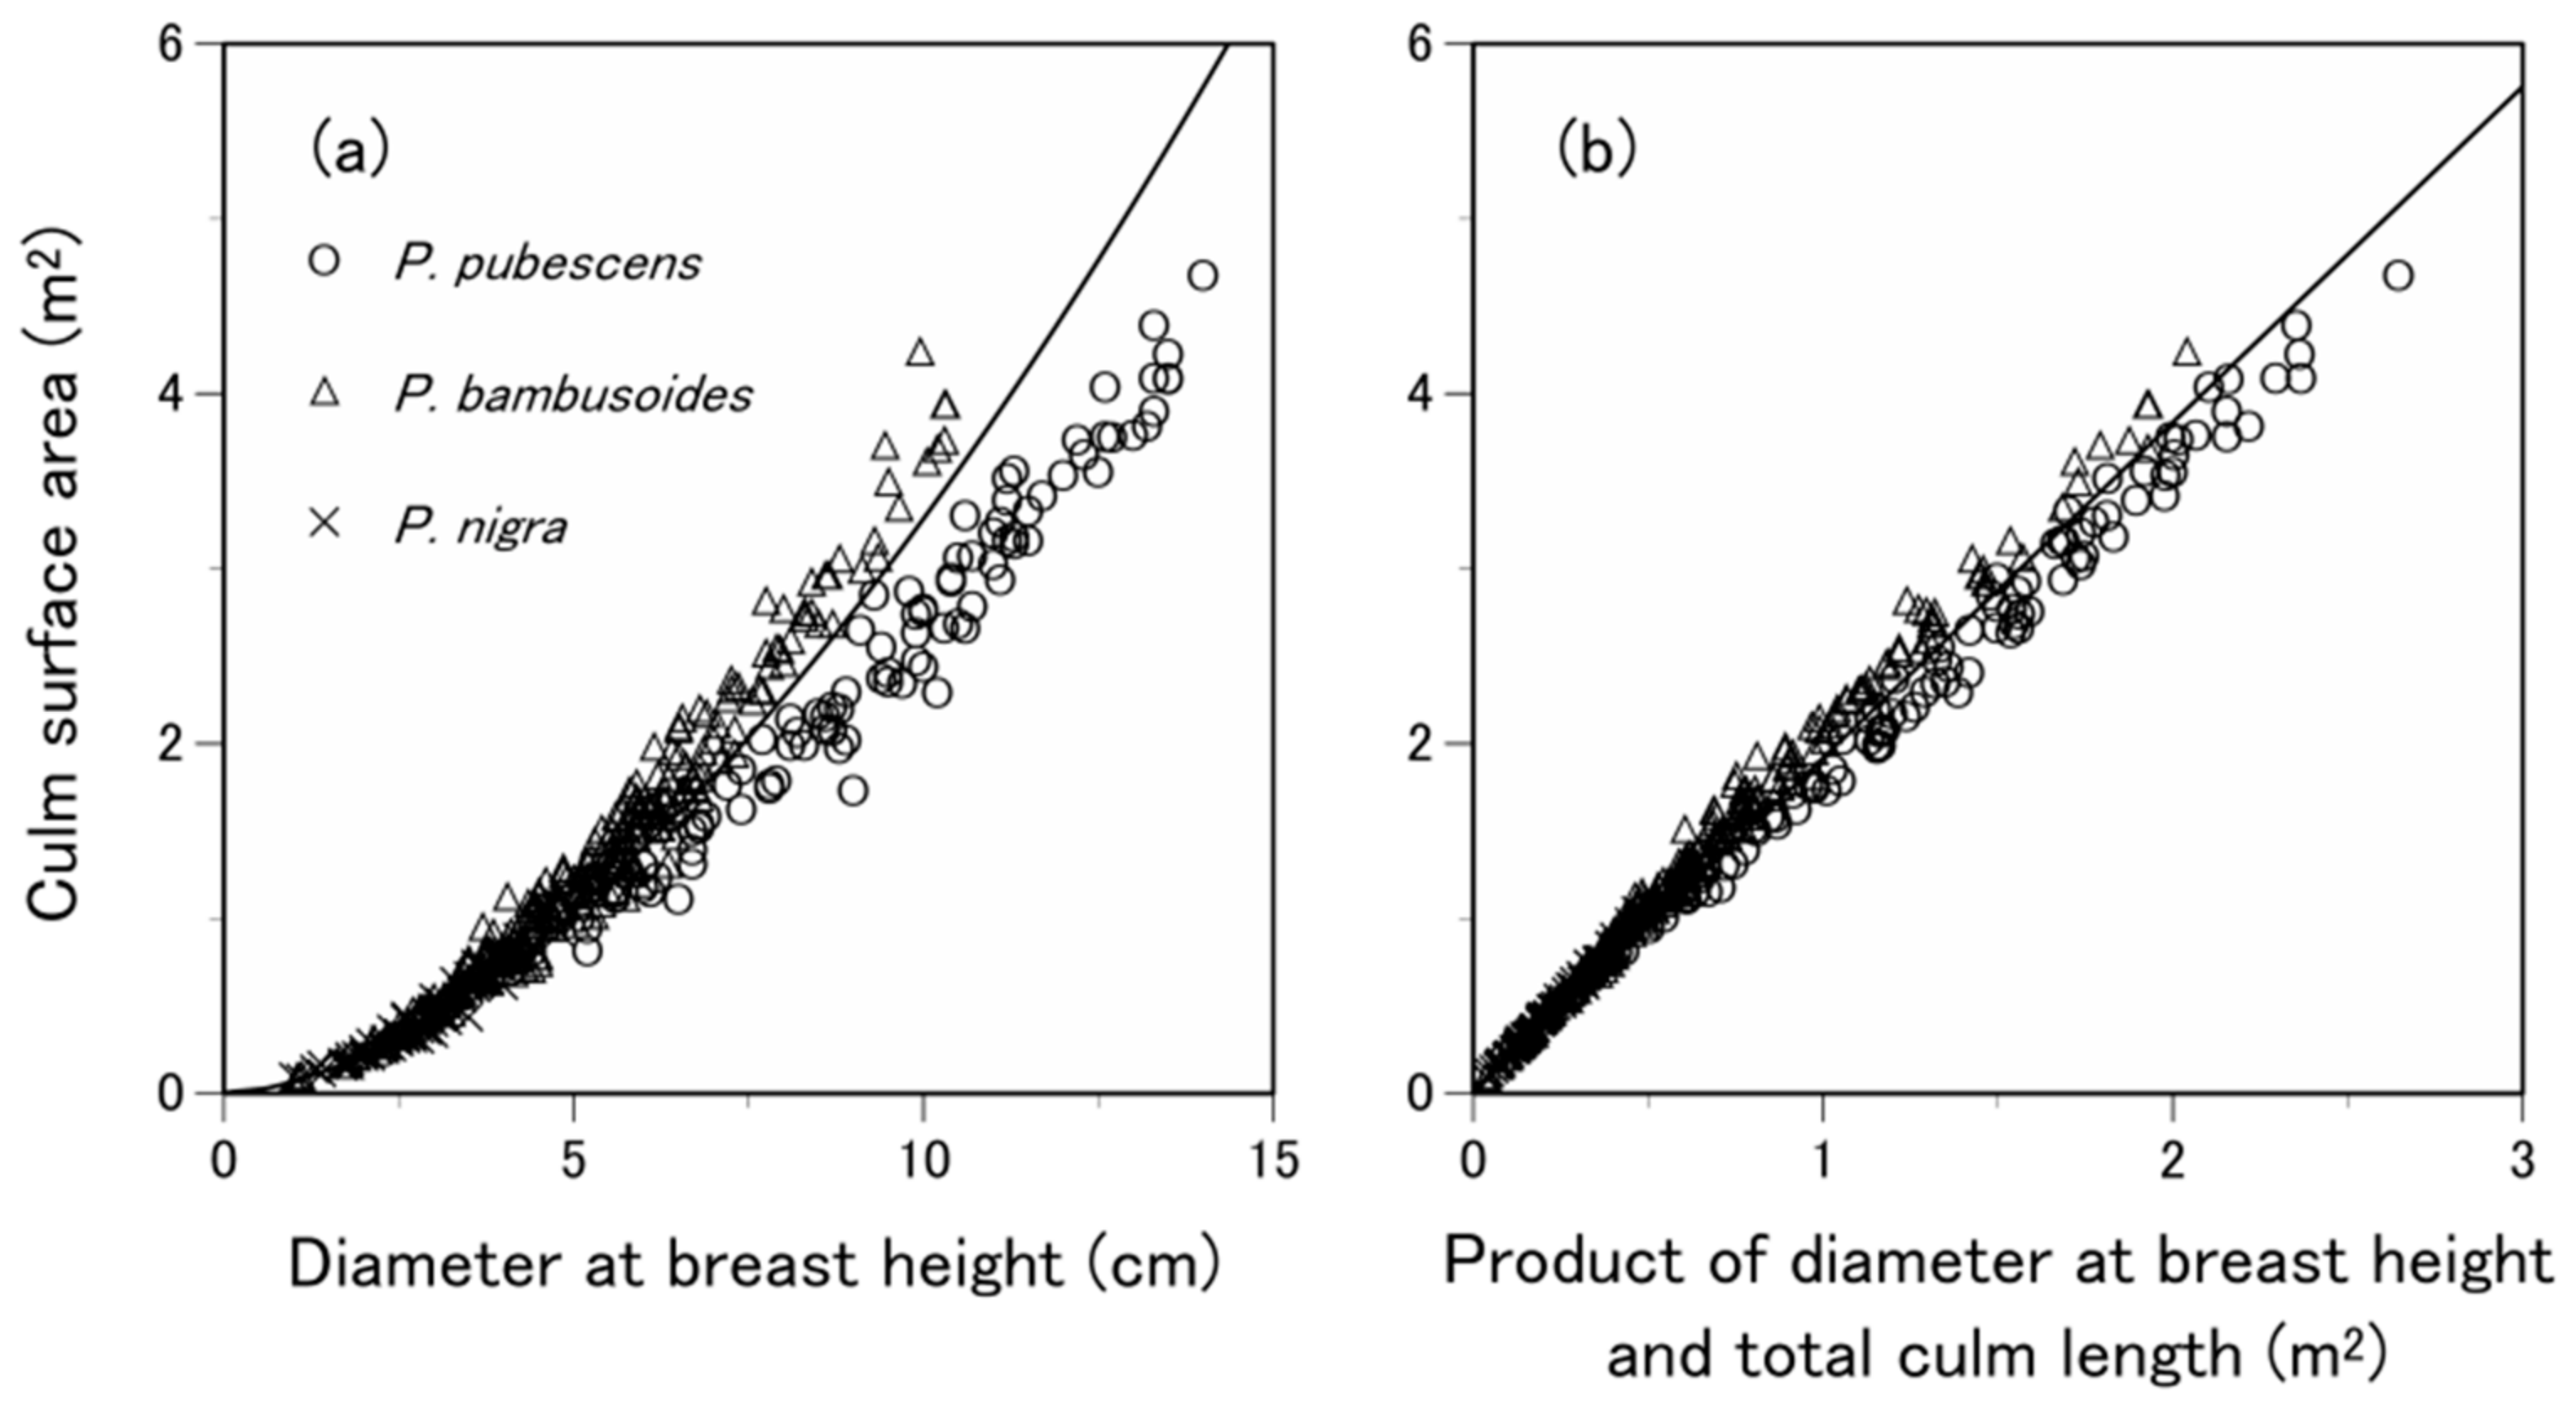
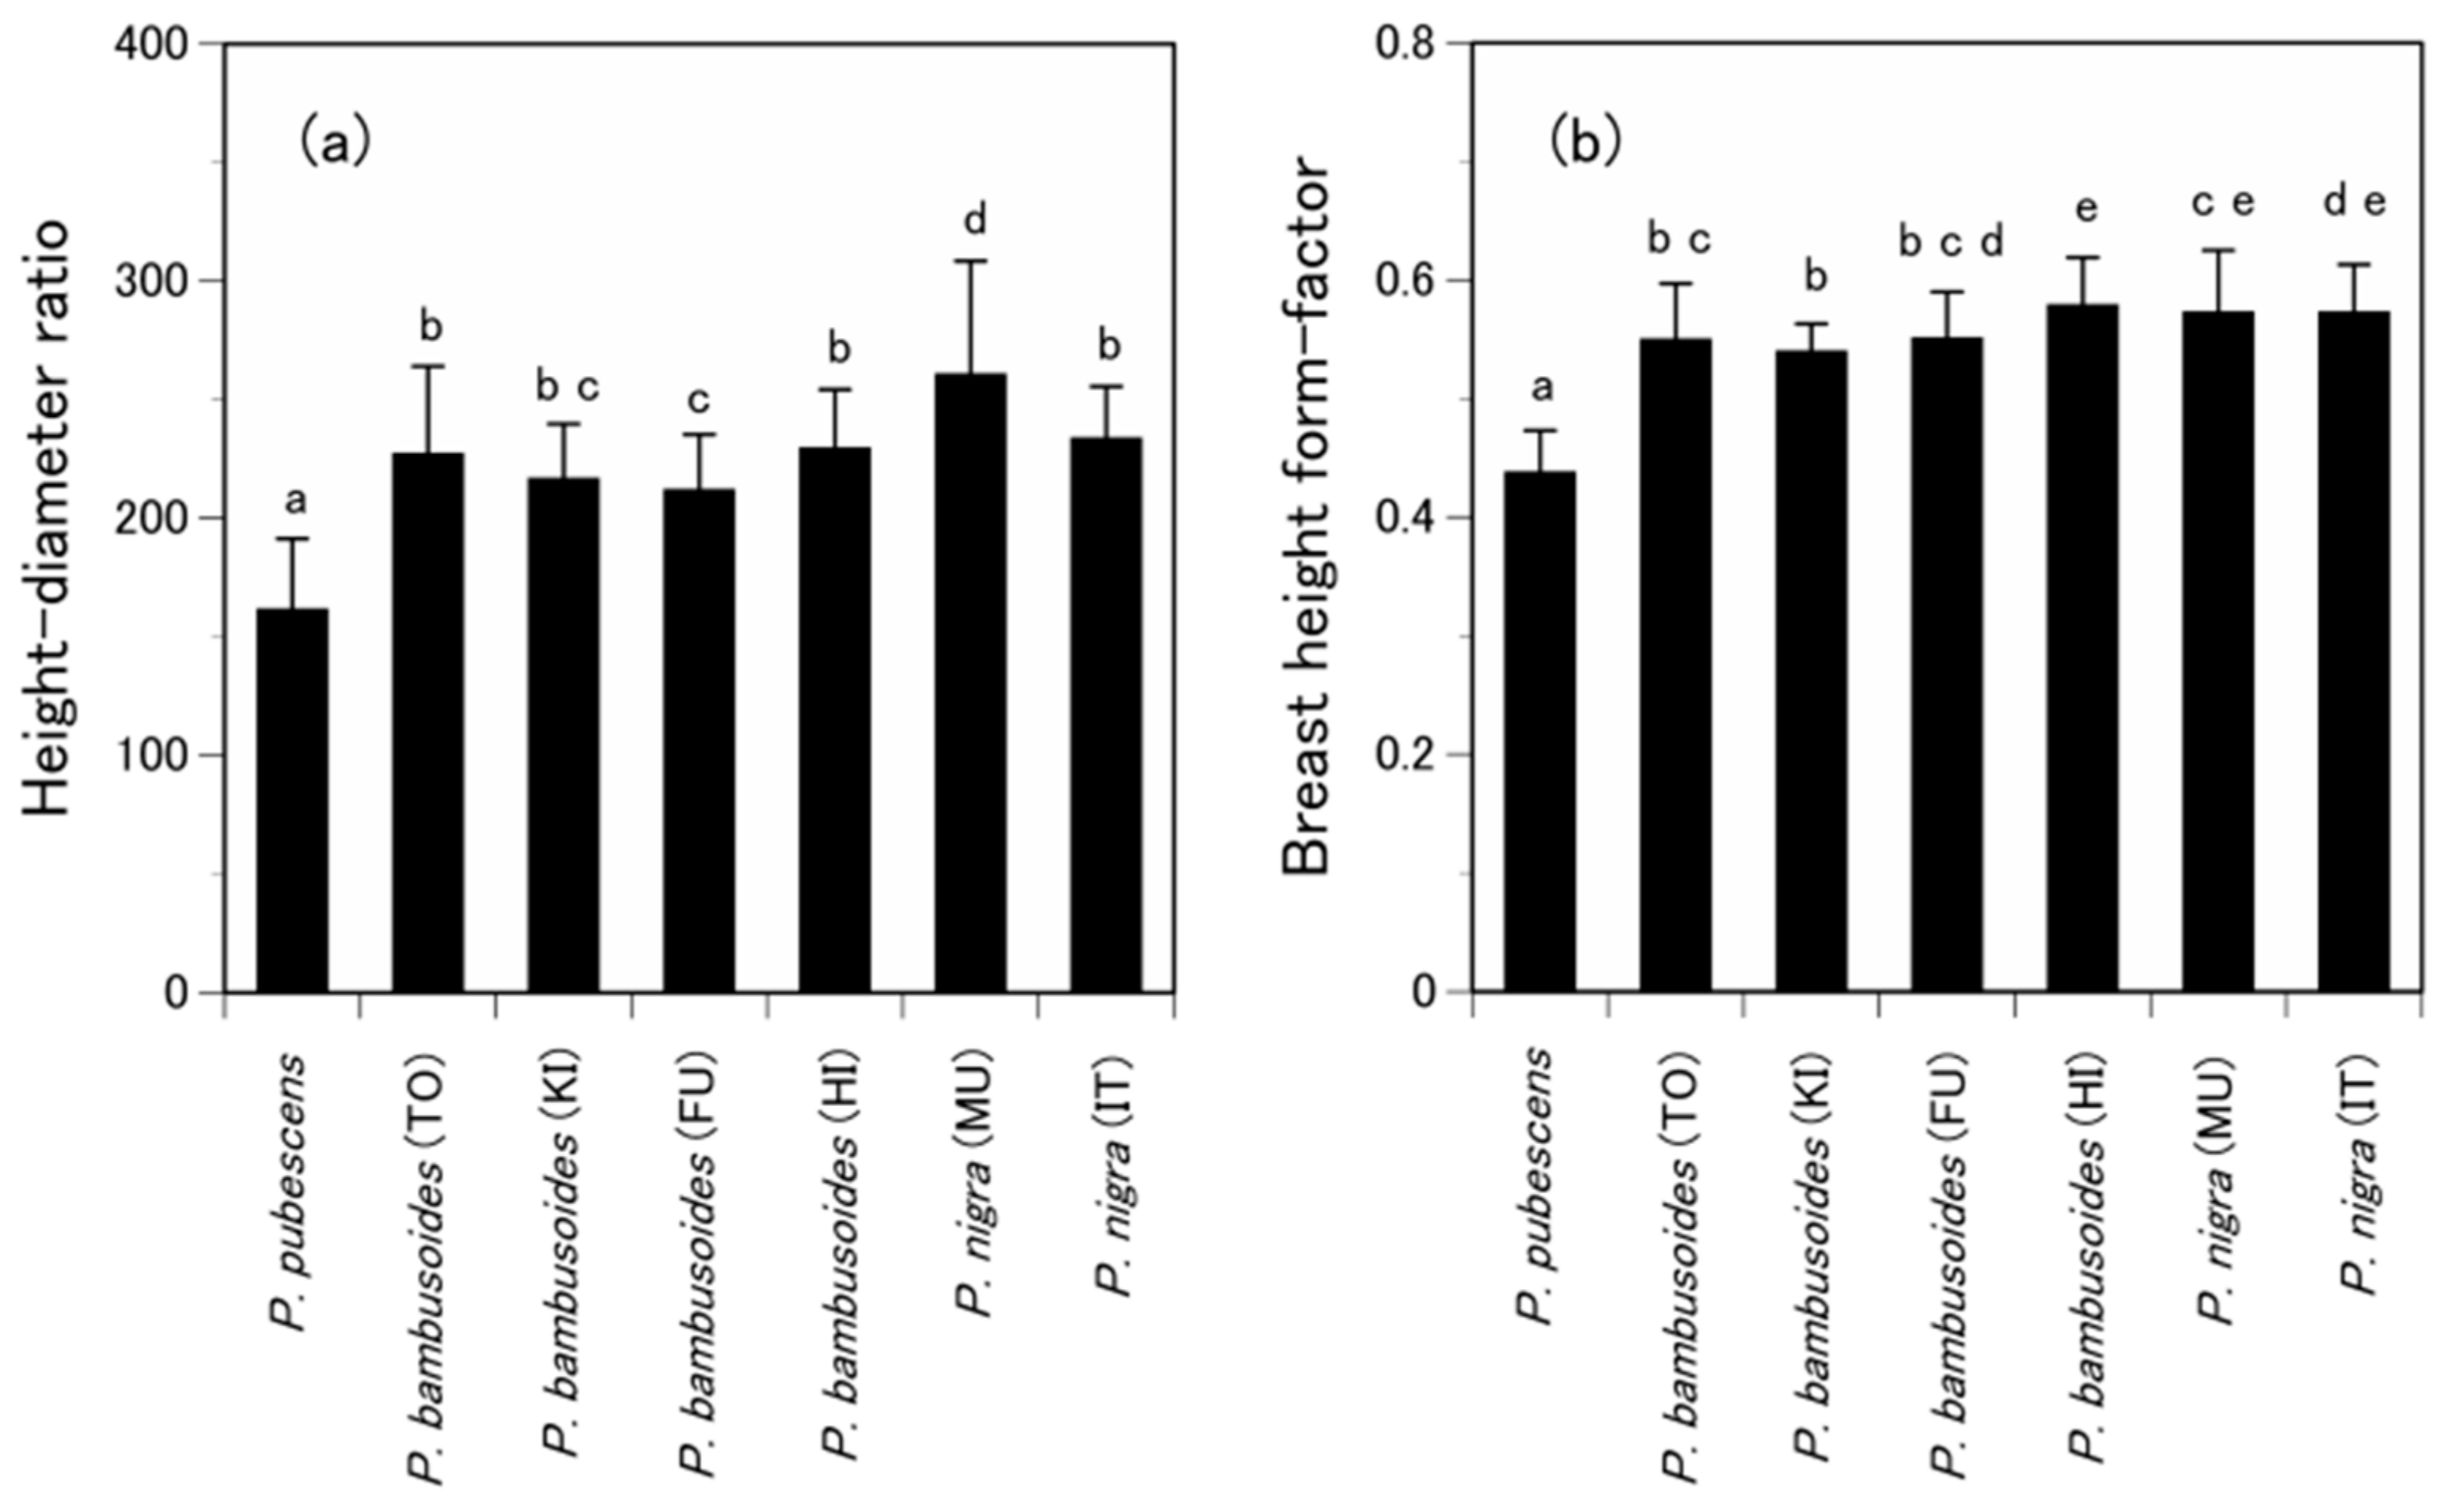
3.2. Are the Allometric Equations Species-Specific?

Figure 5 depicts the relationships of S to D and DH for P. bambusoides and P. nigra. Similar to the two-way volume equations for these species [33,34], the relationships were well expressed by the common power and linear equations with r2 = 0.98 for the former and r2 = 0.99 for the latter. Common equations had intermediate RMSEs compared to site- and species-specific equations. The relationships of S to D and DH for all three species are shown in Figure 6. Although the generic power equation for all three species was significant (r2 = 0.97), S and D scatterplots indicate a clear separation of P. pubescens and the other two species; for the same D, P. pubescens had a smaller S than P. bambusoides and P. nigra (Figure 6a). Similarly, the relationship between S and DH for the three species could be fitted by the single linear equation (r2 = 0.98). However, for the same DH, S was slightly smaller in P. pubescens than in the other two species (Figure 6b). In both generic equations, %AE was positive for P. pubescens, but negative for P. bambusoides and P. nigra. Therefore, when applying the generic equations, RC will be overestimated for P. pubescens and underestimated for the other two species. Moreover, the generic equations had larger %RMSEs than the other equations. These results indicate that generic equations are inappropriate when estimating S, and the predictive equations for P. pubescens should be species-specific. For these reasons, the optimal equations for predicting S are as follows:
S = 83.21D1.49,
S = 1.80DH,
for P. pubescens (species-specific equations) and
S = 187.66D1.70,
S = 2.08DH,
for P. bambusoides and P. nigra (common equations).
For P. pubescens, both power and linear equations had %AE less than ±0.5%, with no significant differences between Spredicted and Sobserved. Generally, Spredicted of P. bambusoides from power and linear common equations did not differ significantly from Sobserved, with %AE less than ±1.2% for all sites and equations except for Spredicted in the TO from the power equation (%AE = −2.3%) and in the HI from the linear equation (−5.7%). For P. nigra, a significant difference was found between Spredicted and Sobserved at both sites; %AE from the power equation was relatively large for IT (9.1%), but less than ±5% for other sites and equations. It should be noted that the common power equation in MU had smaller %AE than the species-specific power equation. Therefore, the predictive performance of common equations is not inferior to that of species-specific equations. However, common equations have broader application than species-specific equations, even if they are not relevant for P. pubescens.
Why are the predictive equations different between P. pubescens and the other two species? Figure 7a compares HDR computed from modeling data across species and sites. P. pubescens had significantly lower HDR, and therefore shorter culm length, than P. bambusoides and P. nigra. Hence, P. pubescens has a relatively smaller S for the same D than the other species. Moreover, P. pubescens had lower λb (Figure 7b), indicating a more tapered culm. A tapered culm results in smaller S for the same D and H. These facts indicate that interspecific variation in culm slenderness and tapering explains differences in allometric power equations, while only variation in culm tapering explains differences in the linear equation. Therefore, the answer to the second question is that species-specific predictive equations are required for P. pubescens, but not for P. bambusoides and P. nigra, because of interspecific variation in culm characteristics.

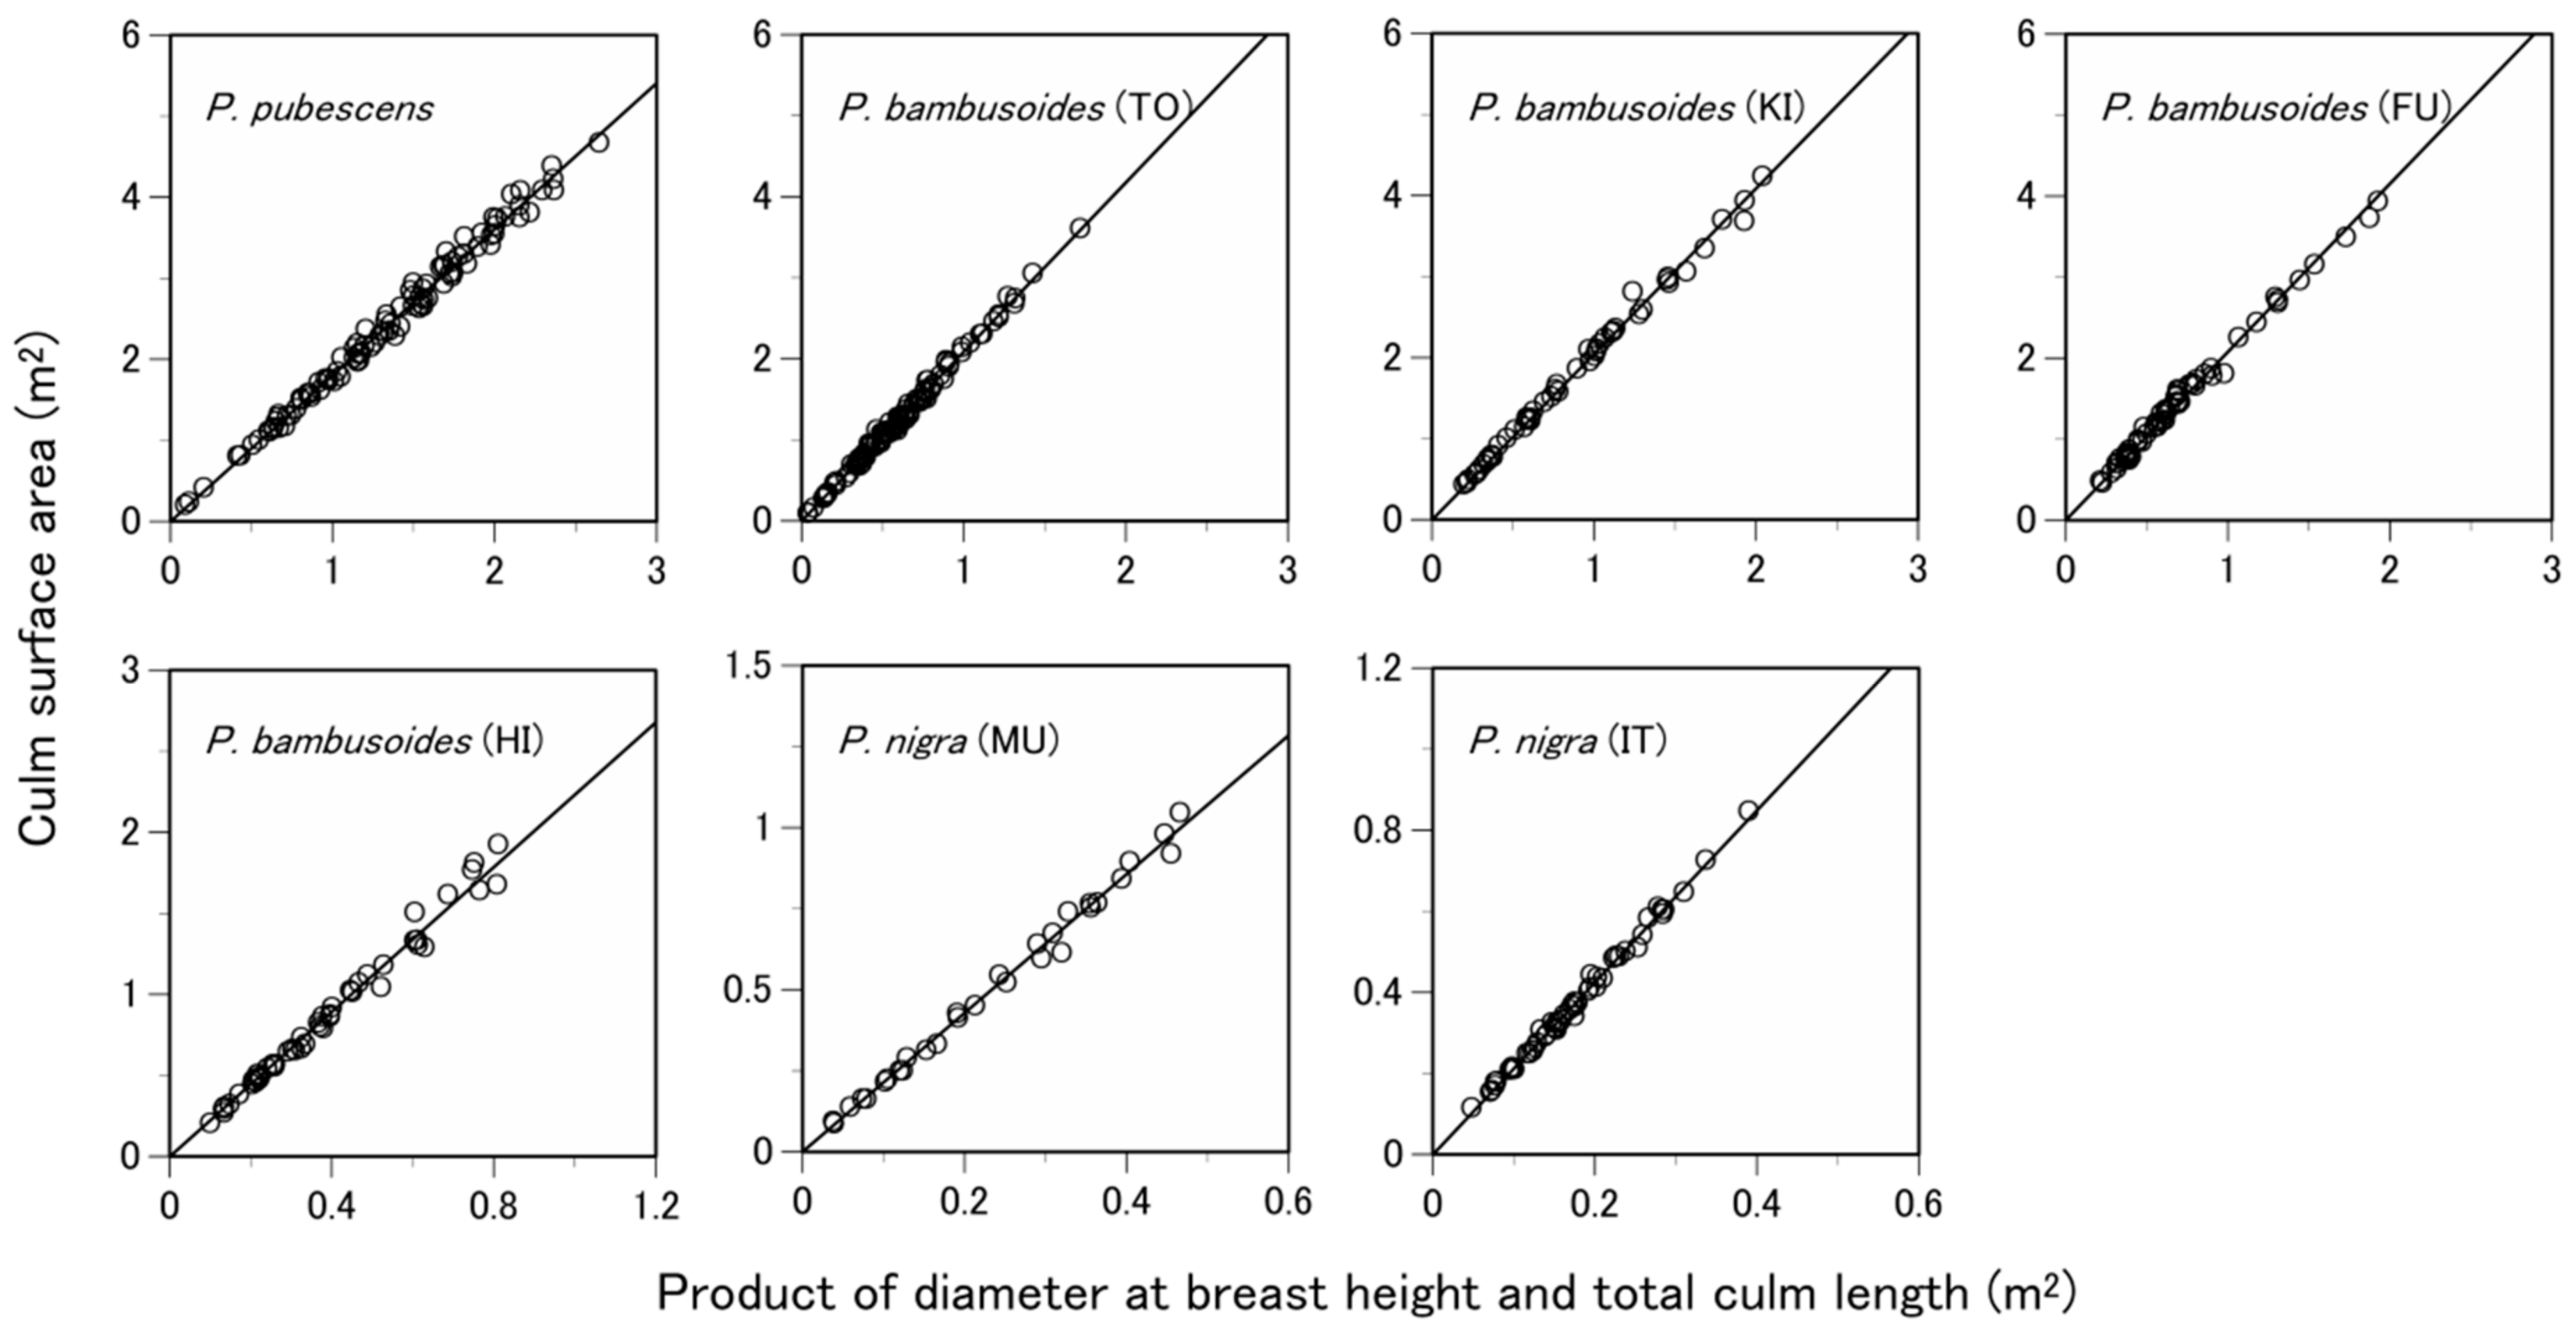
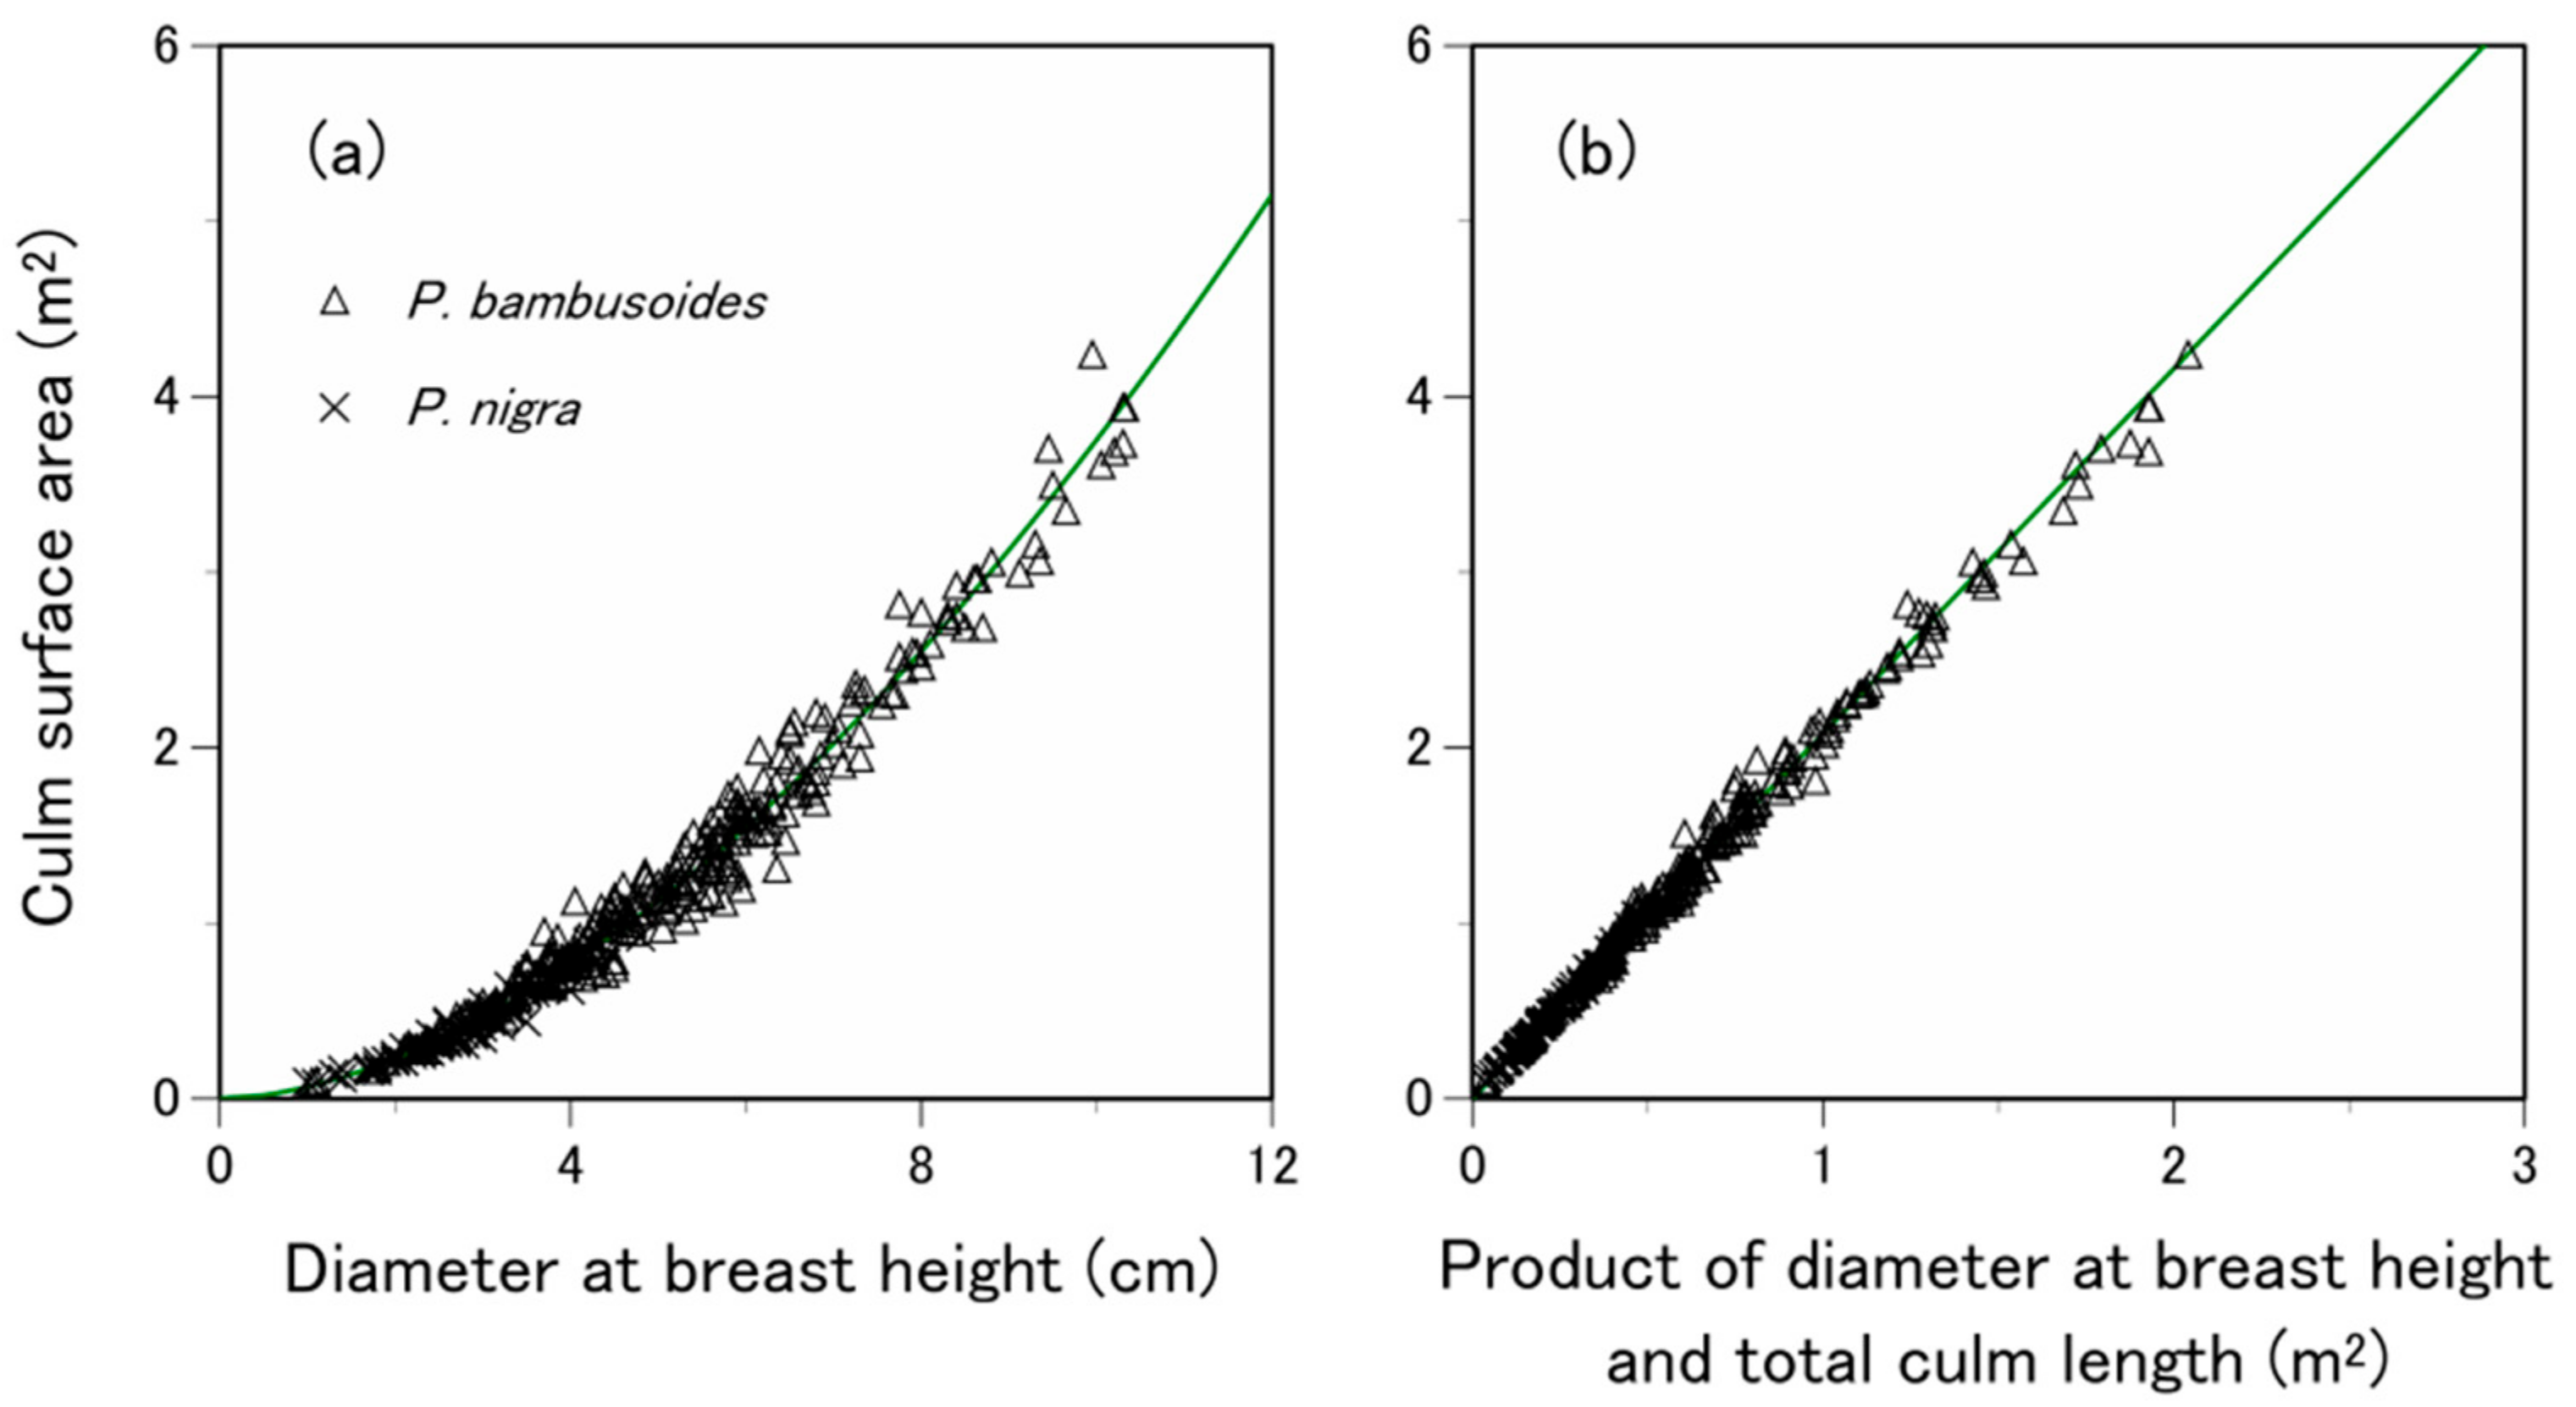
3.3. What Predictive Variable Is Optimal for S Prediction?

We compared two allometric equations for predicting S with the different variables, i.e., D and DH. Which predictive variable is better? We found that the DH-based equation, Equation (2), showed slightly higher r2 and smaller RMSE and AIC than the D-based equation, Equation (1) (Table 3). However, %AE and %RMSE magnitudes exhibited inter-site and inter-specific variation (Table 4), suggesting that the inclusion of the additive variable H does not improve the predictive performance. Diameter at breast height and tree height are easy measureable dendrometric variables of trees [28]. D of bamboo is also the most easily measured culm attribute. In contrast, it is difficult to measure H of standing bamboo culm, since the culm tip is generally bent askew [35,52,59]. Equations (10) and (12) clearly demonstrated that inaccurate measurement of H causes errors in S prediction, which results in uncertain RC prediction. Similar arguments are found in estimating V or biomass of tree species [60,61,62]. For these reasons, our answer to the third question is that D is the optimal variable for estimating S of the three examined bamboo species.

4. Conclusions

In this study, we developed allometric equations for predicting S in three Phyllostachys species grown in Kyushu Island, western Japan. We demonstrate that P. bambusoides and P. nigra share the common site-independent equations, whereas P. pubescens requires species-specific equations because of interspecific variation in culm slenderness and tapering. We also conclude that D is the optimal variable when predicting S of all three species. These equations enable us to scale point-measured RAREA up to RC at individual- or stand-levels efficiently through simple measurement of D. Therefore, the equations developed here will be beneficial for evaluating RC, and bring a consensus regarding the contribution of bamboo forest ecosystems to the carbon cycle. In future, it is necessary to examine whether the equations vary with culm sizes, climatic conditions and soil properties.

Author Contributions

All authors contributed extensively to the work. A.I. and Y.M. conceived the concepts of this study; A.I. performed field measurements and data analysis; A.I. wrote and revised the paper with comments from all co-authors.

Acknowledgments

The authors thank Noriaki Shimamura, Masayoshi Iio, Takeshi Ouchi and Kohtaro Sakuta for supporting our field survey. We would also like to thank the students of the Laboratory of Forest Ecology, Faculty of Environmental and Symbiotic Sciences, Prefectural University of Kumamoto for their technical assistance. This study was supported by JSPS KAKENHI (grant numbers: 15KK0220, 15K07478, 16K12823, 16K14948, 25390147, 18H02244 and 18H03818).

Conflicts of Interest

The authors declare no conflict of interest.

References

  1. Lucas, S. Bamboo; Reaktion Books: London, UK, 2013. [Google Scholar]
  2. Clark, L.G.; Londoño, X.; Ruiz-Sanchez, E. Bamboo taxonomy and habitat. In Bamboo: The Plant and Its Uses; Liese, W., Köhl, M., Eds.; Springer: Cham, Switzerland, 2015; pp. 1–30. [Google Scholar]
  3. Kuehl, Y. Resource, yield, and volume of bamboos. In Bamboo: The Plant and Its Uses; Liese, W., Köhl, M., Eds.; Springer: Cham, Switzerland, 2015; pp. 91–111. [Google Scholar]
  4. Song, X.; Zhou, G.; Jiang, H.; Yu, S.; Fu, J.; Li, W.; Wang, W.; Ma, Z.; Peng, C. Carbon sequestration by Chinese bamboo forests and their ecological benefits: Assessment of potential, problems, and future challenge. Environ. Rev. 2011, 19, 418–428. [Google Scholar] [CrossRef]
  5. Song, X.; Peng, C.; Zhou, G.; Gu, H.; Li, Q.; Zhang, C. Dynamic allocation and transfer of non-structural carbohydrate, a possible mechanism for the explosive growth of Moso bamboo (Phyllostachys heterocycla). Sci. Rep. 2016, 6, 25908. [Google Scholar] [CrossRef] [PubMed]
  6. Yen, T.M. Culm height development, biomass accumulation and carbon storage in an initial growth stage for a fast-growing moso bamboo (Phyllostachys pubescens). Bot. Stud. 2016, 57, 10. [Google Scholar] [CrossRef] [PubMed]
  7. Li, P.; Zhou, G.; Du, H.; Lu, D.; Mo, L.; Xu, X.; Shi, Y.; Zhou, Y. Current and potential carbon stocks in Moso bamboo forests in China. J. Environ. Manag. 2015, 156, 89–96. [Google Scholar] [CrossRef] [PubMed]
  8. Wu, W.; Liu, Q.; Zhu, Z.; Shen, Y. Managing bamboo for carbon sequestration, bamboo stem and bamboo shoots. Small-Scale For. 2015, 14, 233–243. [Google Scholar] [CrossRef]
  9. Xu, L.; Shi, Y.; Zhou, G.; Xu, X.; Liu, E.; Zhou, Y.; Li, C.; Fang, H.; Deng, X. Temporal change in aboveground culms carbon stocks in the Moso bamboo forests and its driving factors in Zhejiang Province, China. Forests 2017, 8, 371. [Google Scholar] [CrossRef]
  10. Lin, M.Y.; Hsieh, I.F.; Lin, P.H.; Laplace, S.; Ohashi, M.; Chen, T.H.; Kume, T. Moso bamboo (Phyllostachys pubescens) forests as a significant carbon sink? A case study based on 4-year measurements in central Taiwan. Ecol. Res. 2017, 32, 845–857. [Google Scholar] [CrossRef]
  11. Yuen, J.Q.; Fung, T.; Ziegler, A.D. Carbon stocks in bamboo ecosystems worldwide: Estimates and uncertainties. For. Ecol. Manag. 2017, 393, 113–138. [Google Scholar] [CrossRef]
  12. Düking, R.; Gielis, J.; Liese, W. Carbon flux and carbon stock in a bamboo stand and their relevance for mitigating climate change. J. Am. Bamboo Soc. 2011, 24, 1–7. [Google Scholar]
  13. Zhou, G.; Meng, C.; Jiang, P.; Xu, Q. Review of carbon fixation in bamboo forests in China. Bot. Rev. 2011, 77, 262–270. [Google Scholar] [CrossRef]
  14. Zachariah, E.J.; Sabulal, B.; Nair, D.N.K.; Johnson, A.J.; Kumar, C.S.P. Carbon dioxide emission from bamboo culms. Plant Biol. 2016, 18, 400–405. [Google Scholar] [CrossRef] [PubMed]
  15. Liu, J.; Jiang, P.; Wang, H.; Zhou, G.; Wu, J.; Yang, F.; Qian, X. Seasonal soil CO2 efflux dynamics after land use change from a natural forest to Moso bamboo plantations in subtropical China. For. Ecol. Manag. 2011, 262, 1131–1137. [Google Scholar] [CrossRef]
  16. Hsieh, I.F.; Kume, T.; Lin, M.Y.; Cheng, C.H.; Miki, T. Characteristics of soil CO2 efflux under an invasive species, Moso bamboo, in forests of central Taiwan. Trees 2016, 30, 1749–1759. [Google Scholar] [CrossRef]
  17. Tang, X.; Fan, S.; Qi, L.; Guan, F.; Du, M.; Zhang, H. Soil respiration and net ecosystem production in relation to intensive management in Moso bamboo forests. Catena 2016, 137, 219–228. [Google Scholar] [CrossRef]
  18. Isagi, Y. Carbon stock and cycling in a bamboo Phyllostachys bambusoides stand. Ecol. Res. 1994, 9, 47–55. [Google Scholar] [CrossRef]
  19. Isagi, Y.; Kawahara, T.; Kamo, K.; Ito, H. Net production and carbon cycling in a bamboo Phyllostachys pubescens stand. Plant Ecol. 1997, 130, 41–52. [Google Scholar] [CrossRef]
  20. Kim, M.H.; Nakane, K.; Lee, J.T.; Bang, H.S.; Na, Y.E. Stem/branch maintenance respiration of Japanese red pine stand. For. Ecol. Manag. 2007, 243, 283–290. [Google Scholar] [CrossRef]
  21. Harris, N.L.; Hall, C.A.S.; Lugo, A.E. Estimates of species- and ecosystem-level respiration of woody stems along an elevational gradient in the Luquillo Mountains, Puerto Rico. Ecol. Model. 2008, 216, 253–264. [Google Scholar] [CrossRef]
  22. Robertson, A.L.; Malhi, Y.; Farfan-Amezquita, F.; Aragão, L.E.O.C.; Silva Espejo, J.E.; Robertson, M.A. Stem respiration in tropical forests along an elevation gradient in the Amazon and Andes. Glob. Chang. Biol. 2010, 16, 3193–3204. [Google Scholar] [CrossRef]
  23. Zhao, K.; Dong, B.; Jia, Z.; Ma, L. Effect of climatic factors on the temporal variation of stem respiration in Larix principis-rupprechtii Mayr. Agric. For. Meteorol. 2018, 248, 441–448. [Google Scholar] [CrossRef]
  24. Damesin, C.; Ceschia, E.; Le Goff, N.; Ottorini, J.M.; Dufrêne, E. Stem and branch respiration of beech: From tree measurements to estimations at the stand level. New Phytol. 2002, 153, 159–172. [Google Scholar] [CrossRef]
  25. Inoue, A.; Sakamoto, M. Comparison of the methods for quantifying the culm surface area for bamboo, Phyllostachys pubescens. Ecol. Res. 2017, 32, 445–450. [Google Scholar] [CrossRef]
  26. Gavrikov, V.L. Stem Surface Area in Modeling of Forest Stands; Springer: Cham, Switzerland, 2017. [Google Scholar]
  27. Inoue, A. Relationships of stem surface area to other stem dimensions for Japanese cedar (Cryptomeria japonica D. Don) and Japanese cypress (Chamaecyparis obtusa Endl.) trees. J. For. Res. 2004, 9, 45–50. [Google Scholar] [CrossRef]
  28. Pokorný, R.; Tomásková, I. Allometric relationships for surface area and dry mass of young Norway spruce aboveground organs. J. For. Sci. 2007, 53, 548–554. [Google Scholar] [CrossRef]
  29. Brantley, S.T.; Schulte, M.L.; Bolstad, P.V.; Miniat, C.F. Equations for estimating biomass, foliage area, and sapwood of small trees in the southern Appalachians. For. Sci. 2016, 62, 414–421. [Google Scholar] [CrossRef]
  30. Coletta, V.; Menguzzato, G.; Pellicone, G.; Veltri, A.; Marziliano, P.A. Effect of thinning on above-ground biomass accumulation in a Douglas-fir plantation in southern Italy. J. For. Res. 2016, 27, 1313–1320. [Google Scholar] [CrossRef]
  31. Marziliano, P.A.; Lafortezza, R.; Medicamento, U.; Lorusso, L.; Giannico, V.; Colangelo, C.; Sanesi, G. Estimating belowground biomass and root/shoot ratio of Phillyrea latifolia L. in the Mediterranean forest landscapes. Ann. For. Sci. 2015, 72, 585–593. [Google Scholar] [CrossRef]
  32. Nath, A.J.; Das, G.; Das, A.K. Above ground standing biomass and carbon storage in village bamboos in North East India. Biomass Bioenergy 2009, 33, 1188–1196. [Google Scholar] [CrossRef]
  33. Inoue, A.; Sakamoto, S.; Suga, H.; Kitahara, F. Estimation of culm volume for bamboo, Phyllostachys bambusoides, by two-way volume equation. Biomass Bioenergy 2011, 35, 2666–2673. [Google Scholar] [CrossRef]
  34. Inoue, A.; Sakamoto, S.; Kitazato, H.; Sakuta, K. Development of two-way volume equation for bamboo, Phyllostachys nigra. J. For. Plan. 2012, 18, 13–19. [Google Scholar] [CrossRef]
  35. Inoue, A.; Sakamoto, S.; Suga, H.; Kitazato, H.; Sakuta, K. Construction of one-way volume table for the three major useful bamboos in Japan. J. For. Res. 2013, 18, 323–334. [Google Scholar] [CrossRef]
  36. Suga, H.; Inoue, A.; Kitahara, F. Derivation of two-way volume equation for bamboo, Phyllostachys pubescens. J. For. Res. 2011, 16, 261–267. [Google Scholar] [CrossRef]
  37. Yuen, J.Q.; Fung, T.; Ziegler, A.D. Review of allometric equations for major land cover in SE Asia: Uncertainly and implications for above- and below-ground carbon estimates. For. Ecol. Manag. 2016, 360, 323–340. [Google Scholar] [CrossRef]
  38. Singnar, P.; Das, M.C.; Sileshi, G.W.; Brahma, B.; Nath, A.J.; Das, A.K. Allometric scaling, biomass accumulation and carbon stocks in different aged stands of thin-walled bamboos Schizostachyum dullooa, Pseudostachyum polymorphum and Melocanna baccifera. For. Ecol. Manag. 2017, 395, 81–91. [Google Scholar] [CrossRef]
  39. Inoue, A.; Suga, H. Relationships of culm surface area to other culm dimensions for bamboo, Phyllostachys pubescens. J. For. Res. 2009, 14, 236–239. [Google Scholar] [CrossRef]
  40. Yen, T.M.; Lee, J.S. Comparing aboveground carbon sequestration between moso bamboo (Phyllostachys heterocycla) and China fir (Cunninghamia lanceolata) forests based on the allometric model. For. Ecol. Manag. 2011, 261, 995–1002. [Google Scholar] [CrossRef]
  41. Uchimura, E. Utilization of Bamboo Resources into Modern Days; Soshinsya: Tokyo, Japan, 2009. (In Japanese) [Google Scholar]
  42. FAO. Global Forest Resources Assessment 2010: Main Report; FAO: Rome, Italy, 2010. [Google Scholar]
  43. Uchimura, E. A Flora of Bamboo Resources; Soshinsya: Tokyo, Japan, 2012. (In Japanese) [Google Scholar]
  44. Takano, K.T.; Hibino, K.; Numata, A.; Oguro, M.; Aiba, M.; Shiogama, H.; Takayabu, I.; Nakashizuka, T. Detecting latitudinal and altitudinal expansion of invasive bamboo Phyllostachys edulis and Phyllostachys bambusoides (Poaceae) in Japan to project potential habitats under 1.5 °C–4.0 °C global warming. Ecol. Evol. 2017, 7, 9848–9859. [Google Scholar] [CrossRef] [PubMed]
  45. Japan Meteorological Agency. Archives of the Past Meteorological Data (In Japanese). Available online: http://www.data.jma.go.jp/obd/stats/etrn/index.php (accessed on 31 March 2018).
  46. Ministry of Land, Infrastructure and Transport. National Land Policy (In Japanese). Available online: http://www.mlit.go.jp/kokudoseisaku/index.html (accessed on 16 May 2018).
  47. Inoue, A.; Tochihara, S.; Sato, M.; Shima, H. Universal node distribution in three bamboo species (Phyllostachys spp.). Trees 2017, 31, 1271–1278. [Google Scholar] [CrossRef]
  48. Zhao, H.L.; Denich, M.; Borsch, T. Growth behavior of Phyllostachys nigra var. henonis (Bambusoideae) in Central China. J. For. Res. 2005, 16, 163–168. [Google Scholar] [CrossRef]
  49. Gratani, L.; Crescente, M.F.; Varone, L.; Fabrini, G.; Digiulio, E. Growth pattern and photosynthetic activity of different bamboo species growing in the Botanical Garden of Rome. Flora 2008, 203, 77–84. [Google Scholar] [CrossRef]
  50. Ahmad, M.; Kamke, F.A. Analysis of Calcutta bamboo for structural composite materials: Physical and mechanical properties. Wood Sci. Technol. 2005, 39, 448–459. [Google Scholar] [CrossRef]
  51. Wang, X.; Ren, H.; Zhang, B.; Fei, B.; Burgert, I. Cell wall structure and formation of maturing fibers of moso bamboo (Phyllostachys pubescens) increase buckling resistance. J. R. Soc. Interface 2011, 9, 988–996. [Google Scholar] [CrossRef] [PubMed]
  52. Kleinn, C.; Morales-Hidalgo, D. An inventory of Guadua (Guadua angustifolia) bamboo in the coffee region of Colombia. Eur. J. For. Res. 2006, 125, 361–368. [Google Scholar] [CrossRef]
  53. Inoue, A.; Shimada, M.; Sato, M.; Shima, H. Estimation of culm volume reduction factor in five bamboo species (Phyllostachys spp.). J. For. Res. 2018, 29. in press. [Google Scholar]
  54. Aoki, T. On the volume table of Madake (Phyllostachys reticulate C. Koch) stem. Rep. Kyushu Univ. For. 1955, 5, 49–82, (In Japanese with English Summary). [Google Scholar]
  55. Inoue, A.; Kunisaki, T.; Kitahara, F.; Suga, H. Modeling height-diameter relationship for bamboo, Phyllostachys bambusoides. Bamboo J. 2011, 28, 1–9. [Google Scholar]
  56. Sharma, R.P.; Vacek, Z.; Vacek, S. Modeling individual tree height to diameter ratio for Norway spruce and European beech in Czech Republic. Trees 2016, 30, 1969–1982. [Google Scholar] [CrossRef]
  57. Inoue, A. A model for the relationship between form-factors for stem volume and those for stem surface area in coniferous species. J. For. Res. 2006, 11, 289–294. [Google Scholar] [CrossRef]
  58. R Core Team. R: A Language and Environment for Statistical Computing; The R Foundation for Statistical Computing: Vienna, Austria, 2018; Available online: http://www.R-project.org/ (accessed on 31 March 2018).
  59. Liu, G.; Shi, P.; Xu, Q.; Dong, X.; Wang, F.; Wang, G.G.; Hui, C. Does the size-density relationship developed for bamboo species conform to the self-thinning rule? For. Ecol. Manag. 2016, 361, 339–345. [Google Scholar] [CrossRef]
  60. Hunter, M.O.; Keller, M.; Victoria, D.; Morton, D.C. Tree height and tropical forest biomass estimation. Biogeosciences 2013, 10, 8385–8399. [Google Scholar] [CrossRef]
  61. Berger, A.; Gschwantner, T.; McRoberts, R.E.; Schadauer, K. Effects of measurement errors on individual tree stem volume estimates for the Austrian national forest inventory. For. Sci. 2014, 60, 14–24. [Google Scholar] [CrossRef]
  62. Mason, N.W.H.; Beets, P.N.; Payton, I.; Burrows, L.; Holdaway, R.J.; Carswell, F.E. Individual-based allometric equations accurately measure carbon storage and sequestration in shrublands. Forests 2014, 5, 309–324. [Google Scholar] [CrossRef]
Figure 1. Relationship between culm surface area and diameter at breast height for each species and site. The solid lines represent the power equations detailed in Table 3.
Forests 09 00295 g001
Figure 2. Relationship between culm surface area and product of diameter at breast height and total culm length for each species and site. The solid lines represent the linear equations detailed in Table 3.
Forests 09 00295 g002
Figure 3. Relationship between culm surface area and diameter at breast height in (a) Phyllostachys bambusoides and (b) P. nigra. The solid lines represent the power equations detailed in Table 3.
Forests 09 00295 g003
Figure 4. Relationships between culm surface area and product of diameter at breast height and total culm length in (a) Phyllostachys bambusoides and (b) P. nigra. The solid lines represent the linear equations detailed in Table 3.
Forests 09 00295 g004
Figure 5. Relationships of culm surface area to (a) diameter at breast height and (b) product of diameter at breast height and total culm length for Phyllostachys bambusoides and P. nigra. The solid lines represent the power and linear equations detailed in Table 3.
Forests 09 00295 g005
Figure 6. Relationships of culm surface area to (a) diameter at breast height and (b) product of diameter at breast height and total culm length for three Phyllostachys species. The solid lines represent the power and linear equations detailed in Table 3.
Forests 09 00295 g006
Figure 7. Comparisons of (a) height-diameter ratio and (b) breast height form-factor for each species and site. Error bars indicate the standard deviation. Values labeled with the same lower case letter are not significantly different according to Tukey’s HSD test.
Forests 09 00295 g007
Table 1. Dendrometric parameters of sample culms (n = 890).
SpeciesSite 1Number of Samples 2Soil Type 3Total Culm Height (m) 4Diameter at Breast Height (cm) 4Culm Surface Area (m2) 4
P. pubescensTO200 (100)Ando soil14.1 ± 2.59.2 ± 2.72.46 ± 1.01
P. bambusoidesTO200 (100)Ando soil11.1 ± 3.05.0 ± 1.71.26 ± 0.70
KI102 (51)Brown forest soil or ando soil12.8 ± 3.46.2 ± 2.11.77 ± 1.00
FU122 (61)Brown forest soil or ando soil11.8 ± 2.55.7 ± 1.71.50 ± 0.81
HI96 (48)Brown forest soil or ando soil9.0 ± 2.14.1 ± 1.20.87 ± 0.46
P. nigraMU60 (30)Brown forest soil7.3 ± 2.02.9 ± 1.10.50 ± 0.30
IT110 (55)Gley soil or brown forest soil6.2 ± 1.52.7 ± 0.80.37 ± 0.19
1 TO: Toshima, KI: Kitakyushu, FU: Fukuoka, HI: Hisayama, MU: Munakata, IT: Ito; 2 Values in parentheses are sample sizes of modeling and validation data; 3 The soil type classification is based on website information [46]; 4 Average ± S.D.
Table 2. Explanation of the allometric equations developed in this study.
EquationSpeciesSite 1Number of Samples 2
Site-specificP. bambusoidesTO200
KI102
FU122
HI96
P. nigraMU60
IT110
Species-specificP. pubescensTO200
P. bambusoidesTO, KI, FU and HI520
P. nigraMU and IT170
CommonP. bambusoides and P. nigraTO, KI, FU, HI, MU and IT690
GenericP. pubescens, P. bambusoides and P. nigraTO, KI, FU, HI, MU and IT890
1 TO: Toshima, KI: Kitakyushu, FU: Fukuoka, HI: Hisayama, MU: Munakata, IT: Ito; 2 The number of sample culms used for both modeling and validation data.
Table 3. Parameter estimates of the developed allometric equations and their fit statistics.
EquationSpeciesSite 1Power EquationLinear Equation
αβr2RMSE (m2)AICγr2RMSE (m2)AIC
Site-specificP. bambusoidesTO159.031.650.970.155−83.252.080.990.051−306.68
KI178.441.680.990.147−46.262.040.990.073−120.05
FU184.191.700.980.089−115.352.070.990.068−150.95
HI242.781.780.980.073−106.072.230.990.055−136.63
P. nigraMU143.521.630.970.060−79.962.140.990.025−134.44
IT263.161.830.940.039−191.732.120.990.011−322.93
Species-specificP. pubescens 83.211.490.980.174−58.681.800.990.101−168.49
P. bambusoides 179.501.690.980.131−315.582.070.990.069−649.89
P. nigra 239.911.790.950.051−260.282.130.990.017−441.90
CommonP. bambusoides and P. nigra 187.661.700.980.118−495.652.080.990.061−950.25
GenericAll species 116.011.570.970.294−3.271.920.980.142−471.77
1 TO: Toshima, KI: Kitakyushu, FU: Fukuoka, HI: Hisayama, MU: Munakata, IT: Ito.
Table 4. Accuracy (%AE) and precision (%RMSE) of the culm surface area estimated by the developed allometric equations.
EquationSpeciesSite 1Power EquationLinear Equation
%AE (%)%RMSE (%)%AE (%)%RMSE (%)
Site-specificP. bambusoidesTO−1.4512.04−0.554.04
KI2.066.17−1.952.73
FU−0.437.91−1.175.54
HI0.959.441.127.86
P. nigraMU−1.9412.76−1.733.80
IT−3.0911.06−1.313.33
Species-specificP. pubescensTO0.308.70−0.514.74
P. bambusoidesTO−1.4211.30−0.884.10
KI0.055.78−0.283.16
FU0.918.03−1.215.53
HI0.739.19−5.779.94
P. nigraMU−10.4514.47−2.153.99
IT0.5111.13−0.833.41
CommonP. bambusoidesTO−2.3211.41−0.804.08
KI−0.465.91−0.203.21
FU0.318.13−1.135.56
HI−0.489.25−5.709.89
P. nigraMU−3.2811.17−4.766.01
IT9.0814.06−3.474.01
GenericP. pubescensTO16.5421.755.818.41
P. bambusoidesTO−8.3919.40−8.4810.30
KI−9.5915.81−7.927.77
FU−8.3214.42−8.789.06
HI−4.6214.10−12.9916.34
P. nigraMU−2.2815.18−12.1214.02
IT−10.9813.13−10.9411.37
1 TO: Toshima, KI: Kitakyushu, FU: Fukuoka, HI: Hisayama, MU: Munakata, IT: Ito.

