Article

Variation in Soil Methane Fluxes and Comparison between Two Forests in China

1
Center for Ecological Forecasting and Global Change, College of Forestry, Northwest A&F University, No.3 Taicheng Rd., Yangling 712100, China
2
Department of Biology Sciences, Institute of Environment Sciences, University of Quebec at Montreal, P.O. Box 8888, Station Centre-Ville, Montreal, QC H3C 3P8, Canada
3
Research Institute of Forest Ecology, Environment and Protection, Chinese Academy of Forestry, Wan Shou Shan, Beijing 100091, China
4
Baotianman Natural Reserve Administration, Neixiang 474350, China
*
Author to whom correspondence should be addressed.
Forests 2018, 9(4), 204; https://doi.org/10.3390/f9040204
Submission received: 23 January 2018 / Revised: 26 March 2018 / Accepted: 5 April 2018 / Published: 13 April 2018
(This article belongs to the Section Forest Ecophysiology and Biology)

Abstract

:
Methane (CH4) is a vital greenhouse gas with a 28-fold higher global warming potential than carbon dioxide when considering a molar basis for the time horizon of 100 years. Here, we investigated the variation of soil CH4 fluxes, soil physiochemical properties, and CH4-related bacteria community composition of two forests in China. We measured CH4 fluxes using static chambers and analyzed soil bacterial communities using next-generation high-throughput sequencing in a temperate broad-leaved deciduous forest at Baotianman Nature Reserve (TBDF-BTM) and a tropical rainforest at Jianfengling National Natural Reserve (TRF-JFL). Our results showed that the soils from both sites were CH4 sinks. Significant variation in soil CH4 fluxes was found at TBDF-BTM exclusively, while no seasonal variation in the CH4 uptake was observed at TRF-JFL. The CH4 fluxes at TBDF-BTM were substantially higher than those at TRF-JFL during all seasons. One genus of methanotrophs and three genera of methylotrophs were detected at both sites, though they had no direct relationship with soil CH4 fluxes. Water-filled pore space and soil total carbon content are the main factors controlling the soil CH4 fluxes at TBDF-BTM. At TRF-JFL, the soil CH4 fluxes showed no significant correlations with any of the soil properties. This study improves our understanding of soil CH4 fluxes and their influencing factors in forests in different climatic zones and provides a reference for future investigation of forest soil CH4 fluxes, the forest ecosystem carbon cycle, and the forest CH4 model.

Graphical Abstract

1. Introduction

Methane (CH4) is a major greenhouse gas. Although CH4 occurs at lower concentrations than carbon dioxide (CO2) in the atmosphere, the former has a 28-fold higher global warming potential than the latter when compared on a molar basis for the time horizon of 100 years [1]. CH4 contributes to 20% of the global greenhouse effect [2]. Well-aerated forest soils are known to be significant global carbon sinks for mitigating the atmospheric CH4 [3,4]. The annual CH4 uptake of soil in the world is 26–36 Tg·a−1, among which forest soil accounts for 52% [5,6]. China has a large forest area of 2.08 × 10⁸ hm2, covering 22% of the total area of the country, which has a huge potential for CH4 uptake [7,8]. The annual CH4 uptake of forest soils in China is 0.675 Tg·a−1, with Chinese forest soil methane uptake representing about 3.6–5% of the global CH4 sink [7,8]. Wang et al. calculated the mean CH4 flux from forests in China, which is comparable with CH4 uptake rates by other forests in the world [9,10,11]. It is generally believed that the dynamic changes in the CH4 uptake of forest soil are one of the important factors affecting the changes in atmospheric CH4 concentration [4].
Changes in CH4 fluxes of forest soil are influenced by multiple factors, such as soil water content [12,13] and soil temperature [14,15]. Soil water content is a key driver of CH4 fluxes in forest soils, as it limits the diffusive transport of gases in the soil [16]. The effect of water content on CH4 consumption typically follows a parabolic curve in soils, with reduced rates under the conditions of low or high water content [17,18,19,20]. Another important environmental driver of CH4 flux in soils is soil temperature [21]. However, results about the influence of temperature on CH4 flux are not consistent [22,23,24,25,26,27]. In addition to soil moisture and temperature, pH [28], organic matter content [29], nitrogen availability [30,31] also affect CH4 fluxes.
In addition to the numerous abiotic factors listed above, biological factors also affect CH4 emission and consumption. CH4 is produced by methanogens under anaerobic conditions and oxidized by methanotrophs under aerobic conditions [31]. Therefore, CH4 fluxes have been shown to be closely associated with the community composition [32,33,34], abundance, and activity [35] of both methanogens and methanotrophs [36]. Methylotrophs cannot consume CH4 directly but can make use of oxidized products of CH4 (e.g., methanol and formaldehyde) and are therefore considered important in CH4 removal processes in natural environments [36].
Methanotrophs are classified into three types (I, II, and X) on the basis of the type of the unique enzymes of methane monooxygenases (MMOs) they contain [37]. Methanotrophs can also be divided into ‘high-affinity’ or ‘low affinity’ groups based on their activity. The ‘low affinity’ methanotrophs are adapted for growth at high CH4 concentrations (several thousand ppm in air), such as those arising from wetlands, lakes, and rice paddies [38]. The ‘high affinity’ methanotrophs can make use of the trace amounts of methane (around 1.8 ppm) in the atmosphere (i.e., in forest soils) [39,40]. Type I methanotrophs have been grouped into the ‘low affinity’ group and are prevalent in CH4-rich and poorly aerated environments, while type II ‘high-affinity’ are predominant in CH4-poor and well aerated environments such as Methylosinus and Methylocystis [41]. From the perspective of phylogeny, the type I methanotrophs belong to γ-Proteobacteria, and the type II methanotrophs to α-Proteobacteria. Although the type X species also belong to the γ-Proteobacteria, they are distinct from the group of type I methanotrophs. The type I and type X methanotrophs are both in the family Methylococcaceae. It seems that within the α- and γ-Proteobacteria, they are related to methane oxidation [42]. A species of type II methanotroph Methylocystis bryophila exhibited the highest methanol production [37]. The culture-independent studies of methanotrophic communities of soils with high-affinity methane oxidation capacity have showed their presence and a correspondingly frequent superiority of methanotrophs from the novel phylogenetic pmoA gene from α-proteobacteria and γ-proteobacteria named upland soil cluster (USCα) and USC-gamma (USCγ) [43,44]. The USCα bacteria are related to Methylocapsa acidiphila [45] and the USCγ bacteria are distantly related to Methylococcaceae [43].
The Baotianman Nature Reserve (BTM) and the Jianfengling National Natural Reserve (JFL) represent the typical temperate and tropical forests, respectively, and provide ideal places to study the ecological function in temperate and tropical forests in China. Previous research at the temperate broad-leaved deciduous forest (TBDF)-BTM has mainly investigated litter decomposition [46,47], biomass carbon storage [48], spatial variability of temperature sensitivity [49], soil respiration [50,51], and nutrient resorption [52]. Research at the tropical rainforest (TRF)-JFL has generally focused on soil respiration [53], biomass, and carbon dynamics [54], in addition to N2O fluxes [55]. To date, many previous studies related to CH4 in the temperate and tropical forest ecosystems have mostly concentrated on artificial interference experiment such as fertilizer application, increases of temperatures, indoor control culture experiment, and the comparison of soil CH4 fluxes under different forest ages. There are many published reports on CH4 fluxes and their influencing factors, such as the soil physiochemical properties and microbial communities associated with CH4 dynamics in different forest types without human disturbances, but there have not been published reports within the TBDF-BTM and TRF-JFL.
In the present study, we analyzed the temporal and spatial dynamics of CH4 flux and the relevant differences between different forest sites and the relationship with important biotic and abiotic controls. Considering the differences in climatic factors, soil physical, and chemical properties, and the possible differences in microbial community at both TBDF-BTM and TRF-JFL, we hypothesized that there would be significant differences in the CH4 flux between two sites.

2. Materials and Methods

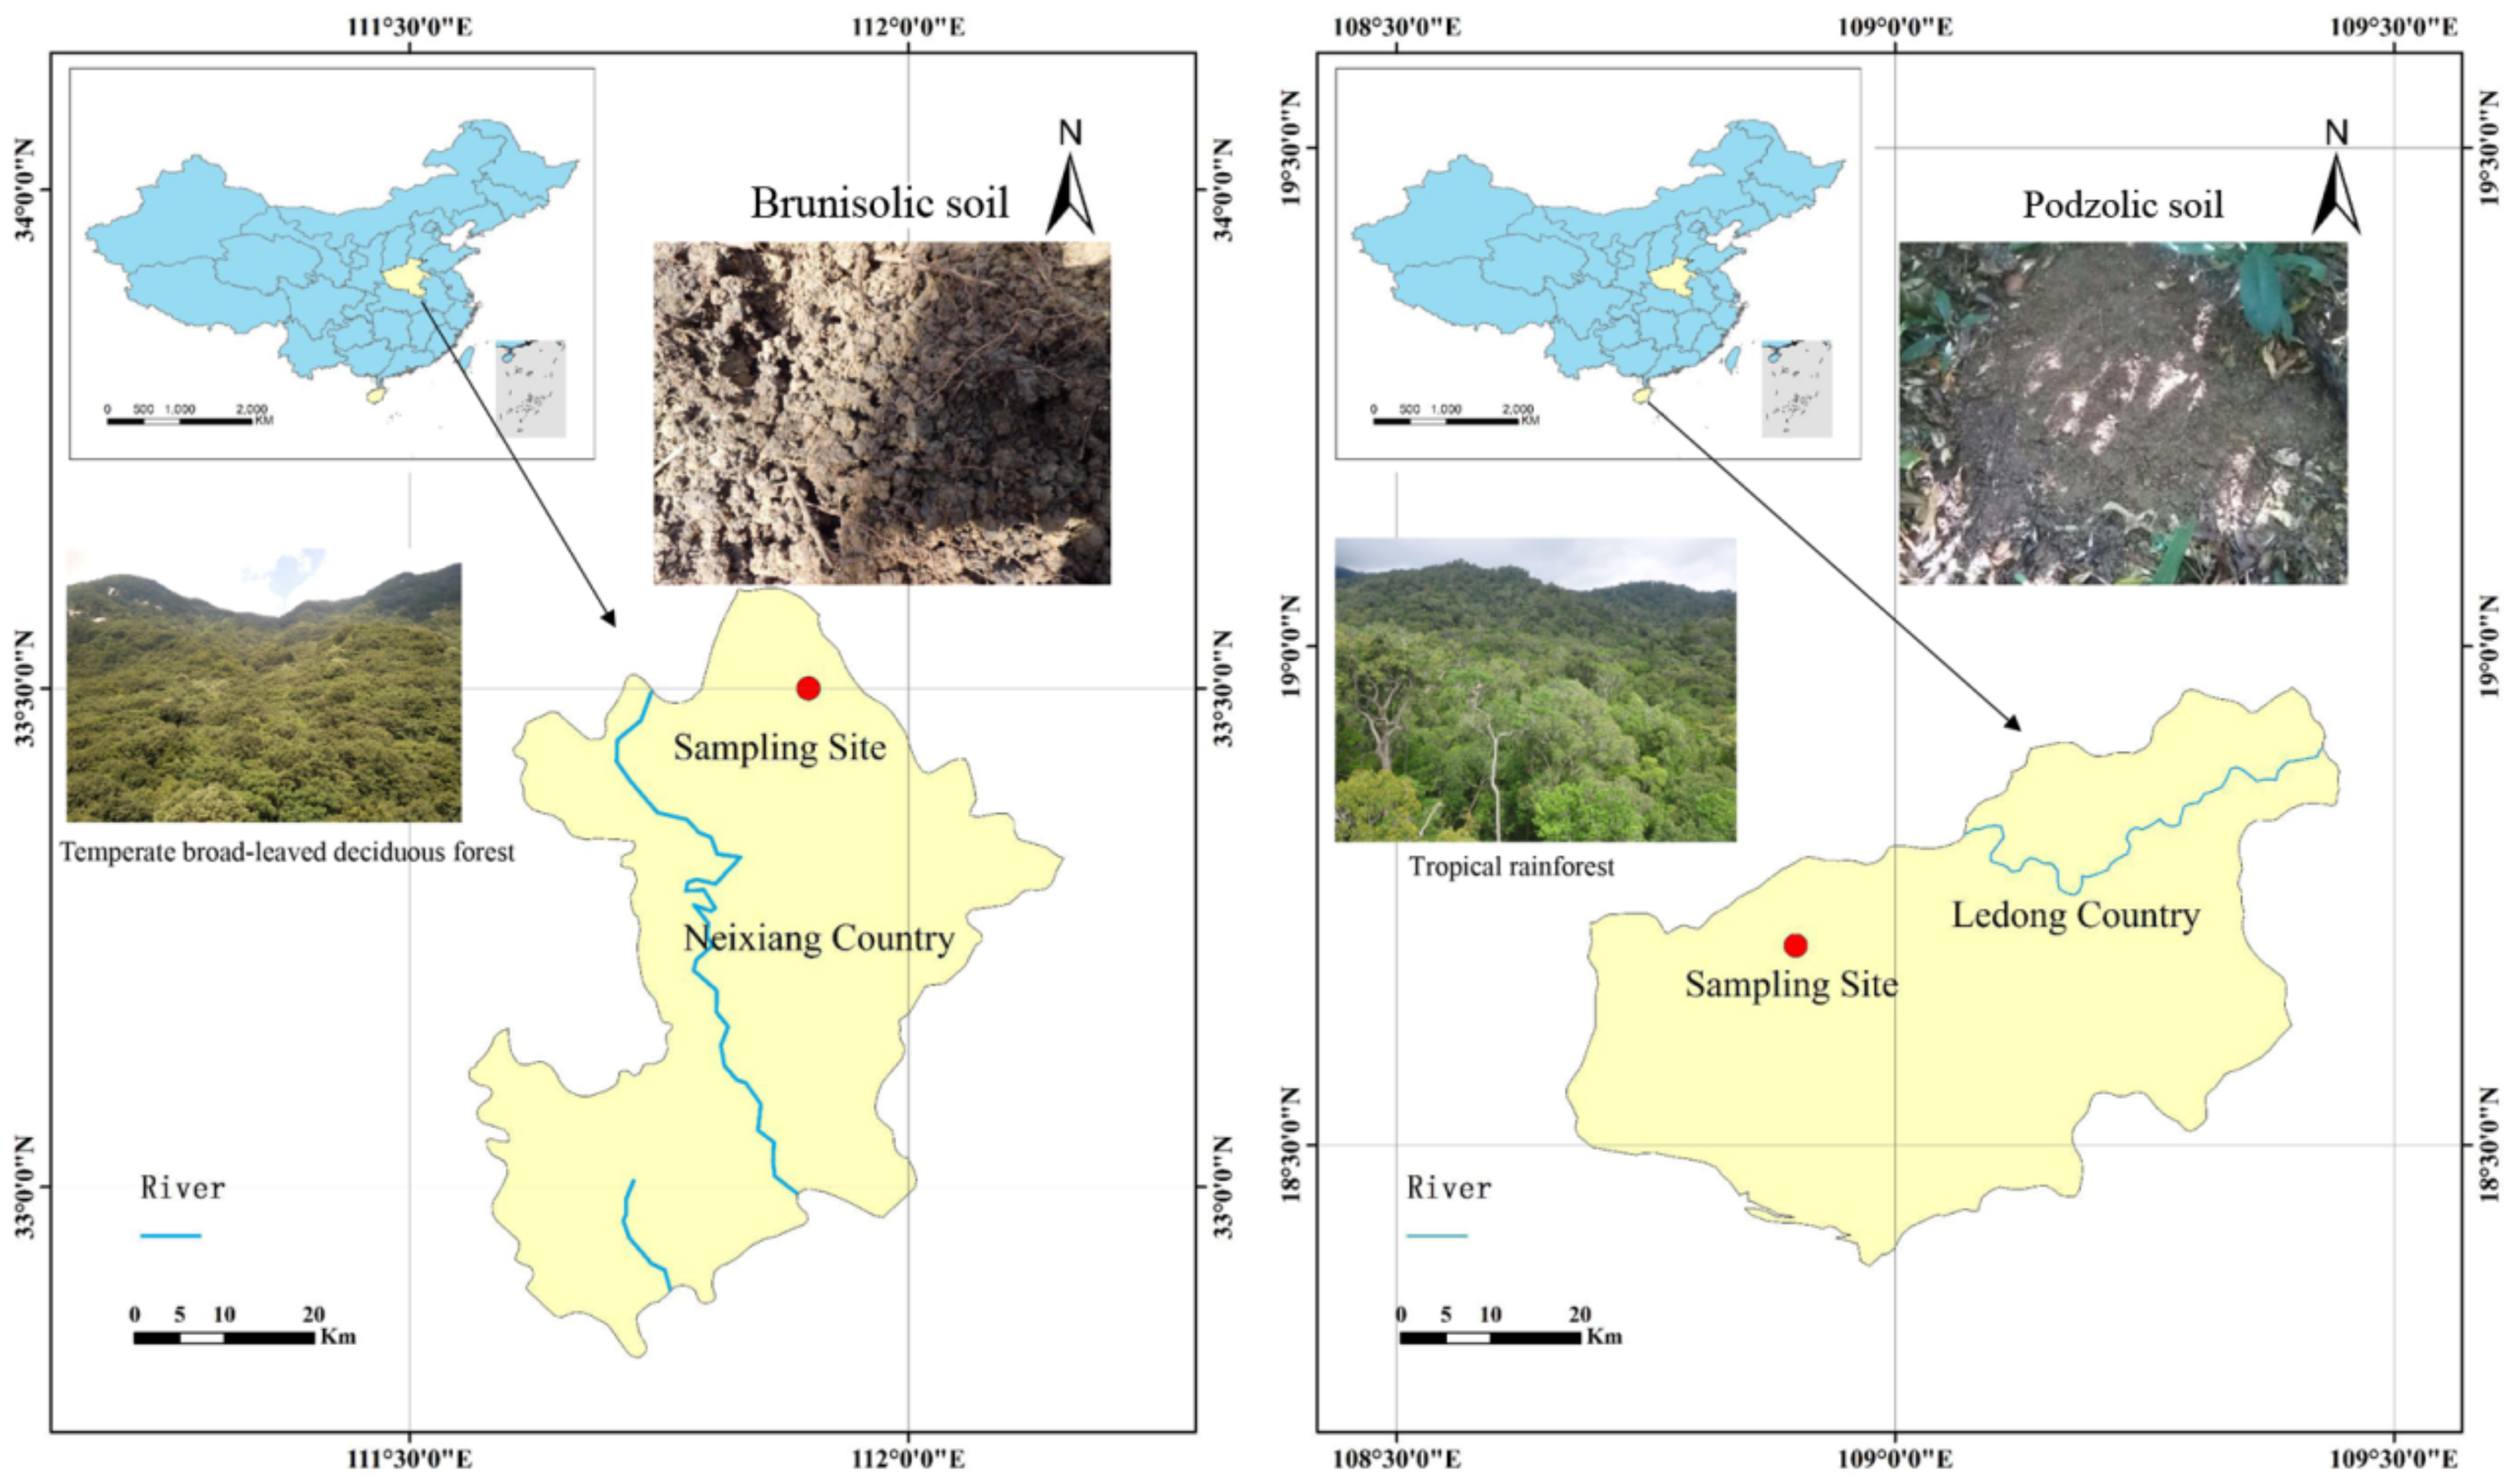
2.1. Site Description

This study was conducted in two forest sites in national natural reserves in China. The temperate broad-leaved deciduous forest at Baotianman Nature Reserve (TBDF-BTM) (33°20′–33°36′ N, 111°47′–112°04′ E) is located in the southwest of Henan Province, east of Qinling Mountains and on the southern slope of the Funiu Mountains (Figure 1). Baotianman Nature Reserve is located between a northern subtropical climate and a warm temperate climate [56], where the deciduous broad-leaved forest ecosystems are considered to be more sensitive to disturbances and susceptible to climate changes, especially global warming [57]. TBDF-BTM has a continental monsoon climate with four distinctive seasons. The mean annual precipitation is 885.6 mm (60% from July–August) and the mean annual air temperature is 15.1 °C [51]. Our study sites were selected in a Quercus acutidentata (Maxim. ex Wenz.) Koidz. natural secondary forest (20 m × 20 m) in the vicinity of a flux tower at TBDF-BTM. The dominant tree species are Quercus aliena var. acuteserrata Maxim., Q. glandulifera var. brevipetiolata (A.DC.) Nakai, Q. variabilis Blume, Carpinus cordata Blume, Cornus controversa Hemsl, and Tilia americana L. [46,50,51]. The main soil type is brunisolic soil for TBDF-BTM [58].
The tropical rainforest at Jianfengling National Natural Reserve (TRF-JFL) (18°23′–18°52′ N, 108°36′–109°05′ E) is situated on Hainan Island, which is located at the northern edge of tropical Asia and has the best-protected tropical mountain rainforests in China [59] (Figure 1). The TRF-JFL tropical mountain rainforest is located between subtropical evergreen broad-leaved forest and tropical rainforest. TRF-JFL has a tropical monsoon climate with distinct rainy (May–October) and dry (November–April) seasons. The mean annual temperature is 19.8 °C and the mean annual precipitation is 2449 mm [54,55]. More than 80% of the annual precipitation falls during the rainy season. Our study site was selected in a primary rainforest (20 m × 20 m) in the vicinity of a flux tower at TRF-JFL. The dominant trees are Gironniera subaequalis Planch., Cryptocarya chinensis (Hance) Hemsl., Livistona saribus (Lour.) Merr. ex A. Chev., and Mallotus hookerianus (Seem.) Müll. Arg. The dominant herbs are Psychotria rubra (Lour.) Poir. and Prismatomeris connata subsp. hainanensis Y. Z. Ruan. [54,55]. The main soil type is podzolic soil for TRF-JFL [60].

2.2. Measurement of Soil CH4 Fluxes

Soil CH4 fluxes were measured using the static chamber-gas chromatography technique [52]. At each site, five chambers were respectively made of 20 cm internal diameter polyvinylchloride pipes, which consisted of two parts: a base and a chamber. The base was installed approximately 5 cm into the soil. The height of the chamber was 50 cm. There were five replicates of gas samples per month from September 2015 to February 2016 (non-growing season) and twice per month from March to June 2016 (growing season). We collected gas samples with vacuumed 10 mL blood test tubes. Gas samples were collected at intervals of 0, 10, 20, and 30 min after chamber closure. The air temperature inside the chamber at 0 and 30 min was recorded. We did not collect gas samples during rainy or snowy days at TBDF-BTM or during typhoons or rainstorms at TRF-JFL. All the gas samples were sent to the laboratory and analyzed by an Agilent 7890 gas chromatograph (Agilent Technologies, Palo Alto, CA, USA). CH4 fluxes (J) were calculated accounting for air temperature, time, and atmospheric pressure:
J = d C d t P M R T H
where dC/dt is the rate of CH4 concentration change, P is the atmospheric pressure of the study site, M is the molar mass of CH4, T is the absolute temperature at the sampling time, R is the universal gas constant, and H is the chamber height above the soil surface. The units of each measurement were: J, mg·m−2 h−1; dC/dt, ppm·h−1; P, kPa; M, g·mol−1; R, J·mol−1 K−1; T, K; H, m.
The monthly averages were used to estimate the annual gas balances based on chamber flux measurements. To improve the accuracy and avoid the influence of system shifts on the analysis results, before the sample analysis, we used the working standard of the known concentration continuous sample until the analysis results were stable. During the sample analysis, three samples and one work standard were analyzed. We injected 5 mL of gas sample into the gas chromatograph for each sample and a quantitative ring was used to ensure only 1 mL of gas sample flowed to the column.

2.3. Soil Sampling and Analysis

In September and December 2015 and March and June 2016, a total of 20 soil samples (five replicates per season × four seasons) were collected using auger boring at each forest site from 0–10 cm depth below the surface. We did not collect soil samples for the rainy or snowy days at TBDF-BTM or during typhoons or rainstorms at TRF-JFL. The soil samples were transported to the laboratory in an ice box, immediately sieved through a 2 mm mesh to remove stones and coarse roots, and then were divided into three parts through equisection method. One part was stored at −80 °C before DNA extraction. The second part was air dried and stored at room temperature until used for total carbon [53], total nitrogen [54], pH, and water-filled pore space (WFPS) analyses. The third part was stored at 4 °C for microbial biomass carbon (MBC), microbial biomass nitrogen (MBN), ammonium-nitrogen (NH4+-N), nitrate-nitrogen (NO3-N), and dissolved organic carbon (DOC) analyses. This portion of the fresh soil sample was oven dried at 105 °C for 24 h to measure soil water content (WC).
Soil temperature at 10 cm below the surface was monitored by a geothermometer when collecting soil samples. Fresh soil was mixed with deionized water at a mass ratio of 1:2.5 and the pH was measured with a pH meter (PB-10, Sartorius Instruments Inc., Göttingen, Germany). Volumetric soil water content was measured and converted to WFPS using soil porosity data. The water filled pore space (WFPS) was calculated as follows: WFPS = ((gravimetric water content × soil bulk density)/total soil porosity), where soil porosity = 1 − soil bulk density/2.65 (2.65 being the assumed particle density of the soil). MBC, MBN, and total carbon (TC) were analyzed using the chloroform fumigation-extraction method [53,55] on a TOC analyzer (LIQUIC TOCII, Elementar Analysensysteme GmbH, Hanau, Germany). NH4+-N, NO3-N, and DOC were extracted with 2 mol L−1 KCl and their concentrations were analyzed using a continuous-flow analyzer (San++, Skalar, Breda, The Netherlands). The total nitrogen (TN) was detected by the Kjeldahl method [60] using a Kjeltec 8400 Analyzer (FOSS, Hillerød, Denmark). In order to detect the accuracy of TC, WC, T, pH, NH4+-N, NO3-N, MBN, and WFPS, we kept one significant figure, whereas for other physical and chemical factor detections, we kept two significant figures.

2.4. DNA Extraction, Amplification, and Illumina HiSeq Sequencing

Total genomic DNA was extracted from 0.25 g of soil sample using the MoBio PowerSoil® DNA Isolation Kit (Carlsbad, CA, USA), according to the manufacturer’s instructions [61,62]. DNA concentration and purity were monitored on 1% agarose gels. According to the measured concentration, DNA was diluted to 1 μg μL−1 using sterile water [62]. The V3 and V4 regions of bacterial 16S rDNA were amplified with the primer pair 515F/806R and the barcode [56]. Polymerase Chain Reactions (PCRs) with five replicates were performed in 30 µL reactions with 15 µL of Phusion® High-Fidelity PCR Master Mix (New England Biolabs, Ipswich, MA, USA) [63], 0.2 µM forward and reverse primers, and approximately 10 ng of template DNA. Thermal cycling conditions consisted of initial denaturation at 98 °C for 1 min, followed by 30 cycles of denaturation at 98 °C for 10 s, annealing at 50 °C for 30 s, and elongation at 72 °C for 30 s, and a final extension at 72 °C for 5 min. PCR products were purified with a Gene JET Gel Extraction Kit (Thermo Fisher Scientific, Waltham, MA, USA) [64]. Next, 400–450 bp PCR products were selected for analysis of population structure [65]. Library quality was assessed using the Qubit@ 2.0 Fluorometer (Thermo Fisher Scientific, Waltham, MA, USA) and Agilent Bioanalyzer 2100 system (Agilent Technologies, Santa Clara, CA, USA). The library was sequenced on an Illumina HiSeq2500 platform (Illumina Inc., San Diego, CA, USA) and 250 bp paired-end reads were generated [66].

2.5. Bioinformatics Analysis

Sequencing reads were assigned to each sample according to the unique barcode tags. Sequences were analyzed using the QIIME (Quantitative Insights into Microbial Ecology) software package and UPARSE pipeline [59]. The reads were first filtered by QIIME quality filters using the default settings for Illumina processing. Then, the sequences were clustered into operational taxonomical units (OTUs) with a 97% sequence similarity cutoff value. For each OTU, a representative sequence was selected and a taxonomic group was assigned using the SILVA database project (http://www.arb-silva.de). The species richness of each sample was estimated by rarefaction analysis using mothur (http://www.mothur.org/).
Sequence data was deposited at the National Center for Biotechnology Information (NCBI) Sequence Read Archive database (accession number: SRP130793).

2.6. Statistical Analysis

Differences in soil physicochemical properties, CH4 fluxes, and bacterial community composition in each site were tested using the general linear model univariate analysis of variance with repeated measures analysis and Levene’s test for homogeneity of variance. Pearson correlation analysis was used to examine the relationships among CH4 fluxes, methanotrophs, methylotrophs, and soil physicochemical properties for all data from the four seasons at each site. Differences at p < 0.05 level were considered statistically significant. All the analyses were performed using SPSS Statistics version 19.0 (IBM SPSS, Somers, NY, USA). Redundancy analysis (RDA) was used to visualize bacterial communities constrained by environmental factors based on Bray-Curtis distance with ‘vegan’ package in R [67].

3. Results

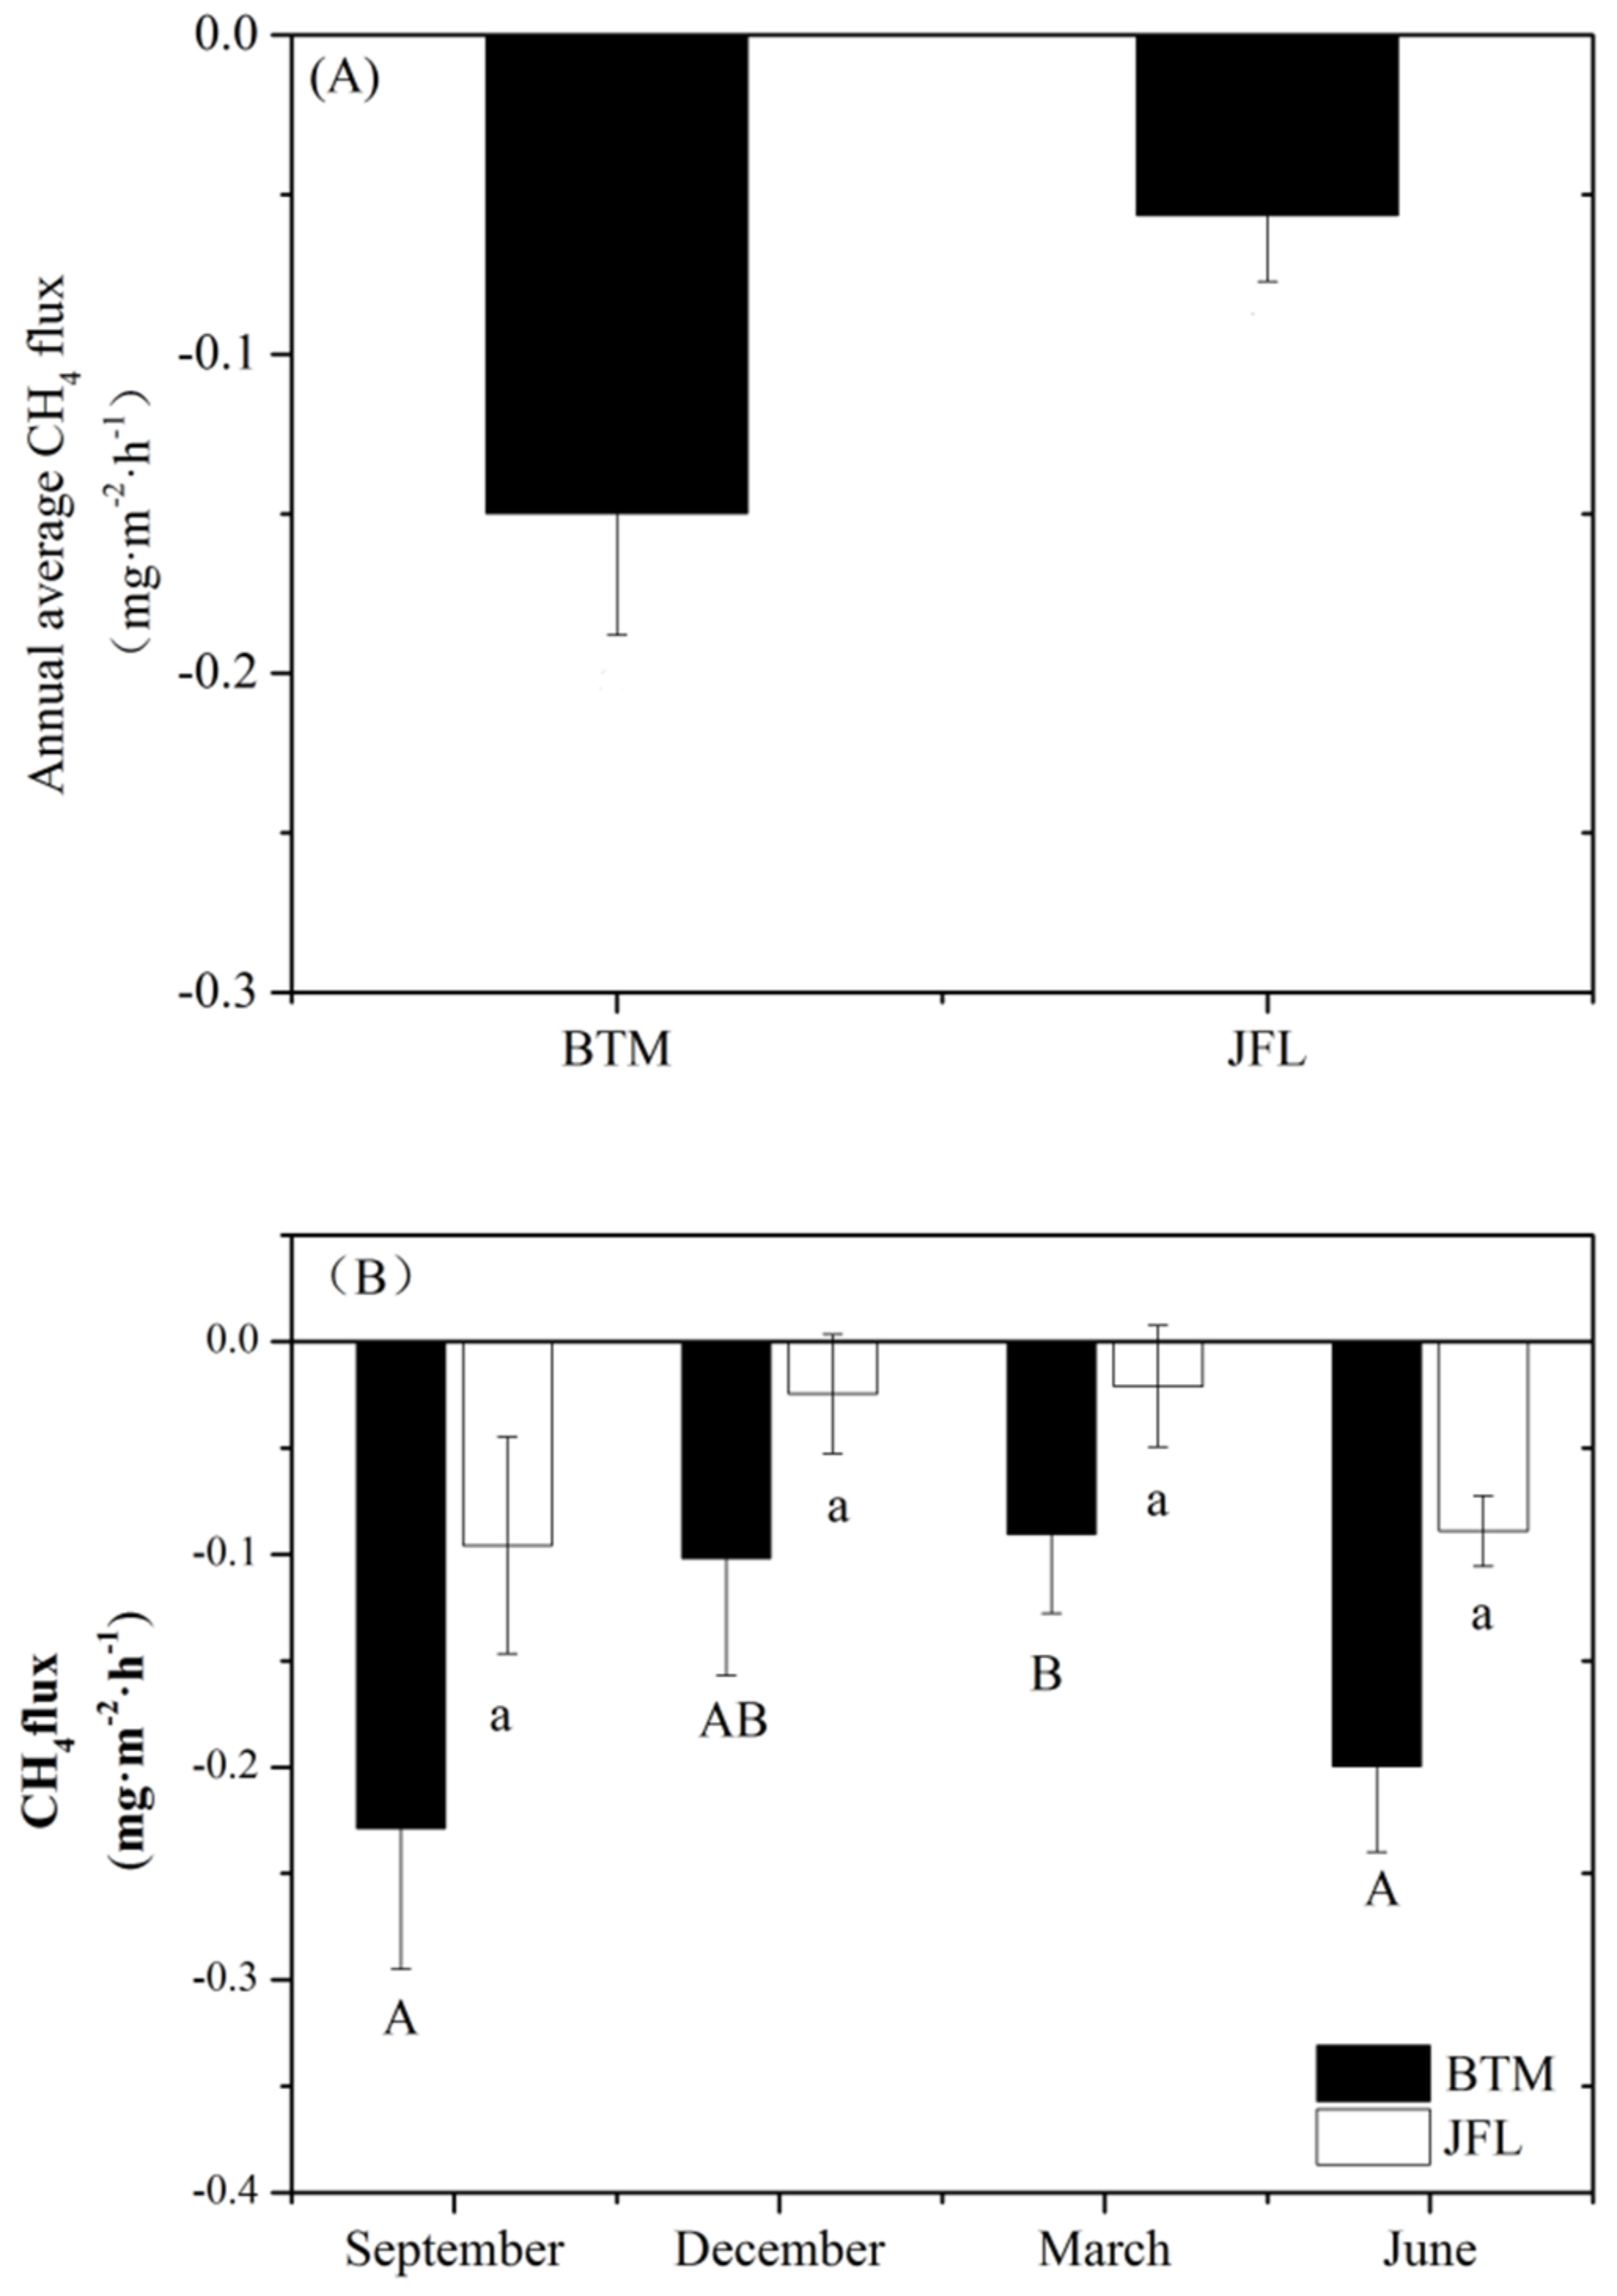
3.1. Soil CH4 Fluxes

The soils at TBDF-BTM and TRF-JFL oxidized CH4 throughout the experimental period, with an annual average CH4 uptake of 13.1 ± 1.8 and 4.9 ± 1.8 kg ha−1 year−1 (0.150 ± 0.02 mg m−2 h−1 and 0.056 ± 0.02 mg m−2 h−1), respectively. The annual average value of CH4 uptake at TBDF-BTM was approximately three times that at TRF-JFL (Figure 2A). The seasonal CH4 fluxes at TBDF-BTM ranged from −0.23 ± 0.07 to −0.07 ± 0.04 mg m−2 h−1; the fluxes at TRF-JFL varied between −0.10 ± 0.05 and −0.02 ± 0.03 mg m−2 h−1. In each season, more CH4 was taken up by soil at TBDF-BTM than at TRF-JFL. At TBDF-BTM, seasonal CH4 fluxes markedly decreased from September 2015 to March 2016 and then increased in the coming growing season (p < 0.01; Figure 2B).

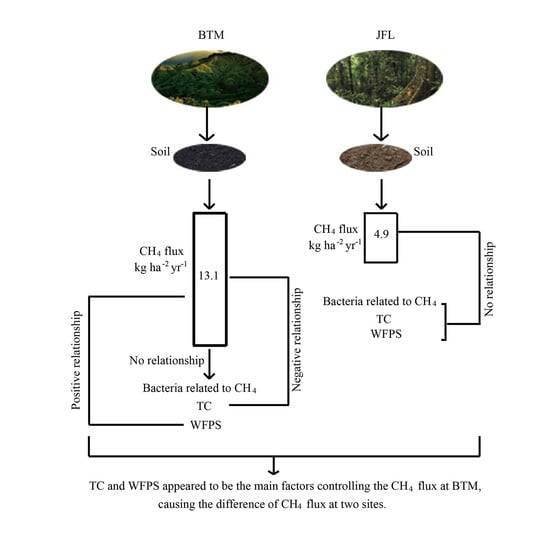
3.2. Correlations between CH4 Fluxes, Soil Properties, and CH4-Related Bacteria

At TBDF-BTM, the CH4 flux was positively correlated with WFPS and negatively correlated with MBC and TC (p < 0.05, Table 1). At TRF-JFL, the CH4 flux had no significant correlation with any of the soil properties (Table 1). There was no significant correlation between CH4 fluxes and methanotroph or methylotroph abundances at the two sites (Table 2). Of the 11 soil physicochemical factors measured at both sites, six factors (WC, DOC, TN, T, pH, and NO3-N) had the most significant effect on the abundance of CH4-related bacteria (p < 0.01, Figure 3). The first axis (RDA1) explained 32.3% of the variation in the relative abundances of methanotrophs and methylotrophs variability. The second axis (RDA2) explained 12.5% of relative abundances of methanotrophs and methylotrophs, for a combined explanation of 44.8%. At TBDF-BTM, the relative abundance of methanotrophs and methylotrophs showed significant correlations with WC, DOC, TN (p < 0.01, Figure 3). At TRF-JFL, T, pH, and NO3-N showed significantly correlated correlations with the relative abundances of methanotrophs and methylotrophs (p < 0.01, Figure 3).

3.3. Soil Properties

The soil properties at the two forest sites are shown in Table 3. At TBDF-BTM, soil water content increased slightly but not significantly from September to December 2015 and then markedly decreased by a total of 47% over the following two seasons. In contrast, soil temperature and pH first decreased from September to December 2015 and then increased from March to June 2016, both of which were the lowest in December 2015 and highest in June 2016. WFPS also reached its highest level in June 2016, which was 62% higher than that in September 2015. Both TC and TN increased from September to December 2015 by 139% and 68%, respectively, and then leveled off in the following two seasons. NH4+-N and NO3-N showed a decreasing trend, while MBC and DOC did not differ significantly throughout the experimental period. MBN markedly increased by 3.9-fold from September to December 2015 and remained at high levels in March 2016, followed by a 56% decrease thereafter.
At TRF-JFL, soil water content remained stable and generally lower than that at TBDF-BTM, while soil temperature fluctuated with season and was much higher than that at TBDF-BTM. The pH first decreased and then increased across the different seasons within a similar range as that at TBDF-BTM. WFPS and DOC significantly decreased from September 2015 to March 2016 and then increased slightly; both parameters were lower than those at TBDF-BTM, except for WFPS in September 2015. TC showed an increasing trend and was generally higher than that at TBDF-BTM, except for December 2015. TN was lower than that at TBDF-BTM, while NH4+-N and NO3-N were generally higher. MBC and MBN were the largest in December 2015 and March 2016, respectively, compared with the other seasons, and showed similar concentrations between the two sites.

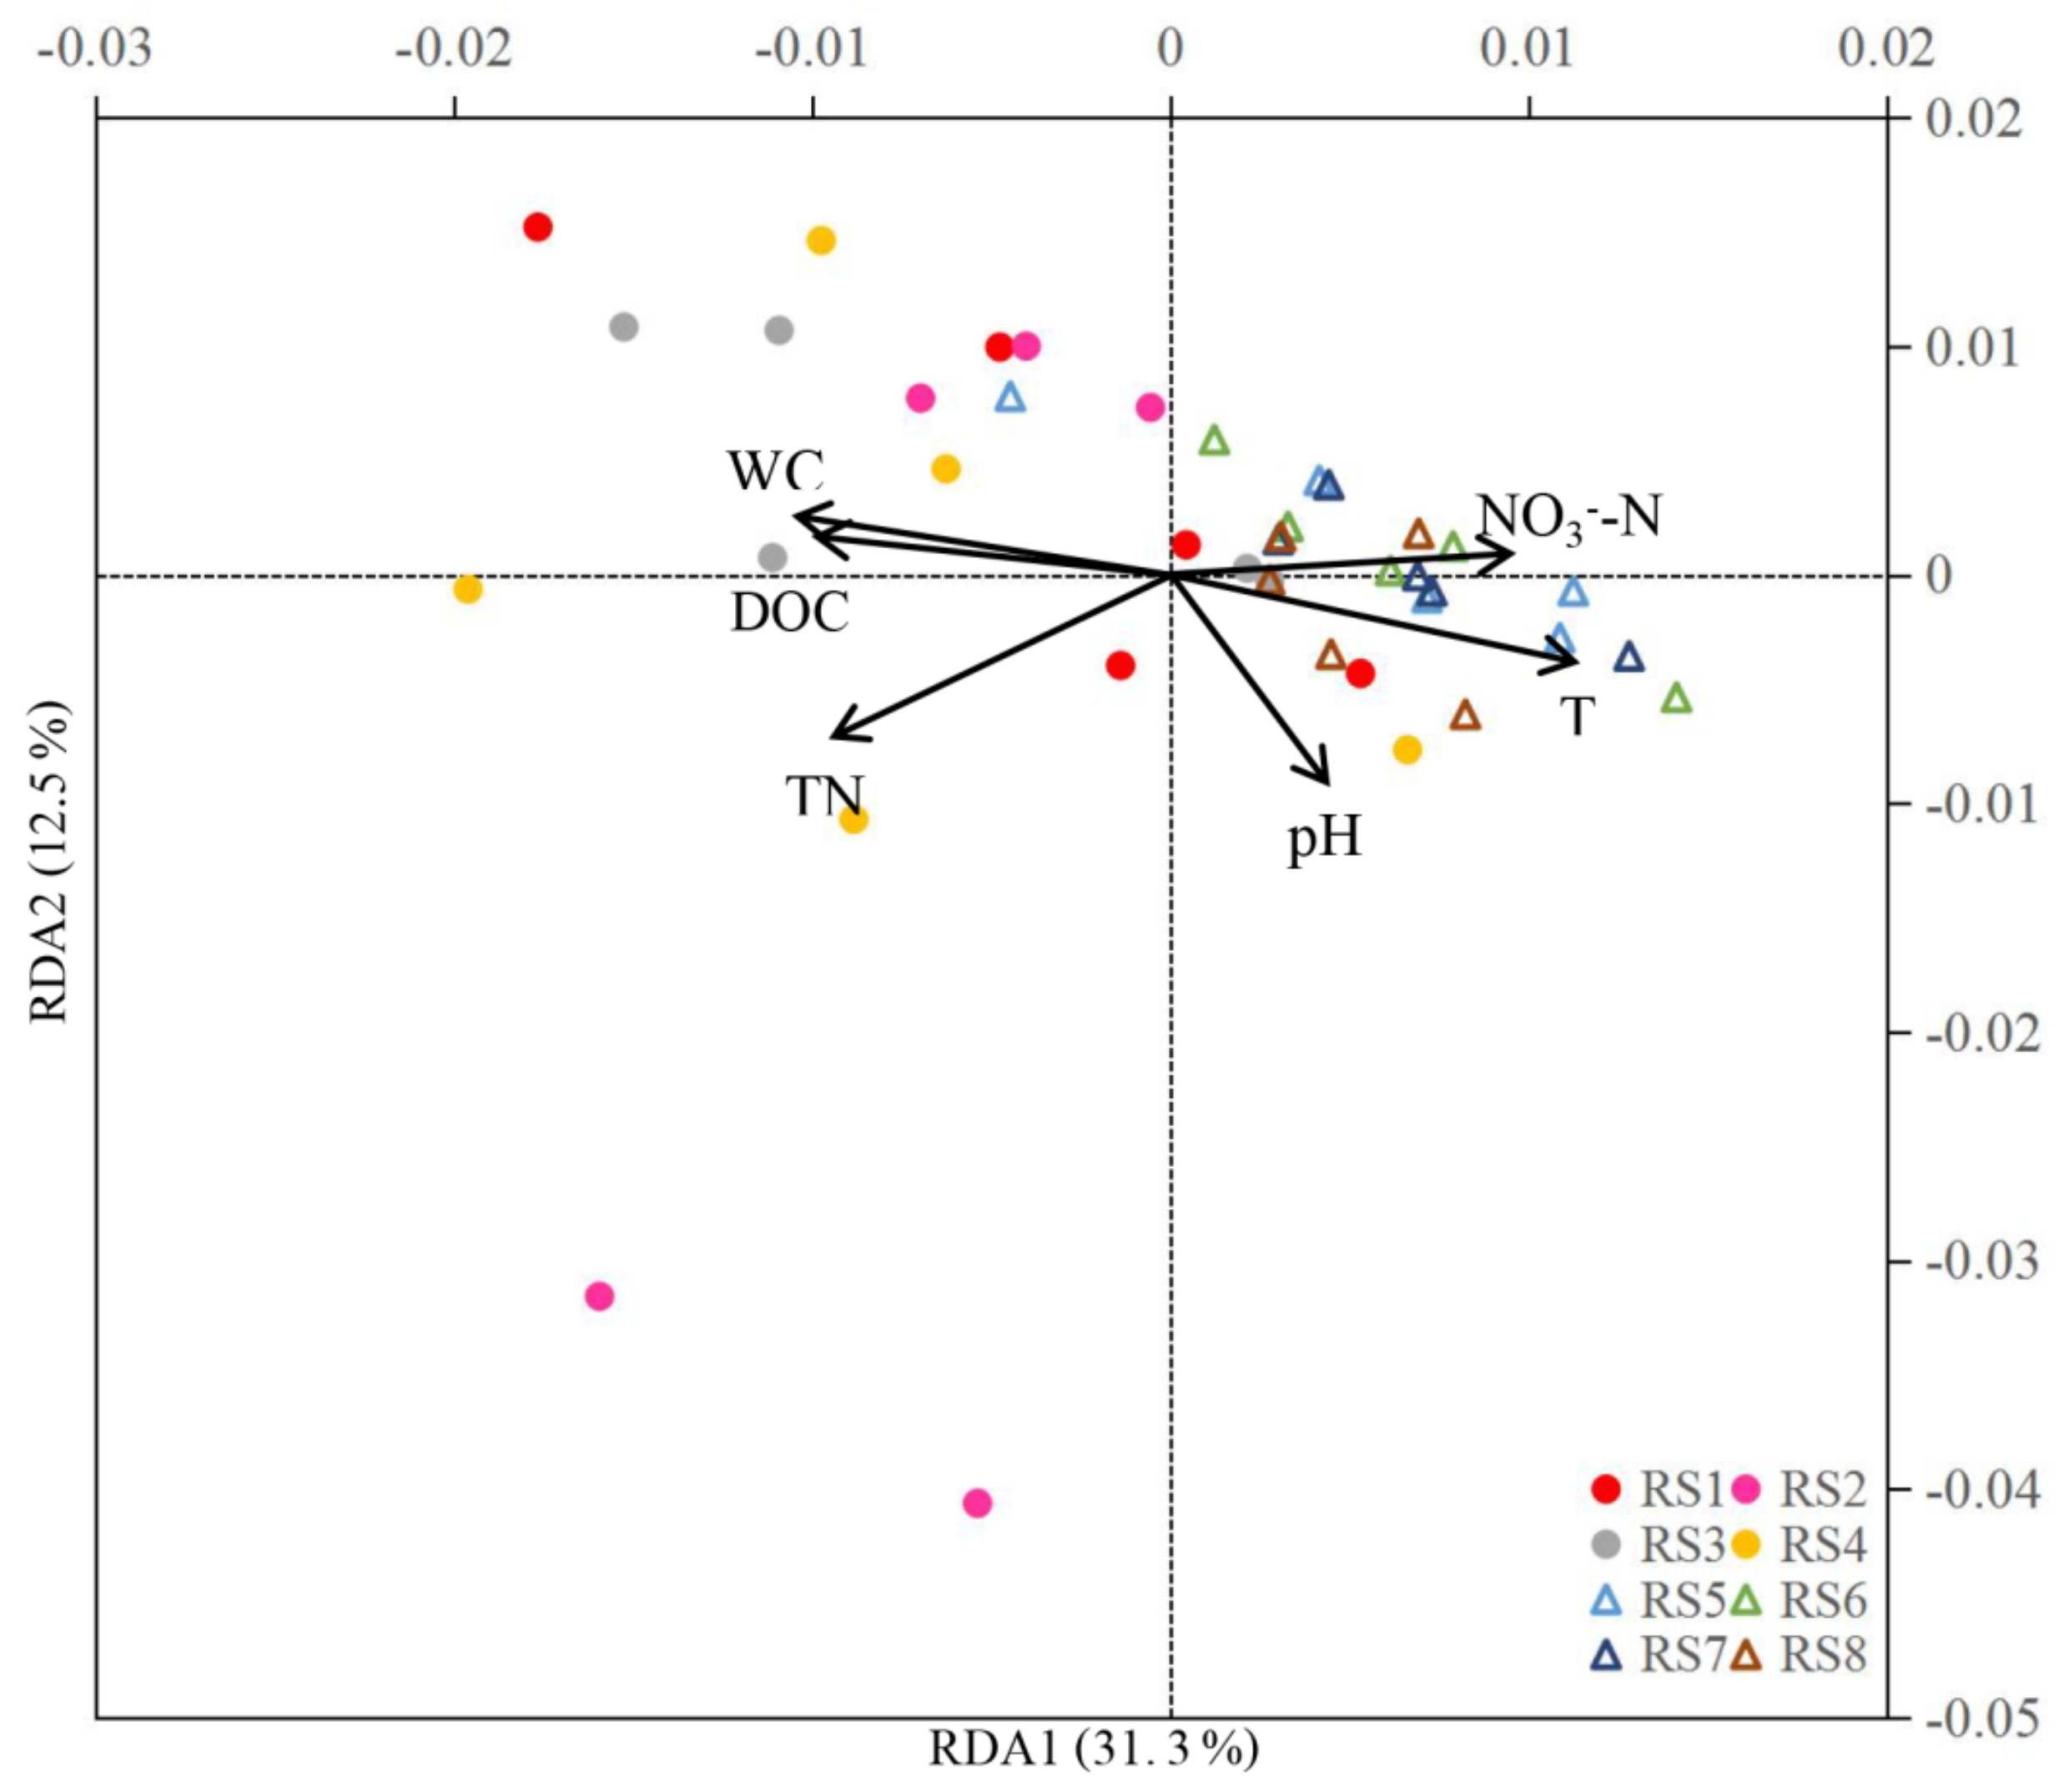
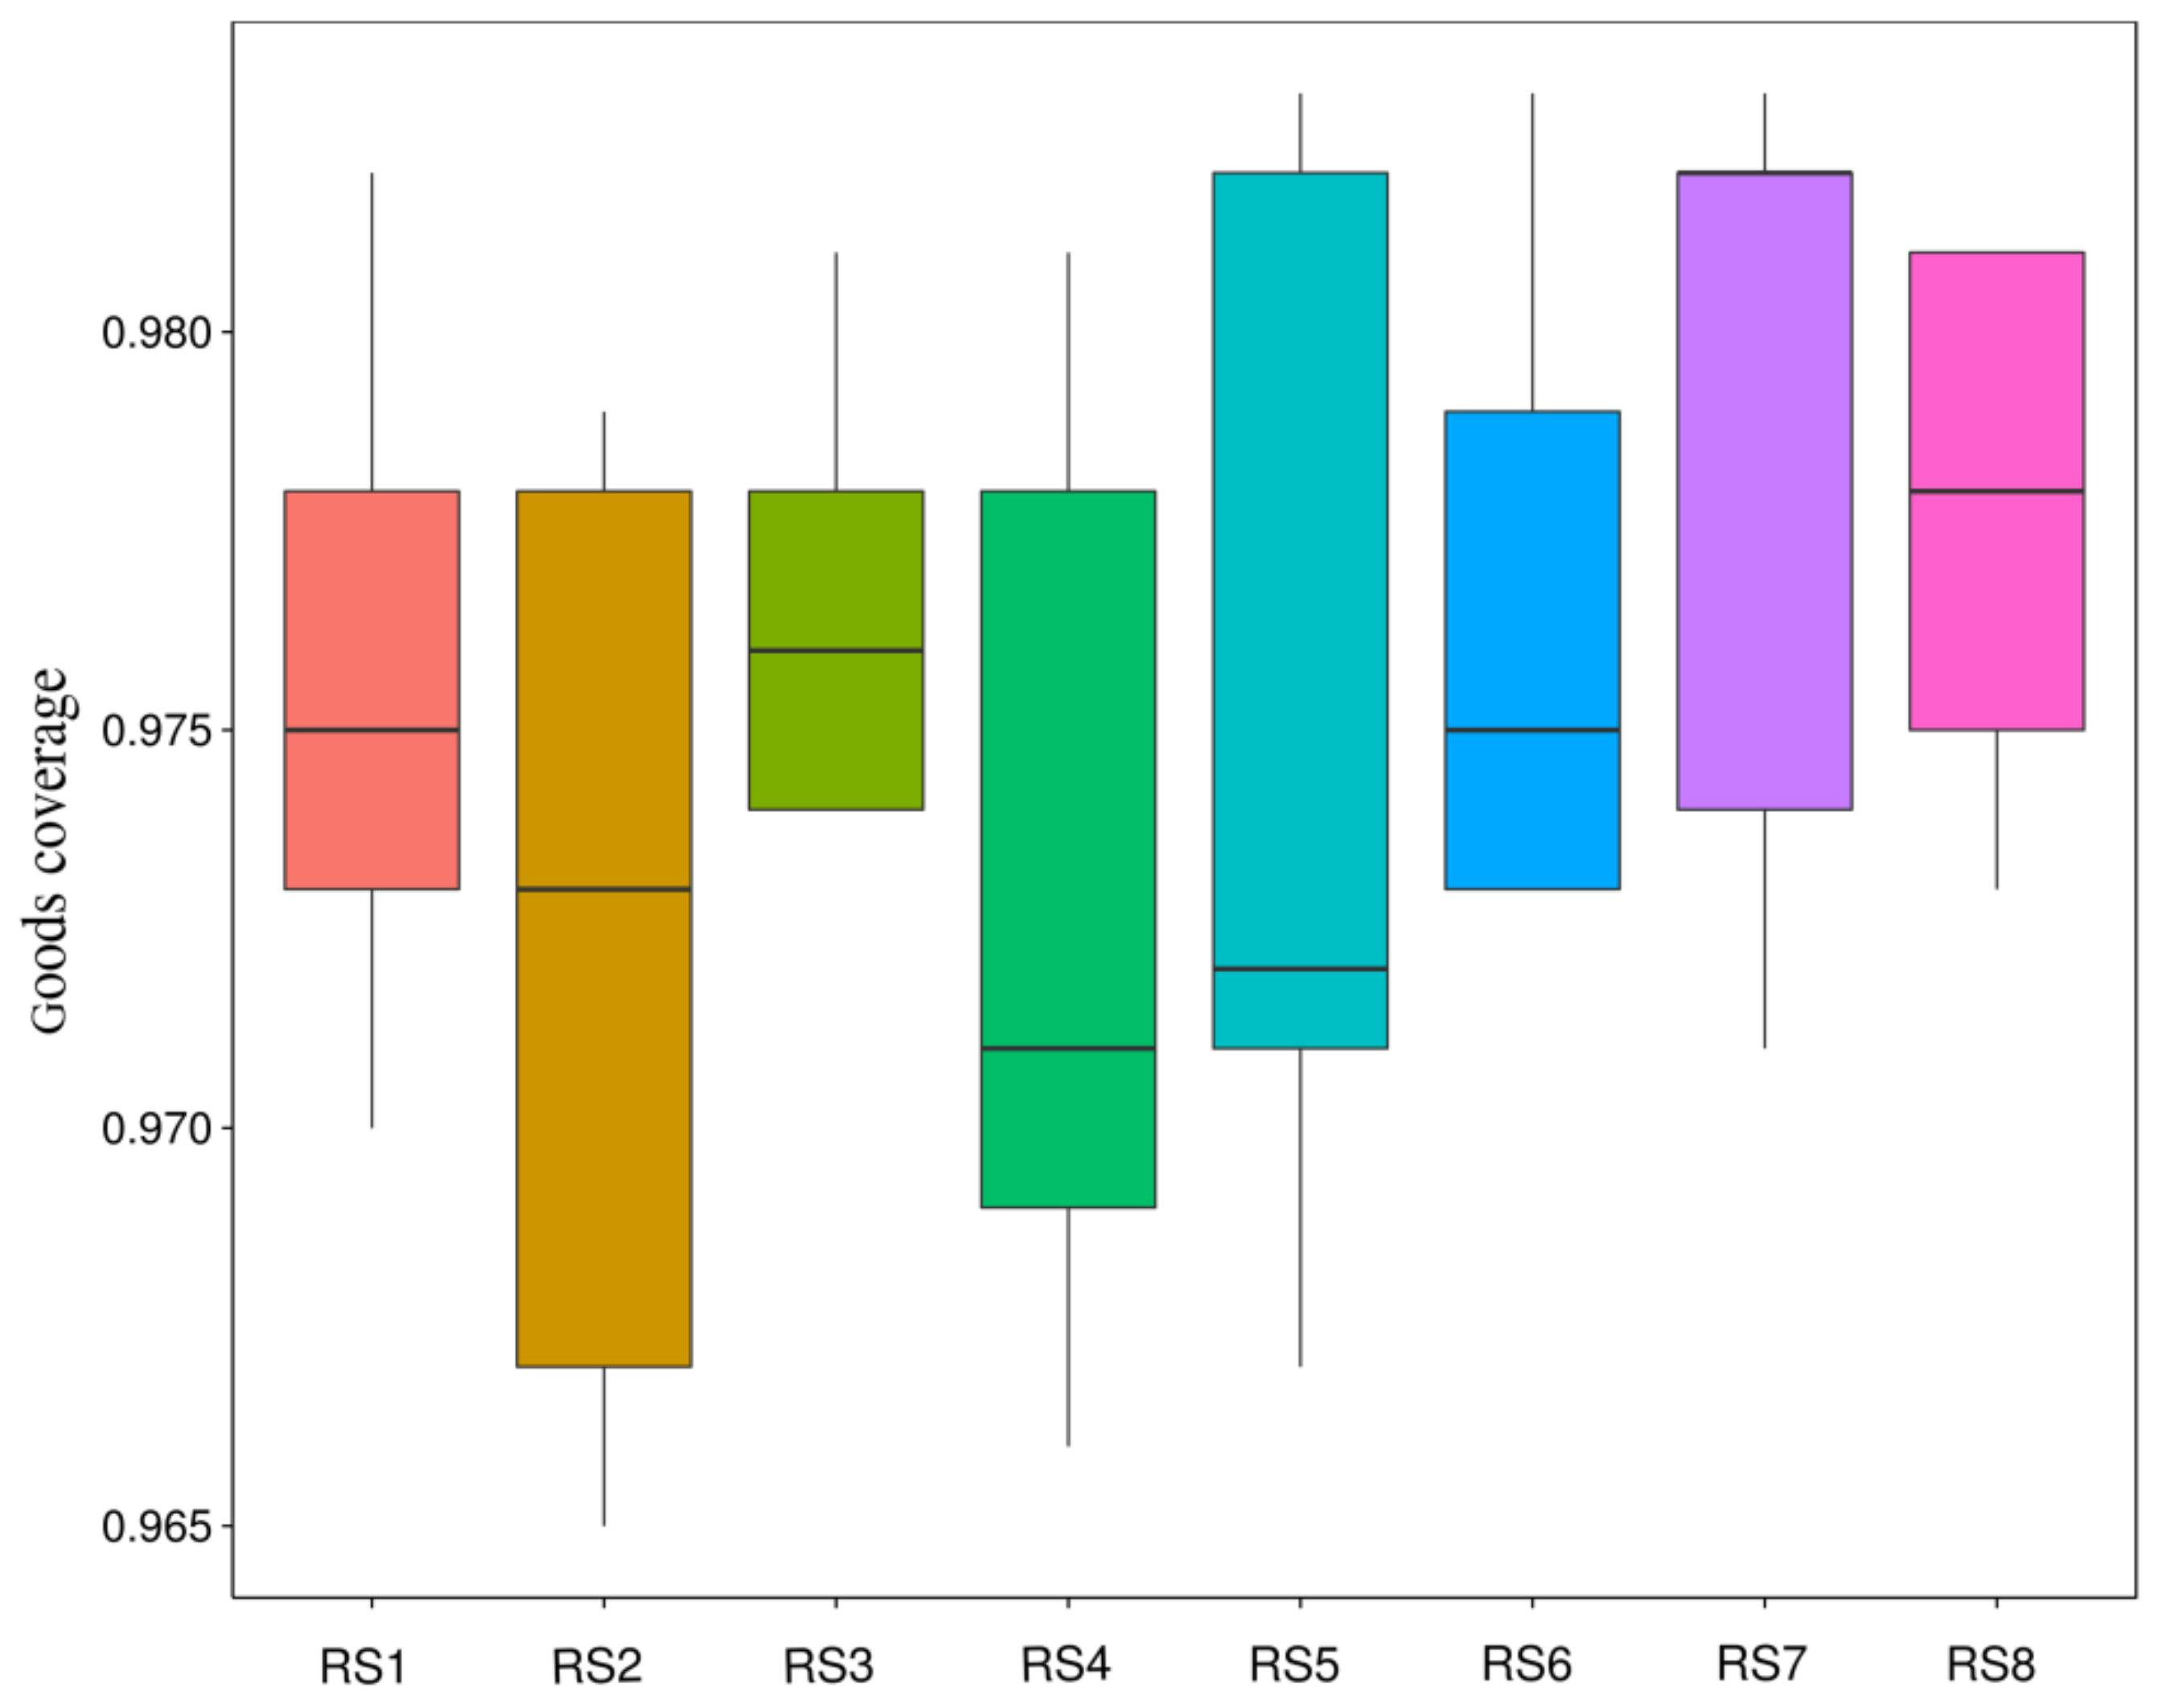
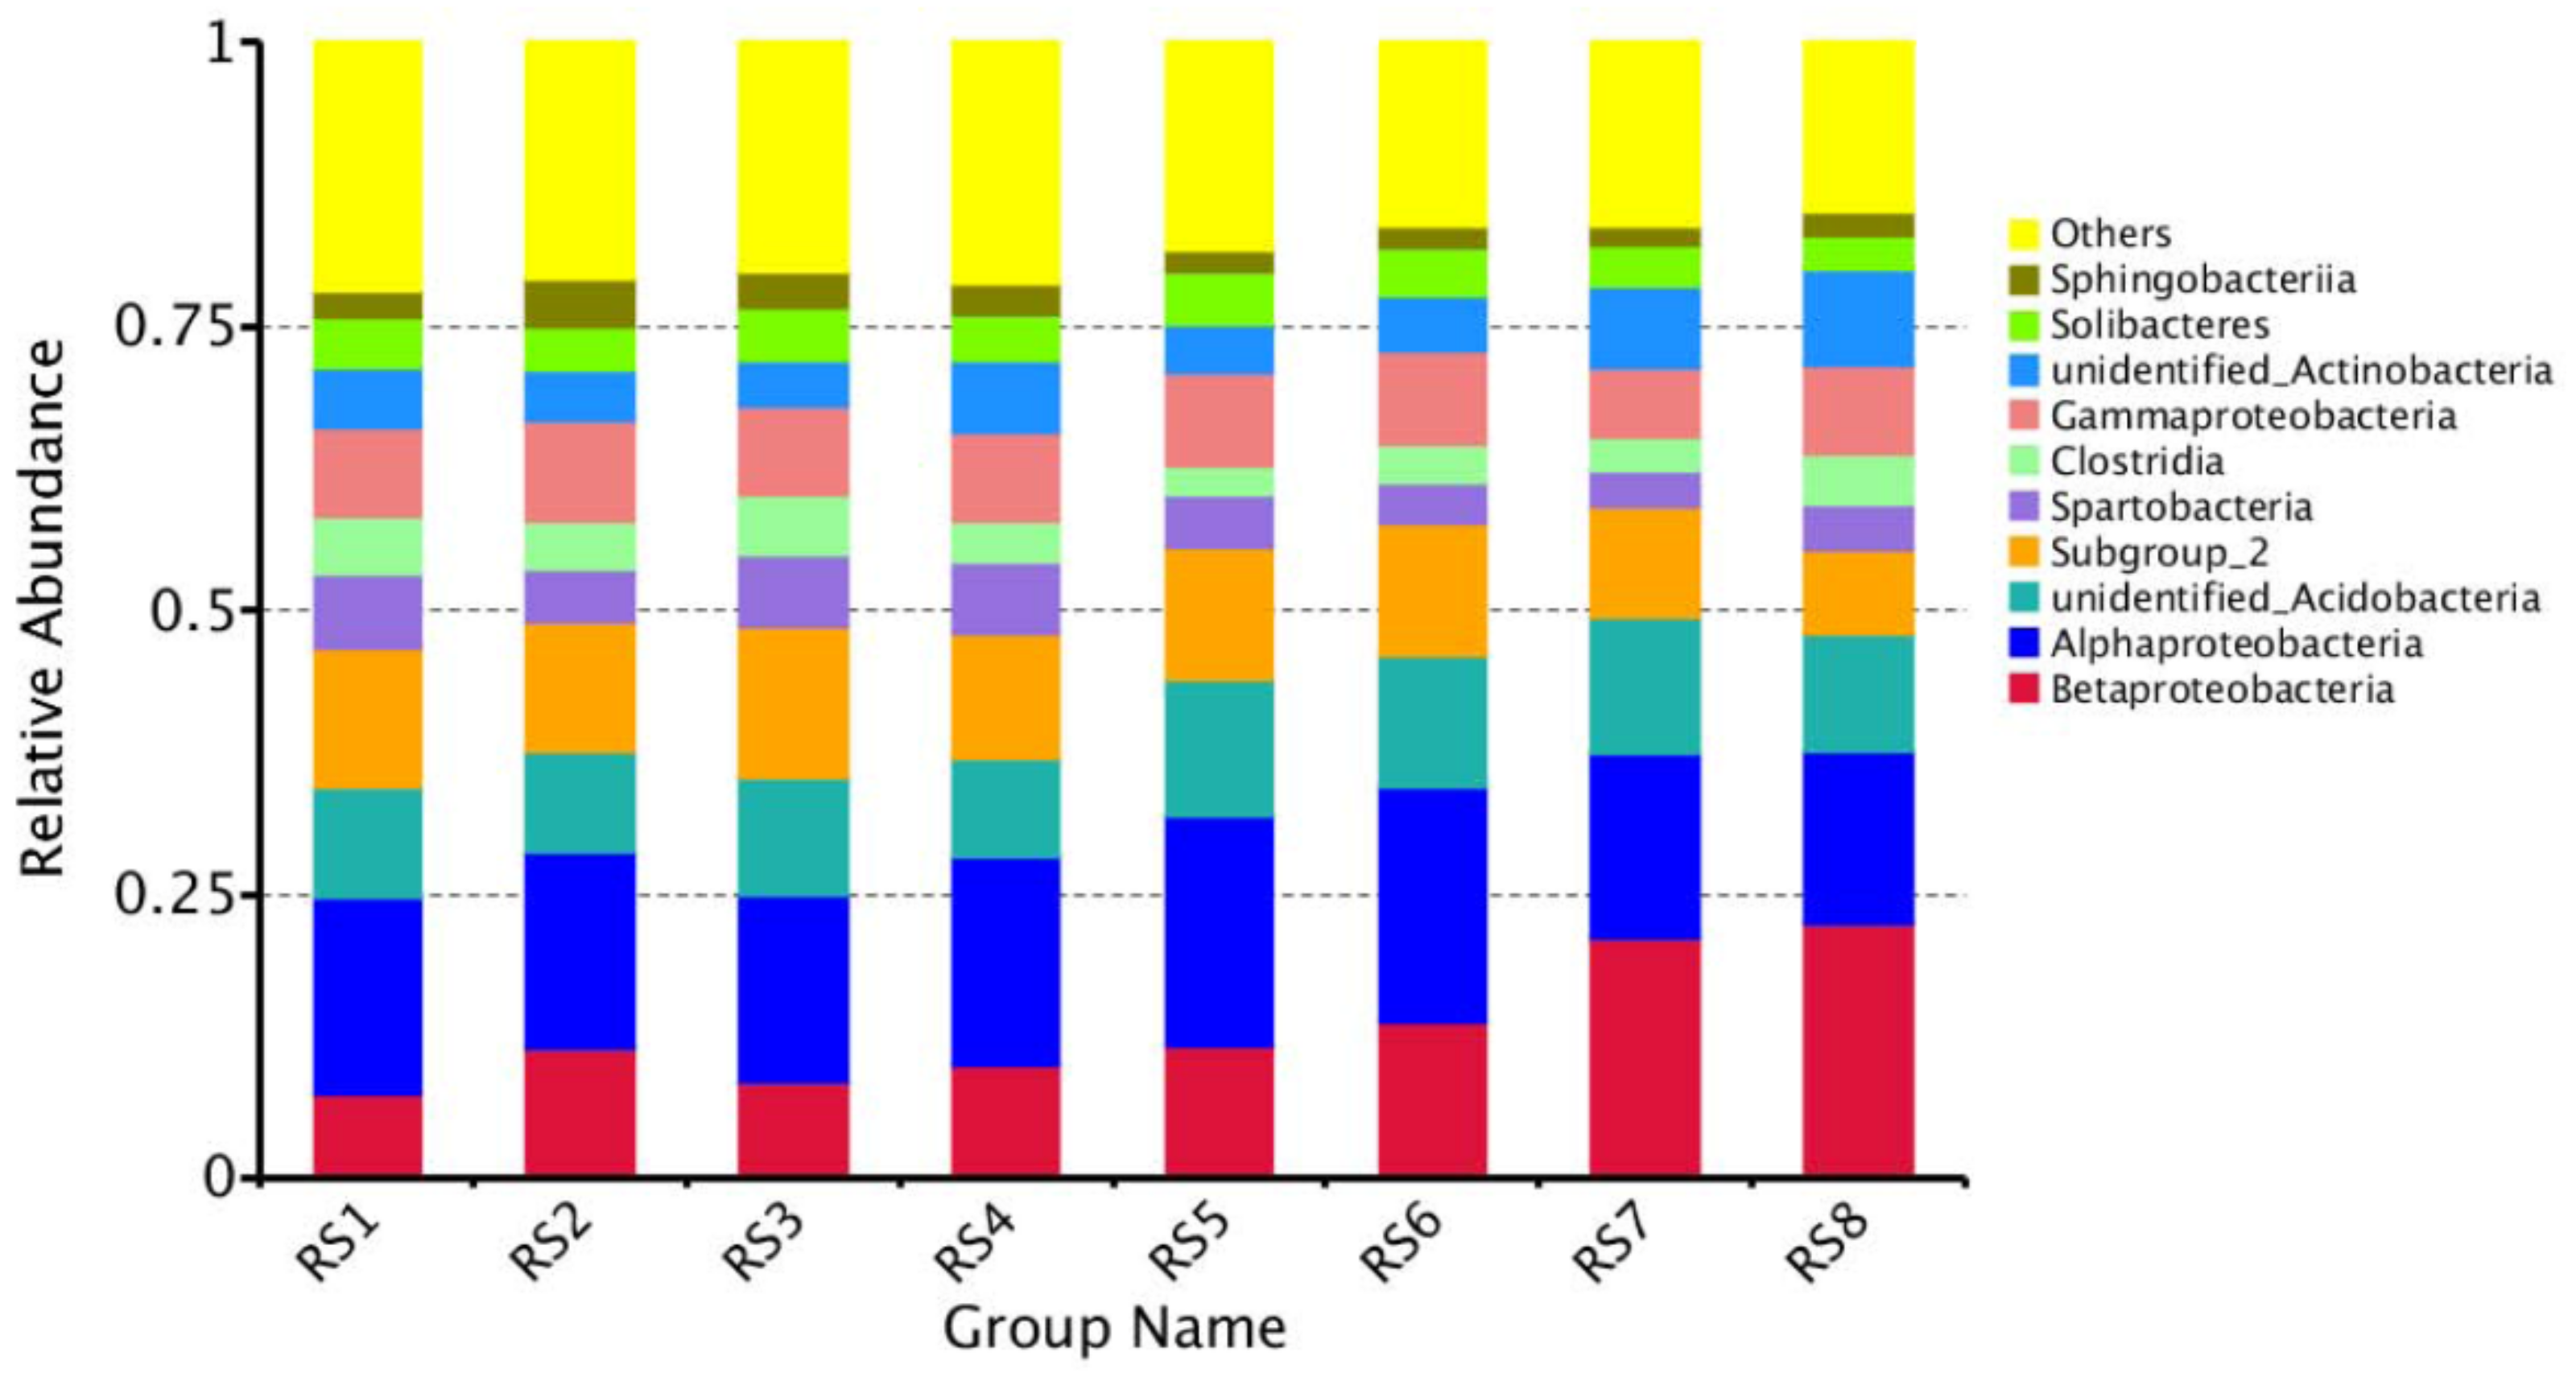
3.4. Composition of Bacterial Communities

A total of 2,375,395 paired-end reads were obtained from 40 soil samples. Next, 51,137 OTUs clustered at 97% sequence identity were mapped to 44 phyla and 556 known genera. The rarefaction curve level led off towards the asymptote, thus suggesting a sufficient sequencing depth and a good coverage of taxonomic diversity for bacterial communities (Figure S1). The good coverage varied throughout the year, but there was no significant difference at each site (Figure 4). Within the bacterial domain, Alphaproteobacteria was the most abundant group (range of relative abundance, 15.1–20.6%) at the class level, followed by Betaproteobacteria (7.3–22.4%) and Gammaproteobacteria (6.1–8.9%). At TBDF-BTM, Proteobacteria (Alpha-, Beta-, Gamma-) accounted for 31.7% to 38.5% of total bacteria; at TRF-JFL, the relative abundance of Proteobacteria was slightly higher, accounting for 32.9% to 51.3% of total bacteria (Figure 5).
At the genus level, we detected one genus of methanotrophs (Candidatus Methylacidiphilum) and three genera of methylotrophs (Methylobacterium, Methylotenera, and Methylovirgula). For the relative abundance of methanotrophs and methylotrophs, there were no significant differences at TBDF-BTM and TRF-JFL in the four seasons (p > 0.05; Figure 6A,B). The total relative abundance of the methanotrophs and methylotrophs in all seasons at TBDF-BTM was higher than TRF-JFL.

4. Discussion

4.1. Variations in Soil CH4 Fluxes

During the study period, the TBDF-BTM and TRF-JFL soils were all sinks for CH4 and the TRF-JFL soils were a weaker CH4 sink than the TBDF-BTM soils. At TBDF-BTM, we found an obvious decreasing trend in CH4 uptake from September to the following March. With the decrease of temperature from September 2015 to the following March (Table 3), plants began to enter the non-growing season, soil physicochemical properties changed, and CH4 uptake decreased. From March to August 2016, CH4 uptake increased markedly, because during this period, plants began to grow rapidly with the temperature increase and the forest soil reached a higher net CH4 uptake in the peak growing season. Several studies in temperate forests have shown that the rate of CH4 uptake increases during summer period compared with winter [68,69,70]. We found similar results during our study. The oxidation of CH4 in summer and autumn is higher than that in winter and spring at TBDF-BTM. Soil CH4 fluxes also showed seasonal variations in the boreal and temperate forests, for example, a higher uptake in summer and emission in winter, respectively [71]. The CH4 uptake rates of the temperate forest soils in European and North American are ~25.6 kg CH4 ha−1 year−1 [72], which is nearly twice the rate observed at TBDF-BTM. However, at TRF-JFL, we found no seasonal variation in the CH4 uptake from September 2015 to the following June (Figure 2B). Because the TRF-JFL is located in a tropical region, the soil temperature was relatively high and remained stable throughout the study period. Therefore, we did not find any significant change in CH4 uptake among the different seasons at this site. In addition, the CH4 fluxes also had no direct relationship with any physical and chemical factors, surprisingly. The subtropical forest soil acted as a net soil CH4 sink [71]. The rates of CH4 uptake in tropical forest soils of Queensland, Australia, range from 0.8 to 4.73 kg CH4-C ha−1 year−1 [68,73]. The annual CH4 uptake rates in an old-growth tropical forest site of southern China range from 2.3 to 3.4 kg CH4-C ha−1 year−1 [74]. All these results are lower than the CH4 uptake rates observed at TRF-JFL. The difference in CH4 uptake at the two sites is probably related to the different climatic conditions in the two distinct regions. Despite the inconsistency in CH4 uptake rates, we noted that temperate forest soils show greater CH4 oxidation capacity than tropical forest soils in the current study.

4.2. Relationships between Soil CH4 Fluxes and Environmental Factors

A low WFPS indicates that more pore space and larger variations in the WFPS lead to greater variability in CH4 uptake [75]. Changes in WFPS explained more than 65% of the temporal variation in CH4 uptake at a primary seasonal tropical rainforest and a rubber plantation site in Southwest China [76]. Soil CH4 consumption was negatively correlated with WFPS in a tropical forest [74], which is in agreement with previous findings in aerated temperate soils and different forest soils [68,74,76,77]. DOC represents the primary carbon source for CH4 production, which explained the strong positive correlation found between the seasonal pattern of soil DOC concentrations and CH4 emissions in a flooded paddy soil [78]. A previous study reported a positive correlation between soil DOC concentration and the CH4 oxidation rate (r = 0.76, p < 0.01), indicating that DOC is an important regulator of CH4 oxidation in arid soils [79]. In addition, DOC input from forest organic layers can change the inhibition effect of nitrogen deposition on the soil atmospheric CH4 uptake, which depends on the types of deposited nitrogen [48]. DOC concentrations at TBDF-BTM were all higher in four seasons than that at TRF-JFL (Table 3). In other words, DOC was not one of the main factors affecting CH4 flux at the two sites. DOC can stimulate methane oxidation, although we did not observe a statistically significant result. This may be a paradox of biological significance and statistical results.
After statistical analysis, we found CH4 fluxes were significantly associated with WFPS, TC, and MBC, but not WC and other physical and chemical factors at TBDF-BTM. Therefore, the seasonal variation of CH4 flux is the result of the interaction of environmental factors in the region.

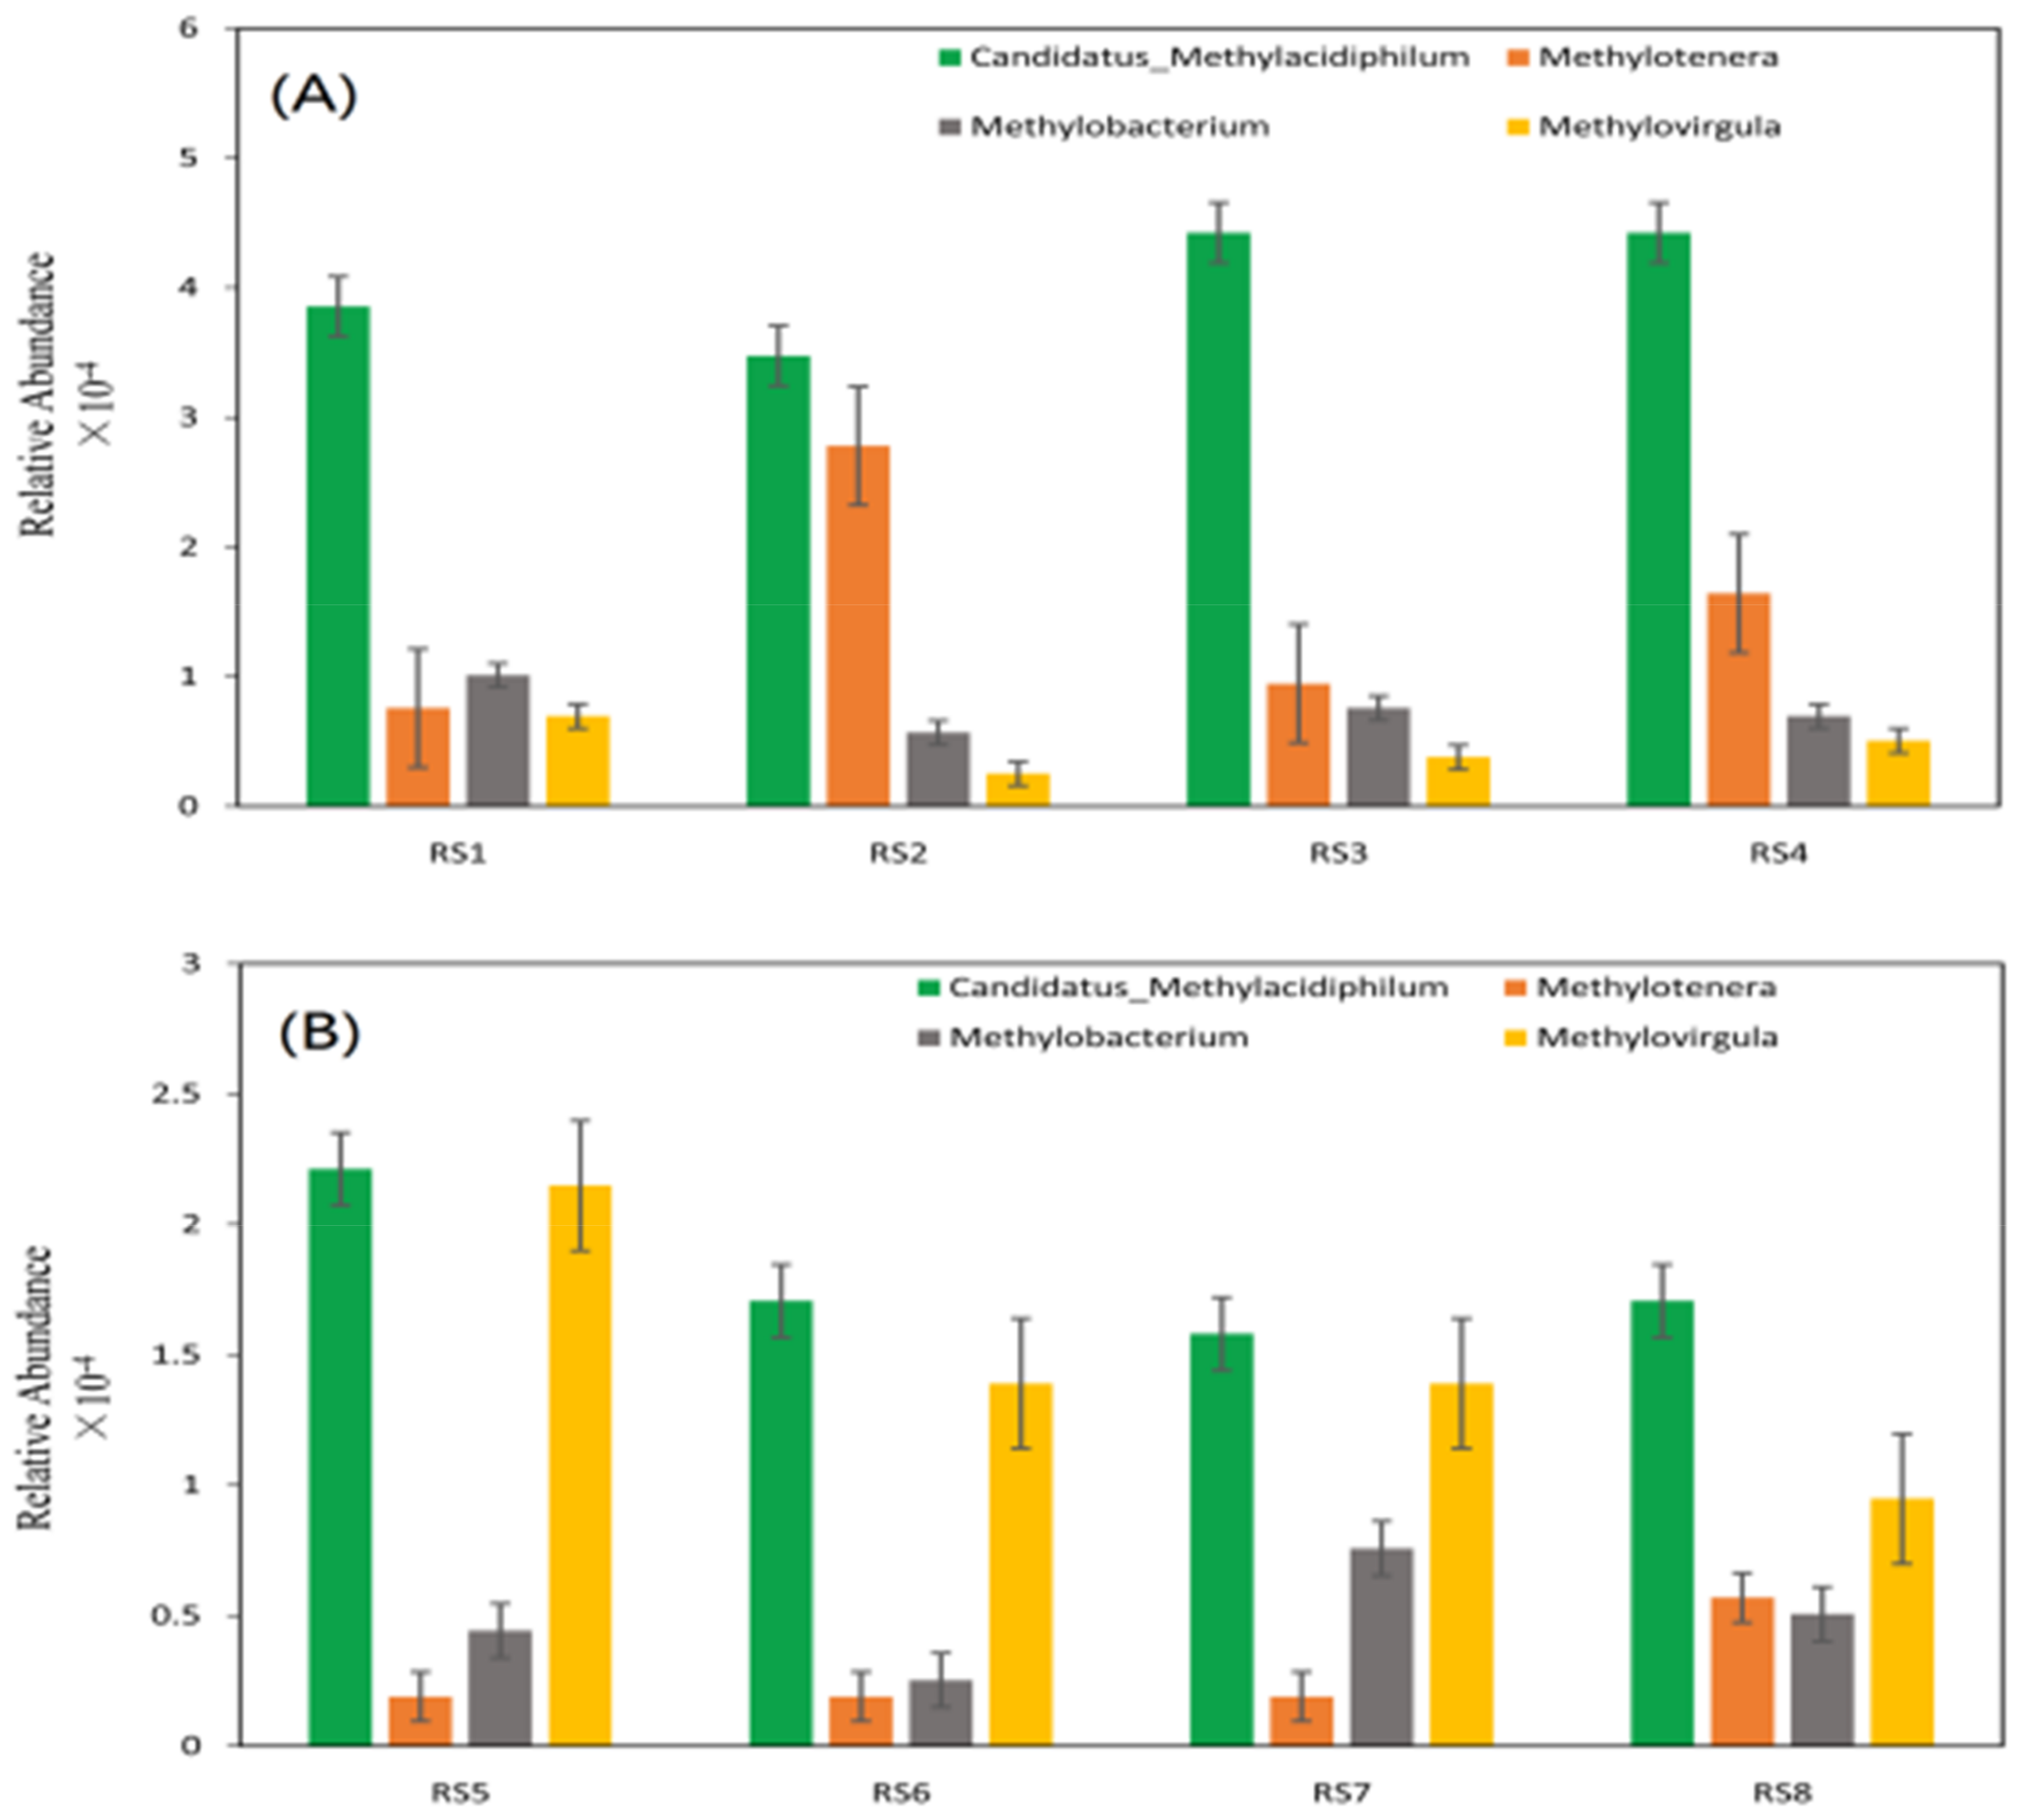
4.3. Relationships between CH4 Fluxes and CH4-Related Bacteria

There are numerous studies that describe seasonal changes in microbial communities over time, across a wide range of ecosystems [66,69,70,80]. We found that the relative abundance of methanotrophs was significantly higher in winter than in summer. This implies that the lower temperatures in winter combined with other prevailing conditions [81]. Often in microbial communities, the change in relative abundance between winter and summer is due to the most abundant organisms “dying back” during periods of lower resource availability. In these cases, it may appear that the abundance of a rare species is increasing, but instead the abundance stays the same but appears to be enhanced due to the reduction in abundance of other species. Soil methanotrophs are bacterial consumers of atmospheric CH4. Consumption of atmospheric CH4 by methanotrophs has been well documented in forest soils [81]. However, at our two sites, there were no obvious seasonal change in the abundance of methanotrophs and methylotrophs, which was in accordance with Shrestha’s results [82]. The relative abundance of methanotrophs and methylotrophs in soil was higher at TBDF-BTM than that at TRF-JFL (Figure 6A,B), and the amount of methane oxidation at TBDF-BTM (0.150 ± 0.02 mg m−2 h−1) was larger than that at TRF-JFL (0.056 ± 0.02 mg m−2 h−1) (Figure 2A). However, it was found that the abundance of methanotrophs and methylotrophs had no statistically significant relationship with the CH4 flux in our study (p > 0.05; Table 2). The possible reason is that both the relative abundance of methanotrophs and methylotrophs and CH4 flux vary greatly between each replicate, leading to statistically insignificant results. In addition, there may be a mismatch in the relationship between the abundance and function of methanotrophs and methylotrophs. Other factors may combine to influence the oxidation of methane in the forest soils of our two sites.
In this study, we detected the presence of CH4-oxidizing Candidatus Methylacidiphilum, a distinct phylogenetic lineage within the phylum of Verrucomicrobia [83] at both sites. Moreover, three methylotrophs (Methylotenera, Methylobacterium, and Methylovirgula) [39] were found in the soil samples. Methylotenera, members of Methylophilaceae, are non-CH4-utilizing methylotrophs that can obtain CH4-derived carbon [37]. Methylobacterium are facultative methylotrophs that are capable of growing on one-carbon compounds, such as methanol, methylamine, formaldehyde, and formate, and members of this genus are ubiquitous in nature [84]. Methylovirgula, the genus of facultative methylotrophs, assimilate methanol-derived carbon via the RuBP pathway [85].
At TBDF-BTM, the total relative abundance of the observed methanotrophs and methylotrophs genera had no distinct seasonal variation. However, we observed a seasonal variation in CH4 flux. This may be due to the fact that the activity of these CH4-related bacteria in December and March (cold, non-growing season) was lower, despite their higher abundance. Although these CH4-related bacteria had a rich, active community and the relative abundance of these CH4-related bacteria increased in winter, they evidently have lower overall cold tolerance than that in the dry site [86]. At TRF-JFL, soil temperature was relatively stable and the activity of these CH4-related bacteria may remain the same activity during the rainy and dry seasons, and therefore we did not observe a statistically significant seasonal variation in CH4 fluxes.
WFPS showed a statistically significant positive relationship with CH4 fluxes and a statistically significant negative relationship with the relative abundance of methanotrophs [87]. Not only did the relative abundances of type I and type II methanotrophs change with temperature, but the composition of the type I methanotrophic community was influenced by temperature [88]. We found that CH4 flux had a correlation with WFPS, TC, and MBC, whereas no relationship with methanotrophs/methylotrophs was observed at TBDF-BTM. CH4 flux had no relationship with any physical and chemical factor and methanotrophs/methylotrophs at TRF-JFL. This may be caused by the relative abundance of methane-oxidizing bacteria and CH4 fluxes varying greatly between each repetition, leading to insignificant statistical results. In addition, there may be a discrepancy between the relationship between the abundance of methane-oxidizing bacteria and their functionality (i.e., CH4 oxidation). The combination of biotic and abiotic factors certainly affects the oxidation of soil CH4 fluxes in both sites.
Many studies have detected methane-oxidizing bacteria using the functional gene pmoA [89]. Our study analyzed the bacterial diversity using 16S rDNA analysis, which may underestimate the abundance of methane-oxidizing bacteria. With only one site for each forest type, our study is still limited and cannot reach a general conclusion regarding the intrinsic difference in CH4 fluxes between forest types in the transitional climatic regions and the underlying abiotic and biotic controls. Future work including more study sites from different forest types needs to be conducted targeting the functional genes of methane-oxidizing bacteria.

5. Conclusions

We found that the two sampling sites soils take up CH4, with higher CH4 uptakes observed in the TBDF-BTM temperate forest soils and lower CH4 uptakes in the TRF-JFL tropical rainforest soils. Our results suggest that WFPS and TC have a remarkable effect on CH4 fluxes at TBDF-BTM and the CH4 fluxes had no significant correlations with any soil properties at TRF-JFL. The total relative abundance of the methanotrophs and methylotrophs in all seasons at TBDF-BTM was higher than TRF-JFL. Soil water content (WC), dissolved organic carbon (DOC), total nitrogen (TN), temperature (T), pH, and nitrate-nitrogen (NO3-N) were the main factors controlling the abundance of methanotrophs and three genera of methylotrophs of forest soil at the two sites. Methanotrophs and three genera of methylotrophs had no correlation with soil CH4 fluxes at both sites. Water-filled pore space and soil total carbon content were the main factors controlling the soil CH4 fluxes at TBDF-BTM. At TRF-JFL, the soil CH4 flux had no significant correlations with any of the soil properties. The methanotrophs in our two forest soils also need to be identified by culture-based approaches to verify their relationship with CH4 fluxes. Our observations in this study provide a scientific basis for the relationships among soil CH4 fluxes, methanotrophic and methylotrophic communities, and soil properties in two distinct forest ecosystems. These results advance our understanding about the conditions under which commonly known methanotrophs and methylotrophs occur in forest soils, recognize the undefined microbial populations responsible for oxidation of atmospheric CH4, and provide a future reference for modeling forest CH4 fluxes.

Supplementary Materials

The following are available online at https://www.mdpi.com/1999-4907/9/4/204/s1, Figure S1: Rarefaction curves obtained for the HiSeq sequencing reads of operational taxonomic units (OTUs) from the V3–V4 region of bacterial 16S rDNA genes in soil samples collected at the two different forest sites.

Acknowledgments

This work was supported by the National Key R & D Program of China (2016YFC0500203), National Natural Science Foundation of China (41601098), QianRen Program, the Natural Science Foundation of Shaanxi Province of China (2016JQ3022), and the Natural Sciences and Engineering Research Council of Canada Discovery Grant. The authors thank all staff members of BTM authority at Neixiang for their help, especially Song Li for the assistance in the field work and those who assisted with laboratory analyses.

Author Contributions

H.W., C.P., and M.W. designed the experiment and supervised all work. H.W. and X.L. were involved in the field work. All authors contributed to the preparation of the manuscript.

Conflicts of Interest

The authors declare that the research was conducted in the absence of any commercial or financial relationships that could be construed as a potential conflict of interest.

References

  1. Hiltbrunner, D.; Zimmermann, S.; Karbin, S.; Hagedorn, F.; Niklaus, P.A. Increasing soil methane sink along a 120-year afforestation chronosequence is driven by soil moisture. Glob. Chang. Biol. 2012, 18, 3664–3671. [Google Scholar] [CrossRef]
  2. Ciais, P.; Sabine, C.; Bala, G.; Bopp, L.; Brovkin, V.; Canadell, J.; Chhabra, A.; DeFries, R.; Galloway, J.; Heimann, M.; et al. Carbon and Other Biogeochemical Cycles; Cambridge University Press: Cambridge, UK, 2013; pp. 465–570. [Google Scholar]
  3. Howden, S.M.; Crimp, S.J.; Stokes, C.J. Climate change and Australian livestock systems impacts, research and policy issues. Aust. J. Exp. Agric. 2008, 48, 780–788. [Google Scholar] [CrossRef]
  4. Basiliko, N.; Khan, A.; Prescott, C.E.; Roy, R.; Grayston, S.J. Soil greenhouse gas and nutrient dynamics in fertilized western Canadian plantation forests. Can. J. For. Res. 2009, 39, 1220–1235. [Google Scholar] [CrossRef]
  5. Christiansen, J.R.; Levy-Booth, D.; Prescott, C.E.; Grayston, S.J. Microbial and environmental controls of methane fluxes along a soil moisture gradient in a pacific coastal temperate rainforest. Ecosystems 2016, 19, 1255–1270. [Google Scholar] [CrossRef]
  6. Menon, S.; Denman, K.L.; Brasseur, G.; Chidthaisong, A.; Ciais, P.; Cox, P.M.; Dickinson, R.E.; Hauglustaine, D.; Heinze, C.; Holland, E. Couplings between changes in the climate system and biogeochemistry. Lawrn. Brly. Naonal Lab. 2008, 2007, 499–587. [Google Scholar]
  7. Borken, W.; Brumme, R. Methane Uptake by Temperate Forest Soils; Springer: Berlin/Heidelberg, Germany, 2009; pp. 369–385. [Google Scholar]
  8. Cai, Z.C. Greenhouse gas budget for terrestrial ecosystems in China. Sci. China Earth Sci. 2012, 55, 173–182. [Google Scholar] [CrossRef]
  9. Wang, Y.; Chen, H.; Zhu, Q.; Peng, C.; Wu, N.; Yang, G.; Zhu, D.; Tian, J.; Tian, L.; Kang, X. Soil methane uptake by grasslands and forests in China. Soil Biol. Biochem. 2014, 74, 70–81. [Google Scholar] [CrossRef]
  10. Peichl, M.; Arain, M.A.; Ullah, S.; Moore, T.R. Carbon dioxide, methane, and nitrous oxide exchanges in an age-sequence of temperate pine forests. Glob. Chang. Biol. 2010, 16, 2198–2212. [Google Scholar] [CrossRef]
  11. Neto, E.S.; Carmo, J.B.; Keller, M.; Martins, S.C. Soil-atmosphere exchange of nitrous oxide, methane and carbon dioxide in a gradient of elevation in the coastal Brazilian Atlantic forest. Biogeosciences 2011, 8, 733–742. [Google Scholar] [CrossRef] [Green Version]
  12. Wang, J.M.; Murphy, J.G.; Geddes, J.A.; Winsborough, C.L. Methane fluxes measured by eddy covariance and static chamber techniques at a temperate forest in central Ontario, Canada. Biogeosciences 2013, 10, 4371–4382. [Google Scholar] [CrossRef]
  13. Subke, J.A.; Reichstein, M.; Tenhunen, J.D. Explaining temporal variation in soil CO2 efflux in a mature spruce forest in southern Germany. Soil Biol. Biochem. 2003, 35, 1467–1483. [Google Scholar] [CrossRef]
  14. Kvon, A.; Nilsson, M.; Hanell, B.; Weslien, P.; Klemedtsson, L. Fluxes of CO2, CH4 and N2O from drained organic soils in deciduous forests. Soil Biol. Biochem. 2005, 37, 1059–1071. [Google Scholar]
  15. Grogan, P.; Michelsen, A.; Ambus, P.; Jonasson, S. Freeze-thaw regime effects on carbon and nitrogen dynamics in sub-arctic health tundra mesocosms. Soil Biol. Biochem. 2004, 36, 641–654. [Google Scholar] [CrossRef]
  16. Song, C.; Zhang, J.; Wang, Y.; Wang, Y.; Zhao, Z. Emission of CO2, CH4 and N2O from freshwater marsh in northeast of China. J. Environ. Manag. 2008, 88, 428–436. [Google Scholar] [CrossRef] [PubMed]
  17. Christiansen, J.R.; Levy-Booth, D.; Prescott, C.E.; Grayston, S.J. Different soil moisture control of net methane oxidation and production in organic upland and wet forest soils of the pacific coastal rainforest in Canada. Can. J. For. Res. 2017, 47, 628–635. [Google Scholar] [CrossRef]
  18. Czepiel, P.M.; Mosher, B.; Crill, P.M.; Harriss, R.C. Quantifying the effect of oxidation on landfill methane emissions. J. Geophys. Res. Atmos. 1996, 101, 16721–16729. [Google Scholar] [CrossRef]
  19. Whalen, S.C.; Reeburgh, W.S. Moisture and temperature sensitivity of CH4 oxidation in boreal soils. Soil Biol. Biochem. 1996, 28, 1271–1281. [Google Scholar] [CrossRef]
  20. Scheutz, C.; Kjeldsen, P. Environmental factors influencing attenuation of methane and hydrochlorofluorocarbons in landfill cover soils. Soil Mech. Found. Eng. 2004, 7, 113–116. [Google Scholar] [CrossRef]
  21. Park, J.R.; Moon, S.; Ahn, Y.M.; Kim, J.Y.; Nam, K. Determination of environmental factors influencing methane oxidation in a sandy landfill cover soil. Environ. Technol. 2005, 26, 93–102. [Google Scholar] [CrossRef] [PubMed]
  22. Borken, W.; Davidson, E.A.; Savage, K.; Sundquist, E.T.; Steudler, P. Effect of summer throughfall exclusion, summer drought, and winter snow cover on methane fluxes in a temperate forest soil. Soil Biol. Biochem. 2006, 38, 1388–1395. [Google Scholar] [CrossRef]
  23. Chen, W.; Wolf, B.; Zheng, X.; Yao, Z.; Butterbach-Bahl, K.; Brüggemann, N.; Liu, C.; Han, S.; Han, X. Annual methane uptake by temperate semiarid steppes as regulated by stocking rates, aboveground plant biomass and topsoil air permeability. Glob. Chang. Biol. 2011, 17, 2803–2816. [Google Scholar] [CrossRef]
  24. Liu, C.; Brueggemann, H.N.; Butterbach-Bahl, K.; Yao, Z.; Yue, J.; Han, S.; Han, X.; Kruemmelbein, J.; Horn, R.; Zheng, X. Winter-grazing reduces methane uptake by soils of a typical semi-arid steppe in Inner Mongolia, China. Atmos. Environ. 2007, 41, 5948–5958. [Google Scholar] [CrossRef]
  25. Mills, R.T.E.; Dewhirst, N.; Sowerby, A.; Emmett, B.A.; Jones, D.L. Interactive effects of depth and temperature on CH4 and N2O flux in a shallow podzol. Soil Biol. Biochem. 2013, 62, 1–4. [Google Scholar] [CrossRef]
  26. Pulliam, W.M. Carbon dioxide and methane exports from a southeastern floodplain swamp. Ecol. Monogr. 1993, 63, 29–53. [Google Scholar] [CrossRef]
  27. Rask, H.; Schoenau, J.; Anderson, D. Factors influencing methane flux from a boreal forest wetland in Saskatchewan, Canada. Soil Biol. Biochem. 2002, 34, 435–443. [Google Scholar] [CrossRef]
  28. Tamai, N.; Takenaka, C.; Ishizuka, S.; Tezuka, T. Methane flux and regulatory variables in soils of three equal-aged Japanese cypress (Chamaecyparis obtusa) forests in central Japan. Soil Biol. Biochem. 2003, 35, 633–641. [Google Scholar] [CrossRef]
  29. Verchot, L.V.; Davidson, E.A.; Cattânio, J.H.; Ackerman, I.L. Land-use change and biogeochemical controls of methane fluxes in soils of eastern Amazonia. Ecosystems 2000, 3, 41–56. [Google Scholar] [CrossRef]
  30. Merino, A.N.; Pérez-Batallón, P.; MacíAs, F. Responses of soil organic matter and greenhouse gas fluxes to soil management and land use changes in a humid temperate region of southern Europe. Soil Biol. Biochem. 2004, 36, 917–925. [Google Scholar] [CrossRef]
  31. Kravchenko, I.; Boeckx, P.; Galchenko, V.; Ovan, C. Short- and medium-term effects of NH4+ on CH4 and N2O fluxes in arable soils with a different texture. Soil Biol. Biochem. 2002, 34, 669–678. [Google Scholar] [CrossRef]
  32. Mer, J.L.; Roger, P. Production, oxidation, emission and consumption of methane by soils: A review. Eur. J. Soil Biol. 2001, 37, 25–50. [Google Scholar] [CrossRef]
  33. Bodelier, P.L.; Meima-Franke, M.; Hordijk, C.A.; Steenbergh, A.K.; Hefting, M.M.; Bodrossy, L.; Von, B.M.; Seifert, J. Microbial minorities modulate methane consumption through niche partitioning. ISME J. 2013, 7, 2214. [Google Scholar] [CrossRef] [PubMed]
  34. Maxfield, P.J.; Hornibrook, E.R.; Evershed, R.P. Acute impact of agriculture on high-affinity methanotrophic bacterial populations. Environ. Microbiol. 2008, 10, 1917–1924. [Google Scholar] [CrossRef] [PubMed]
  35. Mccalley, C.K.; Woodcroft, B.J.; Hodgkins, S.B.; Wehr, R.A.; Kim, E.H.; Mondav, R.; Crill, P.M.; Chanton, J.P.; Rich, V.I.; Tyson, G.W. Methane dynamics regulated by microbial community response to permafrost thaw. Nature 2014, 514, 478–481. [Google Scholar] [CrossRef] [PubMed]
  36. Freitag, T.E.; Prosser, J.I. Correlation of methane production and functional gene transcriptional activity in a peat soil. Appl. Environ. Microbiol. 2009, 75, 6679–6687. [Google Scholar] [CrossRef] [PubMed]
  37. Chistoserdova, L.; Kalyuzhnaya, M.G.; Lidstrom, M.E. The expanding world of methylotrophic metabolism. Ann. Rev. Microbiol. 2008, 63, 477–499. [Google Scholar] [CrossRef] [PubMed]
  38. Patel, S.K.; Mardina, P.; Kim, S.Y.; Lee, J.K.; Kim, I.W. Biological methanol production by a type II methanotroph methylocystis bryophila. J. Microbiol. Biotechnol. 2016, 26, 717–724. [Google Scholar] [CrossRef] [PubMed]
  39. Dunfield, P.F.; Liesack, W.; Henckel, T.; Knowles, R.; Conrad, R. High-affinity methane oxidation by a soil enrichment culture containing a type II methanotroph. Appl. Environ. Microbiol. 1999, 65, 1009–1014. [Google Scholar] [PubMed]
  40. Bull, I.D.; Parekh, N.R.; Hall, G.H.; Ineson, P.; Evershed, R.P. Detection and classification of atmospheric methane oxidizing bacteria in soil. Nature 2000, 405, 175–178. [Google Scholar] [CrossRef] [PubMed]
  41. Siljanen, H.M.P.; Saari, A.; Martikainen, P.J. Seasonal variation in the function and diversity of methanotrophs in the littoral wetland of a boreal eutrophic lake. FEMS Microbiol. Ecol. 2012, 80, 548–555. [Google Scholar] [CrossRef] [PubMed]
  42. Sengupta, A.; Dick, W.A. Methanotrophic bacterial diversity in two diverse soils under varying land-use practices as determined by high-throughput sequencing of the pmoA gene. Appl. Soil Ecol. 2017, 119, 35–45. [Google Scholar] [CrossRef]
  43. Wise, M.G.; Mcarthur, J.V.; Shimkets, L.J. Methanotroph diversity in landfill soil: Isolation of novel type I and type II methanotrophs whose presence was suggested by culture-independent 16s ribosomal DNA analysis. Appl. Environ. Microbiol. 1999, 65, 4887–4897. [Google Scholar] [PubMed]
  44. Knief, C.; Lipski, A.; Dunfield, P.F. Diversity and activity of methanotrophic bacteria in different upland soils. Appl. Environ. Microbiol. 2003, 69, 6703–6714. [Google Scholar] [CrossRef] [PubMed]
  45. Kolb, S.; Knief, C.; Dunfield, P.F.; Conrad, R. Abundance and activity of uncultured methanotrophic bacteria involved in the consumption of atmospheric methane in two forest soils. Environ. Microbiol. 2005, 7, 1150–1161. [Google Scholar] [CrossRef] [PubMed]
  46. Ricke, P.; Kube, M.; Nakagawa, S.; Erkel, C.; Reinhardt, R.; Liesack, W. First genome data from uncultured upland soil cluster alpha methanotrophs provide further evidence for a close phylogenetic relationship to methylocapsa acidiphila b2 and for high-affinity methanotrophy involving particulate methane monooxygenase. Appl. Environ. Microbiol. 2005, 71, 7472–7482. [Google Scholar] [CrossRef] [PubMed]
  47. Luan, J.; Liu, S.; Chang, S.X.; Wang, J.; Zhu, X.; Liu, K.; Wu, J. Different effects of warming and cooling on the decomposition of soil organic matter in warm–temperate oak forests: A reciprocal translocation experiment. Biogeochemistry 2014, 121, 551–564. [Google Scholar] [CrossRef]
  48. Wang, J.; You, Y.; Tang, Z.; Liu, S.; Sun, O.J. Variations in leaf litter decomposition across contrasting forest stands and controlling factors at local scale. J. Plant Ecol. 2015, 24, 1–12. [Google Scholar] [CrossRef]
  49. Qi, G.; Peng, S.L.; Chen, C.D.; Zhao, G.Q.; Liang, Y.H.; Li, P.; Yang, F.L.; Wen, Z.Z. Biomass carbon storage of three forests at different altitudes in Baotianman mountain, central China. Adv. Mater. Res. 2014, 864–867, 2463–2468. [Google Scholar] [CrossRef]
  50. Luan, J.; Liu, S.; Wang, J.; Zhu, X. Factors affecting spatial variation of annual apparent q10 of soil respiration in two warm temperate forests. Thromb. Haemost. 1977, 38, 909. [Google Scholar] [CrossRef] [PubMed]
  51. Liu, Y.; Liu, S.; Wang, J.; Zhu, X.; Zhang, Y.; Liu, X. Variation in soil respiration under the tree canopy in a temperate mixed forest, central China, under different soil water conditions. Ecol. Res. 2014, 29, 133–142. [Google Scholar] [CrossRef]
  52. Luan, J.; Liu, S.; Wang, J.; Zhu, X.; Shi, Z. Rhizospheric and heterotrophic respiration of a warm-temperate oak chronosequence in China. Soil Biol. Biochem. 2011, 43, 503–512. [Google Scholar] [CrossRef]
  53. Wu, H.; Xu, X.; Duan, C.; Li, T.; Cheng, W. Synergistic effects of dissolved organic carbon and inorganic nitrogen on methane uptake in forest soils without and with freezing treatment. Sci. Rep. 2016, 6, 32555. [Google Scholar] [CrossRef] [PubMed]
  54. Zhou, Z.; Jiang, L.; Du, E.; Hu, H.; Li, Y.; Chen, D.; Fang, J. Temperature and substrate availability regulate soil respiration in the tropical mountain rainforests, Hainan island, China. J. Plant Ecol. 2013, 6, 325–334. [Google Scholar] [CrossRef]
  55. Chen, D.X.; Li, Y.D.; Liu, H.P.; Han, X.; Xiao, W.F.; Luo, T.S.; Zhang, Z.; Lin, M.X. Biomass and carbon dynamics of a tropical mountain rain forest in China. Sci. China Life Sci. 2010, 53, 798–810. [Google Scholar] [CrossRef] [PubMed]
  56. Bai, Z.; Yang, G.; Chen, H.; Zhu, Q.; Chen, D.; Li, Y.; Wang, X.; Wu, Z.; Zhou, G.; Peng, C. Nitrous oxide fluxes from three forest types of the tropical mountain rainforests on Hainan island, China. Atmos. Environ. 2014, 92, 469–477. [Google Scholar] [CrossRef]
  57. Zhao, X.; Ma, C.; Xiao, L. The vegetation history of Qinling Mountains, China. Quat. Int. 2014, 325, 55–62. [Google Scholar] [CrossRef]
  58. Di Castri, F.; Hansen, A.J. The environment and development crises as determinants of landscape dynamics. In Landscape Boundaries: Consequences for Biotic Diversity and Ecological Flows; Hansen, A.J., di Castri, F., Eds.; Springer: New York, NY, USA, 2013; pp. 3–8. [Google Scholar]
  59. Du, B.; Ji, H.; Peng, C.; Liu, X.; Liu, C. Altitudinal patterns of leaf stoichiometry and nutrient resorption in Quercus variabilis in the Baotianman mountains, China. Plant Soil 2017, 413, 193–202. [Google Scholar] [CrossRef]
  60. Yang, H.; Detto, M.; Liu, S.; Yuan, W.; Hsieh, C.I.; Wang, X.; Chen, R.; Chen, H.; Peng, C.; Jiang, X. Effects of canopy gaps on N2O fluxes in a tropical montane rainforest in Hainan of China. Ecol. Eng. 2017, 105, 325–334. [Google Scholar] [CrossRef]
  61. Cheng, C.M.; Wang, R.S.; Jiang, J.S. Variation of soil fertility and carbon sequestration by planting hevea brasiliensis in Hainan island, China. J. Environ. Sci. 2007, 19, 348–352. [Google Scholar] [CrossRef]
  62. Feinstein, L.M.; Sul, W.J.; Blackwood, C.B. Assessment of bias associated with incomplete extraction of microbial DNA from soil. Appl. Environ. Microbiol. 2009, 75, 5428–5433. [Google Scholar] [CrossRef] [PubMed]
  63. Liu, X.; Cheng, X.; Wang, H.; Wang, K.; Qiao, K. Effect of fumigation with 1,3-dichloropropene on soil bacterial communities. Chemosphere 2015, 139, 379–385. [Google Scholar] [CrossRef] [PubMed]
  64. Kraaijeveld, K.; de Weger, L.A.; Ventayol, G.M.; Buermans, H.; Frank, J.; Hiemstra, P.S.; den Dunnen, J.T. Efficient and sensitive identification and quantification of airborne pollen using next-generation DNA sequencing. Mol. Ecol. Resour. 2015, 15, 8–16. [Google Scholar] [CrossRef] [PubMed]
  65. Curran, K.A.; Leavitt, J.M.; Karim, A.S.; Alper, H.S. Metabolic engineering of muconic acid production in Saccharomyces cerevisiae. Metab. Eng. 2013, 15, 55–66. [Google Scholar] [CrossRef] [PubMed]
  66. Zhang, C.; Lin, Y.; Tian, X.; Xu, Q.; Chen, Z.; Lin, W. Tobacco bacterial wilt suppression with biochar soil addition associates to improved soil physiochemical properties and increased rhizosphere bacteria abundance. Appl. Soil Ecol. 2016, 112, 90–96. [Google Scholar] [CrossRef]
  67. Schirmer, M.; D’Amore, R.; Ijaz, U.Z.; Hall, N.; Quince, C. Illumina error profiles: Resolving fine-scale variation in metagenomic sequencing data. BMC Bioinform. 2016, 17, 125. [Google Scholar] [CrossRef] [PubMed]
  68. Vegan: Community Ecology Package. R package version 2.4-3; R Development Core Team: Vienna, Austria, 2017.
  69. Piao, S.; Fang, J.; Ciais, P.; Peylin, P.; Huang, Y.; Sitch, S.; Wang, T. The carbon balance of terrestrial ecosystems in China. Nature 2010, 458, 1009. [Google Scholar] [CrossRef] [PubMed]
  70. Joergensen, R.G. Fumigation-extraction Method to Estimate Soil Microbial Biomass: Calibration of the kEC Value. Soil Biol. Biochem. 1996, 28, 25–31. [Google Scholar] [CrossRef]
  71. Staley, C.; Unno, T.; Gould, T.J.; Jarvis, B.; Phillips, J.; Cotner, J.B.; Sadowsky, M.J. Application of illumina next eneration sequencing to characterize the bacterial community of the upper Mississippi river. J. Appl. Microbiol. 2013, 115, 1147–1158. [Google Scholar] [CrossRef] [PubMed]
  72. Fang, H.; Cheng, S.; Yu, G.; Zhu, T.; Zheng, J. Low-Rate Nitrogen Input can Change the Soil CH4 Uptake in an Alpine Meadow Ecosystem on Qinghai-Tibetan Plateau; American Geophysical Union: Washington, DC, USA, 2010. [Google Scholar]
  73. Párraga-Aguado, I.; González-Alcaraz, M.N.; López-Orenes, A.; Ferrer-Ayala, M.A.; Conesa, H.M. Evaluation of the environmental plasticity in the xerohalophyte zygophyllum fabago l. For the phytomanagement of mine tailings in semiarid areas. Chemosphere 2015, 161, 259–265. [Google Scholar] [CrossRef] [PubMed]
  74. Caporaso, J.G.; Lauber, C.L.; Walters, W.A.; Berglyons, D.; Huntley, J.; Fierer, N.; Owens, S.M.; Betley, J.; Fraser, L.; Bauer, M. Ultra-high-throughput microbial community analysis on the illumina hiseq and miseq platforms. ISME J. Multidiscip. J. Microb. Ecol. 2012, 6, 1621. [Google Scholar] [CrossRef] [PubMed]
  75. Caporaso, J.G.; Kuczynski, J.; Stombaugh, J.; Bittinger, K.; Bushman, F.D.; Costello, E.K.; Fierer, N.; Peña, A.G.; Goodrich, J.K.; Gordon, J.I. Qiime allows analysis of high-throughput community sequencing data. Nat. Methods 2010, 7, 335. [Google Scholar] [CrossRef] [PubMed]
  76. Cole, J.R.; Wang, Q.; Cardenas, E.; Fish, J.; Chai, B.; Farris, R.J.; Kulamsyedmohideen, A.S.; Mcgarrell, D.M.; Marsh, T.; Garrity, G.M. The ribosomal database project: Improved alignments and new tools for rRNA analysis. Nucleic Acids Res. 2008, 37 (Suppl. 1), D141–D145. [Google Scholar] [CrossRef] [PubMed]
  77. Castro, M.S.; Steudler, P.A.; Melillo, J.M.; Aber, J.D.; Bowden, R.D. Factors controlling atmospheric methane consumption by temperate forest soils. Glob. Biogeochem. Cycles 1995, 9, 1–10. [Google Scholar] [CrossRef]
  78. Smith, K.A.; Dobbie, K.E.; Ball, B.C.; Bakken, L.R.; Sitaula, B.K.; Hansen, S.; Brumme, R.; Borken, W.; Christensen, S.; Priemé, A. Oxidation of atmospheric methane in northern European soils, comparison with other ecosystems, and uncertainties in the global terrestrial sink. Glob. Chang. Biol. 2000, 6, 791–803. [Google Scholar] [CrossRef]
  79. Kiese, R.; Hewett, B.; Graham, A.; Butterbach-Bahl, K. Seasonal variability of N2O emissions and CH4 uptake by tropical rainforest soils of Queensland, Australia. Glob. Biogeochem. Cycles 2003, 17. [Google Scholar] [CrossRef]
  80. Zhang, T.; Zhu, W.; Mo, J.; Liu, L.; Dong, S. Increased phosphorus availability mitigates the inhibition of nitrogen deposition on CH4 uptake in an old-growth tropical forest, southern China. Biogeosciences 2011, 8, 2805–2813. [Google Scholar] [CrossRef]
  81. Samad, M.S.; Bertilsson, S. Seasonal variation in abundance and diversity of bacterial methanotrophs in five temperate lakes. Front. Microbiol. 2017, 8, 142. [Google Scholar] [CrossRef] [PubMed]
  82. Jena, J.; Ray, S.; Srichandan, H.; Das, A.; Das, T. Role of microorganisms in emission of nitrous oxide and methane in pulse cultivated soil under laboratory incubation condition. Indian J. Microbiol. 2013, 53, 92–99. [Google Scholar] [CrossRef] [PubMed]
  83. Shrestha, P.M.; Kammann, C.; Lenhart, K.; Dam, B.; Liesack, W. Linking activity, composition and seasonal dynamics of atmospheric methane oxidizers in a meadow soil. ISME J. 2011, 6, 1115–1126. [Google Scholar] [CrossRef] [PubMed]
  84. Born, M.; Dörr, H.; Levin, I. Methane consumption in aerated soils of the temperate zone. Tellus Ser. B-Chem. Phys. Meteorol. 1990, 42, 2–8. [Google Scholar] [CrossRef]
  85. Weishaar, J.L.; Aiken, G.R.; Bergamaschi, B.A.; Fram, M.S.; Fujii, R.; Mopper, K. Evaluation of specific ultraviolet absorbance as an indicator of the chemical composition and reactivity of dissolved organic carbon. Environ. Sci. Technol. 2003, 37, 4702–4708. [Google Scholar] [CrossRef] [PubMed]
  86. Lu, Y.H.; Wassmann, R.; Neue, H.U.; Huang, C.Y. Dynamics of dissolved organic carbon and methane emissions in a flooded rice soil. Soil Sci. Soc. Am. J. 2000, 64, 2011–2017. [Google Scholar] [CrossRef]
  87. Sullivan, B.W.; Selmants, P.C.; Hart, S.C. Does dissolved organic carbon regulate biological methane oxidation in semiarid soils? Glob. Chang. Biol. 2013, 19, 2149–2157. [Google Scholar] [CrossRef] [PubMed]
  88. Arai, H.; Hadi, A.; Darung, U.; Limin, S.H.; Hatano, R.; Inubushi, K. A methanotrophic community in a tropical peatland is unaffected by drainage and forest fires in a tropical peat soil. Soil Sci. Plant Nutr. 2014, 60, 577–585. [Google Scholar] [CrossRef]
  89. He, R.; Wooller, M.J.; Pohlman, J.W.; Quensen, J.; Tiedje, J.M.; Leigh, M.B. Shifts in identity and activity of methanotrophs in arctic lake sediments in response to temperature changes. Appl. Environ. Microbiol. 2012, 78, 4715–4723. [Google Scholar] [CrossRef] [PubMed]
Figure 1. Map of the study areas. Baotianman National Natural Reserve in Neixiang County, Henan Province (left) and Jianfengling National Natural Reserve in Ledong County, Hainan Province (right), China.
Forests 09 00204 g001
Figure 2. Annual average CH4 fluxes (A) and their seasonal variation (B) at TBDF-BTM and TRF-JFL. Negative numbers indicate net CH4 uptake by the soil. Data are annual means ± standard error. Data for CH4 fluxes are means ± standard errors of five replicate plots at the two sites from September 2015 to June 2016. Different capital letters represent significant differences at TBDF-BTM. Different lowercase letters indicated significant differences at TRF-JFL (p < 0.05). TBDF-BTM, temperate broad-leaved deciduous forest at Baotianman Nature Reserve; TRD-JFL, tropical rainforest at Jianfengling National Natural Reserve.
Forests 09 00204 g002
Figure 3. Redundancy analysis (RDA) was used to correlate bacterial communities with environmental factors at the two sites. RS1, RS2, RS3, and RS4 represent September and December 2015 and March and June 2016 at TBDF-BTM, respectively. RS5, RS6, RS7, and RS8 represent September and December 2015 and March and June 2016 at TRF-JFL, respectively.
Forests 09 00204 g003
Figure 4. Good coverage analysis at TBDF-BTM and TRF-JFL. RS1, RS2, RS3, and RS4 represent September and December 2015 and March and June 2016 at TBDF-BTM, respectively. RS5, RS6, RS7, and RS8 represent September and December 2015 and March and June 2016 at TRF-JFL, respectively.
Forests 09 00204 g004
Figure 5. Bacterial community composition at the class level at the two sites (TBDF-BTM, TRF-JFL). The class Proteobacteria is represented by Alpha-, Beta-, Gamma-. RS1, RS2, RS3, and RS4 represent September and December 2015 and March and June 2016 at TBDF-BTM, respectively. RS5, RS6, RS7, and RS8 represent September and December 2015 and March and June 2016 at TRF-JFL, respectively.
Forests 09 00204 g005
Figure 6. Relative abundances of Candidatus Methylacidiphilum, Methylotenera, Methylobacterium, and Methylovirgula at TBDF-BTM and TRF-JFL. (A) RS1, RS2, RS3, and RS4 represent September and December 2015 and March and June 2016 at TBDF-BTM, respectively. (B) RS5, RS6, RS7, and RS8 represent September and December 2015 and March and June 2016 at TRF-JFL, respectively. Different letters mean significant difference at p < 0.05.
Forests 09 00204 g006
Table 1. Correlations (Pearson’s correlation coefficients) among CH4 fluxes and soil properties at sites.
VariableTBDF-BTM CH4 FluxTRF-JFL CH4 Flux
WC0.3350.077
T−0.407−0.147
pH−0.2570.085
WFPS0.459 *−0.06
TC−0.448 *−0.181
TN−0.2920.034
NH4+-N−0.0270.214
NO3-N0.162−0.232
MBC0.522 *0.35
DOC−0.175−0.032
MBN0.0250.026
Asterisks indicate significant differences between two sites in the same month (*, p < 0.05). WC, water content; T, temperature; WFPS, water-filled pore space; TC, total carbon; TN, total nitrogen; NH4+-N, ammonium nitrogen; NO3-N, nitrate nitrogen; MBC, microbial biomass carbon; DOC, dissolved organic carbon; MBN, microbial biomass nitrogen.
Table 2. Correlations (Pearson’s correlation coefficients) among CH4 fluxes, methanotrophs, methylotrophs abundances at two sites.
Bacterial Abundance Associated with CH4TBDF-BTM CH4 FluxTRF-JFL CH4 Flux
Candidatus Methylacidiphilum−0.126−0.236
Methylotenera−0.124−0.183
Methylobacterium−0.206−0.027
Methylovirgula−0.188−0.194
Table 3. Soil physicochemical properties at TBDF-BTM and TRF-JFL during different seasons.
Soil PropertySiteSeptember (2015)December (2015)March (2016)June (2016)
Water content (%)BTM33.7 ± 2.5ab41.5 ± 2.8a28.6 ± 1.5b21.9 ± 1.9c
JFL26.4 ± 1.6a22.4 ± 0.6b22.2 ± 2.0ab21.2 ± 2.9b
Temperature (°C)BTM12.6 ± 0.6b−0.6 ± 2.2d6.4 ± 1.2c17.0 ± 0.5a
JFL22.5 ± 0.1b17.7 ± 0.2c17.2 ± 0.3c24.7 ± 0.1a
pHBTM4.7 ± 0.1b4.1 ± 0.2c5.1 ± 0.1a5.2 ± 0.1a
JFL4.9 ± 0.0b4.2 ± 0.1c5.1 ± 0.1ab5.3 ± 0.1a
WFPS (%)BTM37.2 ± 3.6b51.9 ± 3.8ab50.3 ± 4.3b60.4 ± 2.9a
JFL52.5 ± 1.7a43.6 ± 3.0b34.1 ± 1.2c41.9 ± 1.9b
TC (g/kg)BTM32.3 ± 2.9c77.4 ± 8.0a61.3 ± 2.5b62.0 ± 1.6b
JFL40.0 ± 1.6c43.6 ± 3.5c62.2 ± 3.2b121.5 ± 5.7a
TN (g/kg)BTM2.29 ± 0.15c3.84 ± 0.33b4.21 ± 0.22ab4.74 ± 0.30a
JFL2.45 ± 0.15a2.29 ± 0.07a2.24 ± 0.03a2.34 ± 0.06a
NH4+-N (mg/kg)BTM13.5 ± 0.7a11.3 ± 2.9ab8.1 ± 0.4b7.3 ± 0.8b
JFL20.0 ± 4.7a8.9 ± 0.5a12.1 ± 5.2a14.1 ± 3.6a
NO3-N (mg/kg)BTM2.6 ± 0.2a2.1 ± 0.2ab1.6 ± 0.2b1.0 ± 0.1b
JFL5.6 ± 1.0a5.9 ± 1.2a1.1 ± 0.3b5.7 ± 0.8a
MBC (g/kg)BTM0.54 ± 0.08a0.54 ± 0.15a0.35 ± 0.08a0.36 ± 0.09a
JFL0.40 ± 0.04b0.71 ± 0.08a0.51 ± 0.05ab0.31 ± 0.09b
DOC (g/kg)BTM1.62 ± 0.17a1.84 ± 0.14a1.61 ± 0.12a1.62 ± 0.05a
JFL1.50 ± 0.31a1.36 ± 0.05a0.34 ± 0.03b0.53 ± 0.04b
MBN (mg/kg)BTM43.5 ± 6.8b171.0 ± 52.4a190.7 ± 36.95a83.8 ± 35.6ab
JFL126.4 ± 40.3b85.4 ± 21.3b219.4 ± 16.8a89.4 ± 13.5b
Different letters indicate significant difference between different months at the same site (p < 0.05). WC, water content; T, temperature; WFPS, water-filled pore space; TC, total carbon; TN, total nitrogen; NO3-N, nitrate nitrogen; MBC, microbial biomass carbon; DOC, dissolved organic carbon; MBN, microbial biomass nitrogen.

