Article

Forest Plantations’ Externalities: An Application of the Analytic Hierarchy Process to Non-Industrial Forest Owners in Central Chile

1
Department Land, Environment, Agriculture and Forestry (TESAF), Università di Padova, Agripolis, Via dell’Università 16, 35020 Legnaro, PD, Italy
2
Department of Economics and Institute of Applied Regional Economics (IDEAR), Universidad Católica del Norte, Av. Angamos 0610, Antofagasta 1240000, Chile
3
Department of Social Sciences, School of Sociology and Centro de Estudios Urbano Territoriales (CEUT), Universidad Católica del Maule, Av. San Miguel 3605, Talca 3460000, Chile
*
Author to whom correspondence should be addressed.
Forests 2018, 9(3), 141; https://doi.org/10.3390/f9030141
Submission received: 6 December 2017 / Revised: 27 February 2018 / Accepted: 13 March 2018 / Published: 15 March 2018
(This article belongs to the Section Forest Economics, Policy, and Social Science)

Abstract

:
The forestry sector in Chile has an important role in the domestic economy, being the second leading export sector after the mining industry. Investments in forest plantations have grown in the last 40 years thanks to implementation of the Decree Law 701. Planted forests currently account for 17.4% of the total national forest cover. The objective of the study is to analyse non-industrial forest owners’ perceptions of positive and negative externalities of forest plantations in four less developed municipalities of the Maule Region. We implemented a literature review, the estimation of an Expert’s Response Indicator (ERI), and the implementation of an Analytic Hierarchy Process (AHP) methodology for the analysis. The results indicate that non-industrial forest owners in the four municipalities perceive the importance of each externality in a different way according to their territorial specificities. However, considering the whole study area, “CO2 sequestration”, “improvement of livelihood”, and “more importance of small and medium forest owners” were considered the most important positive externalities, while the most relevant negative externalities were “water shortage”, “power asymmetry”, and “land loss”. The study encourages further research with a similar detailed analysis on stakeholders’ perceptions of plantation projects, both to revise investment features and inform local stakeholders on their real impacts.

1. Introduction

As stated by Sargent and Bass [1], industrial plantations can become, in the best cases, a major asset for local development by providing raw materials, infrastructure, employment, income, and environmental and recreational services. In the worst cases, plantations, imposed with a ‘top-down’ perspective and ignoring local needs, values, and rights, have induced farmland shortage in times of food scarcity, have reduced wild animal and plant populations, and have destroyed habitats and landscapes.
In Chile, the forestry sector has seen fast development in the past 40 years, due to the expansion of industrial forest plantations of exotic species, after a decreasing trend of forests cover and growing stocks in the previous three centuries [2]. This trend inversion started in the 1970s during the military dictatorship when forest plantations of exotic species (mainly Pinus radiata D. Don, Eucalyptus globulus Labill., and Eucalyptus nitens Deane & Maiden [3]) spread throughout central and southern areas of the country to the detriment of native forests. According to the analysis by Lara and Veblen [4], thousands of hectares of natural forests were replaced by plantations and although several policies were designed to prevent such conversion, this practice is still continuing, even if at a lower rate [5]. As stated by Cossalter and Pye-Smith [6], in Chile, 31% of native forests in the coastal region were converted to plantations between 1978 and 1987; nationwide, the expansion of agriculture and pasture has been, and still is, the main cause of native forest conversion. Plantations have increased prosperity, albeit at the expense of some of the country’s natural forests and some local communities. The massive expansion of forest production and of the wood-working industry has gained the sector a relevant role in the national economy [7] and a world leadership positioning in the wood market [8].
In 1974, the Decree Law no. 701 (DL 701/74) was promulgated with the aim of regulating forest management, supporting plantations, and reclaiming “agricultural and degraded lands”, mainly through the public financing of 75% to 90% of total plantation establishment costs [9]. The law had a remarkable impact on the sector and led to a fast process of land privatization and concentration, inverting a process that had been started by the previous government with the agrarian reform [10]. Because of this accelerated industrial development, the Chilean forestry sector nowadays accounts for 2.7% of total national GDP, with a turnover of $5414 millions in 2015, an 8.7% share of total exports, which makes it the second leading export sector in the country [3].
The most relevant characteristics of the sector as it is shaped nowadays are:
  • a very strong land concentration in which almost half of forest plantations and much of the national wood production and export are controlled by three large private companies [11]. The two national enterprises Arauco and CMPC (Compañía Manufacturera de Papeles y Cartones) possess 33.1% and 17.4% of the forest plantations surface, respectively, while Masisa, an international enterprise, owns 1.7% of Chilean forest plantations (own elaboration [12,13,14]). The contribution of the three companies to exports is 49.7% for Arauco, 15.7% for CMPC, and 8.7% for Masisa [15];
  • at the same time, because of the economic concentration, these firms exert their market power over price (forest products and land) and wages. In this way, small and medium forest owners are negatively affected by the resulting market distortions inasmuch as they became less competitive [5].
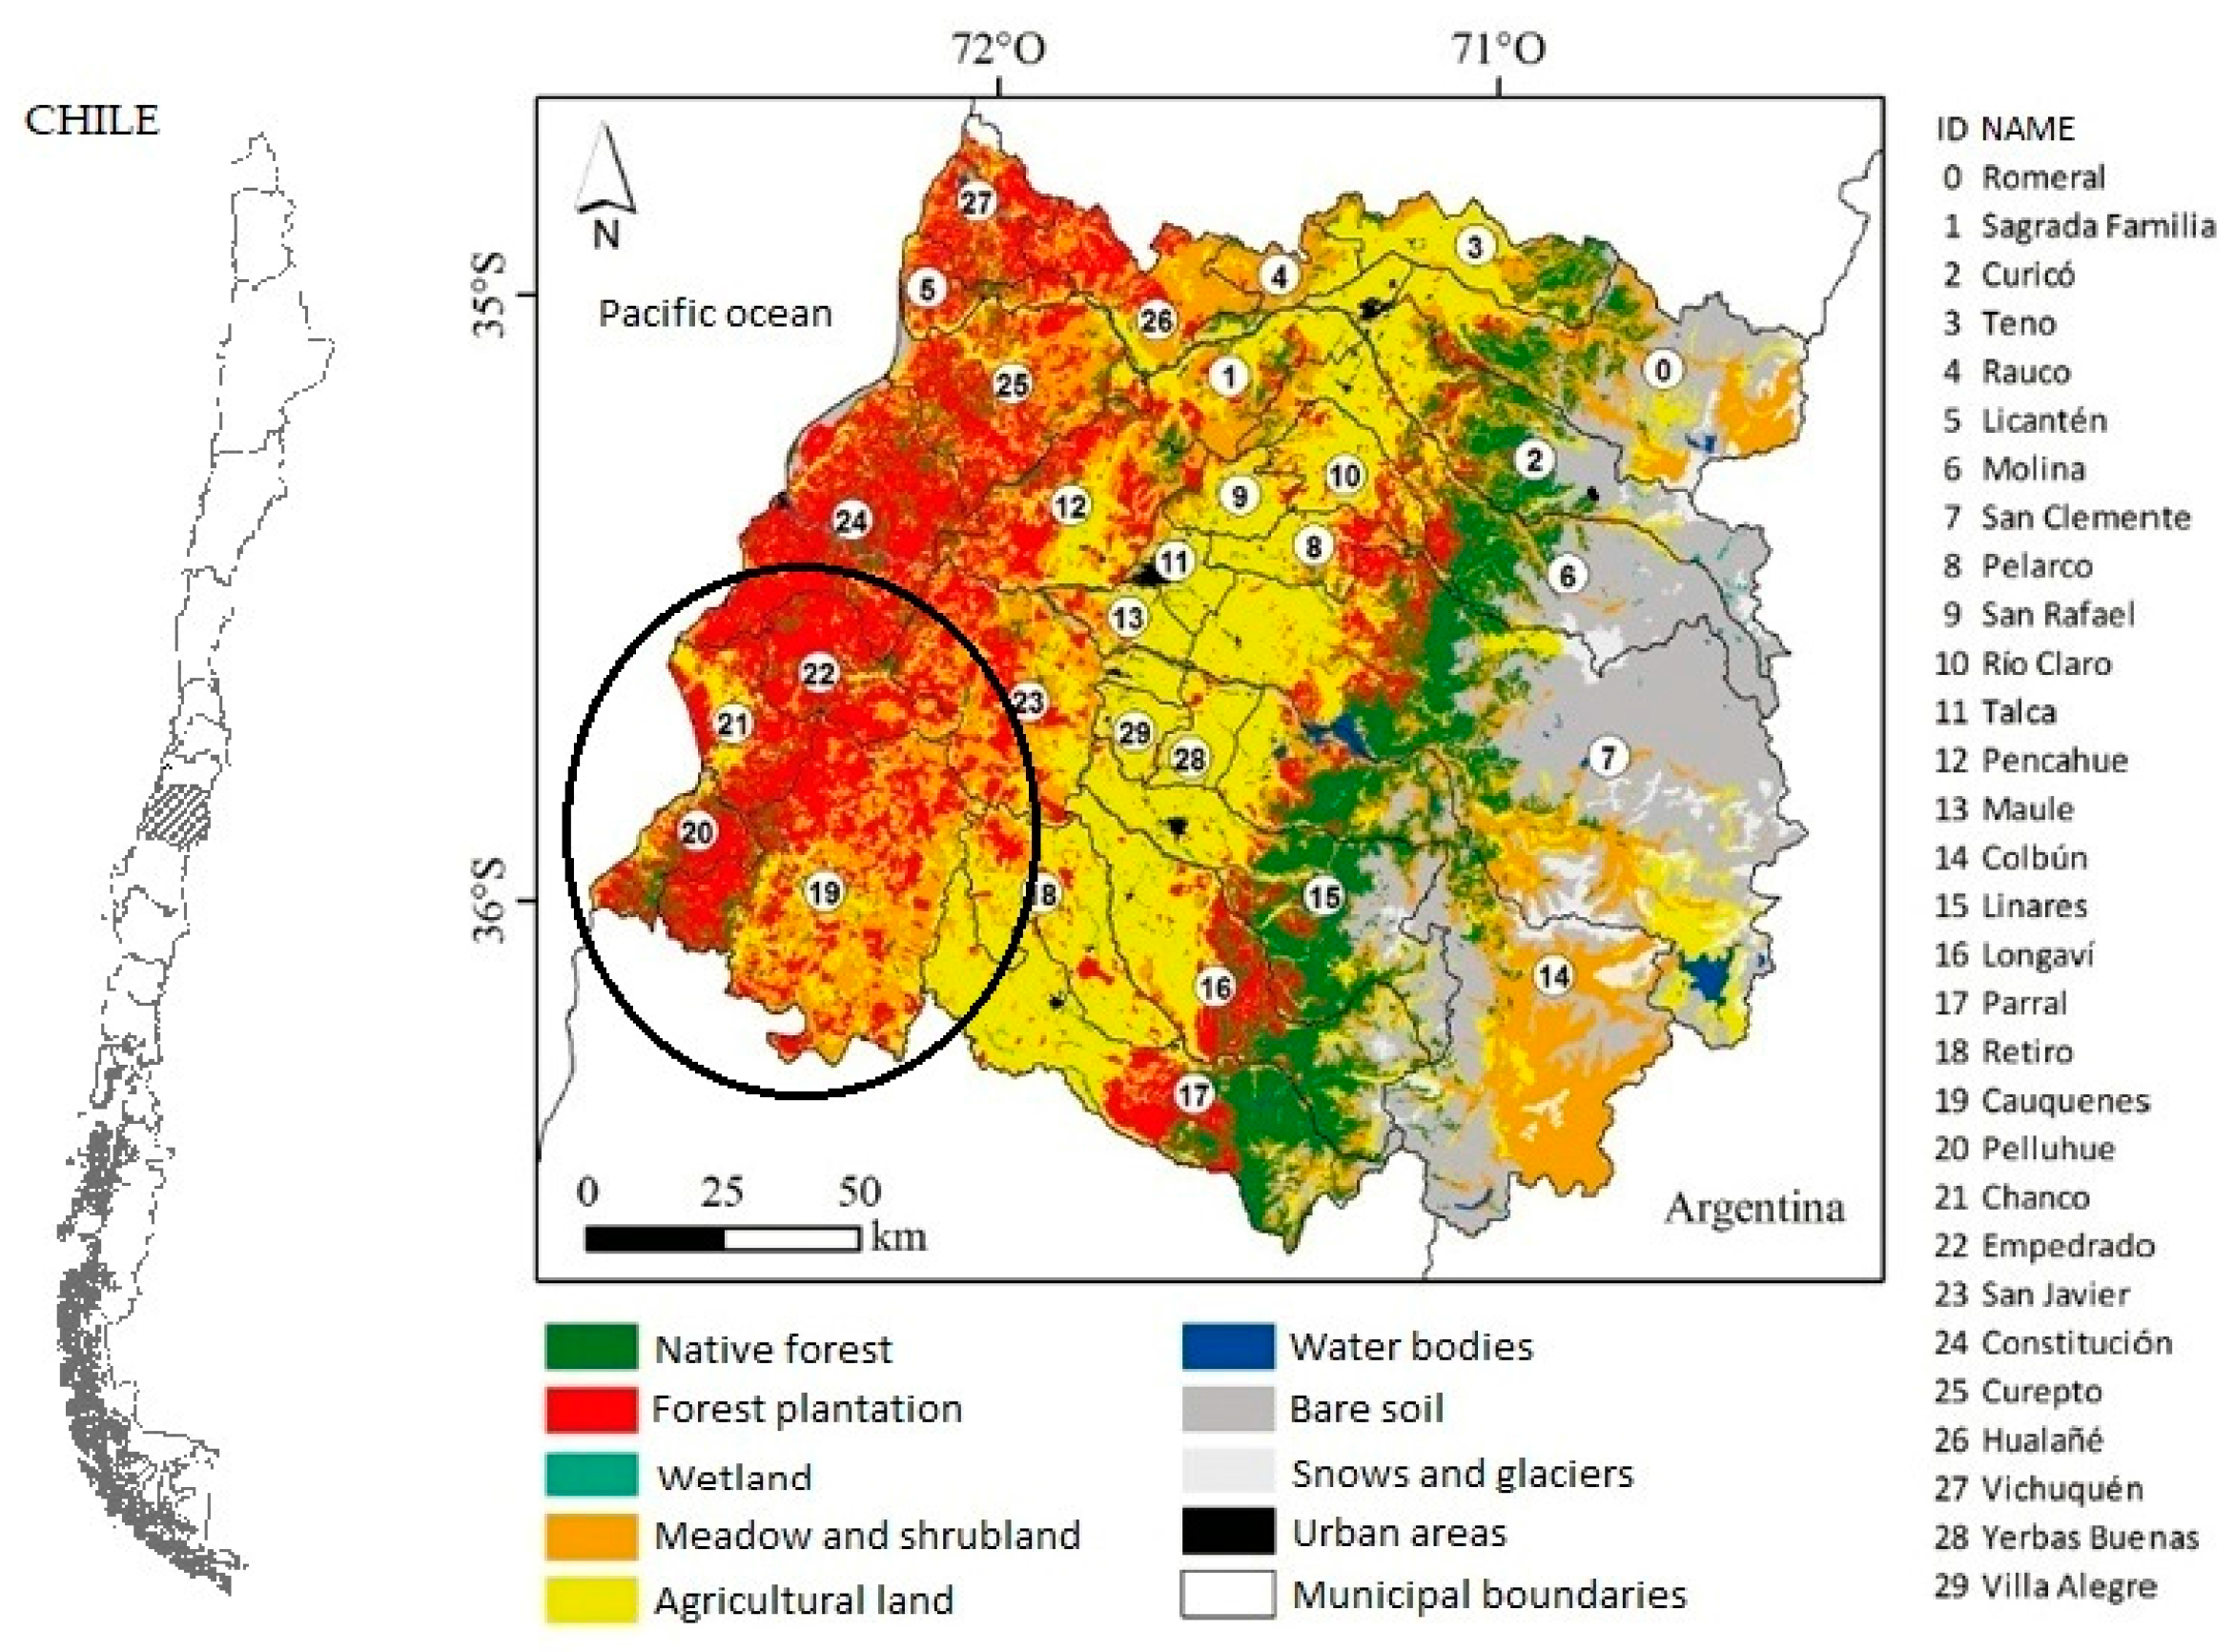
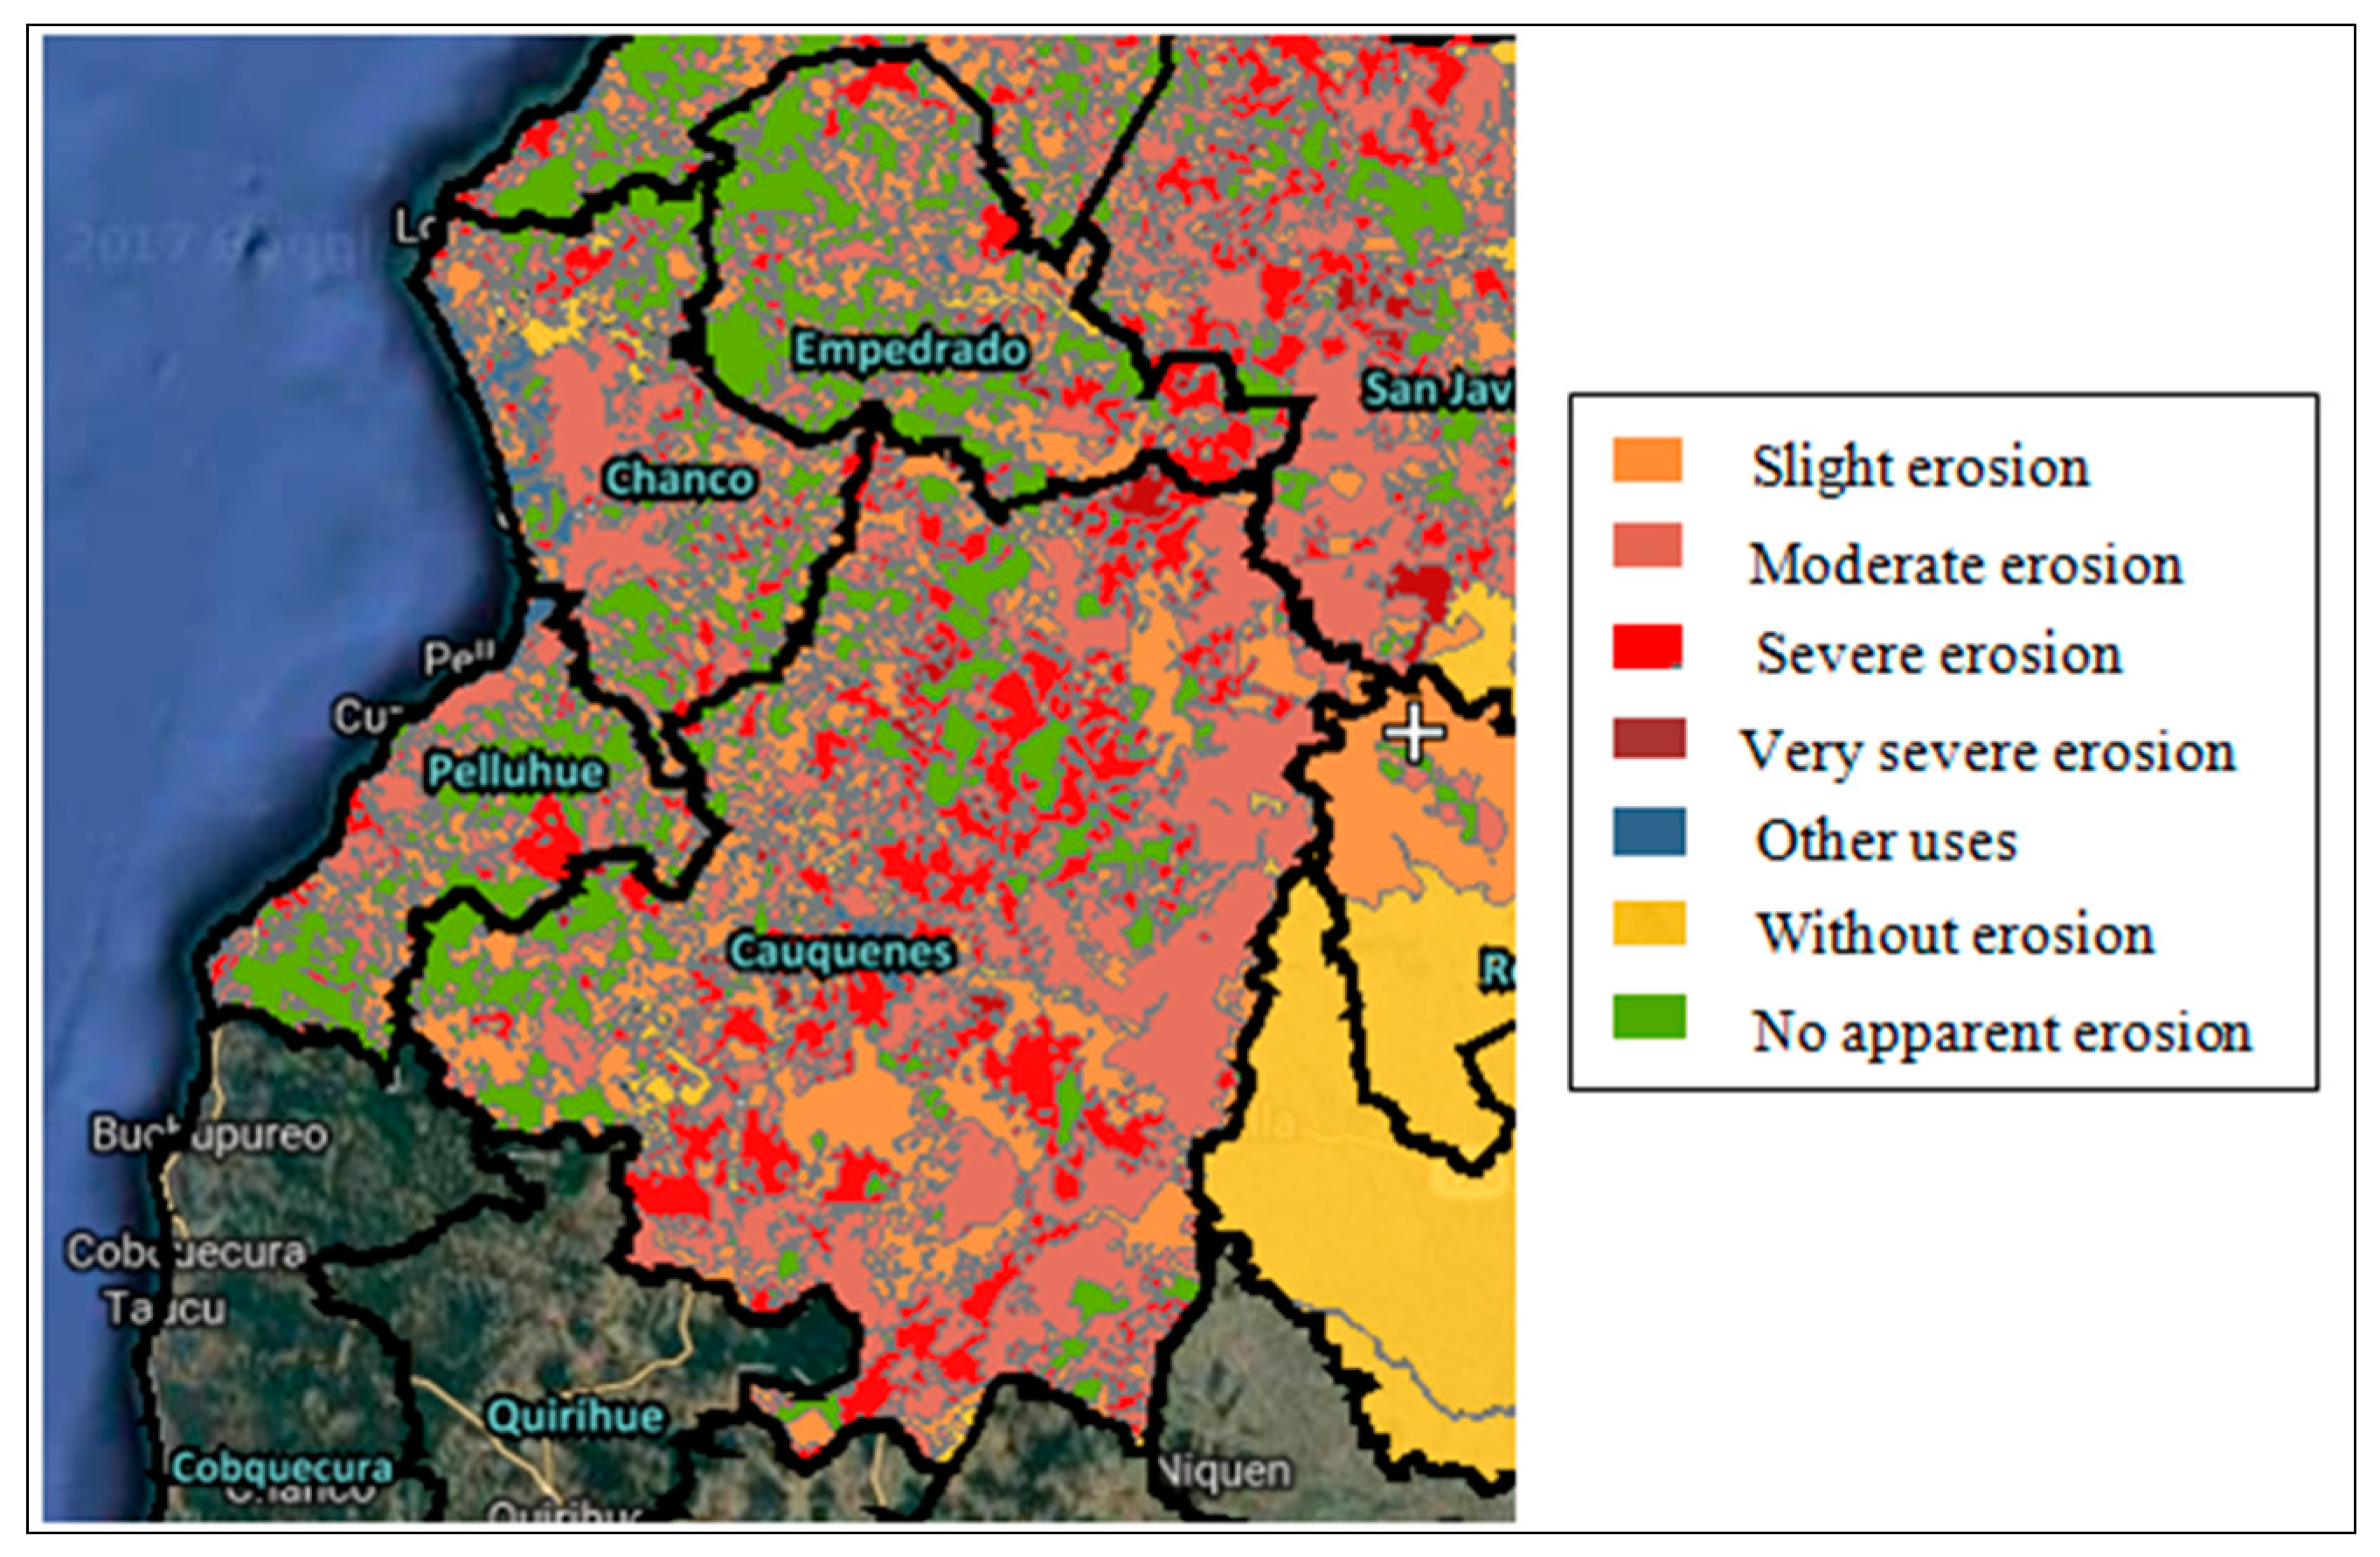
During the dictatorship, the regime privatised most forest plantations and companies [16], so that productive forests owned by the Chilean State are minimal. The preponderance of State-owned forests is in National Parks, National Reserves, and Natural Monuments.
This investigation would like to contribute to the studies done in the last decades that attempted to analyse the development of private large-scale investments in the forestry sector, trying to assess the positive and negative effects in established industrial forest plantations. Many of these studies only focused on environmental impacts [17,18,19], while socio-economic impacts were just reported in some areas where specific conflicts occurred, e.g., Mapuche conflicts [20,21] or were only marginally described while dealing with other issues [10,11,22,23]. Only a few studies tried to analyse the social-economic effects of forest plantations in no-conflict zones [5,24].
The aim of this article is to analyse the perception of positive and negative externalities of forest plantations with exotic species in four less developed municipalities of Maule Region in Central Chile. It has been done by highlighting the environmental, social, and economic responsibilities of large forest investments as perceived by small and medium forest owners. An ex-post analysis was implemented.
The paper proceeds as follows: Section 2 describes the study area. A description of the different steps of the methodological approach is given in Section 3. The results are presented and discussed in Section 4. Finally, conclusions and suggestions for further research are put forward in Section 5.

2. Study Area

The study area is located within the Maule Region of Central Chile (VII region, 35°25′36″ S, 71°39′78″ W). The most common land uses are grassland and shrublands (24.6%), followed by agricultural land (22.0%) and forest plantations (20.0%). Native forest covers 12.7% of the regional land. With 20.0% of its land covered by artificial forests, the Maule Region is the third region at the national level for forest plantations [25]. The region is characterized by the predominance of small-sized holdings, smaller than 20 ha. In fact, these represent 74.0% of the total, involving 5.9% of the utilized land. Instead, only 6.7% of total holdings are properties bigger than 100 ha, but they cover 81.7% of the utilized surface [26].
The case study (Figure 1) comprises three municipalities in the Cauquenes Province (Cauquenes, Chanco and Pelluhue) and the municipality of Empedrado (Talca Province).
The area is located on the coastal range in the south-west of the region and extends for 3682 km2. These municipalities represent the less developed part of the region. The total population is about 64,513 inhabitants [27]. The forest cover of the study area is described in Table 1.
The concentration of forest plantations on the coastal mountain range is the result of past forest policies. In the mid-20th century, a wheat-cropping boom led to the clearcutting of extensive native forest areas, mainly in the western region [28], to create farmland. Later, thanks to the bonus given by the law no. 701, almost all the degraded lands resulting from intensive cropping practices were re-forested with exotic species, mainly pine and eucalyptus. The result of this plantation expansion is shown in Figure 1, where forest cover distribution in the region and a clear pattern of plantations establishment can be identified. Another important environmental feature in the area is the current state of soil erosion, highlighted in Figure 2. This information (Figure 1 and Figure 2) and the data in Table 2 are useful in order to understand the outcome of this research, and they are commented on in Section 4.
In the study area, a governmental project called Zona Rezagadas (less developed area) started in 2014 with the aim of decreasing the territorial social inequalities. The number of enterprises divided by economic sector and number of workers employed in each sector are presented in Table 2.

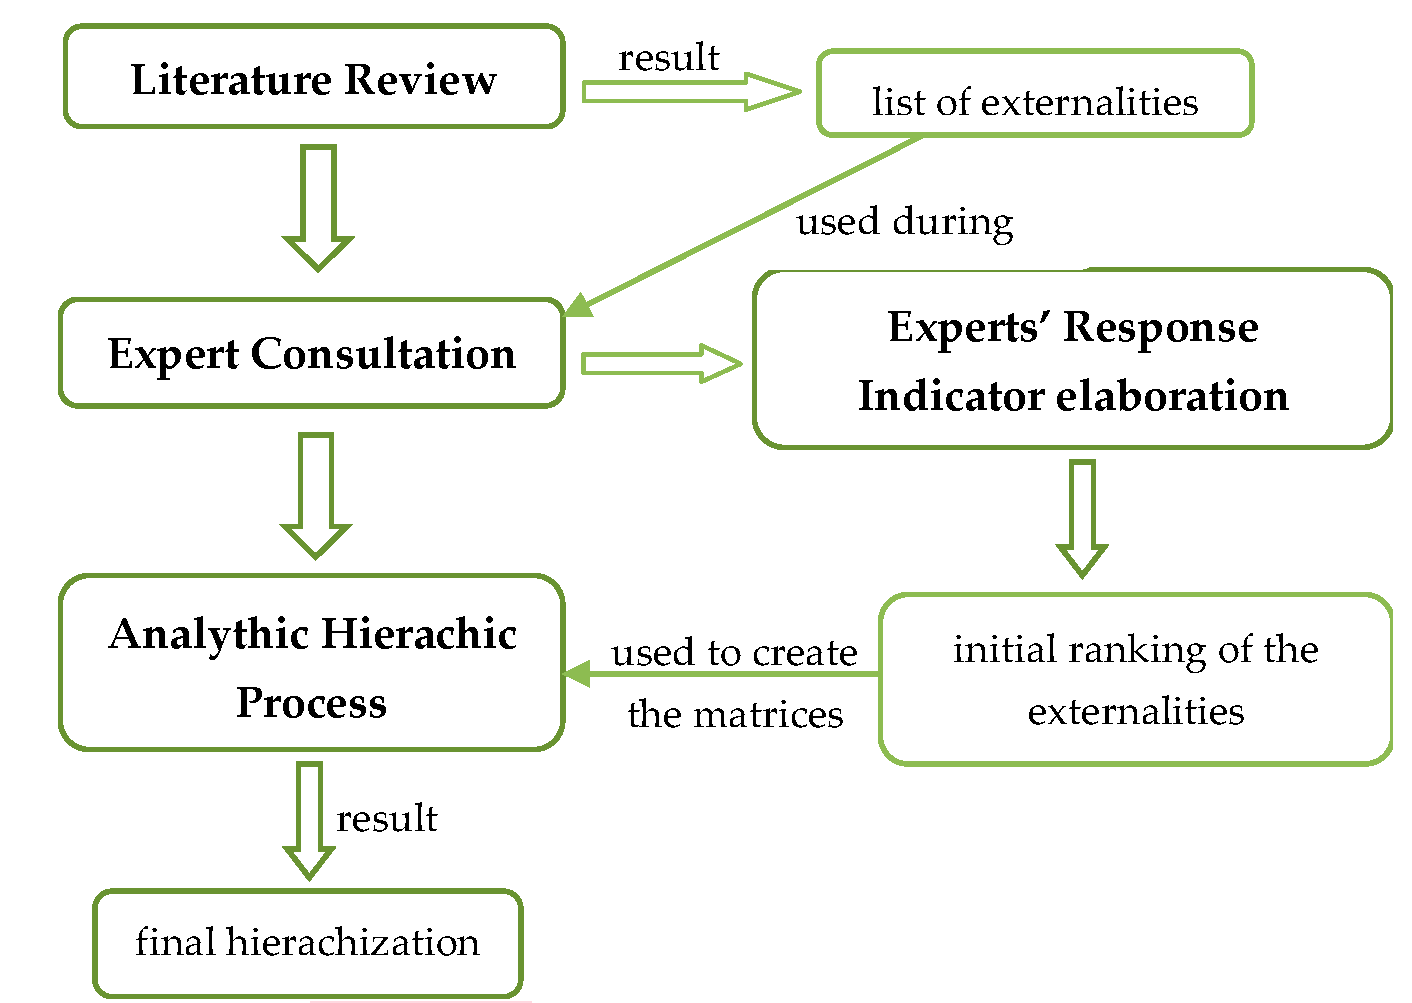
3. Research Methodology

Given the lack of studies describing and analyzing the externalities connected to forest plantations, a research methodology implemented in four phases is proposed. Results of each phase are inputs for the next steps. The different phases are shown in the following figure (Figure 3).

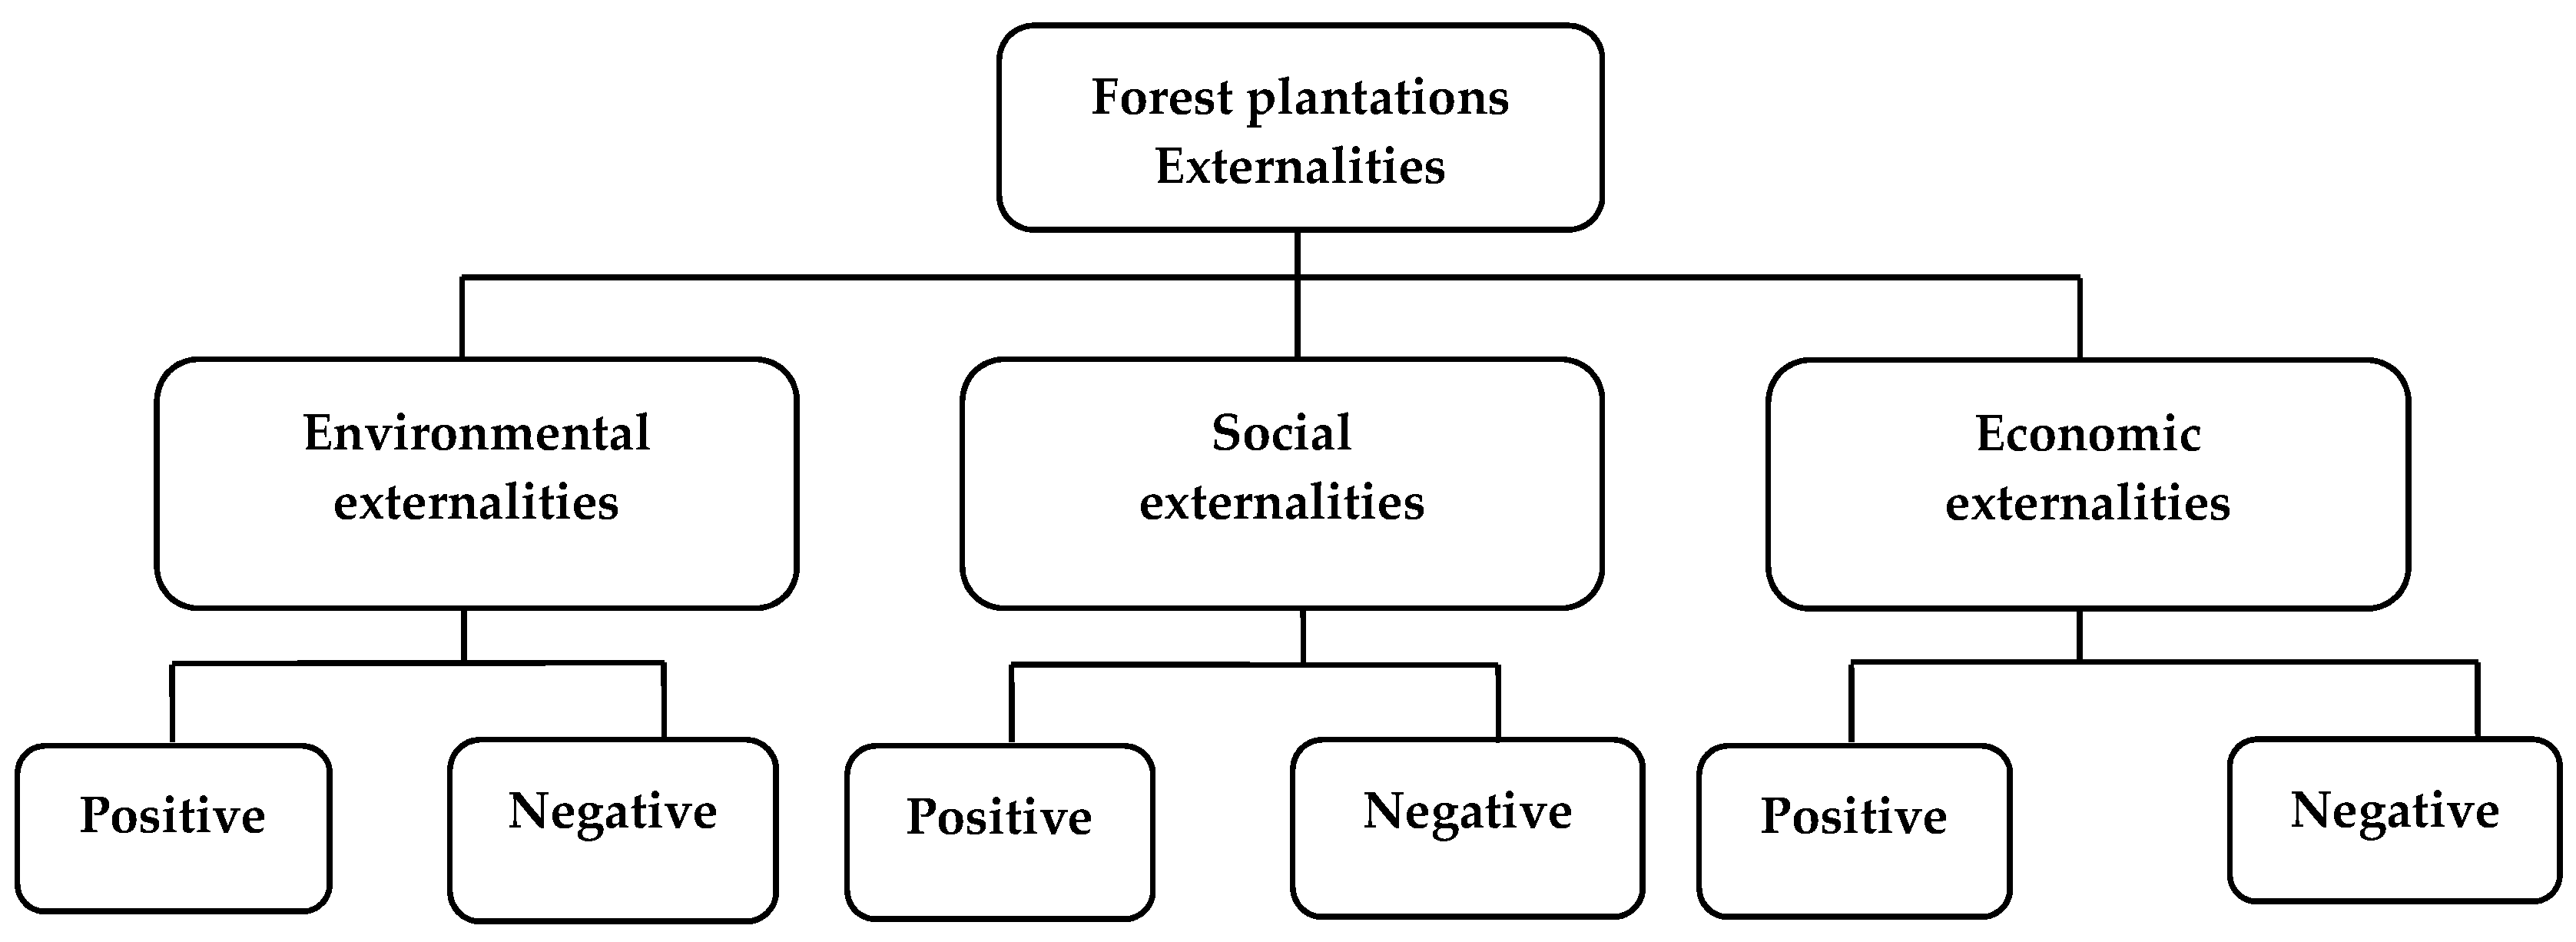
3.1. Preliminary Identification of Externalities

A first phase was the identification of all potential positive and negative externalities related to forest plantation investments. An extensive literature review was done to systematize the information on the topic related to the impact analysis of industrial forest plantations in Chile and in other countries with a focus on externalities evaluation. The bibliographic databases consulted were Scopus, Web of Science, ResearchGate, SciELO, and Science Direct. The externalities found were divided into the traditional three categories of sustainable management: environmental, social, and economic.

3.2. Experts Consultation

The main goals of this phase were to verify if all the possible externalities had been taken into consideration during the literature review and to obtain an initial hierarchization of the externalities in the study area. With a convenience sampling approach, a panel of 18 experts deriving from the academic, public, and private sector was identified and contacted by email. Fifteen of them replied, giving a response rate of 83.3%. Within the public sector, five people belonging to the two public forestry institutions were involved (CONAF and INFOR). The director of a development project implemented in the study area (Programa de Desarrollo Territorial para Zonas Rezagadas in Spanish) was also contacted. The private sector comprises ARAUCO, one of the three big enterprises that dominate the Chilean forestry market, CORMA, a trade association that represents the national private forest sector and OLCA, an institution that operates advising communities when environmental conflicts occur. Finally, from the academic sector, six professors at local universities and the director of an interdisciplinary project dealing with a social and environmental topic (Proyecto Anillo Soc1404) were consulted.
To be more efficient in terms of time and economic resources, an anonymous on-line questionnaire was used (the Spanish version of the questionnaire is available in the Supplementary Materials). Experts were asked to indicate their perception regarding the importance of each externality in the study area through utilization of the Likert scale from 0 (not important) to 5 (very important). At the end of the questionnaire, a final open question asked if there were any other externalities that could be added. The data was collected from the 1 to 11 August 2016.

3.3. Experts’ Response Indicator Elaboration

For each externality, an indicator, called the Experts Response Indicator (ERI), was computed based on the following formula [32]:
E R I = ( i = 1 n m a r k i × p i M a x M a r k × p T O T ) × 100     with   p T O T = 15 ,     M a x M a r k = 5
where marki indicates the specific value on the Likert scale chosen by each expert for the single externalities, pi refers to the number of experts that chose it, MaxMark represents the highest number on the Likert scale, and pTOT represents the number of total respondents. The indicator represents the relative importance of each externality.
To verify the reliability of the data collected, the Cronbach’s Alpha Coefficient [33] was calculated as suggested by Gliem and Gliem [34]. The open source software R version 3.1.3 was used to compute it. The value of alpha (α) varies from 0 to 1. Higher values of α mean a greater consistency of the data. To confirm that the dataset is reliable, the recommended value for basic researches is α > 0.8 [35]. It is also important to underline that the number of values used in the Likert-scale format is not a factor that influences the reliability of the outcomes [36].

3.4. Forest Owners’ Perception Estimated with the Analytic Hierarchy Process (AHP) Technique

The AHP technique was developed by Thomas L. Saaty in the 1970s and it is mainly used to support the decision making process under agents with different criteria. It allows complex decisions to be organised and analysed weighting “a set of activities according to their importance” [37], combining both qualitative and quantitative information and creating a rank of the alternatives [38]. As stated in this paper, the AHP method “is applied in many and different research fields, including nature, economy and society”. Recent applications of the AHP method in forestry involve, among other issues, forest road assessment [39], evaluation of non-wood forest products [40], analysis of forest fire risk [41], and ranking of indicators of sustainability [42].
Through convenience sampling, 25 forest owners were interviewed in each municipality for a total of 100. Random sample methods were impossible to implement because of a dearth of complete information about forest owners and their proprieties. However, the final sample maintains a certain variability concerning the main features of forest owners, such as landholding, forest plantation surface, tree species used in the forestation, kind of products obtained from plantation, types of other economic activities carried out on the property, and percentage of their income deriving from exploitation of the forest plantation, etc. Data were collected implementing the AHP method, and the questionnaire is available in the Supplementary Materials. The interviews were conducted from September to November 2016.
The AHP application follows several steps [43]. Since this method works by basically comparing pairs of elements belonging to the same conceptual level, the first step is to identify and divide the different levels, developing the hierarchical model that will be used. In this study, the levels correspond to the categories already mentioned (positive, negative, environmental, social, and economic). The rationale of the externalities classification is related to the consolidated definition of criteria and indicators for sustainable forest management [44]. For each category, in order to facilitate the fieldwork, only the first four externalities resulting from the experts’ consultation have been taken into consideration (Figure 4).
The second step consists of designing a judgemental matrix for each level that allows the pair-wise comparison among the single elements. It was decided that 4 × 4 matrices would be used according to the smallest number of externalities found during the literature review and the possible difficulties for the fieldwork. The homogenization of the size of the matrices avoided the possible influence on interviewees’ answers given by the higher or lower presence of externalities in one category compared to the others. Moreover, the utilization of 4 × 4 matrices allowed smaller matrices that turned out to be easier to elaborate. The specific question used to do the pairwise comparisons was: ‘Which of the following externalities of extensive and exotic forest plantation have a greater importance’ The scale used was suggested by Saaty [45] and is based on nine points that transform verbal judgment into a numerical value. After compiling the matrices, the third step concerns the final hierarchization and the analysis of the consistency of the answers for each matrix [37]. Because of the impossibility of discussing the results of the final hierarchization with all the interviewees, it is necessary to compute an aggregate matrix by using the geometric mean:
A i j = 1 n a i j n n .
where Aij is the result of the answers’ integration for elements i and j of the matrix, n is the number of interviewees, and a i j n represents the interviewee’s opinion about the pair of considered elements. To estimate the priority among the criteria and their relative weight, it is necessary to calculate the priority vector ( P V ), represented by the eigenvector of the aggregate matrix obtained by calculating the geometric mean of the original matrix. Besides the answers analysis, the consistence of the judgmental matrices should be calculated through the Consistency Ratio (CR, [45]):
C R = C I R I
where CI represents the Consistency Index and RI the Random Index. The dataset is considered consistent if the final value of CR is less than or equal to 10% (CR ≥ 0.1). The AHP technique was selected given its flexibility and intuitive appeal for decision makers [43]; however, it presents certain weakness such as: ranking irregularities [46] and artificial limitation of nine-point scale [47], among others [48].

4. Results and Discussion

4.1. Preliminary Identification of Externalities

A total of 33 papers presenting empirical externalities evaluation in plantation investments were found (Appendix A). The most frequent species considered in the reviewed literature are Pinus spp. and Eucalyptus spp., followed by Acacia spp., oil palm (Elaeis guineensis Jacq.) and rubber (Hevea brasiliensis Müll.Arg.). Among the impacts identified by these studies, the best represented are the social, more specifically on households, and environmental ones.

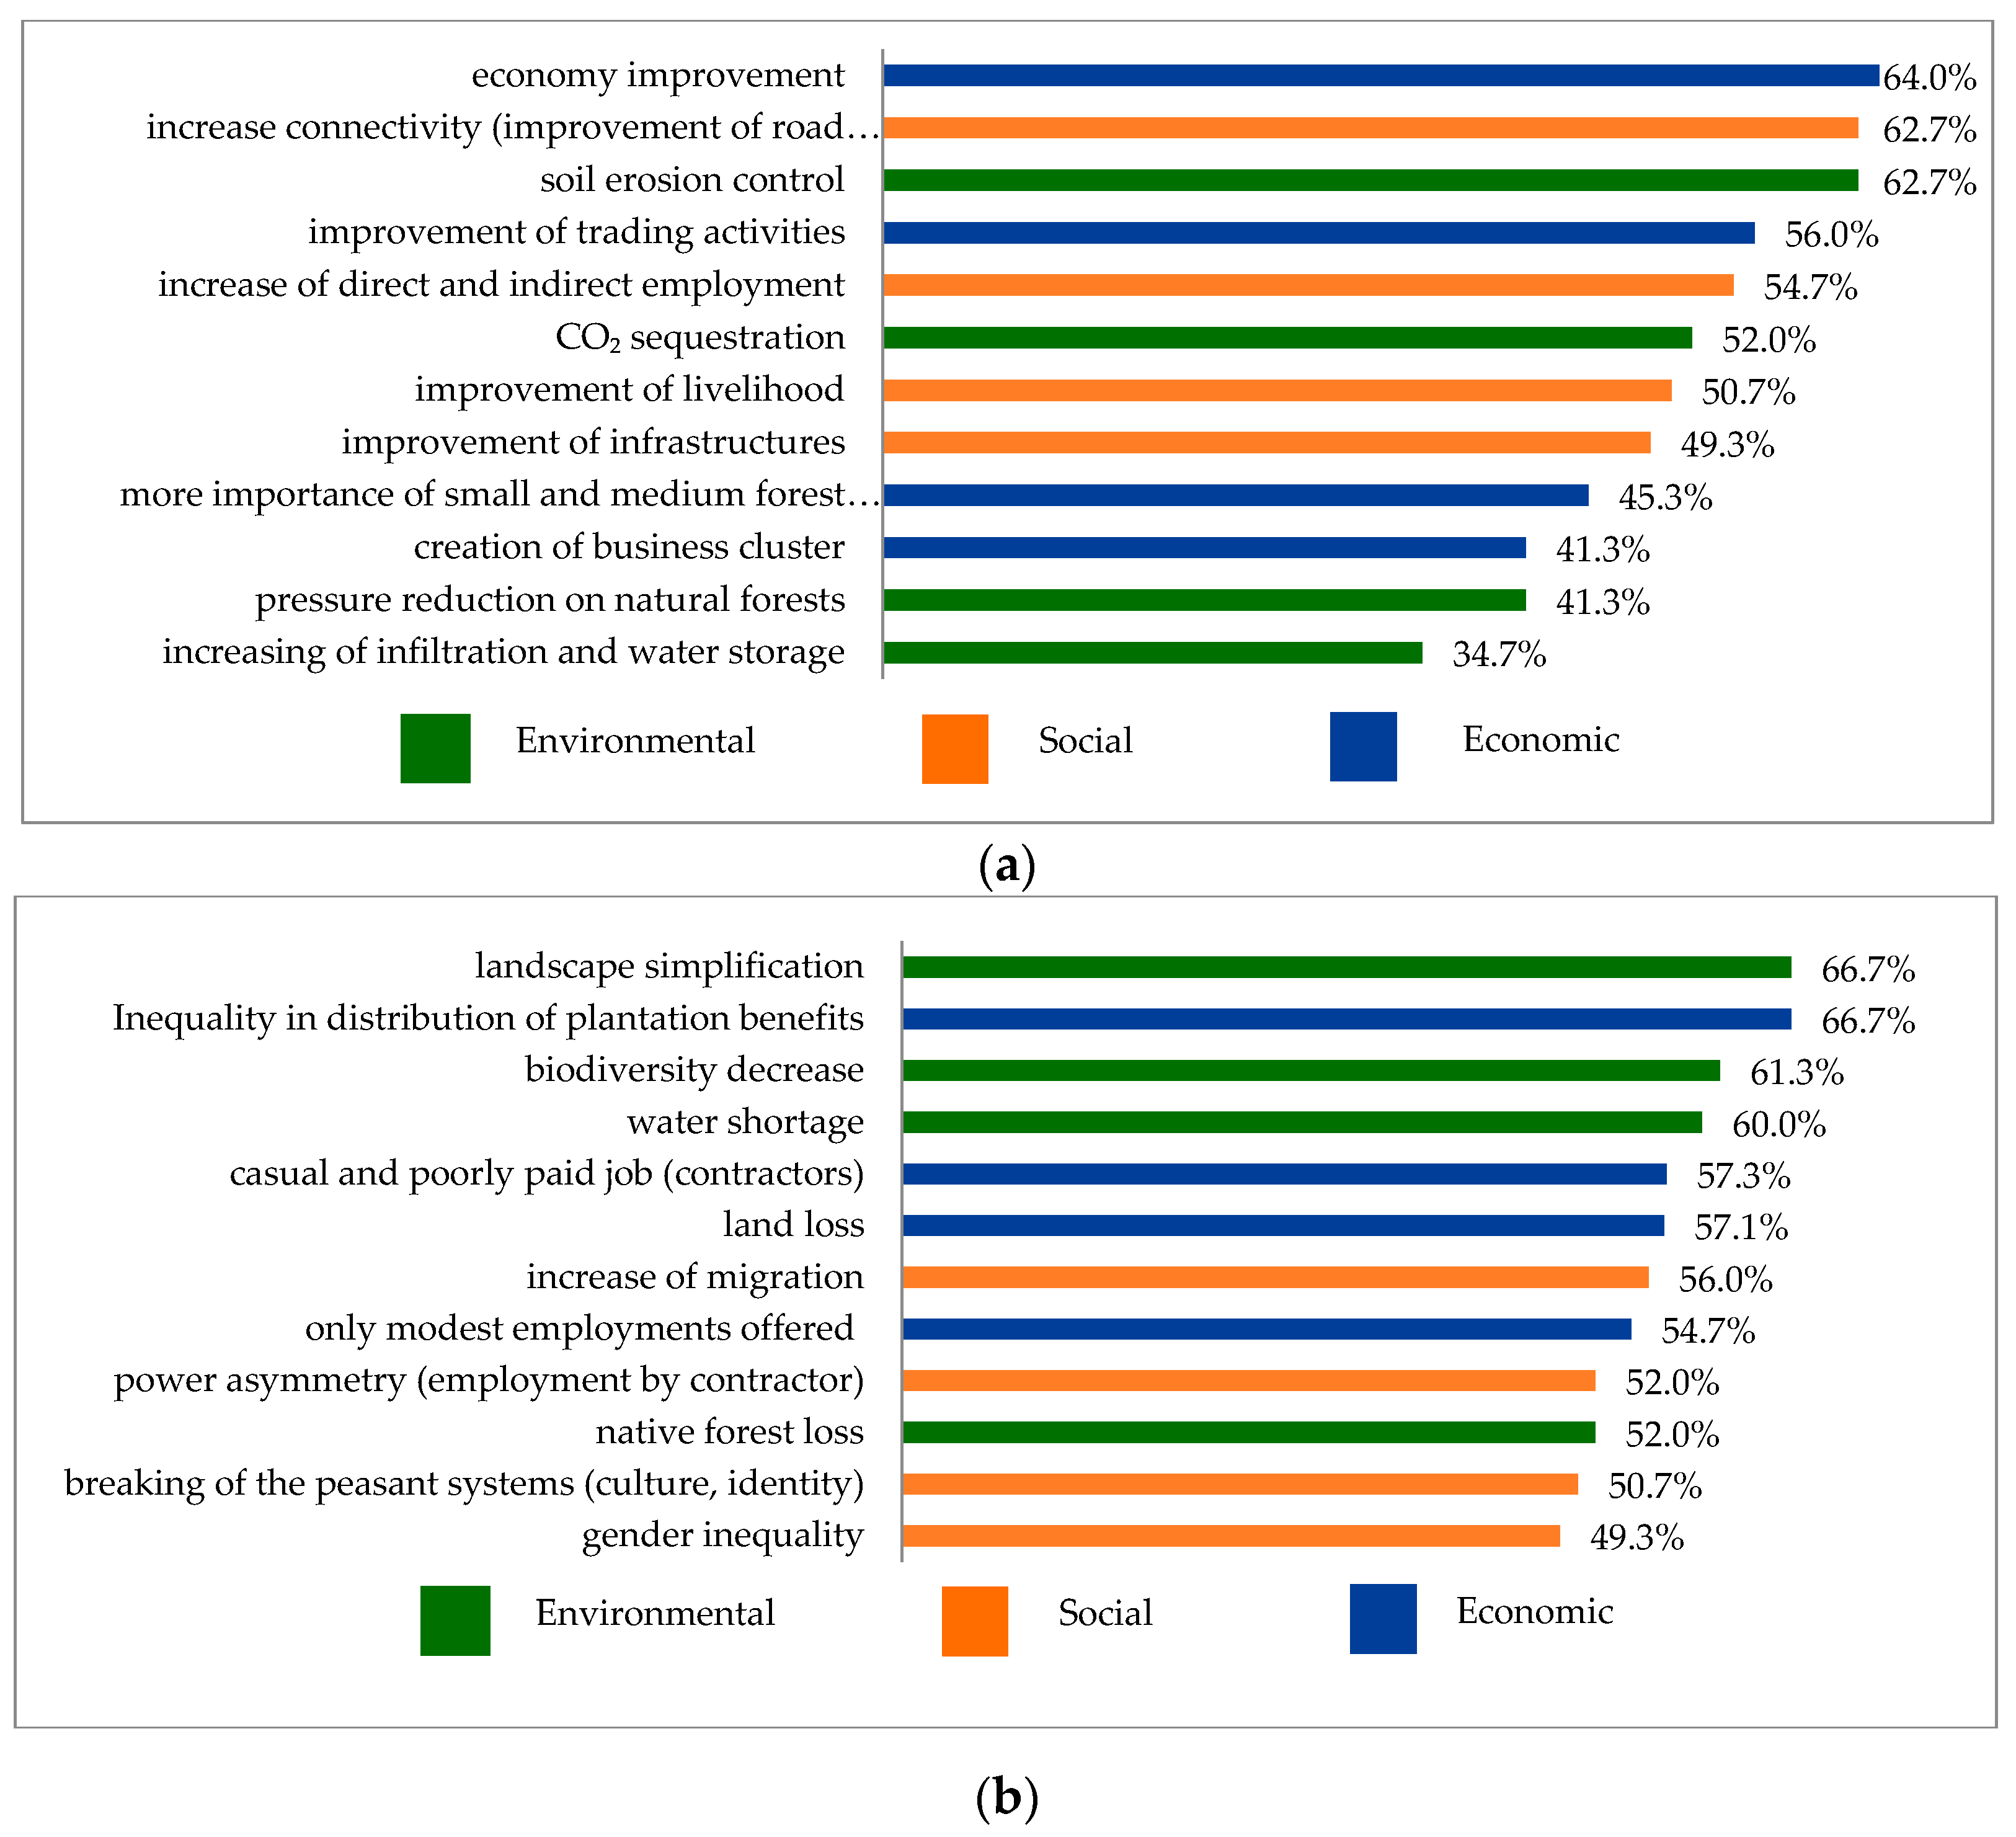
4.2. Experts Response Indicator

As shown in Table 3, the Cronbach’s Alpha resulted as higher than 0.8, both in the detailed controls and in the general one, proving that the answers were statistically consistent and could be used to implement the following analyses.
Appendix B contains the frequency of all elements on the Likert scale and the values estimated for ERI. Figure 5 shows the first four positive and negative externalities, gathering the three different categories. The ERI values are expressed in percentage.
Among positive externalities, the environmental, social, and economic ones are homogenously distributed without any prevalence of one category over the others. But when the negative ones are considered, it can be noted that environmental and economic externalities have a higher score than social ones.
Forest owners’ perception estimated with the Analytic Hierarchy Process (AHP) technique. Priority vectors ( P V s ) and Consistency Ratios (CRs) of the aggregate matrices, computed considering the whole study area, are presented in Table 4 and Table 5. Because the CRs are in all cases lower than 0.1 (Table 4), the matrices can be considered reliable and the data consistent. The priority vectors and CRs were also computed for the municipalities separately (Table 5). Furthermore, in this case, the CRs are lower than 0.1, so the data can be considered consistent.

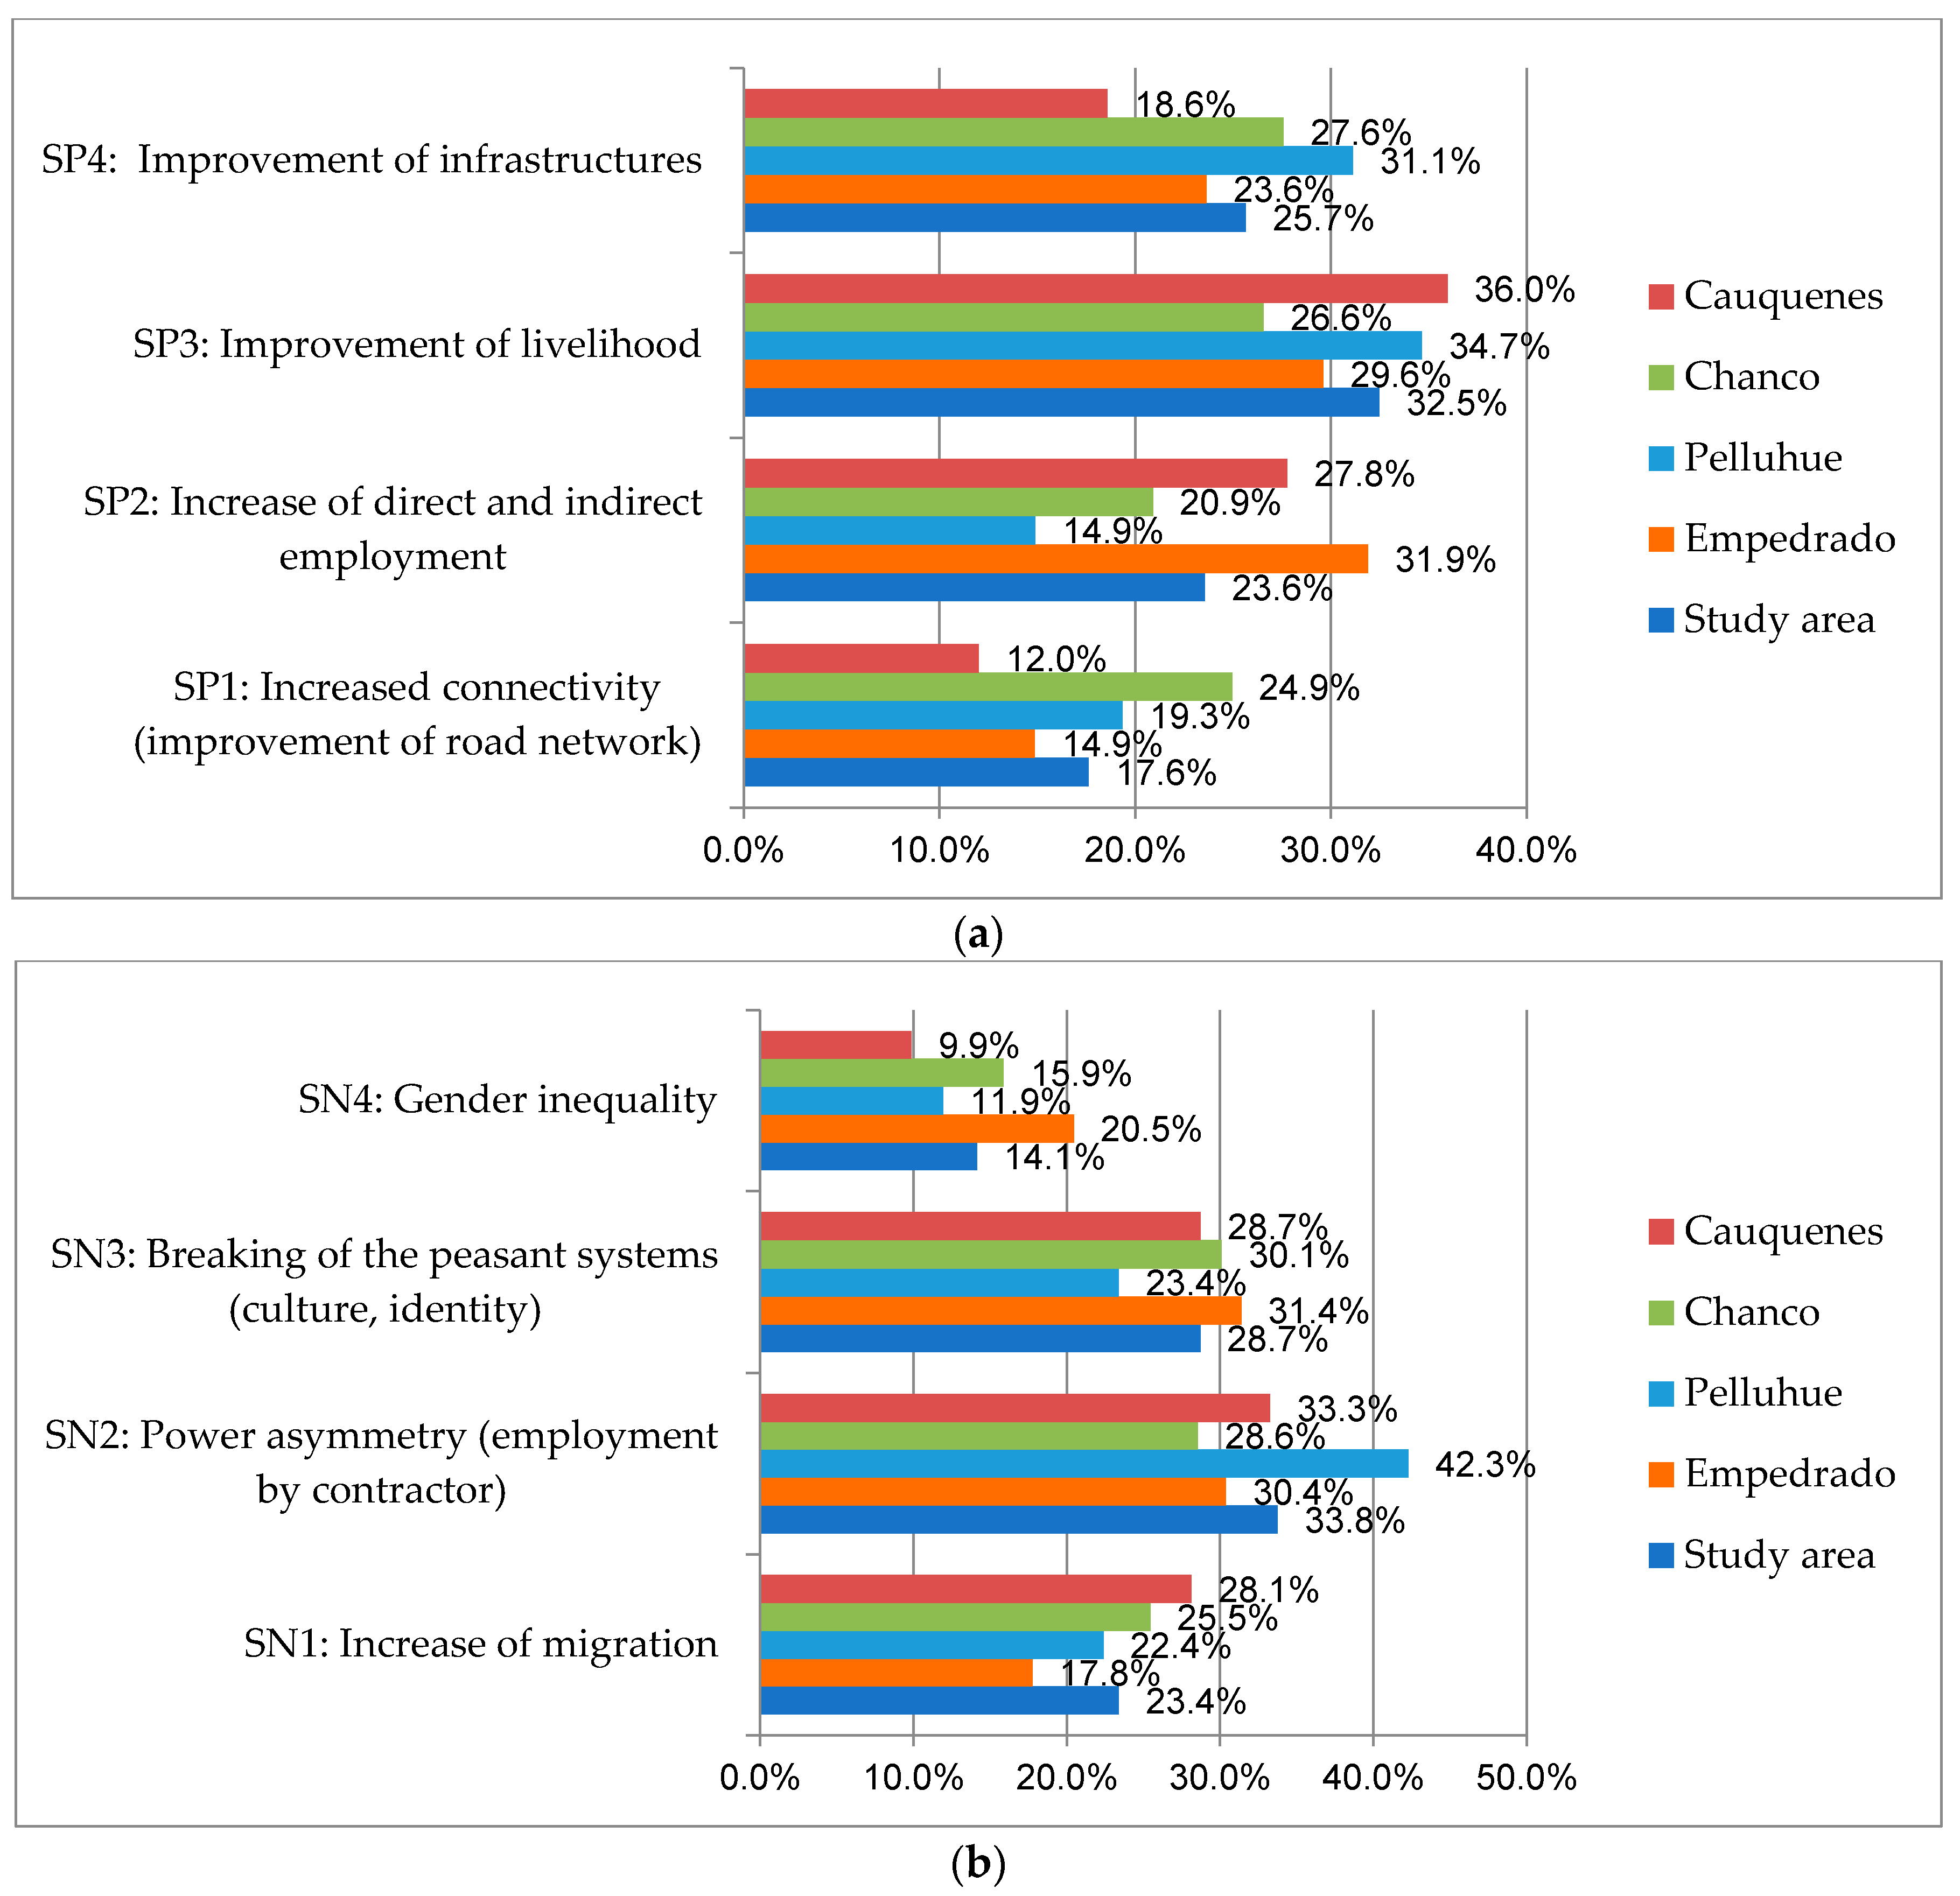
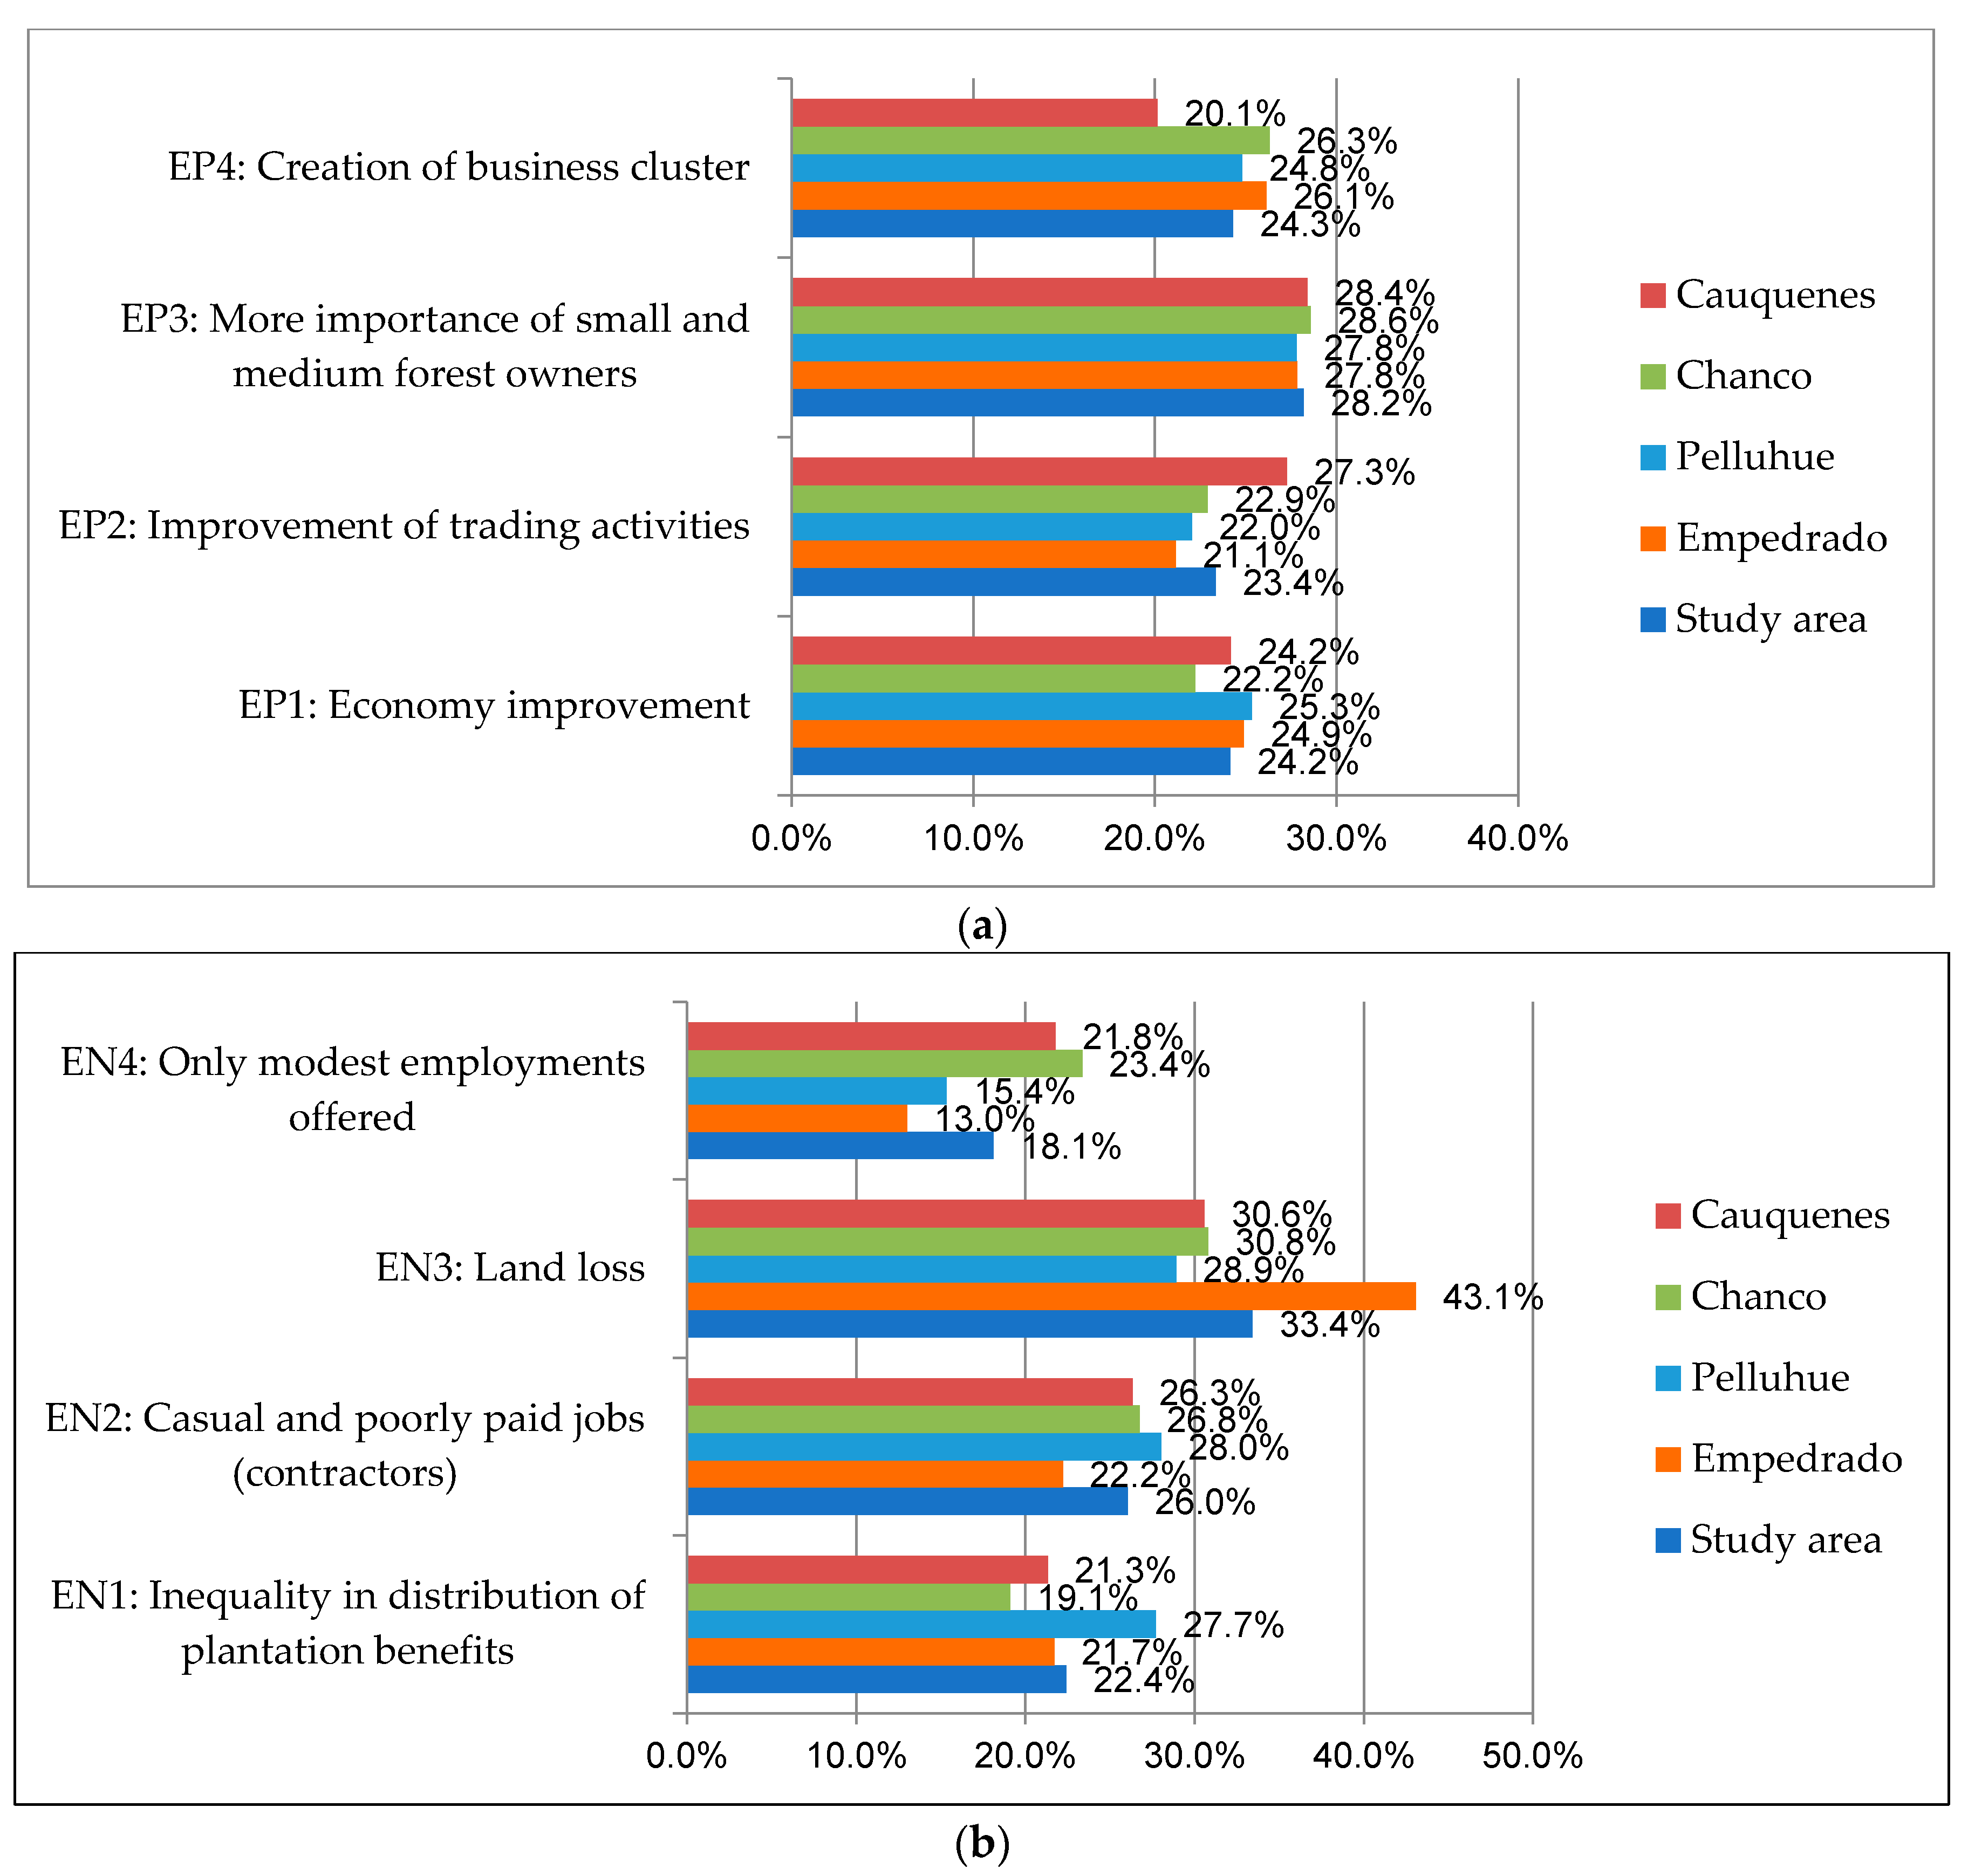
4.3. Local Differences among Forest Owners’ Perception

A comparative analysis between the results obtained in the different municipalities is presented in Figure 6, Figure 7 and Figure 8. The most evident elements were identified and some hypotheses were formulated to explain the main differences in forest owners’ perceptions, before, and compared to experts’ after. Since the hypotheses were based on secondary statistical data available on-line (from the Internal Revenue Service referred to 2011 [31], and from the Chilean native vegetal cadastre of resources, 2014 [25]), further detailed researches should be undertaken to prove the assumptions suggested here.
In Figure 6a, related to positive and environmental externalities, there are some elements that are worth commenting on. Considering the “pressure reduction on natural forests”, it can be observed that in the municipalities of Chanco and Empedrado, this obtained a higher score than in the other two. A possible explanation for this is the number of hectares of native forests in the four municipalities (Table 1). Chanco and Empedrado, in fact, have smaller native forests than the other two and perceive their maintenance as more important. Harvesting in forest plantations allows the native forests still present to be less subjected to human activities and consequently not be overexploited. The other externality where it is possible to notice a difference is “soil erosion control”. This has been considered as the most important externality in Cauquenes and Pelluhue, and the least important in Empedrado. It is evident that Cauquenes is a municipality with a high erosion risk (Figure 2) and has the lowest percentage of its territory covered by forest plantations (Table 1). It can therefore be assumed that, in this context, forest plantations are considered important for soil erosion control, because they have been used less as a tool to contrast it. The data in Figure 2 and Table 1 can also explain the low importance that Empedrado has given to the same item. This municipality, in fact, presents the lowest current rate of erosion and the highest percentage of territory covered by forest plantations (73.1%). It can be assumed that this externality obtained such a low value because the owners interviewed do not perceive soil erosion as a major problem affecting their municipality, and also because of the already high presence of planted forests that contrast it.
When negative and environmental externalities (Figure 6b) are considered, the ranking was the same for the four municipalities. This was the only case in which this happens. Considering the order of the items in the ranking, it can be noted that the externalities perceived as the most important ones are, in some way, related to production. In fact, a decrease of water resources represents a tough problem for plantations production, as repeatedly pointed out by the interviewees. Also, the second externality in the hierarchy, “native forest loss”, can affect the income of families. As a matter of fact, the reduction in native forest cover has led to a decrease in Non-Timber Forest Products (NTFPs) gathering, a particularly important activity in the rural area of the region, and specifically in the study area [49].
Analysing positive social externalities (Figure 7a), it is interesting to highlight the result obtained for the municipality of Empedrado concerning the “increase of direct and indirect employment”, which emerged as the most important. Taking the data regarding the number of enterprises and number of employees per economic sector (Table 2), silviculture is the best represented. Given that this sector needs more workforce, if compared with the manufacture of wood and paper, it is possible to understand this outcome.
Considering negative social externalities (Figure 7b), the non-industrial forest owners of Empedrado perceived “gender inequality” as the most important. As mentioned above, Empedrado has the largest number of enterprises and workers in the silvicultural sector (Table 2). As confirmed by Paulson [50], forest management activities in pine and eucalyptus plantations are more associated with men. Women are, in fact, involved mainly in NTFPs gathering in native forests and in cattle management in Empedrado, where there is the lowest native forest cover (Table 1). Another interesting result concerning Empedrado is the trend of “breaking of the peasant system” (SN3) and “increase of migration” (SN1). While for the other three municipalities the importance of both externalities is directly correlated, the trend changes in Empedrado. Indeed, SN3 obtained a higher score (the highest among the municipalities) while SN1 obtained the lowest among the municipalities. Studies in the literature confirm that loss of the peasant culture and identity is related to the process of rural out-migration (e.g., [21,51,52]), but this outcome confirms that other factors have been involved in the loss. As described by González et al. [53], another important factor that led to the breaking of the peasant social structure is land use change and, as already mentioned, Empedrado has the highest percentage of territory covered by forest plantations, established mainly in the last 40 years. This points out that even if some people decided not to migrate, their life style and their culture nevertheless changed because of several environmental changes that occurred around them.
Figure 8a relates to the positive economic externalities. According to Table 2, Cauquenes has the largest number of workers and enterprises dealing with wood and paper manufacture. That is why “improvement of trading activities” is perceived here as more important than in other municipalities where wood products processing, selling, and trading involve less raw materials and fewer workers. Moreover, considering the “creation of business cluster”, it can be noted that Cauquenes is the municipality where this externality is perceived as the least important one. Once again, because in this context there is a prevalence of manufacturing and economic activities linked with forestry, this externality is not considered important. In fact, where the concentration of forest-related activities is lower, the presence of a business cluster is perceived as a very important feature.
Finally, the last group relates to the negative economic externalities (Figure 8b). In the municipality of Empedrado, the importance given to the externality “land loss” is evident. As already mentioned, 73.1% of Empedrado is covered by forest plantations (Table 1), giving fewer possibilities for the development of agriculture or other economic activities. The conversion from agricultural land to forest is considered a land loss by most of the interviewees.
Experts versus forest owners. The last consideration regards the differences that emerged between the answers given by the experts and forest owners interviewed. Even if the methodologies used to examine these two types of stakeholder differed, the comparison referred to the final ranking and not to the relative importance obtained by each externality. Considering negative environmental externalities, “landscape simplification” was the one considered as the most important by experts (Figure 5b), while it obtained the lowest score from forest owners (priority vector associated to Table 4). The other difference is among the positive externalities (Figure 5a). For the experts, “increased connectivity” was the most important social externality, but the results of AHP show an opposite outcome (priority vector associated to Table 4). The last two evident differences were detected in the economic externalities. The “more importance of small and medium forest owners” obtained only third position in experts’ ranking, while it was considered the most relevant externality by the forest owners interviewed (priority vector associated to Table 4). A similar dynamic involved the negative externalities, where “land loss” was the first in order of importance, according to the forest owners’ answers (priority vector associated to Table 4), while it was the last for the experts. These differences between experts and non-industrial forest owners underline the variability of opinions among different stakeholders about the same matter. Differences in perception are clearly due to stakeholders’ knowledge and information asymmetries. It also depends on the scale at which the issue is considered: the experts have a regional, national, or even international view about the externalities deriving from forest plantations, and even when asked for an opinion regarding a specific area, their answers cannot avoid thinking on a broader scale or considering the influence that the environment has on it. On the contrary, most of the owners interviewed have shown a narrower perspective, in most cases limited to their own property or, at most, their municipality. These differences in perception highlight the importance of considering all the stakeholders who will be involved in future interventions.

5. Conclusions

In a context where the strong neoliberal economic strategy paved the way for a model of export-led growth, extractive activities reinforced and enhanced the export of large amounts of raw materials from almost all segments of the primary sectors with the aim of making Chile one of the five largest food and wood producer countries; this development has brought about a remarkable transformation in land use. Unfortunately, the process was conducted without any accurate analysis of the social and environmental effects that it would produce. Only in the last years, the discussions began about forest investment impacts with a more holistic approach. This study dealt with these issues and tried to make an interesting contribution to these discussions. Even if our results are valid only for the considered case study areas, some remarks can be useful for inspiring a general evaluation of the impacts of forest investment policy at a large scale.
Referring to the whole study area, it was possible to demonstrate that most forest owners perceived the negative externalities of forest plantations, the most important being: “water shortage”, “native forest loss”, “power asymmetry”, “breaking of the peasant systems”, “land loss”, and “casual and poorly paid jobs”. However, it seems that these externalities could be compensated for by the income that would derive from forest plantations and that turned out to be very important for household livelihoods. The other important positive externalities perceived by the non-industrial forest owners were: “CO2 sequestration”, “soil erosion control”, “improvement of livelihood”, “increase of direct and indirect employment”, “more importance of small and medium forest owners”, and “creation of business cluster”. To be environmentally sustainable, plantation programmes must be supported by strong national and local institutions to ensure high performance levels in all management activities [54] through community involvement and monitoring of the economic and technical impact indicators. In this sense, integrated land use planning appears as a key tool to prevent land use conflicts, adaptation of land uses to physical and social conditions, protection of natural resources, and a balanced use of social, natural, and financial capitals [55].
The methodology used in this research could be used in all countries where large forest investments have been implemented without a reflection of their environmental, social, and economic responsibilities. Since the use of the Analytic Hierarchy Process has turned out to be effective and easy to replicate, the study can be considered as an exploratory survey whose methodology might be used in the future to investigate the effects of forest investments in detail. For instance, it would be possible to consider different stakeholders or different study areas. In fact, the results deriving from the individual municipalities have shown different outcomes underlining their own territorial peculiarities. In future analysis, it is also important to consider that some externalities might be modified because of the occurrence of modern phenomena (e.g., a decrease in employment rate associated with the increased level of forest mechanization).
A limit of this study might be that we have only considered forestry as a trigger of the considered externalities without taking into account the combined role of different causes. However, to implement this kind of analysis, it is necessary, at the beginning, to have a simplified system, to check if the methodology and the approach used are useful to reach the predefined objectives. As detected by Infante [52], large-scale forest investments are one of the causes of land degradation, rural depopulation, loss of social capital, and other social and environmental problems in the study area. Therefore, when considering the issues connected to economic development impacts, an interdisciplinary approach to the evaluation of externalities is much needed. Only in this way will it be possible to develop strategies based on the real needs and expectations of the rural communities, adapting and, if necessary, radically reforming the national policies directed at these areas.

Supplementary Materials

The following are available online at https://www.mdpi.com/1999-4907/9/3/141/s1, Annex S1: Experts’ Consultation Questionnaire, Annex S2: Interview with non-industrial forest owners (AHP).

Acknowledgments

This study would not have been possible without the collaboration between the Università di Padova, the Universidad Catolica del Maule and the Universidad Católica del Norte, the support of the CONAF offices of Cauquenes and Constitución and the PRODESAL offices of Chanco and Pelluhue. The authors thank the experts and forest owners who kindly answered our questionnaire. Julien Vanhulst acknowledges financial support from FONDECYT Project No. 1160186 (CONICYT-Chile).

Author Contributions

G.B., L.R., and S.M. identified the research topic; G.B. and L.R. designed the study; G.B. implemented the fieldwork, wrote the paper, and conducted the analyses; S.M. and J.V. gave important suggestions during the study implementation and regarding the secondary sources used in it; G.B., L.R., S.M., and J.V. interpreted the results obtained; D.P. reviewed the paper and gave numerous useful insights.

Conflicts of Interest

The authors declare no conflict of interest.

Appendix A

Table A1. Externalities found in the literature review.
CategoryExternality
Environmental externalitiesNegativeWater shortage [17,20,21,53,56,57]
Water pollution [22,58]
Degradation of native forest [18,19,20,21,23,53,59]
Native forest loss [20,53,60]
Biodiversity decrease [21,53]
Landscape simplification [59]
Contamination by pesticides [8,17,44]
Soil degradation [11,21,23,44,53]
PositivePressure reduction on natural forests [44,58]
Increase of ecosystem services [59,61]
CO2 sequestration [62]
Increasing of infiltration and water storage [63]
Biodiversity increase [64]
Soil erosion control [58,59]
Social externalitiesNegativeIncrease of migration [11,20,21,59,65,66]
Health problems (pesticides) [11,21,22,53]
Increase of accidents (without specialized worker) [11]
Breaking of the peasant systems (culture, identity) [21,51,53]
Threatened local livelihoods [22,51]
End of local use of natural resources [11,21,53]
Isolation of rural population [5]
Decrease of local development [11]
Power asymmetry (employment by contractor) [11,22]
Gender inequality [11,58]
Increase of conflicts [67]
Land tenure conflict [21,58]
Increased rate of road accidents [65]
PositiveIncrease of direct and indirect employment [11,68,69]
Safety in working sites [70]
Improvement of livelihood [71]
Improvement of education and healthcare facilities [69]
Improvement of infrastructures [69]
Increased connectivity (improvement of road network) [71]
Access to plantation resources (firewood, NTFP) [72]
Increase of social capital [72]
Economic externalitiesNegativeIncreased poverty rate [24]
Diminished economic opportunities [11,24]
Less employment opportunities [24]
Only modest employment offered [11,21,59]
Casual and poorly paid jobs (contractors) [11,59]
Greater reliance on hired labour [73]
Difficulties in trading native timber (dumping) [5]
Income decrease [22,68]
Inequality in distribution of plantation benefits [59]
Land loss [22,69]
PositiveEconomy improvement [58]
Creation of business cluster [74]
Improvement of trading activities [75]
More importance of small and medium forest owners [59]

Appendix B

Table A2. Frequency of the Likert scale per externality and relative scores of environmental externalities according to the experts’ consultation.
CategoryEnvironmental ExternalitiesPanel of Experts (n = 15)ERI (%)
Number of Respondents by Mark
Not Important 0Slightly Important 1Moderately Important 2Important 3Very Important 4Extremely Important 5
Positive ExternalitiesSoil erosion control12233462.7
CO2 sequestration04432252.0
Pressure reduction on natural forests15350141.3
Increasing of infiltration and water storage35232034.7
Increase of ecosystem services34521032.0
Biodiversity increase37401025.3
Negative ExternalitiesLandscape simplification01255266.7
Biodiversity decrease01372261.3
Water shortage12243360.0
Native forest loss22252252.0
Water pollution23521244.0
Contamination by pesticides22531142.9
Degradation of native forest08213142.7
Soil degradation44313033.3
Table A3. Frequency of the Likert scale per externality and relative scores of social externalities according to the experts’ consultation.
CategorySocial ExternalitiesPanel of Experts (n = 15)ERI (%)
Number of Respondents by Mark
Not Important 0Slightly Important 1Moderately Important 2Important 3Very Important 4Extremely Important 5
Positive ExternalitiesIncreased connectivity (improvement of road network)12152462.7
Increase of direct and indirect employment03272154.7
Improvement of livelihood04271150.7
Improvement of infrastructures14413249.3
Access to plantation resources (firewood, NTFP)15153045.3
Improvement of education and healthcare facilities25501238.7
Safety in working sites15450037.3
Increase of social capital27231032.0
Negative ExternalitiesIncrease of migration04235156.0
Power asymmetry (employment by contractor)04416052.0
Breaking of the peasant systems (culture, identity)05154050.7
Gender inequality13433149.3
Threatened local livelihoods12462048.0
Land tenure conflict04532148.0
Decreased local development15412245.3
Increase of conflict05450144.0
Increased rate of road accidents14523042.7
Increase of accidents (without specialized worker)15431141.3
Isolation of rural population35304036.0
Health problems (pesticides)25512034.7
End of local use of natural resources33620134.7
Table A4. Frequency of the Likert scale per externality and relative scores of economic externalities according to the experts’ consultation.
CategoryEconomic ExternalityPanel of Experts (n = 15)ERI (%)
Number of Respondents by Mark
Not Important 0Slightly Important 1Moderately Important 2Important 3Very Important 4Extremely Important 5
Positive ExternalitiesEconomy improvement01192264.0
Improvement of trading activities11371256.0
More importance of small and medium forest owners24144045.3
Creation of business cluster14532041.3
Negative ExternalitiesInequality in distribution of plantation benefits01425366.7
Casual and poorly paid jobs (contractors)21244257.3
Land loss12324257.1
Only modest employment offered22153254.7
Greater reliance on hired labour03623150.7
Increased poverty rate14270145.3
Diminished economic opportunities offered14433044.0
Less employment opportunities15333042.7
Income decrease24522037.3
Difficulties in trading native timbers (dumping)27212136.0

References

  1. Sargent, C.; Bass, S. Plantation Politics: Forest Plantations in Development; Abingdon-on-Thames: Routledge, UK, 2013; ISBN 978-1-134-06470-0. [Google Scholar]
  2. Lara, A.; Solari, M.E.; Prieto, M.D.R.; Peña, M.P. Reconstrucción de la cobertura de la vegetación y uso del suelo hacia 1550 y sus cambios a 2007 en la ecorregión de los bosques valdivianos lluviosos de Chile (35°–43° 30′ S). Bosque (Valdivia) 2012, 33, 13–23. [Google Scholar] [CrossRef]
  3. Infor: Estadisticas Forestales Anuario Forestal. 2016. Available online: http://wef.infor.cl/publicaciones/anuario/2016/Anuario2016.pdf (accessed on 18 November 2017).
  4. Lara, A.; Veblen, T. Forest plantations in Chile: A successful model? In Afforestation: Policies, Planning, and Progress; Mather, A., Ed.; Belhaven Press: London, UK, 1993; pp. 118–139. [Google Scholar]
  5. Reyes, R.; Nelson, H. A tale of two forests: Why forests and forest conflicts are both growing in Chile. Int. For. Rev. 2014, 16. [Google Scholar] [CrossRef]
  6. Cossalter, C.; Pye-Smith, C. Fast-Wood Forestry. Myths and Realities; CIFOR: Bogor, Indonesia, 2003; ISBN 979-3361-09-3. [Google Scholar]
  7. Salas, C.; Donoso, P.; Vargas, G.R.; Arriagada, C.; Pedraza, R.; Soto, D. The forest sector in Chile: An overview and current challenges. J. For. 2016, 114, 562–571. [Google Scholar] [CrossRef]
  8. Neilson, D.A.; Evans, J. Planted Forest: Uses, Impacts and Sustainability; FAO and CAB International: Roma, Italy, 2009; Chapter 7; ISBN 978-1-84593-564-1. [Google Scholar]
  9. Biblioteca del Congreso Nacional de. M. D. DL-701 28 November 1974 Ministerio de Agricultura. Available online: https://www.leychile.cl/Navegar?idNorma=6294&idParte= (accessed on 18 November 2017).
  10. Reyes, R.; Sepúlveda, C.; Astorga, L. Gobernanza del sector forestal chileno. Tensiones y conflictos entre las fuerzas de mercado y las demandas de la ciudadanía. In Ecología Forestal. Bases Para el Manejo Sustentable y Conservación de los Bosques Nativos de Chile, 1st ed.; Donoso, C., González, M., Lara, A., Eds.; Universidad Austral de Chile: Valdivia, Chile, 2014; pp. 693–720. [Google Scholar]
  11. OIT. El Trabajo Decente en la Industria Forestal en Chile. Available online: http://www.ilo.org/santiago/publicaciones/WCMS_206093/lang--es/index.htm (accessed on 18 November 2017).
  12. Vial, S. Arauco. Reporte de Sostenibilidad 2016. Available online: https://www.arauco.cl/chile/wp-content/uploads/sites/14/2017/07/Reporte-Sostenibilidad-2016.pdf (accessed on 23 November 2017).
  13. CMPC. Reporte Integrado 2016. Available online: http://s21.q4cdn.com/798526818/files/doc_financials/Integrated_report/CMPC-Integrated-Report-2016.pdf (accessed on 23 November 2017).
  14. Masisa. Memoria Annual 2016. Available online: http://www.masisa.com/wp-content/files_mf/1491859532memoriaanual2016.pdf (accessed on 23 November 2017).
  15. Gysling Caselli, J.; Soto Aguirre, D. Infor. Industria Forestal Primaria en Chile. Período 2006–2015. 2016. Available online: http://wef.infor.cl/publicaciones/industria_primaria/2017/IP2017.pdf (accessed on 23 November 2017).
  16. Leyton Vásquez, J. Tenencia Forestal en Chile. 2009. Available online: http://www.fao.org/forestry/17192-0422df95bf58b971d853874bb7c5755f7.pdf (accessed on 18 November 2017).
  17. Little, C.; Lara, A.; McPhee, J.; Urrutia, R. Revealing the impact of forest exotic plantations on water yield in large scale watersheds in South-Central Chile. J. Hydrol. 2009, 374, 162–170. [Google Scholar] [CrossRef]
  18. Miranda, A.; Altamirano, A.; Cayuela, L.; Lara, A.; González, M. Native forest loss in the Chilean biodiversity hotspot: Revealing the evidence. Reg. Environ. Chang. 2017, 17, 285–297. [Google Scholar] [CrossRef]
  19. Nahuelhual, L.; Carmona, A.; Lara, A.; Echeverría, C.; González, M.E. Land-cover change to forest plantations: Proximate causes and implications for the landscape in south-central Chile. Landsc. Urban Plan. 2012, 107, 12–20. [Google Scholar] [CrossRef]
  20. Araya Cornejo, J. OLCA. La Invasión de Las Plantaciones Forestales en Chile. Efectos de la Actividad Forestal en la Población Indígena Mapuche. 2003. Available online: http://www.olca.cl/oca/chile/plantacion.pdf (accessed on 18 November 2017).
  21. Montalba Navarro, R.; Carrasco, H.N.; Araya Cornejo, J. OLCA. Contexto Económico y Social de las Plantaciones Forestales en Chile. 2005. Available online: http://www.olca.cl/oca/informes/librolumaco.pdf (accessed on 18 November 2017).
  22. Gerber, J.F. Conflicts over industrial tree plantations in the South: Who, how and why? Glob. Environ. Chang. 2011, 21, 165–176. [Google Scholar] [CrossRef]
  23. Roco, L.; Engler, A.; Jara-Rojas, R. Factores que Influyen en la Adopción de tecnologías de conservación de suelos en el secano interior de Chile Central. Revista Facultad Ciencias Agrarias 2012, 44, 31–45. [Google Scholar]
  24. Andersson, K.; Lawrence, D.; Zavaleta, J.; Guariguata, M.R. More trees, more poverty? The socioeconomic effects of tree plantations in Chile, 2001–2011. Environ. Manag. 2016, 57, 123–136. [Google Scholar] [CrossRef] [PubMed]
  25. CONAF. Sistema de Informacion Territorial. Available online: https://sit.conaf.cl/ (accessed on 18 November 2017).
  26. Yáñez Barrios, L. ODEPA. Fichas Nacional y Regionales, Análisis Censales y Catastros. Región del Maule. Información Regional 2016. Available online: http://www.odepa.cl/estadisticas/censos-y-catastros/ (accessed on 18 November 2017).
  27. Zonas Rezagadas. Available online: http://www.zonasrezagadas.subdere.gov.cl/pages/documentos (accessed on 18 November 2017).
  28. San Martín, J.; Donoso, C.; Armestó, J.J.; Villagrán, C.; Kalin Arroyo, M. Estructura florística e impacto antrópico en el bosque maulino de Chile. In Ecología de Los Bosques Nativos de Chile; Armesto, J., Villagrán, C., Arroyo, M., Eds.; Editorial Universitaria: Santiago, Chile, 1997; pp. 153–168. [Google Scholar]
  29. Díaz-Hormazábal, I.; González, M. Análisis espacio-temporal de incendios forestales en la región del Maule, Chile. Bosque (Valdivia) 2016, 37, 147–158. [Google Scholar] [CrossRef]
  30. IDE Minagri. Visor Ministerial. Available online: http://ide2.minagri.gob.cl/publico2/ (accessed on 18 November 2017).
  31. SII. Estadísticas de Empresas. Available online: http://www.sii.cl/estadisticas/empresas_rubro.htm#2 (accessed on 18 November 2017).
  32. Roco, L.; Engler, A.; Bravo-Ureta, B.; Jara-Rojas, R. Farm level adaptation decisions to face climatic change and variability: Evidence from Central Chile. Environ. Sci. Policy 2014, 44, 86–96. [Google Scholar] [CrossRef]
  33. Cronbach, L.J. Coefficient alpha and the internal structure of tests. Psychometrika 1951, 16, 297–334. [Google Scholar] [CrossRef]
  34. Gliem, J.; Gliem, R. Calculating, Interpreting, and Reporting Cronbach’s Alpha Reliability Coefficient for Likert-Type Scales. In Proceedings of the Midwest Research to Practice Conference in Adult, Continuing, and Community Education, Columbus, OH, USA, 8–10 October 2003. [Google Scholar]
  35. Peterson, R.A. Meta-analysis of Cronbach’s Coefficient Alpha. J. Consum. Res. 1994, 21, 381–391. [Google Scholar] [CrossRef]
  36. Matell, M.S.; Jacoby, J. Is there an optimal number of alternatives for Likert Scale items? Study I: Reliability and validity. Educ. Psychol. Meas. 1971, 31, 657–674. [Google Scholar] [CrossRef]
  37. Saaty, T.L. A scaling method for priorities in hierarchical structures. J. Math. Psychol. 1977, 15, 234–281. [Google Scholar] [CrossRef]
  38. Ying, X.; Zeng, G.; Chen, G.; Tang, L.; Wang, K.; Huang, D. Combining AHP with GIS in synthetic evaluation of eco-environment quality—A case study of Hunan Province, China. Ecol. Model. 2007, 209, 97–109. [Google Scholar] [CrossRef]
  39. Gumus, S. An Evaluation of Stakeholder Perception Differences in Forest Road Assessment Factors Using the Analytic Hierarchy Process (AHP). Forests 2017, 8, 165. [Google Scholar] [CrossRef]
  40. Enescu, C.M. Wich are the most important non-wood forest products in the case of Ialomita County? Agrolife Sci. J. 2017, 6, 98–103. [Google Scholar]
  41. Eskandari, S. A new approach for forest fire risk modeling using fuzzy AHP and GIS in Hyrcanian forests of Iran. Arab. J. Geosci. 2017, 10. [Google Scholar] [CrossRef]
  42. Valls-Donderis, P.; Vallés-Planells, M.; Galiana, F. Short communication: AHP for indicators of sustainable forestry under Mediterranean conditions. For. Syst. 2017, 26. [Google Scholar] [CrossRef]
  43. Ramanathan, R. A note on the use of the analytic hierarchy process for environmental impact assessment. J. Environ. Manag. 2001, 63, 27–35. [Google Scholar] [CrossRef] [PubMed]
  44. The Montreal Process. Criteria and Indicators for Conservation and Sustainable Management of Temperate and Boreal Forest. 2015. Available online: https://www.montrealprocess.org/documents/publications/techreports/MontrealProcessSeptember2015.pdf (accessed on 11 January 2018).
  45. Saaty, T.L. Fundamentals of the Analytic Hierarchy Process. In The Analytic Hierarchy Process in Natural Resource and Environmental Decision Making; Managing Forest Ecosystems; Schmoldt, D.L., Kangas, J., Mendoza, G.A., Pesonen, M., Eds.; Springer: Dordrecht, The Netherlands, 2001; pp. 15–35. ISBN 978-90-481-5735-8. [Google Scholar]
  46. Triantaphyllou, E. Two new cases of rank reversals when the AHP and some of its additive variants are used that do not occur with the multiplicative AHP. J. Multi-Crit. Decis. Anal. 2001, 10, 11–25. [Google Scholar] [CrossRef]
  47. Kuenz Murphy, C. Limits on the analytic hierarchy process from its consistency index. Eur. J. Oper. Res. 1993, 65, 138–139. [Google Scholar] [CrossRef]
  48. Koczkodaj, W.W.; Orłowski, M. Computing a consistent approximation to a generalized pairwise comparisons matrix. Comput. Math. Appl. 1999, 37, 79–85. [Google Scholar] [CrossRef]
  49. Muñoz, M.; Aedo, D.; San Martín, J. Antecedentes sobre la recolección y comercialización de productos forestales no madereros (PFNM), en localidades rurales de la región del Maule, Chile central. Bosque (Valdivia) 2015, 36, 121–125. [Google Scholar] [CrossRef]
  50. Paulson, S. Desigualdad Social y Degradación Ambiental en América Latina; Abya Yala: Quito, Ecuador, 1998; ISBN 978-9978-04-441-4. [Google Scholar]
  51. Clapp, R.A. Regions of refuge and the agrarian question: Peasant agriculture and plantation forestry in Chilean araucanía. World Dev. 1998, 26, 571–589. [Google Scholar] [CrossRef]
  52. Infante, F. The role of social capital and labour exchange in the soils of Mediterranean Chile. Rural Soc. 2017, 26, 107–124. [Google Scholar] [CrossRef]
  53. GeografíaCrítica. Atlas Didáctico. Dimensión Socioambiental de los Conflictos Territoriales en Chile. Colectivo. Available online: http://www.geografiacritica.cl/descarga-atlas-didactico-dimension-socioambiental-de-los-conflictos-territoriales-en-chile (accessed on 18 November 2017).
  54. Higman, S.; Mayers, J.; Bass, S.; Judd, N.; Nussbaum, R. The Sustainable Forestry Handbook: A Practical Guide for Tropical Forest Managers on Implementing New Standards; Earthscan: London, UK, 2005; ISBN 1-84407-118-9. [Google Scholar]
  55. GIZ. Land Use Planning: Concepts, Tools and Applications. German Ministry of Economic Cooperation and Development. 2011. Available online: https://www.giz.de/fachexpertise/downloads/Fachexpertise/giz2012-en-land-use-planning-manual.pdf (accessed on 11 January 2018).
  56. Huber, A.; Iroumé, A.; Bathurst, J. Effect of Pinus radiata plantations on water balance in Chile. Hydrol. Process. 2008, 22, 142–148. [Google Scholar] [CrossRef]
  57. Huber, A.; Iroumé, A.; Mohr, C.; Frêne, C. Efecto de plantaciones de Pinus radiata y Eucalyptus globulus sobre el recurso agua en la Cordillera de la Costa de la región del Biobío, Chile. Bosque (Valdivia) 2010, 31, 219–230. [Google Scholar] [CrossRef]
  58. Tricallotis, M.; Kanowski, P. Tree Plantations in the Landscape Initiative: Background Paper for the Chile. Field Dialogue in Tree Plantations in the Landscape (TPL) in Chile. Available online: http://theforestsdialogue.org/dialogue/field-dialogue-tree-plantations-landscape-tpl-chile (accessed on 18 November 2017).
  59. Lamb, D. Large-Scale Forest Restoration; Routledge: New York, NY, USA, 2014; ISBN 9780415663182. [Google Scholar]
  60. Altamirano, A.; Aplin, P.; Miranda, A.; Cayuela, L.; Algar, A.C.; Field, R. High rates of forest loss and turnover obscured by classical landscape measures. Appl. Geogr. 2013, 40, 199–211. [Google Scholar] [CrossRef]
  61. Groot, R.; van der Meer, P.J. Quantifying and valuing goods and services provided by plantation forests. Ecosyst. Goods Serv. Plant. For. 2010. [Google Scholar] [CrossRef]
  62. IPCC. Summary for Policymakers. Fifth Assessment Report. In Mitigation of Climate Change. Available online: http://www.ipcc.ch/report/ar5/wg3/ (accessed on 18 November 2017).
  63. Van Dijk, A.I.J.M.; Keenan, R.J. Planted forests and water in perspective. For. Ecol. Manag. 2007, 251, 1–9. [Google Scholar] [CrossRef]
  64. Bremer, L.L.; Farley, K.A. Does plantation forestry restore biodiversity or create green deserts? A synthesis of the effects of land-use transitions on plant species richness. Biodivers. Conserv. 2010, 19, 3893–3915. [Google Scholar] [CrossRef]
  65. Schirmer, J. Plantations and social conflict: Exploring the differences between small-scale and large-scale plantation forestry. Small-Scale For. 2007, 6, 19–33. [Google Scholar] [CrossRef]
  66. Rudel, T.K. Tree farms: Driving forces and regional patterns in the global expansion of forest plantations. Land Use Policy 2009, 26, 545–550. [Google Scholar] [CrossRef]
  67. FAO. Global Forest Resources Assessment 2000. Main Report, Rome. Available online: ftp://ftp.fao.org/docrep/fao/003/y1997e/fra%202000%20main%20report.pdf (accessed on 18 November 2017).
  68. Untec. Actualización de Estudio Evaluación del Aporte Econpomico y Social del Sector Forestal en Chile y Analisis de Encadenamientos, Año 2014: Informe Final Para la Corporación Chilena de la Madera. Universidad y Tecnología Fundación Para la Transferencia Tecnológica. Available online: http://www.corma.cl/_file/material/evaluacion-del-aporte-economico-y-social-del-sector-forestal-2014.pdf (accessed on 18 November 2017).
  69. Bleyer, M.; Kniivilä, M.; Horne, P.; Sitoe, A.; Falcão, M.P. Socio-economic impacts of private land use investment on rural communities: Industrial forest plantations in Niassa, Mozambique. Land Use Policy 2016, 51, 281–289. [Google Scholar] [CrossRef]
  70. Beer, M.C.; de Ham, C.; Längin, D.W.; Theron, F. The socioeconomic impact of the phasing out of plantations in the Western and Southern Cape regions of South Africa. South. For. J. For. Sci. 2014, 76, 57–64. [Google Scholar] [CrossRef]
  71. Nath, T.K.; Inoue, M. Forest-based settlement project and its impacts on community livelihood in the Chittagong Hill Tracts, Bangladesh. Int. For. Rev. 2009, 11, 394–407. [Google Scholar] [CrossRef]
  72. Bisiaux, F.; Peltier, R.; Mulielie, J.C. Industrial plantation and agroforestry for the benefit of populations on the Bateke and Mampu Plateaux in the Democratic Republic of the Congo. Bois For. Trop. 2009, 301, 21–32. [Google Scholar] [CrossRef]
  73. Thulstrup, A.W. Plantation livelihoods in central Vietnam: Implications for household vulnerability and community resilience. Norsk Geogr. Tidsskr. Nor. J. Geogr. 2014, 68, 1–9. [Google Scholar] [CrossRef]
  74. Felzensztein, C.; Brodt, S.E.; Gimmon, E. Do strategic marketing and social capital really matter in regional clusters? Lessons from an emerging economy of Latin America. J. Bus. Res. 2014, 67, 498–507. [Google Scholar] [CrossRef]
  75. Nube, T.G.; Santos, A.S.J.D.; Timofeiczyk Junior, R.; Silva, I.C. Impactos socioeconômicos das plantações florestais no Niassa, Moçambique. Floresta Ambiente 2016, 23, 52–60. [Google Scholar] [CrossRef]
Figure 1. Study area location (within the black circle) and Maule Region land use [29].
Forests 09 00141 g001
Figure 2. Current erosion in the study area [30].
Forests 09 00141 g002
Figure 3. Methodological phases.
Forests 09 00141 g003
Figure 4. Hierarchical structure of the AHP method adapted for the study.
Forests 09 00141 g004
Figure 5. Estimations of Experts Response Indicator (ERI) from experts’ consultation (n = 15). (a) positive externalities; (b) negative externalities.
Forests 09 00141 g005
Figure 6. Environmental externalities: comparison among municipalities (a) positive externalities; (b) negative externalities.
Forests 09 00141 g006
Figure 7. Social externalities: comparison among municipalities (a) positive externalities; (b) negative externalities.
Forests 09 00141 g007
Figure 8. Economic externalities: comparison among municipalities (a) positive externalities; (b) negative externalities.
Forests 09 00141 g008
Table 1. Forest plantations, and native and mixed forest in the study area. Calculations based on Chilean native vegetal cadastre of resources, 2014 [25].
MunicipalityTotal Area (ha)Forest Plantations (ha)Native Forests (ha)Mixed Forests (ha)Forest Plantations (%)
Cauquenes212,662.986,251.87620.43703.340.6%
Chanco52,883.231,269.81871.71424.459.1%
Pelluhue37,189.920,636.75108.92800.355.5%
Empedrado56,624.341,413.33827.11263.373.1%
Table 2. Number of enterprises and number of workers employed per economic sector in the study area. Own elaboration based on information from Servicio de Impuestos Internos [31].
SectorMunicipalitiesEconomic Sector
CauquenesChancoPelluhueEmpedrado
Number of enterprises84914113015Agriculture, livestock, hunting
83191244Silviculture
2316196Manufacturing wood and paper industries
153203110Manufacturing not metallic industries
10016438Hotels and restaurants
Number of employees22522812840Agriculture, livestock, hunting
62359150147Silviculture
865233028Manufacturing wood and paper industries
23715380Manufacturing not metallic industries
712345Hotels and restaurants
Table 3. Cronbach’s Alpha computation for different types of externalities considered (n of experts = 15).
Type of ExternalitiesItemsCronbach’s Alpha
All490.939
All Positive180.933
All Negative310.953
Positive Environmental60.845
Positive Social80.875
Positive Economic40.870
Negative Environmental80.905
Negative Social130.918
Negative Economic100.907
Table 4. Priority Vectors and Consistency Ratios for the study area.
ExternalityPositiveNegative
Environmental P V = ( MP 1 MP 2 MP 3 MP 4 ) = ( 0.340 0.367 0.249 0.044 ) P V = ( MN 1 MN 2 MN 3 MN 4 ) = ( 0.077 0.186 0.476 0.261 )
MP1 = Soil erosion controlMN1 = Landscape simplification
MP2 = CO2 sequestrationMN2 = Biodiversity decrease
MP3 = Pressure reduction on natural forestsMN3 = Water shortage
MP4 = Increasing of infiltration and water storageMN4 = Native forest loss
CR = 0.012CR = 0.038
Social P V = ( MP 1 MP 2 MP 3 MP 4 ) = ( 0.176 0.236 0.325 0.257 ) P V = ( MP 1 MP 2 MP 3 MP 4 ) = ( 0.234 0.338 0.287 0.141 )
SP1 = Increased connectivity (improvement of road network)SN1 = Increase of migration
SP2 = Increase of direct and indirect employmentSN2 = Power asymmetry (employment by contractors)
SP3 = Improvement of livelihoodSN3 = Breaking of the peasant systems (culture, identity)
SP4 = Improvement of infrastructuresSN4 = Gender inequality
CR = 0.019CR = 0.013
Economic P V = ( MP 1 MP 2 MP 3 MP 4 ) = ( 0.242 0.234 0.282 0.243 ) P V = ( MP 1 MP 2 MP 3 MP 4 ) = ( 0.224 0.260 0.334 0.181 )
EP1 = Economy improvementEN1 = Unequal distribution of plantations benefits
EP2 = Improvement of trading activitiesEN2 = Casual and poorly paid jobs (contractors)
EP3 = More importance of small and medium forest ownersEN3 = Land loss
EP4 = Creation of business clusterEN4 = Only modest employment offered
CR = 0.009CR = 0.005
Table 5. Consistency Ratios for the individual municipalities.
CREXTERNALITY
Environmental PositiveEnvironmental NegativeSocial PositiveSocial NegativeEconomic PositiveEconomic Negative
Cauquenes0.0170.0330.0760.0030.0130.024
Chanco0.0050.0510.0260.0150.0290.019
Pelluhue0.0700.0240.0490.0230.0150.010
Empedrado0.0270.0650.0690.0550.0030.020

