Analysis of Global LAI/FPAR Products from VIIRS and MODIS Sensors for Spatio-Temporal Consistency and Uncertainty from 2012–2016

 ,
, 
 ,
,  ,
, 
 ,
,
Abstract
:1. Introduction
2. LAI/FPAR Retrieval Algorithm
2.1. Algorithm Description
2.2. Generation of VIIRS-Specific LUTs
3. Data and Method
3.1. VIIRS and MODIS LAI/FPAR
3.2. Evaluation of Continuity between VIIRS and MODIS
3.3. Uncertainty Quantification
4. Results
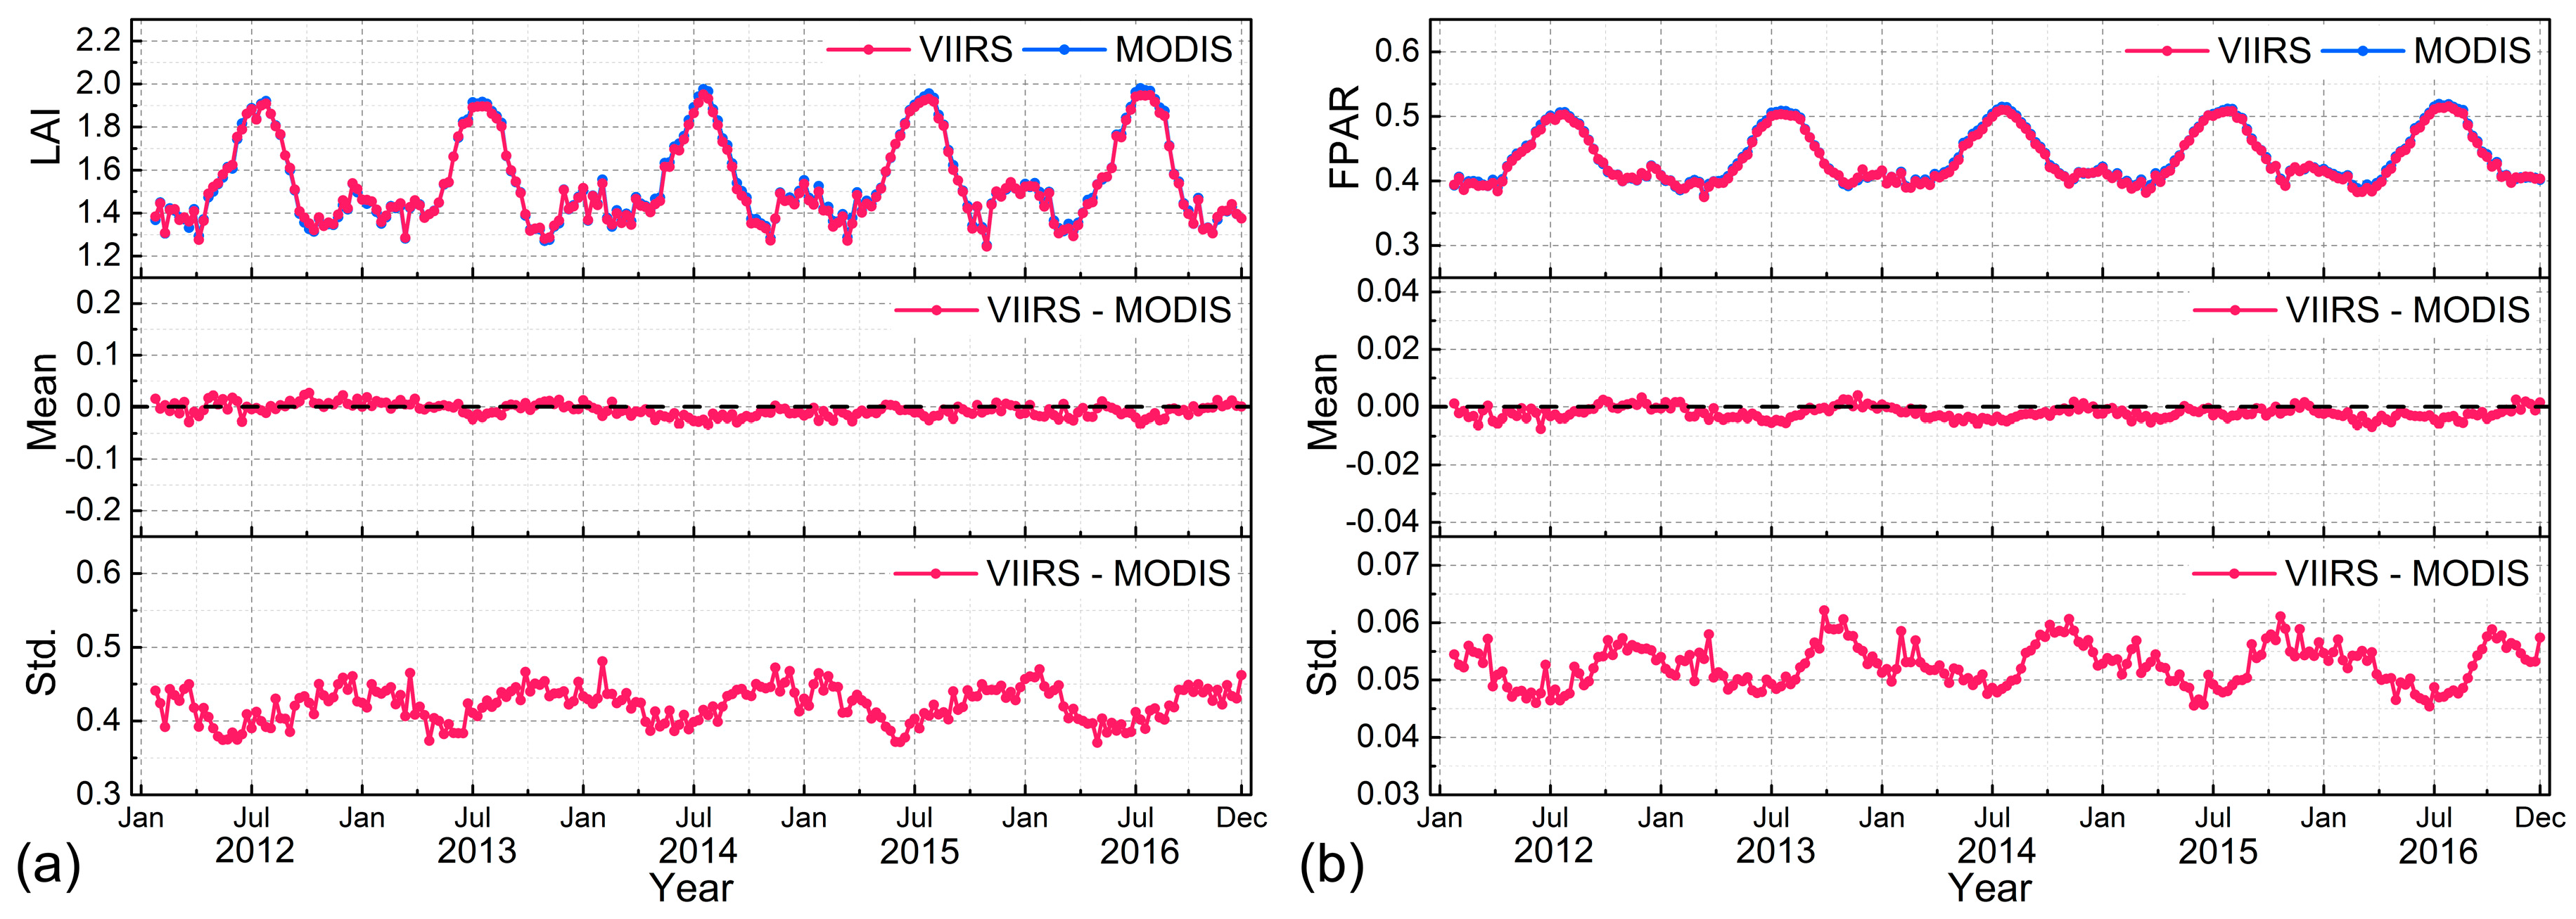
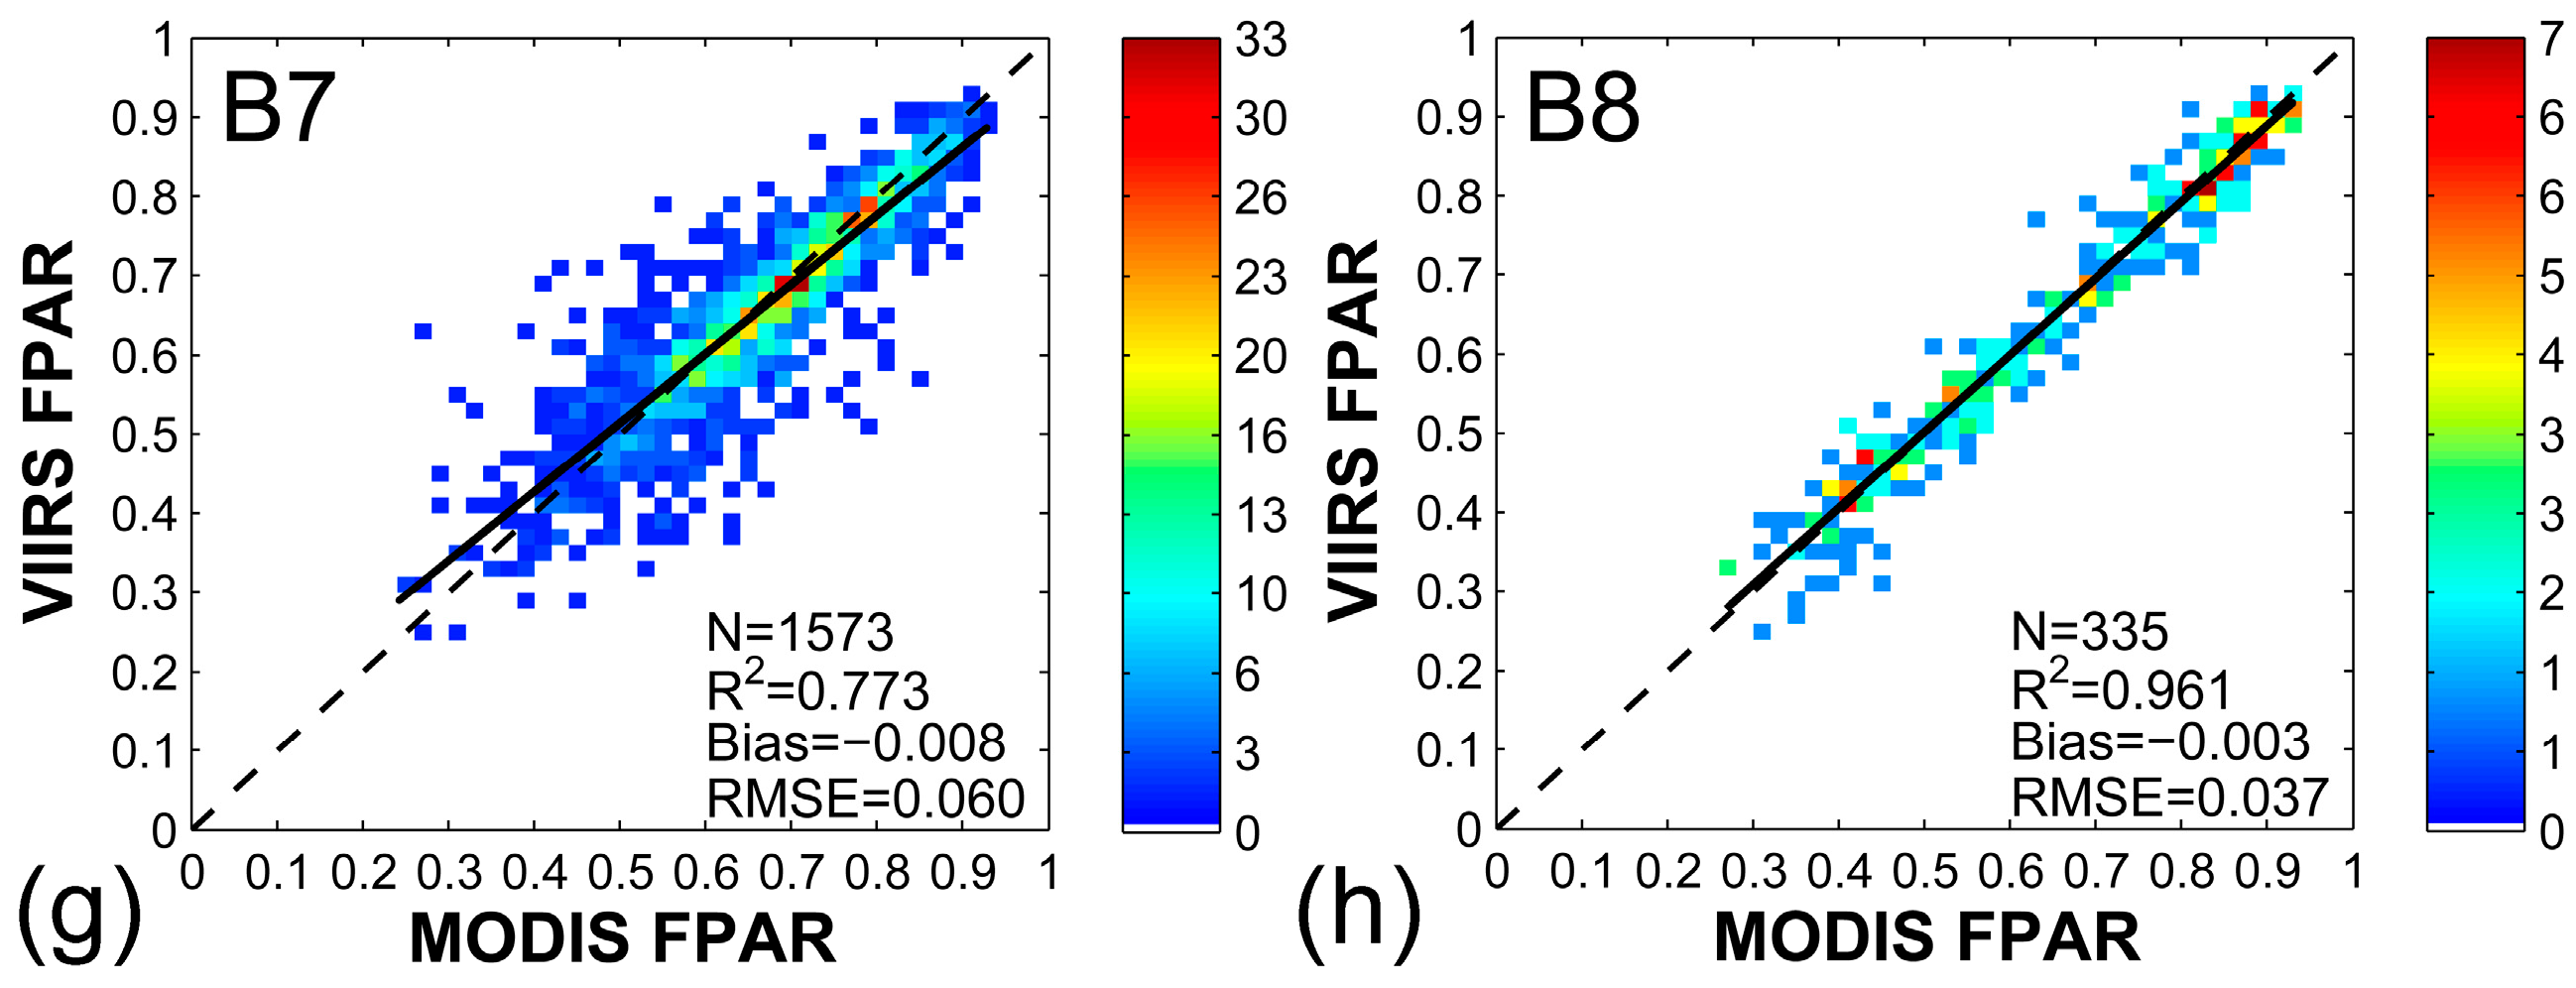
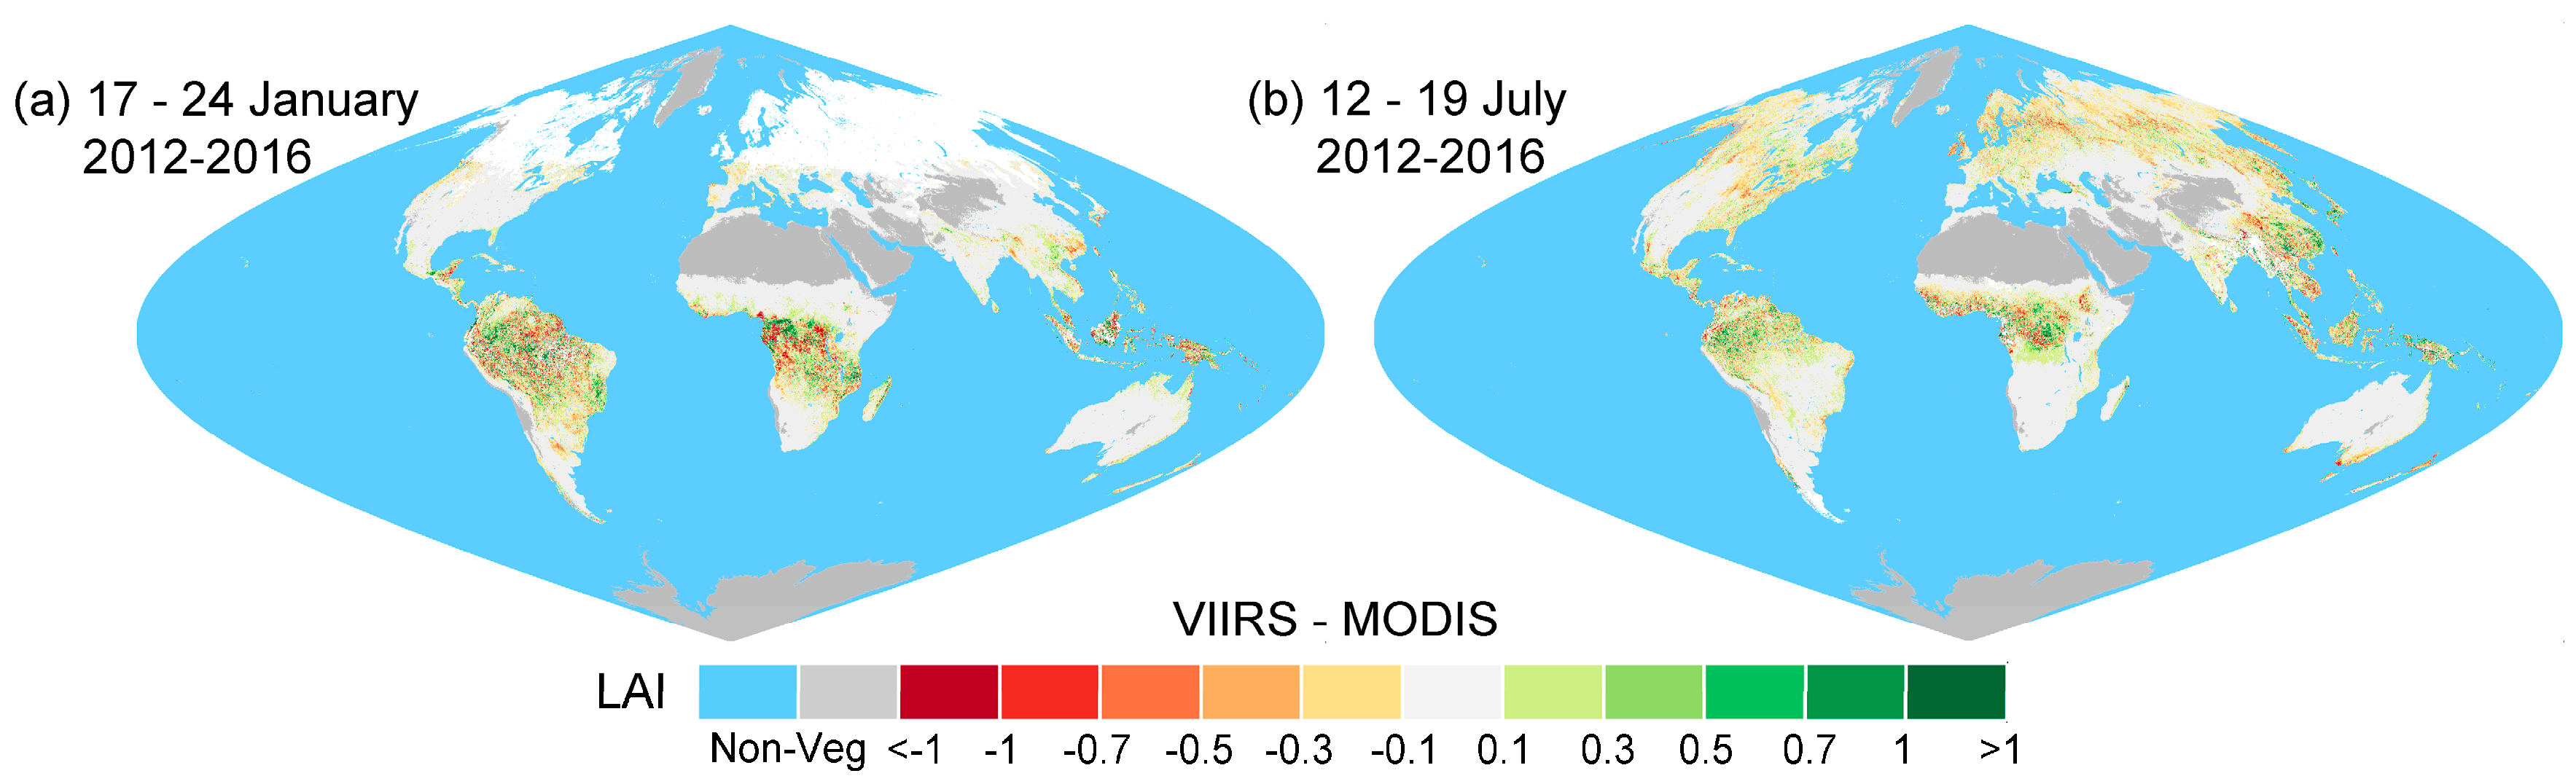
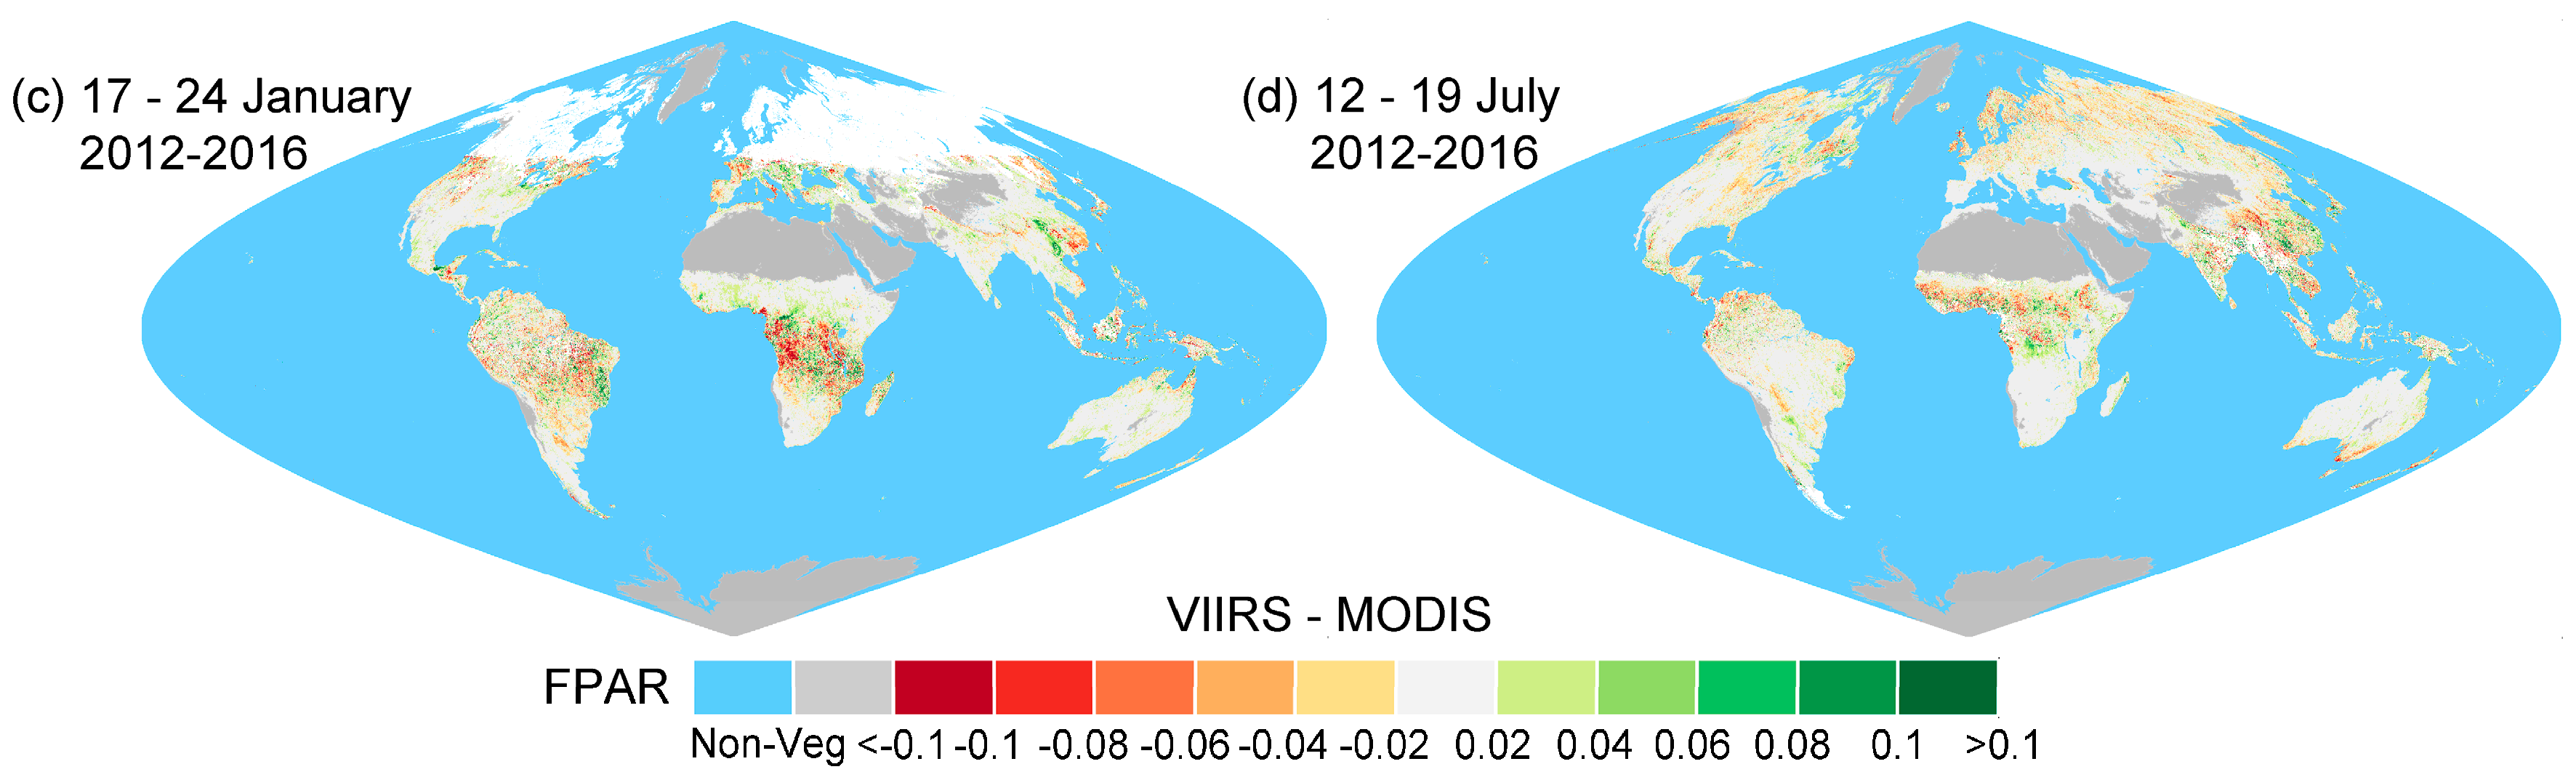
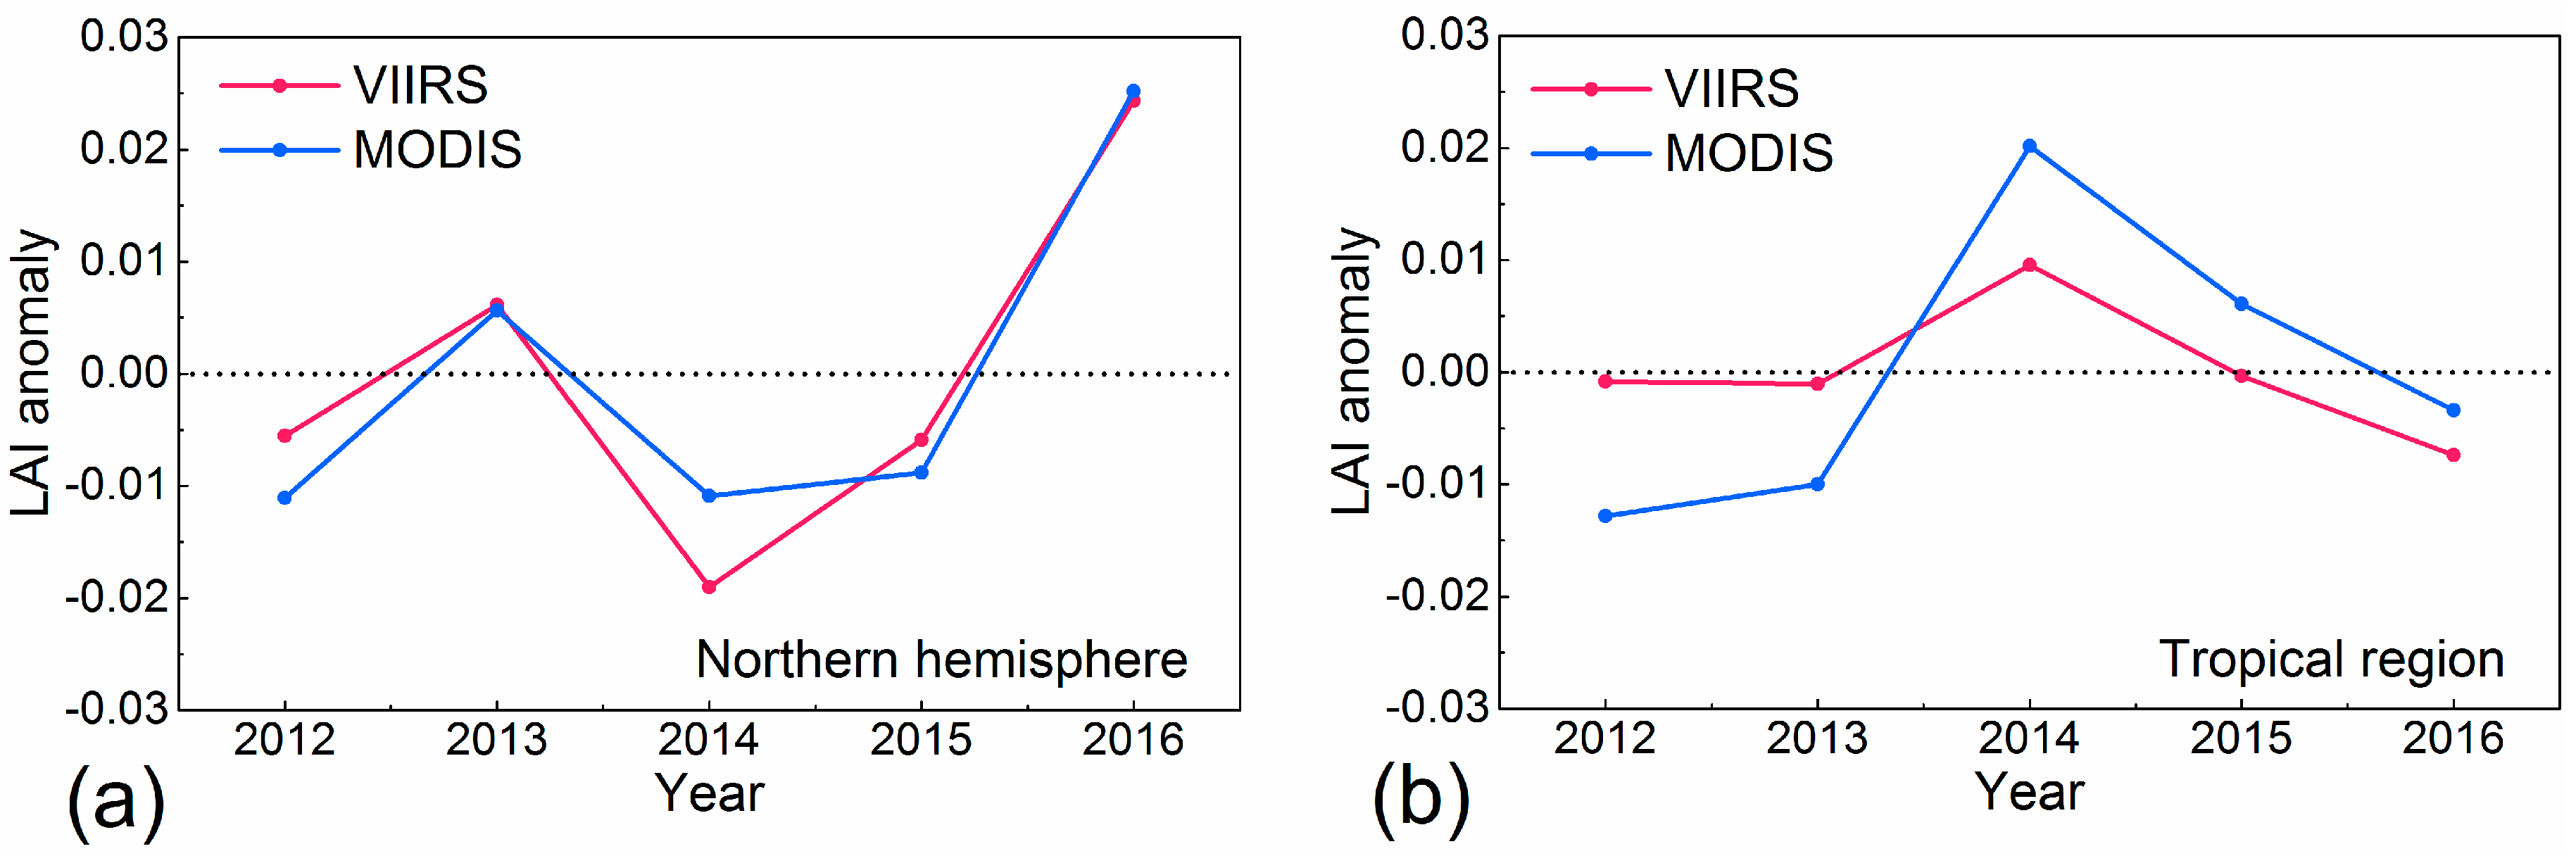
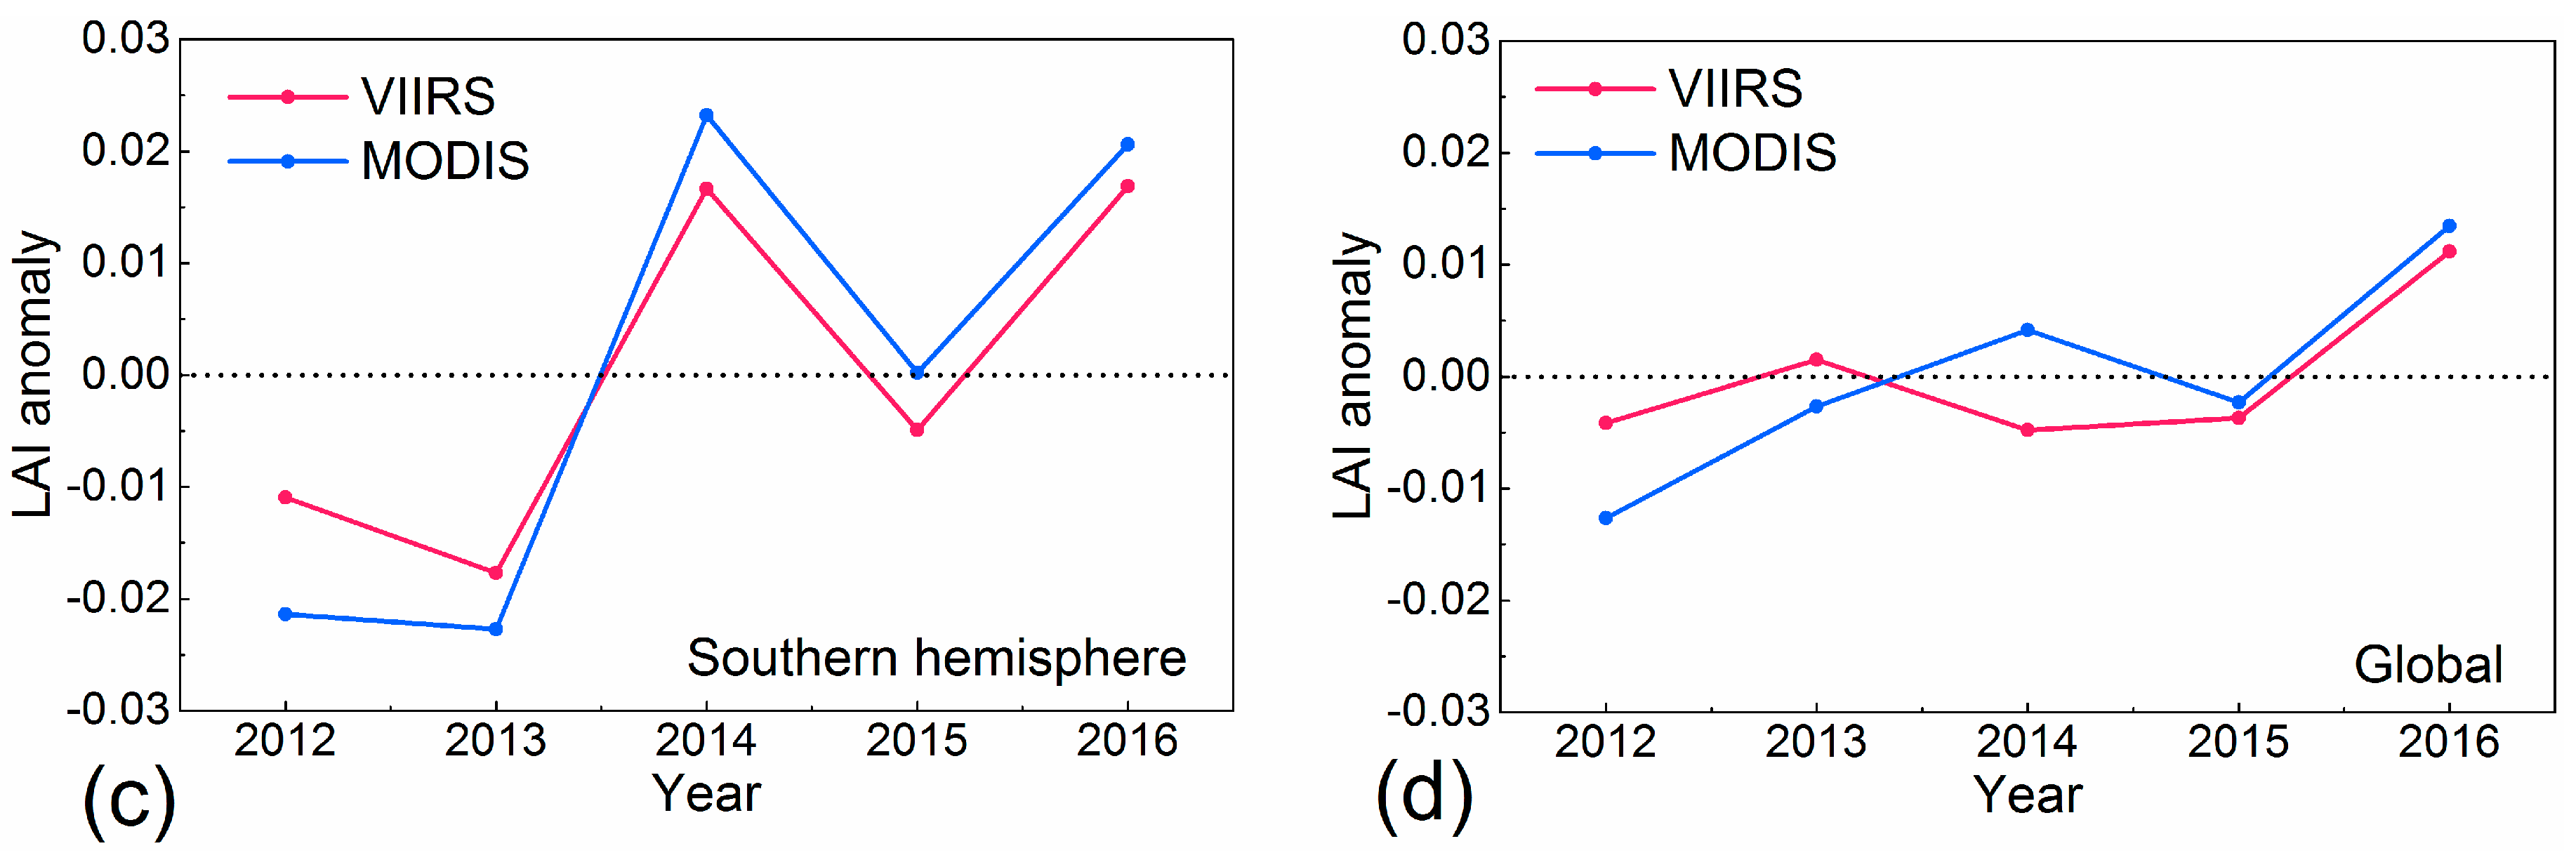
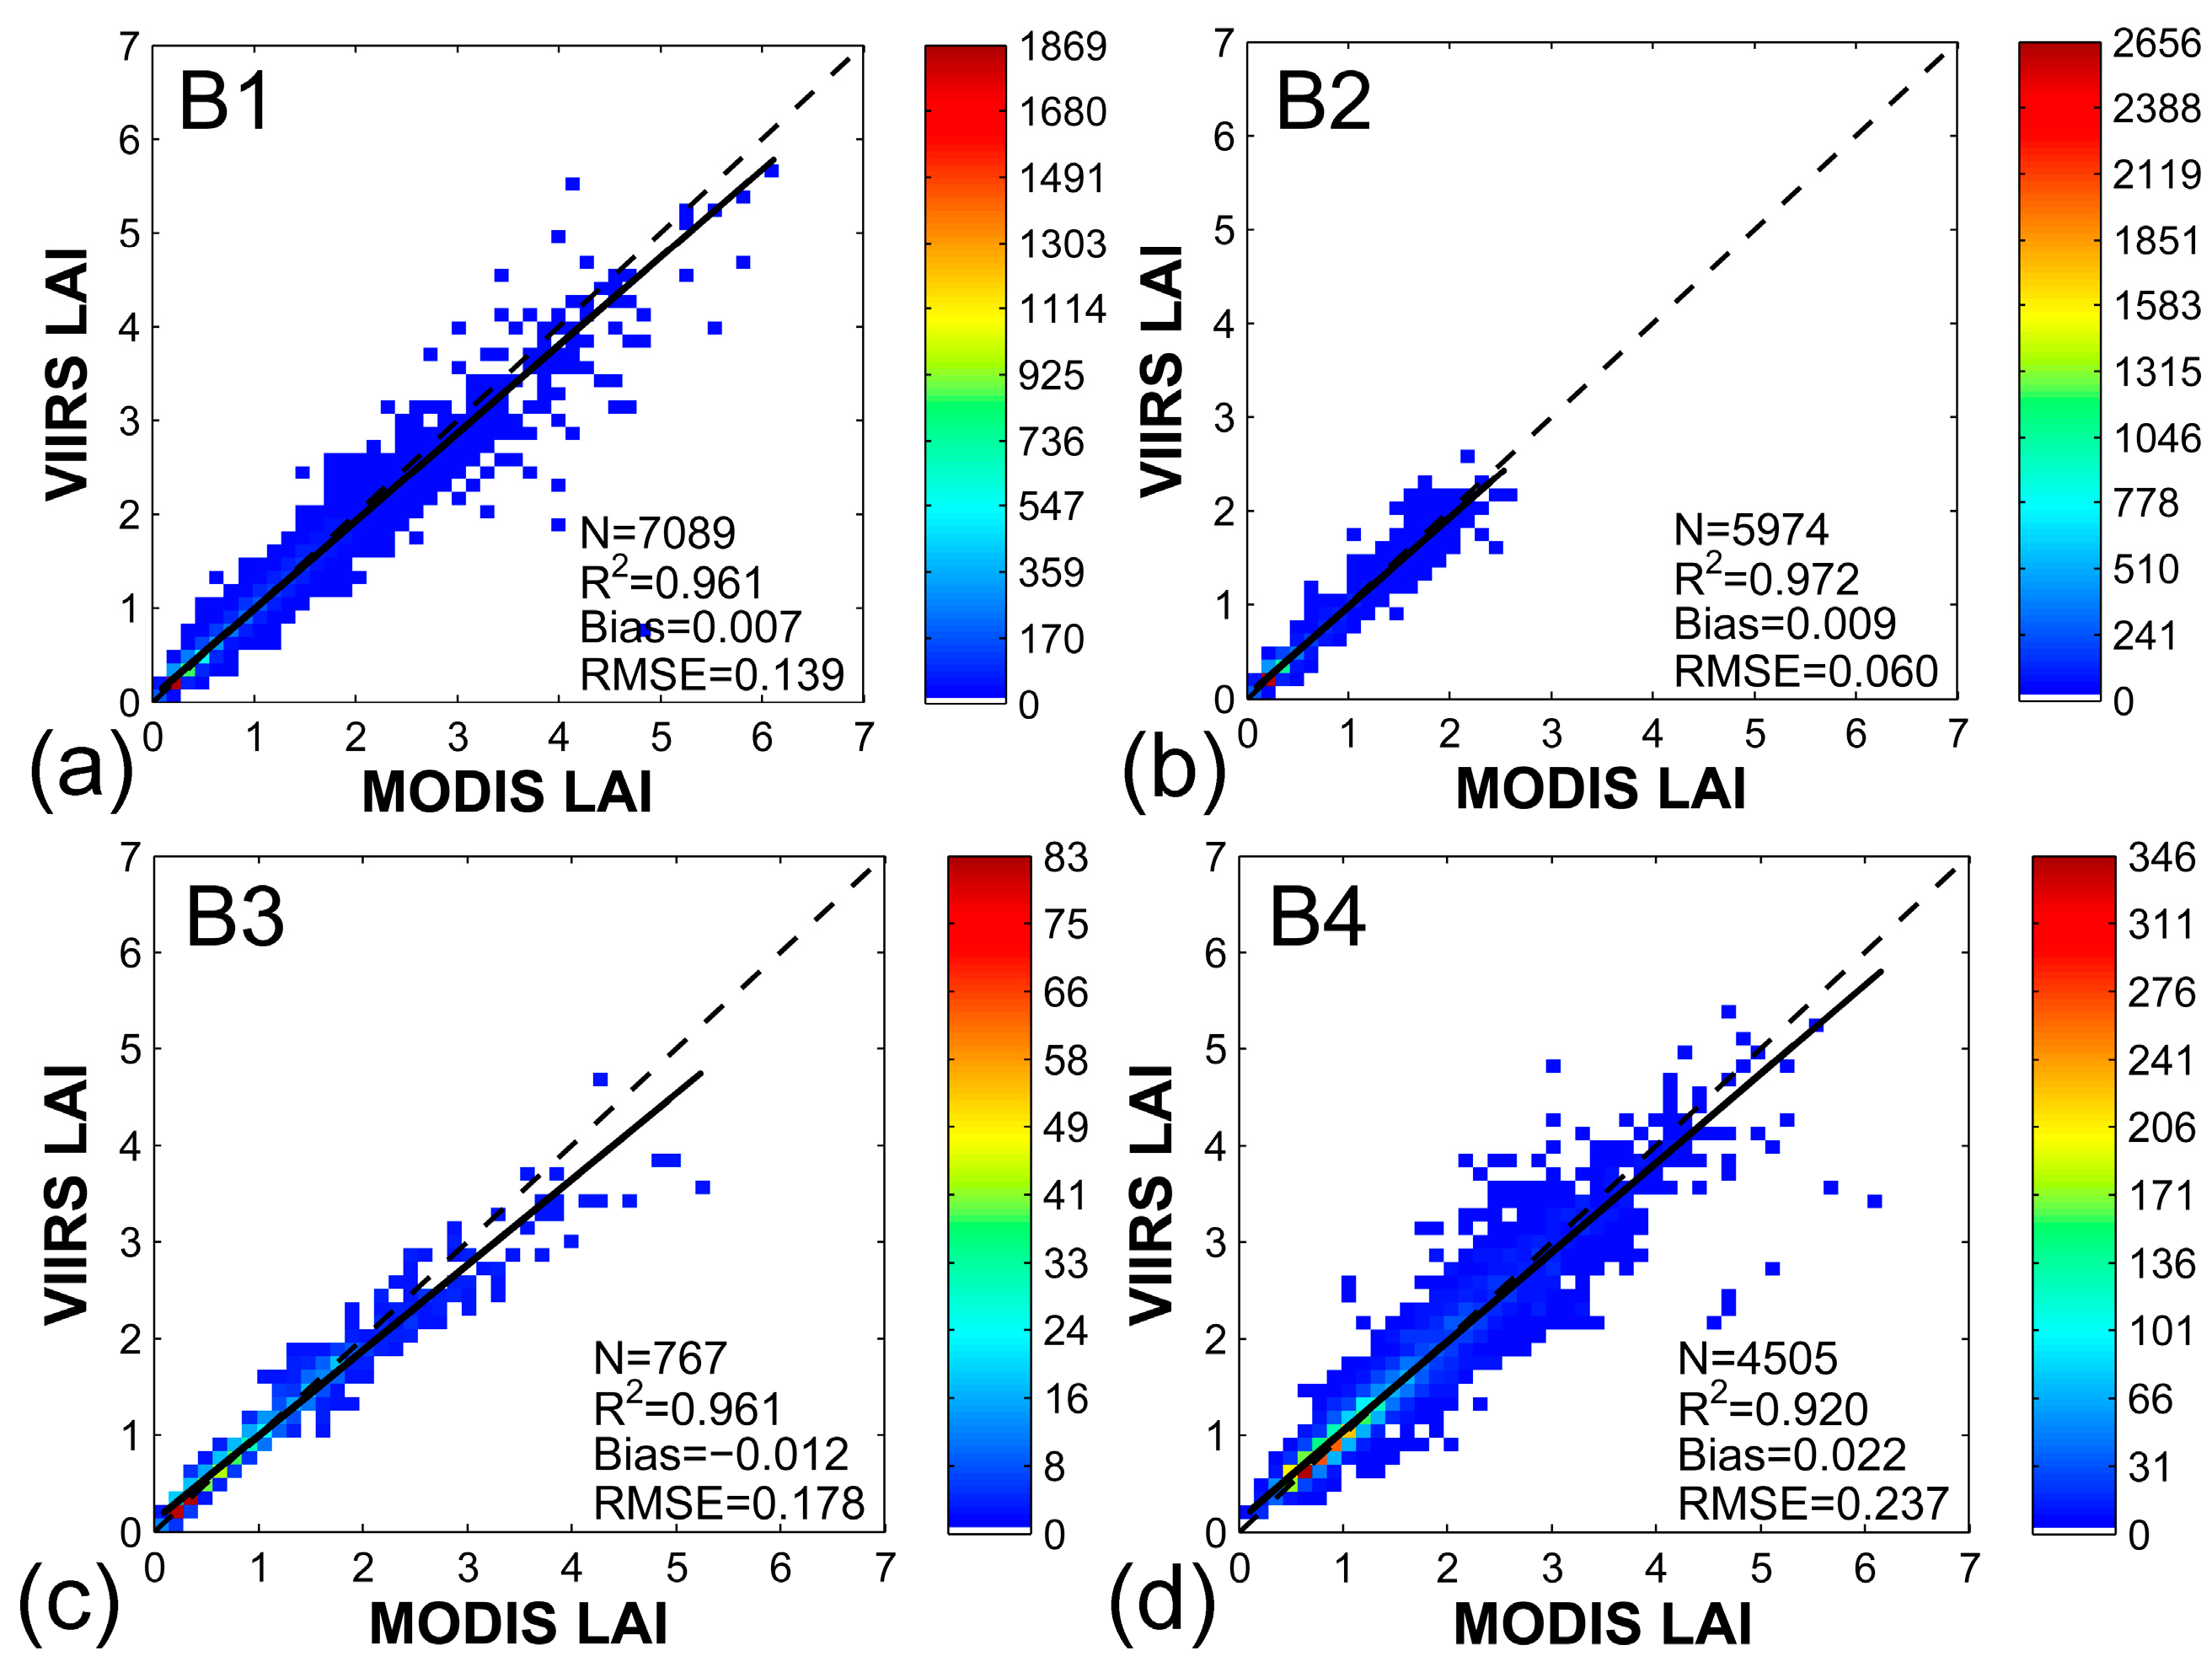
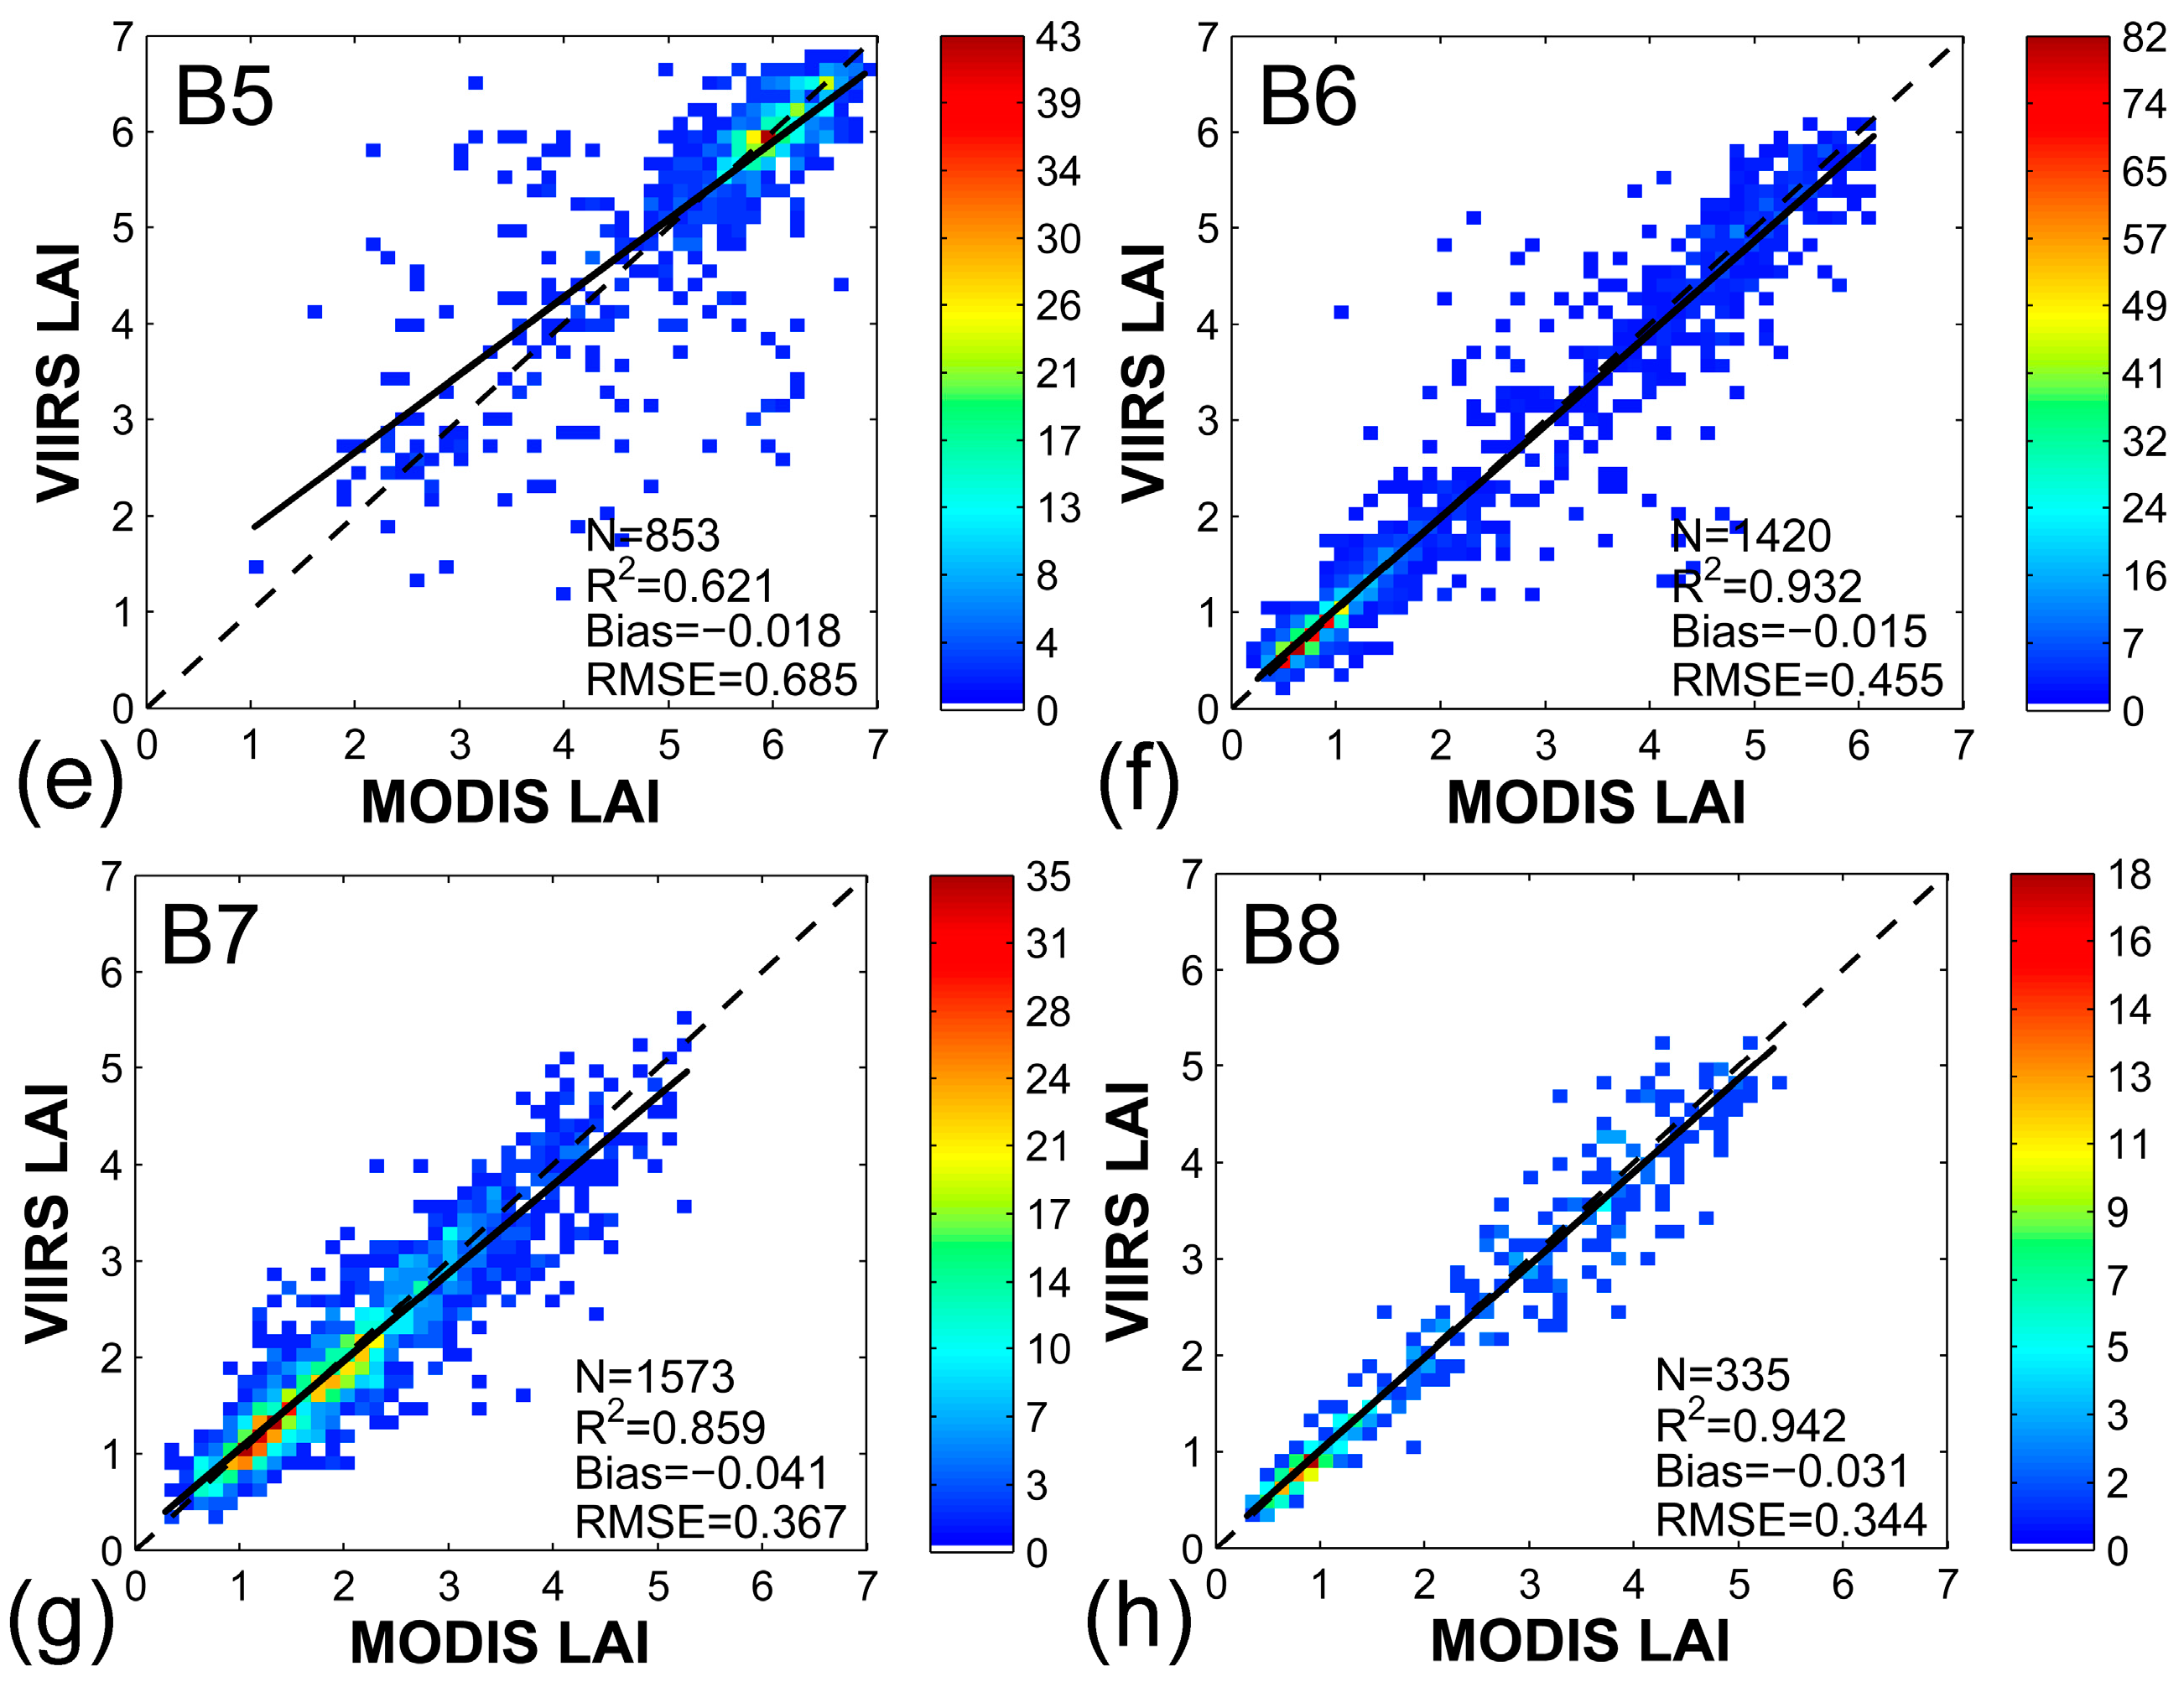
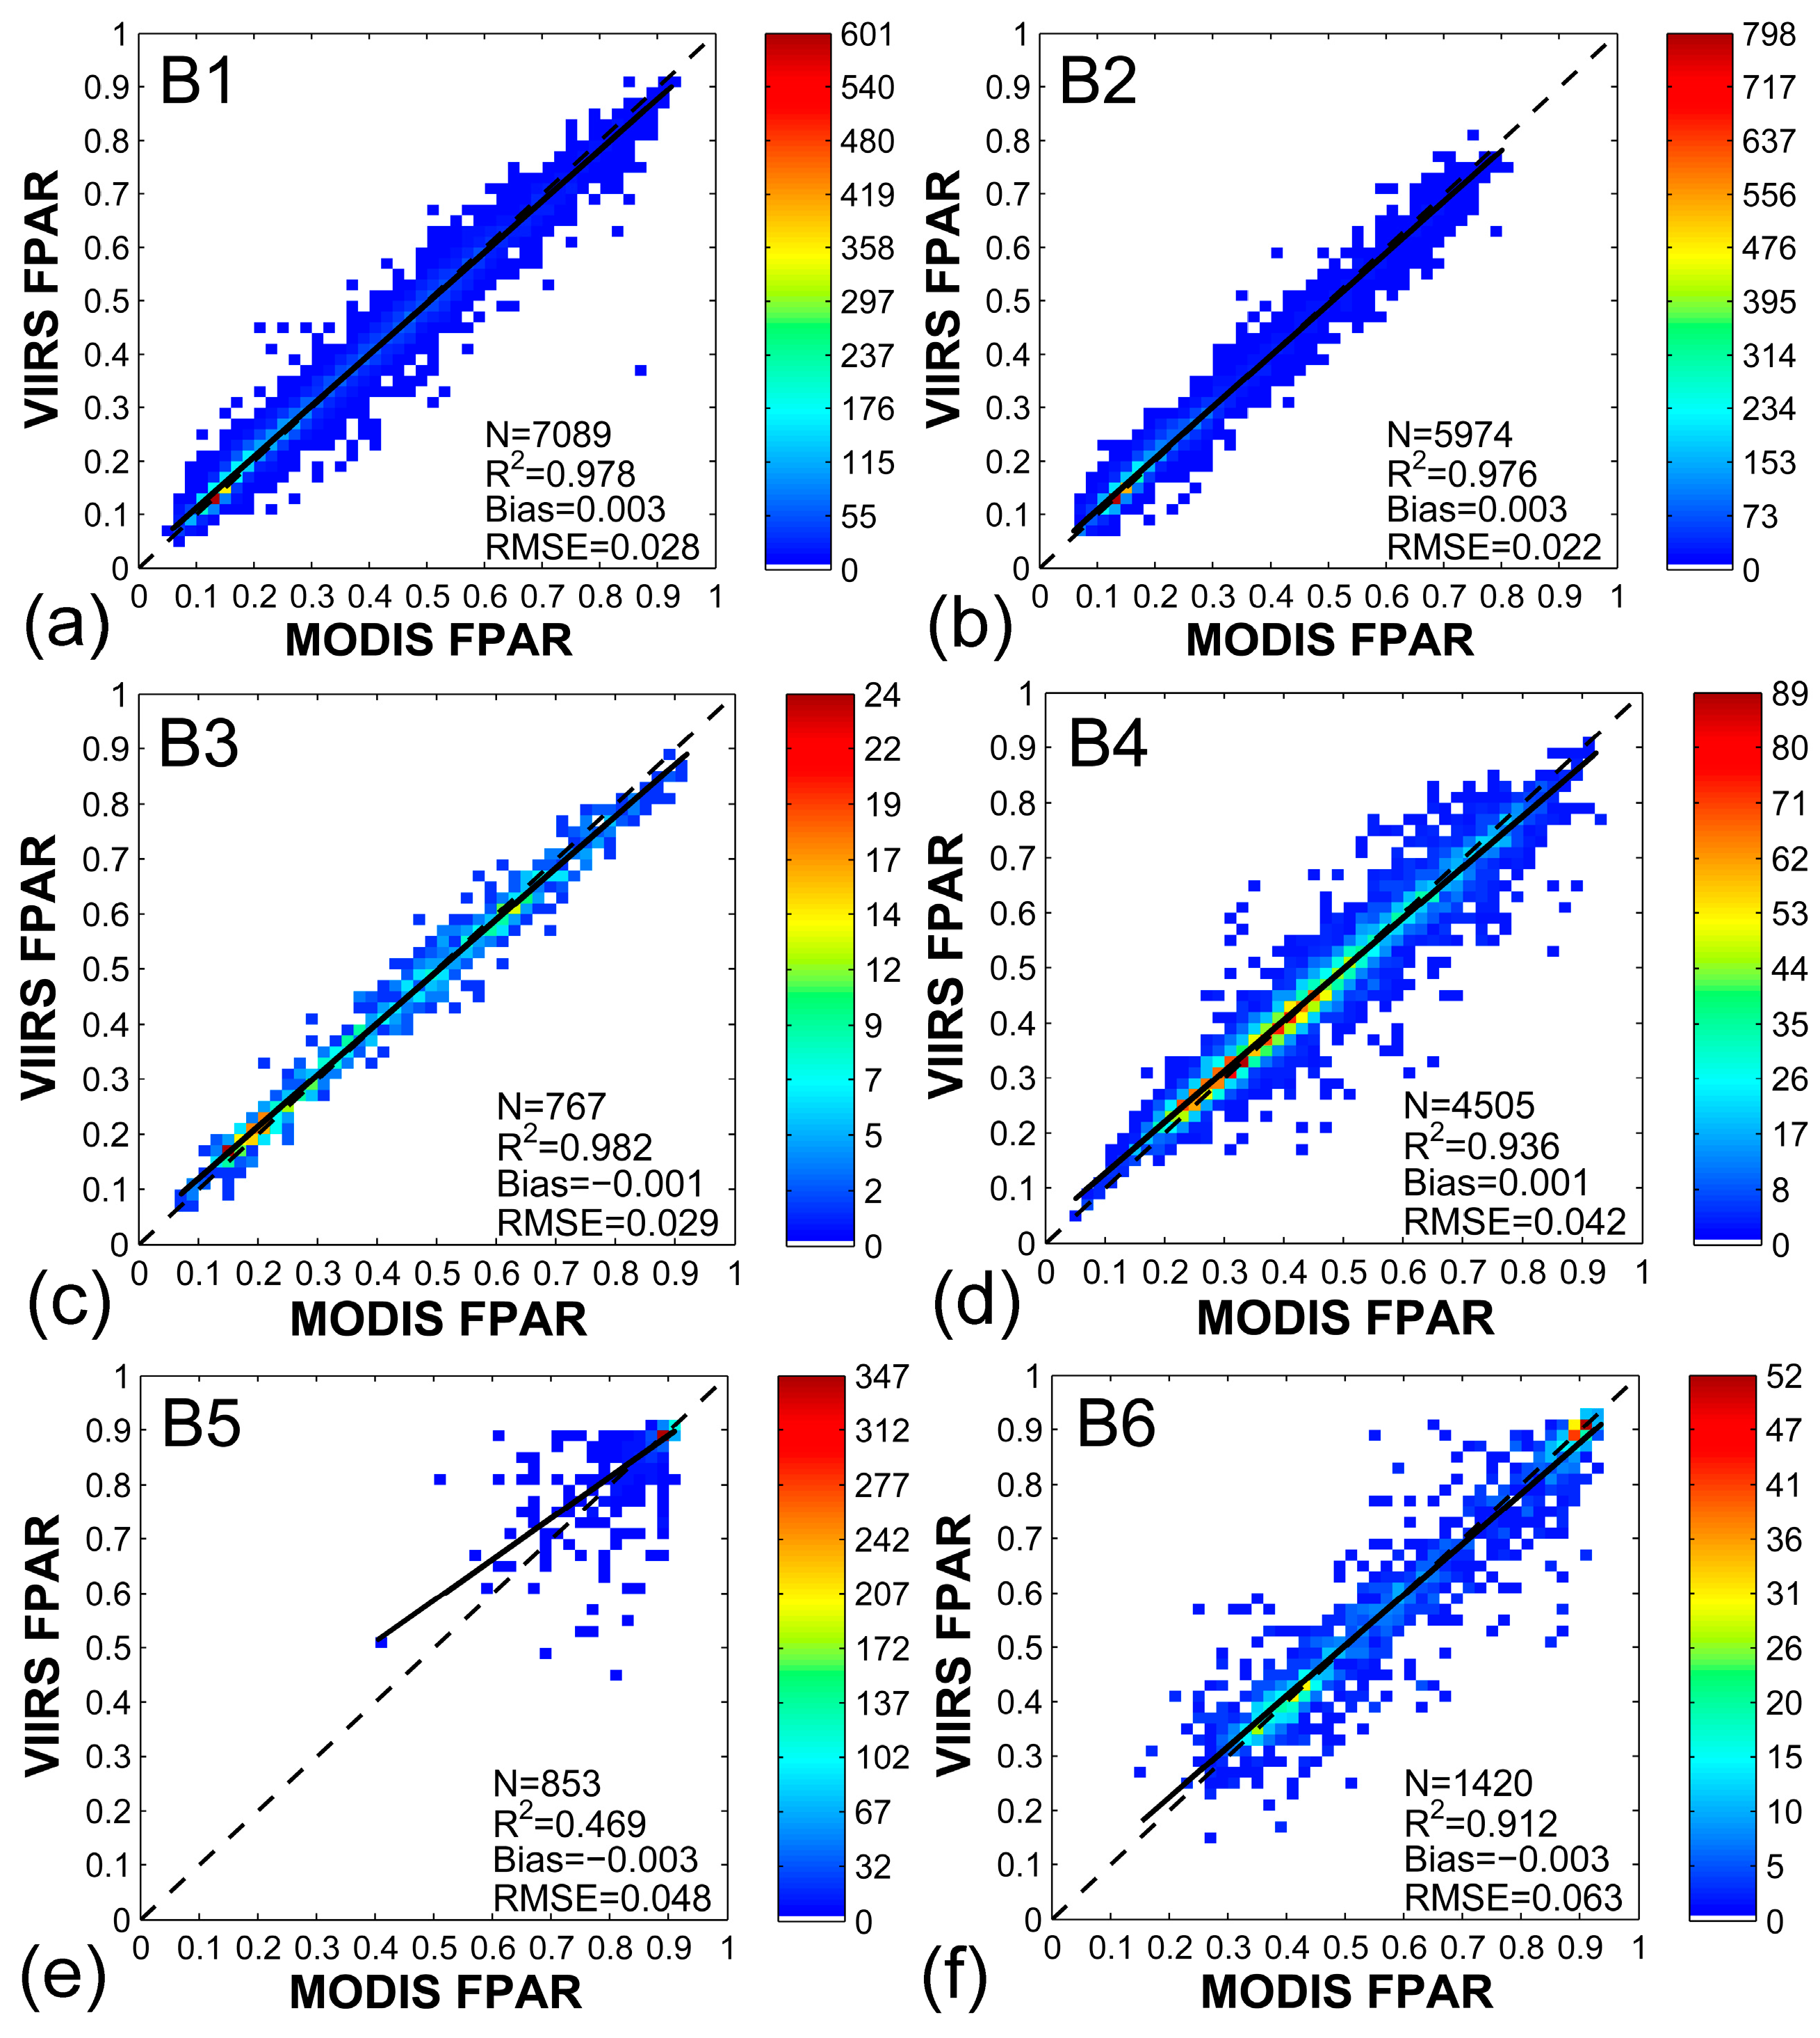
4.1. Spatiotemporal Consistency between VIIRS and MODIS
4.1.1. Global Scale
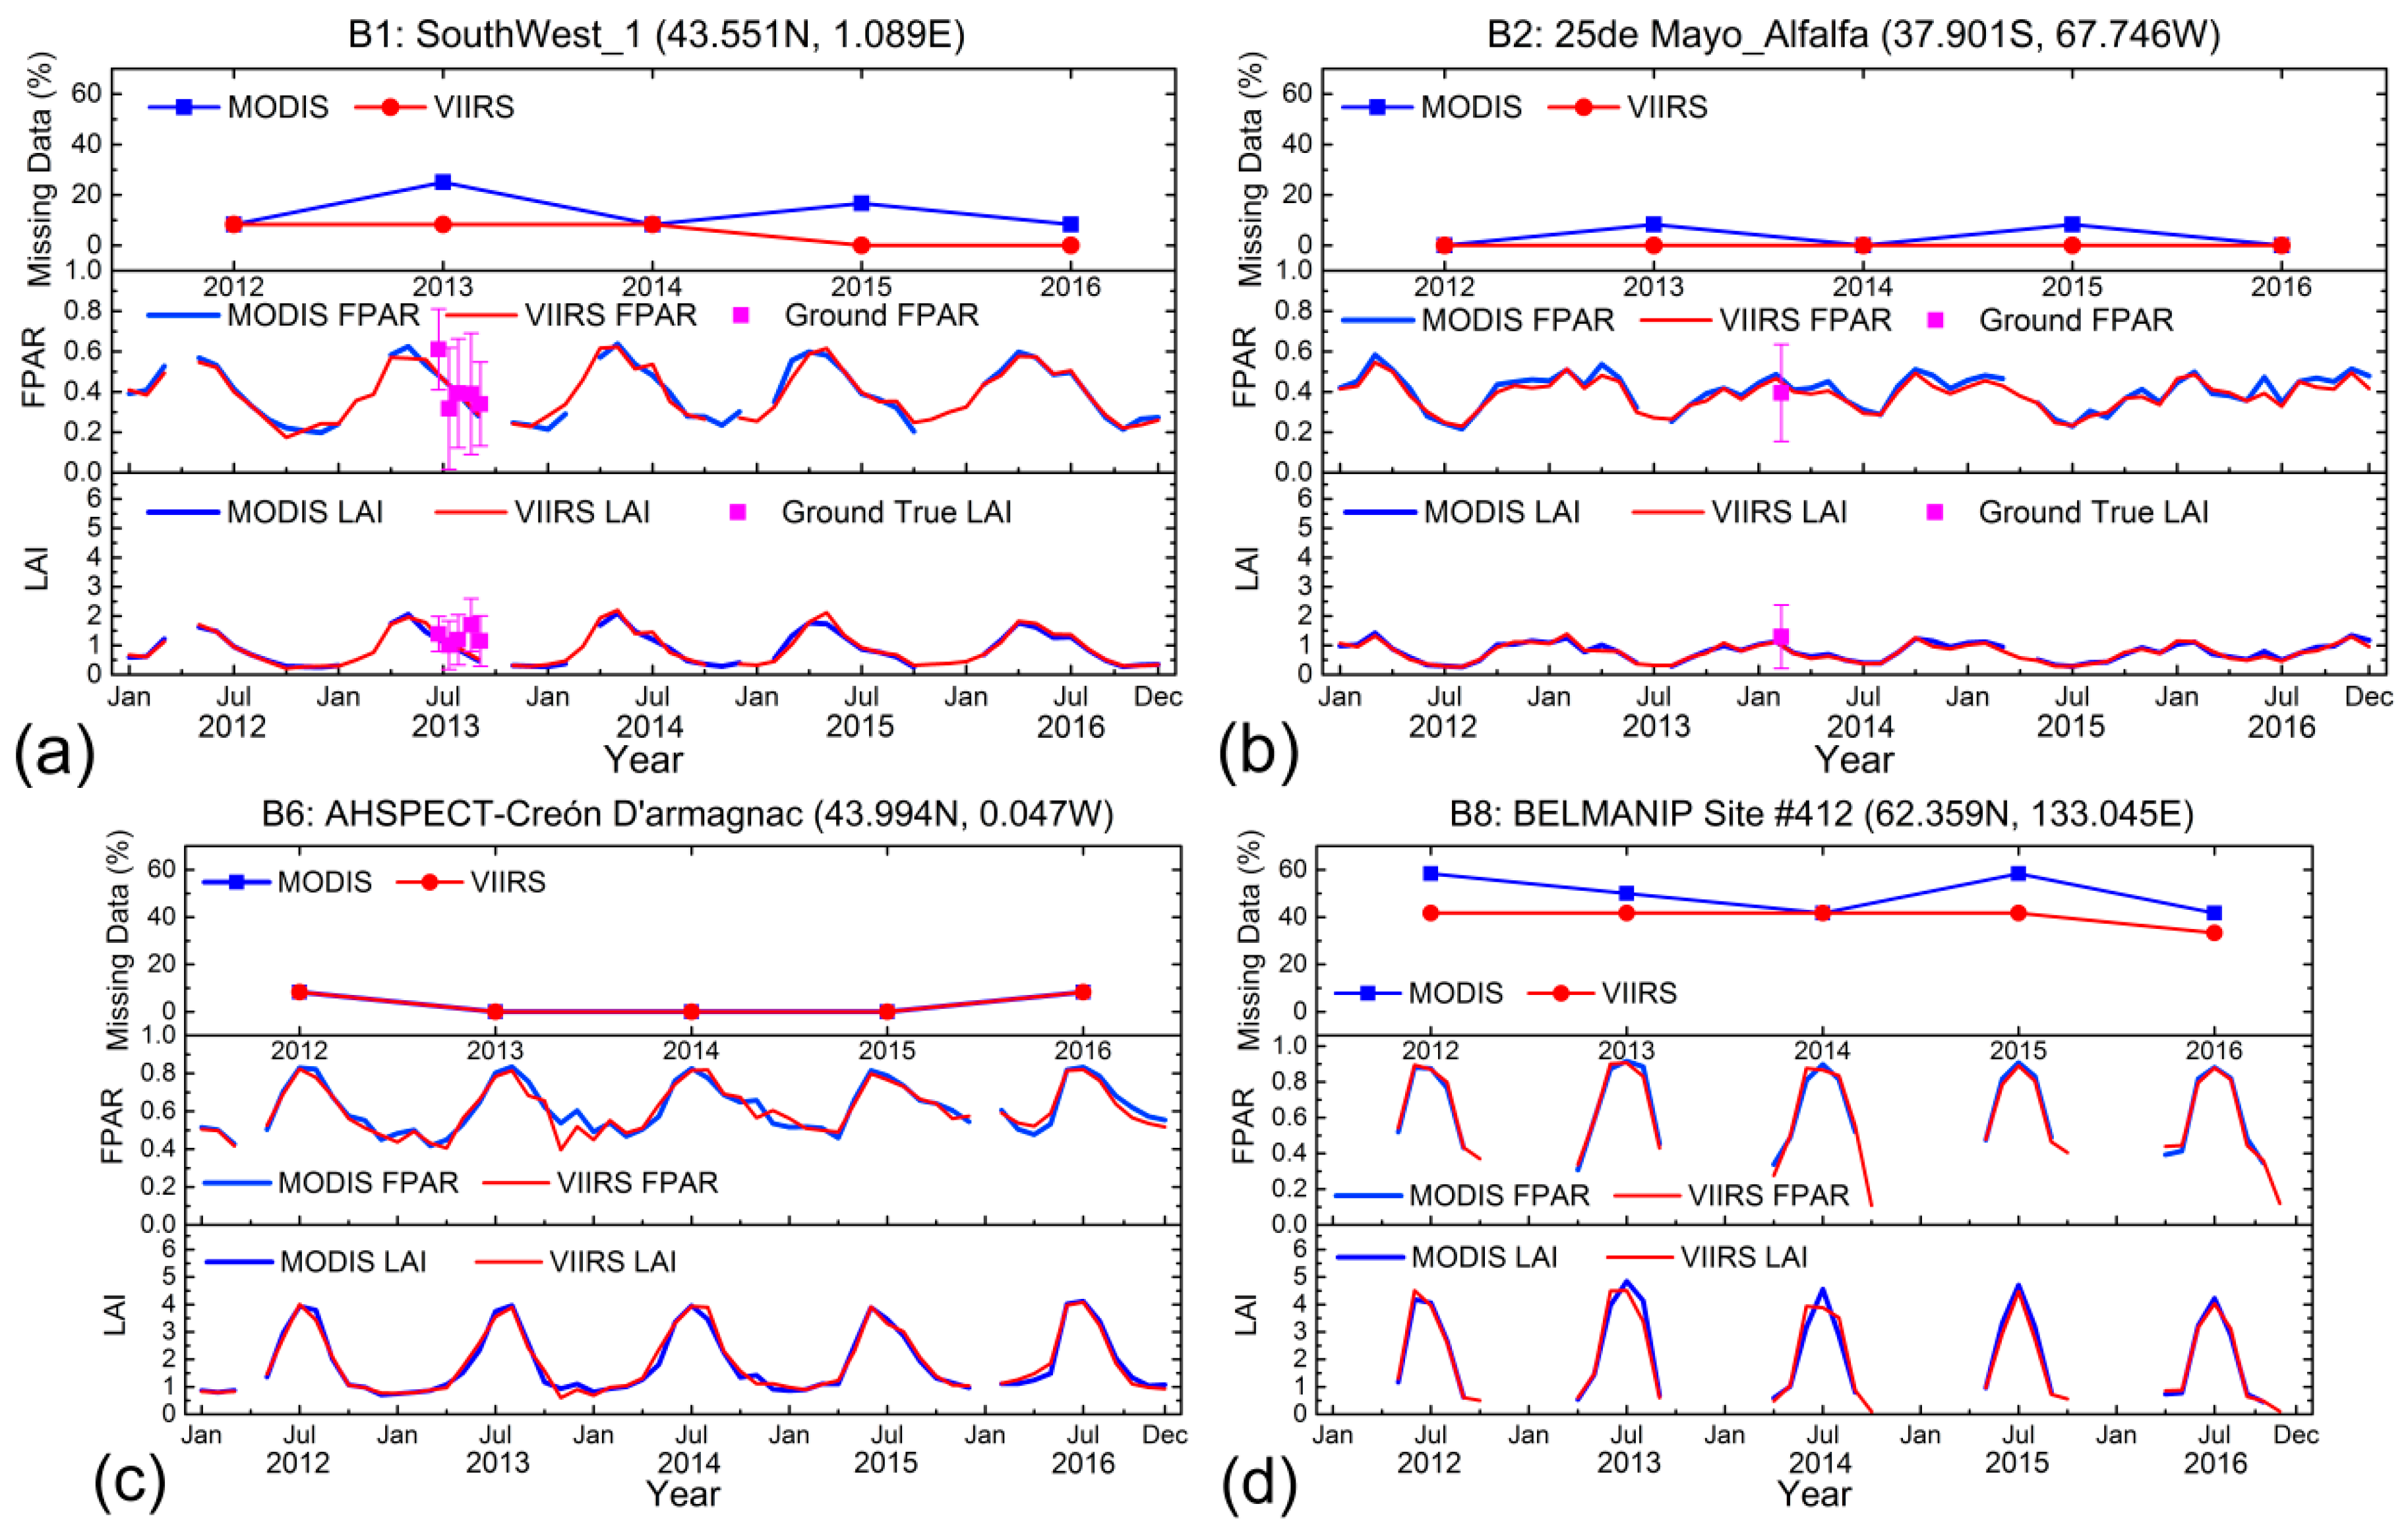
4.1.2. Site Scale
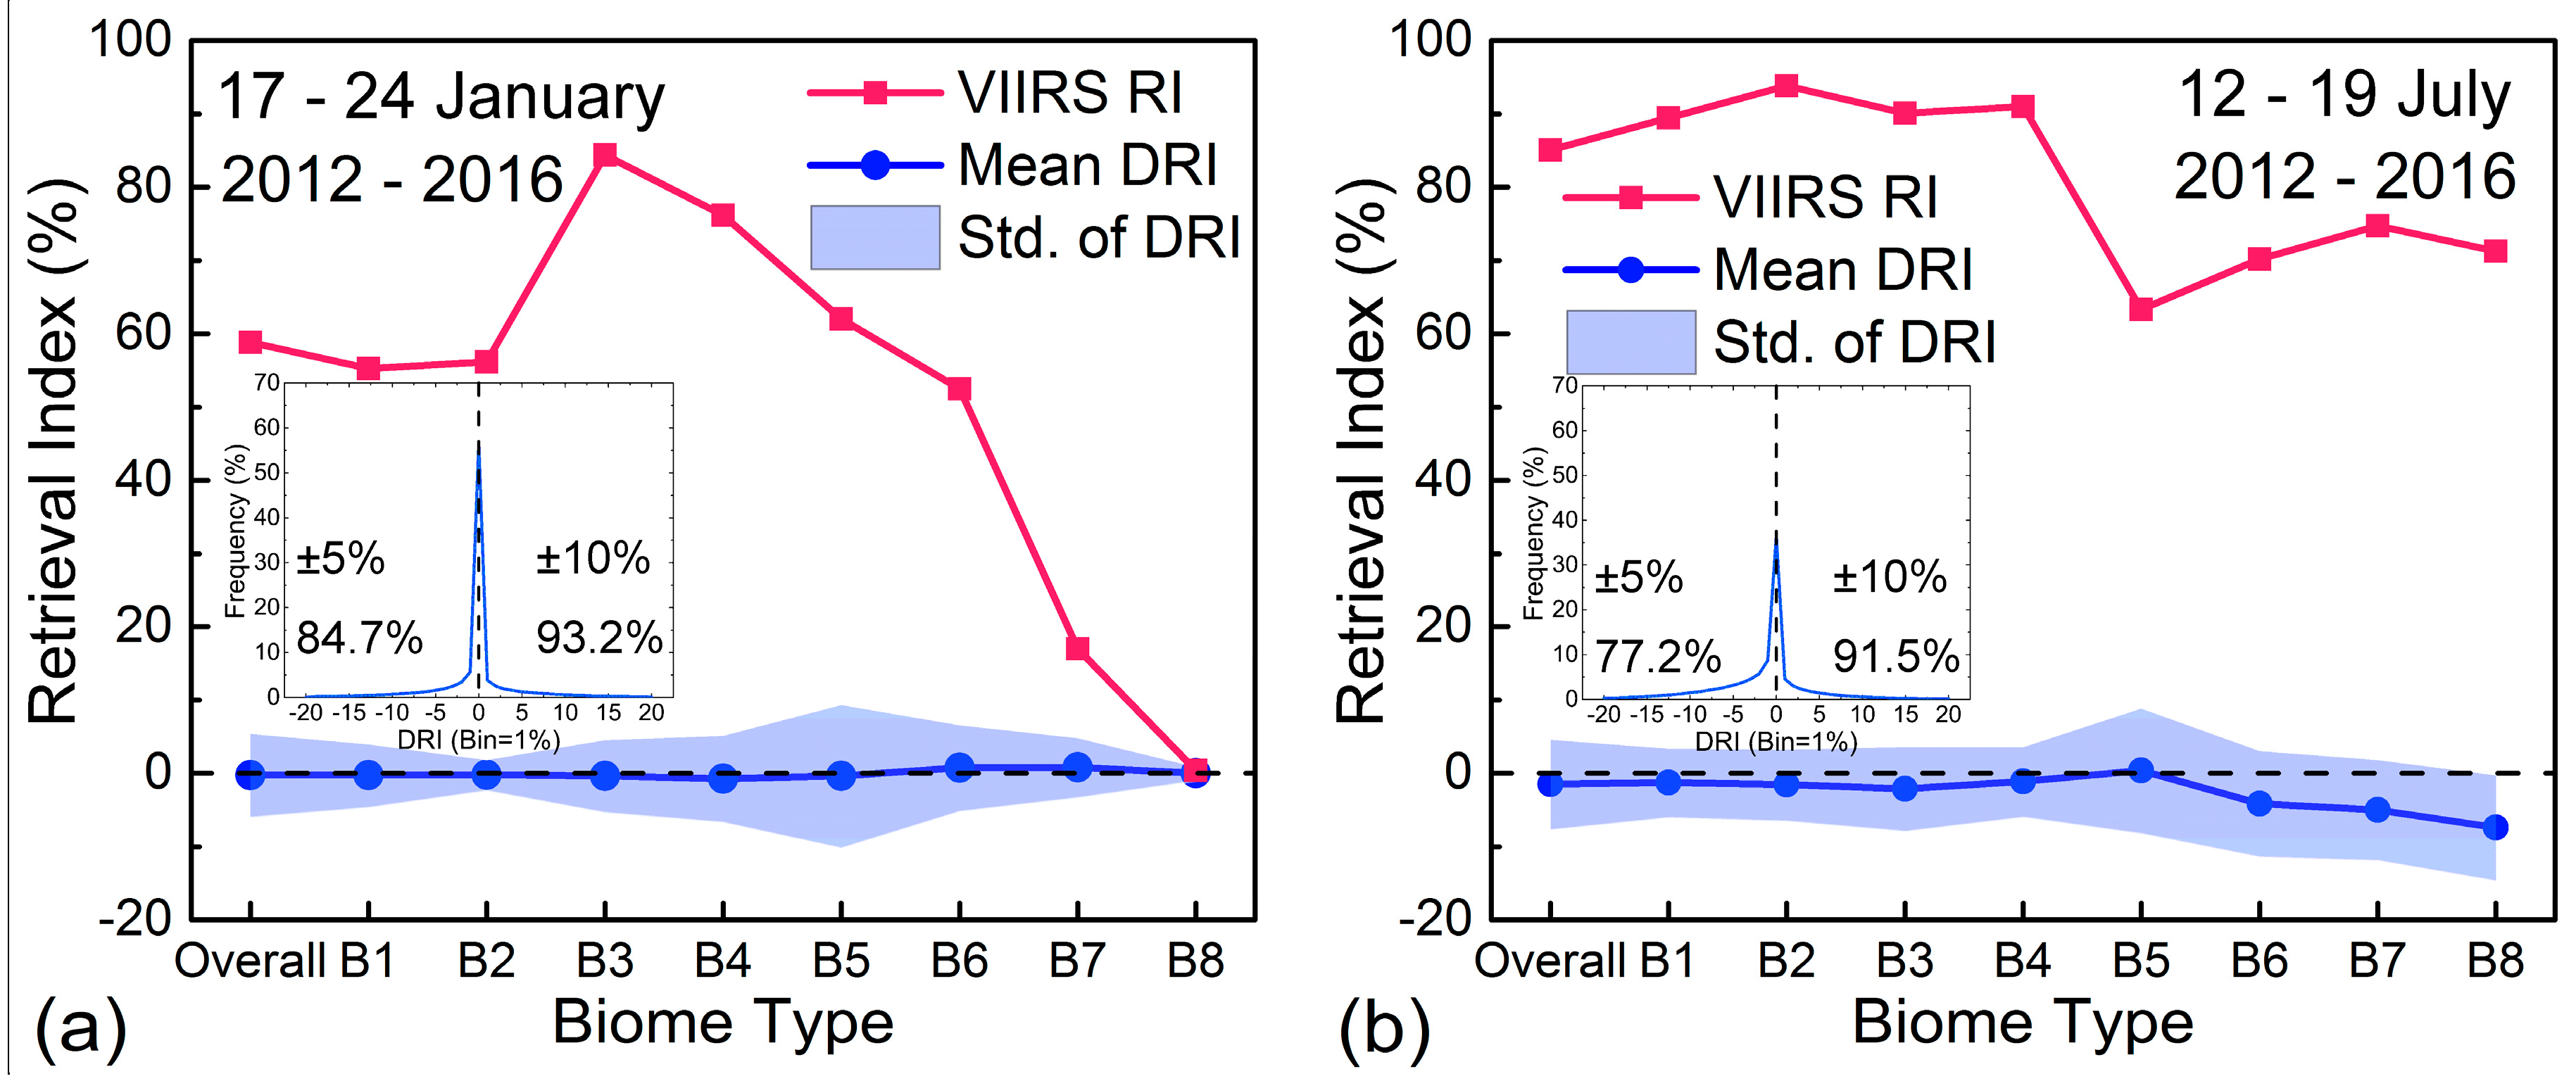
4.2. Spatial Coverage
4.3. Uncertainty Assessment
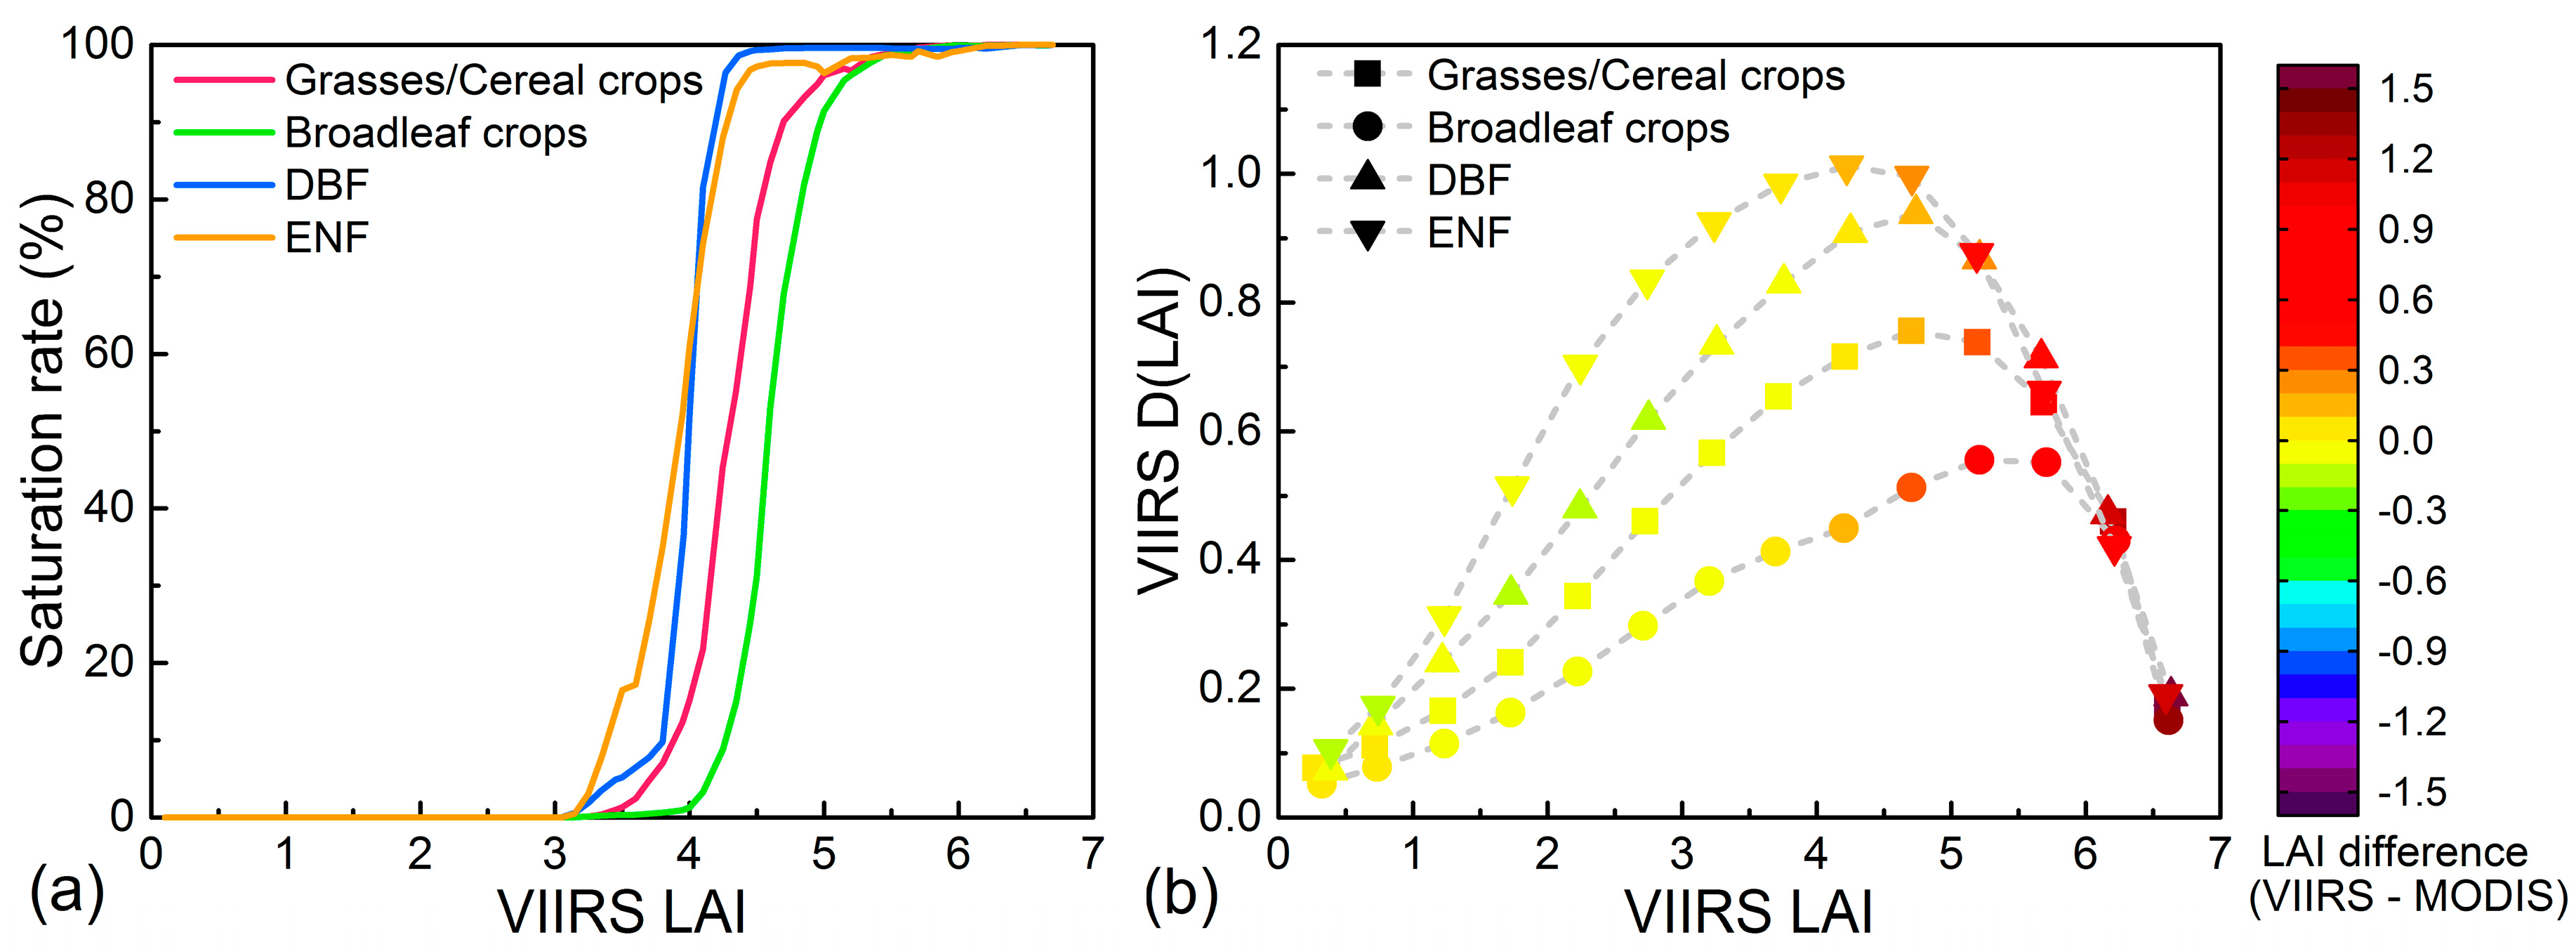
5. Discussion
5.1. Understanding Inconsistency between VIIRS and MODIS
5.2. Limitation and Future Direction
6. Conclusions
Supplementary Materials
Acknowledgments
Author Contributions
Conflicts of Interest
References
- Sellers, P.J.; Dickinson, R.E.; Randall, D.A.; Betts, A.K.; Hall, F.G.; Berry, J.A.; Collatz, G.J.; Denning, A.S.; Mooney, H.A.; Nobre, C.A.; et al. Modeling the exchanges of energy, water, and carbon between continents and the atmosphere. Science 1997, 275, 502–509. [Google Scholar] [CrossRef] [PubMed]
- Myneni, R.B.; Hoffman, S.; Knyazikhin, Y.; Privette, J.L.; Glassy, J.; Tian, Y.; Wang, Y.; Song, X.; Zhang, Y.; Smith, G.R.; et al. Global products of vegetation leaf area and fraction absorbed par from year one of MODIS data. Remote Sens. Environ. 2002, 83, 214–231. [Google Scholar] [CrossRef]
- Garrigues, S.; Lacaze, R.; Baret, F.; Morisette, J.T.; Weiss, M.; Nickeson, J.E.; Fernandes, R.; Plummer, S.; Shabanov, N.V.; Myneni, R.B.; et al. Validation and intercomparison of global leaf area index products derived from remote sensing data. J. Geophys. Res. 2008, 113, G02028. [Google Scholar] [CrossRef]
- Fensholt, R.; Sandholt, I.; Rasmussen, M.S. Evaluation of MODIS LAI, FAPAR and the relation between FAPAR and NDVI in a semi-arid environment using in situ measurements. Remote Sens. Environ. 2004, 91, 490–507. [Google Scholar] [CrossRef]
- Baret, F.; Weiss, M.; Lacaze, R.; Camacho, F.; Makhmara, H.; Pacholcyzk, P.; Smets, B. GEOV1: LAI and FAPAR essential climate variables and FCOVER global time series capitalizing over existing products. Part 1: Principles of development and production. Remote Sens. Environ. 2013, 137, 299–309. [Google Scholar] [CrossRef]
- Xiao, Z.; Liang, S.; Wang, J.; Chen, P.; Yin, X.; Zhang, L.; Song, J. Use of general regression neural networks for generating the glass leaf area index product from time-series MODIS surface reflectance. IEEE Trans. Geosci. Remote Sens. 2014, 52, 209–223. [Google Scholar] [CrossRef]
- Yan, K.; Park, T.; Yan, G.; Chen, C.; Yang, B.; Liu, Z.; Nemani, R.; Knyazikhin, Y.; Myneni, R. Evaluation of MODIS LAI/FPAR product collection 6. Part 1: Consistency and improvements. Remote Sens. 2016, 8, 359. [Google Scholar] [CrossRef]
- Skakun, S.; Justice, C.O.; Vermote, E.; Roger, J.-C. Transitioning from MODIS to VIIRS: An analysis of inter-consistency of NDVI data sets for agricultural monitoring. Int. J. Remote Sens. 2018, 39, 971–992. [Google Scholar] [CrossRef]
- Justice, C.O.; Román, M.O.; Csiszar, I.; Vermote, E.F.; Wolfe, R.E.; Hook, S.J.; Friedl, M.; Wang, Z.; Schaaf, C.B.; Miura, T.; et al. Land and cryosphere products from Suomi NPP VIIRS: Overview and status. J. Geophys. Res. Atmos. 2013, 118, 9753–9765. [Google Scholar] [CrossRef] [PubMed]
- Ganguly, S.; Samanta, A.; Schull, M.A.; Shabanov, N.V.; Milesi, C.; Nemani, R.R.; Knyazikhin, Y.; Myneni, R.B. Generating vegetation leaf area index earth system data record from multiple sensors. Part 2: Implementation, analysis and validation. Remote Sens. Environ. 2008, 112, 4318–4332. [Google Scholar] [CrossRef]
- Yan, K.; Park, T.; Chen, C.; Xu, B.; Song, W.; Yang, B.; Zeng, Y.; Liu, Z.; Yan, G.; Knyazikhin, Y.; et al. Generating global products of LAI and FPAR from SNPP-VIIRS data: Theoretical background and implementation. IEEE Trans. Geosci. Remote Sens. 2018, 56, 1–19. [Google Scholar] [CrossRef]
- Huang, D.; Knyazikhin, Y.; Dickinson, R.E.; Rautiainen, M.; Stenberg, P.; Disney, M.; Lewis, P.; Cescatti, A.; Tian, Y.; Verhoef, W.; et al. Canopy spectral invariants for remote sensing and model applications. Remote Sens. Environ. 2007, 106, 106–122. [Google Scholar] [CrossRef]
- Knyazikhin, Y.; Martonchik, J.V.; Myneni, R.B.; Diner, D.J.; Running, S.W. Synergistic algorithm for estimating vegetation canopy leaf area index and fraction of absorbed photosynthetically active radiation from MODIS and MISR data. J. Geophys. Res. Atmos. 1998, 103, 32257–32275. [Google Scholar] [CrossRef]
- Knyazikhin, Y.; Schull, M.A.; Stenberg, P.; Mõttus, M.; Rautiainen, M.; Yang, Y.; Marshak, A.; Latorre Carmona, P.; Kaufmann, R.K.; Lewis, P.; et al. Hyperspectral remote sensing of foliar nitrogen content. Proc. Natl. Acad. Sci. USA 2013, 110, E185–E192. [Google Scholar] [CrossRef] [PubMed]
- Park, T.; Yan, K.; Chen, C.; Xu, B.; Knyazikhin, Y.; Myneni, R.B. VIIRS Leaf Area Index (LAI) and Fraction of Photosynthetically Active Radiation Absorbed by Vegetation (FPAR) Product Algorithm Theoretical Basis Document (ATBD). Available online: https://viirsland.gsfc.nasa.gov/Products/NASA/LAI_FparESDR.html (accessed on 10 November 2017).
- Myneni, R.B.; Ross, J. Photon-Vegetation Interactions: Applications in Optical Remote Sensing and Plant Ecology; Springer-Verlag: New York, NY, USA, 1991. [Google Scholar]
- Ross, J. The Radiation Regime and Architecture of Plant Stands; Springer Science & Business Media: Medford, MA, USA, 1981. [Google Scholar]
- Hillger, D.; Kopp, T.; Lee, T.; Lindsey, D.; Seaman, C.; Miller, S.; Solbrig, J.; Kidder, S.; Bachmeier, S.; Jasmin, T.; et al. First-light imagery from Suomi NPP VIIRS. Bull. Am. Meteorol. Soc. 2013, 94, 1019–1029. [Google Scholar] [CrossRef]
- Liu, H.; Remer, L.A.; Huang, J.; Huang, H.-C.; Kondragunta, S.; Laszlo, I.; Oo, M.; Jackson, J.M. Preliminary evaluation of S-NPP VIIRS aerosol optical thickness. J. Geophys. Res. Atmos. 2014, 119, 3942–3962. [Google Scholar] [CrossRef]
- Xiong, X.; Butler, J.; Chiang, K.; Efremova, B.; Fulbright, J.; Lei, N.; McIntire, J.; Oudrari, H.; Sun, J.; Wang, Z.; et al. VIIRS on-orbit calibration methodology and performance. J. Geophys. Res. Atmos. 2014, 119, 5065–5078. [Google Scholar] [CrossRef]
- Wolfe, R.E.; Lin, G.; Nishihama, M.; Tewari, K.P.; Tilton, J.C.; Isaacman, A.R. Suomi NPP VIIRS prelaunch and on-orbit geometric calibration and characterization. J. Geophys. Res. Atmos. 2013, 118, 508–511, 521. [Google Scholar] [CrossRef]
- Ganguly, S.; Schull, M.A.; Samanta, A.; Shabanov, N.V.; Milesi, C.; Nemani, R.R.; Knyazikhin, Y.; Myneni, R.B. Generating vegetation leaf area index earth system data record from multiple sensors. Part 1: Theory. Remote Sens. Environ. 2008, 112, 4333–4343. [Google Scholar] [CrossRef]
- Baret, F.; Jacquemoud, S.; Hanocq, J.F. The soil line concept in remote sensing. Remote Sens. Rev. 1993, 7, 65–82. [Google Scholar] [CrossRef]
- Jacquemoud, S.; Baret, F.; Hanocq, J.F. Modeling spectral and bidirectional soil reflectance. Remote Sens. Environ. 1992, 41, 123–132. [Google Scholar] [CrossRef]
- Lewis, P.; Disney, M. Spectral invariants and scattering across multiple scales from within-leaf to canopy. Remote Sens. Environ. 2007, 109, 196–206. [Google Scholar] [CrossRef]
- Schull, M.A.; Knyazikhin, Y.; Xu, L.; Samanta, A.; Carmona, P.L.; Lepine, L.; Jenkins, J.P.; Ganguly, S.; Myneni, R.B. Canopy spectral invariants, Part 2: Application to classification of forest types from hyperspectral data. J. Quant. Spectrosc. Radiat. Transf. 2011, 112, 736–750. [Google Scholar] [CrossRef]
- Smolander, S.; Stenberg, P. Simple parameterizations of the radiation budget of uniform broadleaved and coniferous canopies. Remote Sens. Environ. 2005, 94, 355–363. [Google Scholar] [CrossRef]
- Vermote, E.F. VIIRS/NPP Surface Reflectance Daily L2G Global 1 km and 500 m Sin Grid v001 [Data Set]. NASA EOS MODIS Land Processes DAAC. Available online: https://doi.org/10.5067/viirs/vnp09ga.001 (accessed on 15 November 2017).
- Yang, W.; Shabanov, N.V.; Huang, D.; Wang, W.; Dickinson, R.E.; Nemani, R.R.; Knyazikhin, Y.; Myneni, R.B. Analysis of leaf area index products from combination of MODIS terra and aqua data. Remote Sens. Environ. 2006, 104, 297–312. [Google Scholar] [CrossRef]
- Myneni, R.B.; Knyazikhin, Y.; Park, T. MYD15A2H MODIS/Aqua Leaf Area Index/FPAR 8-Day L4 Global 500m Sin Grid v006 [Data Set]. NASA EOS MODIS Land Processes DAAC. Available online: https://doi.org/10.5067/modis/myd15a2h.006 (accessed on 10 September 2017).
- Yan, K.; Park, T.; Yan, G.; Liu, Z.; Yang, B.; Chen, C.; Nemani, R.; Knyazikhin, Y.; Myneni, R. Evaluation of MODIS LAI/FPAR product collection 6. Part 2: Validation and intercomparison. Remote Sens. 2016, 8, 460. [Google Scholar] [CrossRef]
- Global Climate Observing System (GCOS). Systematic Observation Requirements for Satellite-Based Products for Climate, 2011 Update, Supplemental Details to the Satellite-Based Component of the Implementation Plan for the Global Observing System for Climate in Support of the UNFCCC (2010 Update). Available online: https://library.wmo.int/opac/doc_num.php?explnum_id=3710 (accessed on 9 September 2017).
- Weiss, M.; Baret, F.; Garrigues, S.; Lacaze, R. LAI and FAPAR CYCLOPES global products derived from VEGETATION. Part 2: Validation and comparison with MODIS collection 4 products. Remote Sens. Environ. 2007, 110, 317–331. [Google Scholar] [CrossRef]
- Fernandes, R.; Butson, C.; Leblanc, S.; Latifovic, R. Landsat-5 TM and landsat-7 ETM+ based accuracy assessment of leaf area index products for Canada derived from SPOT-4 VEGETATION data. Can. J. Remote Sens. 2003, 29, 241–258. [Google Scholar] [CrossRef]
- Tan, B.; Woodcock, C.E.; Hu, J.; Zhang, P.; Ozdogan, M.; Huang, D.; Yang, W.; Knyazikhin, Y.; Myneni, R.B. The impact of gridding artifacts on the local spatial properties of MODIS data: Implications for validation, compositing, and band-to-band registration across resolutions. Remote Sens. Environ. 2006, 105, 98–114. [Google Scholar] [CrossRef]
- Camacho, F.; Cernicharo, J.; Lacaze, R.; Baret, F.; Weiss, M. GEOV1: LAI, FAPAR essential climate variables and fcover global time series capitalizing over existing products. Part 2: Validation and intercomparison with reference products. Remote Sens. Environ. 2013, 137, 310–329. [Google Scholar] [CrossRef]
- Fernandes, R.; Plummer, S.; Nightingale, J.; Baret, F.; Camacho, F.; Fang, H.; Garrigues, S.; Gobron, N.; Lang, M.; Lacaze, R.; et al. Global Leaf Area Index Product Validation Good Practices. Version 2.0. In Best Practice for Satellite-Derived Land Product Validation (p. 76): Land Product Validation Subgroup (WGCV/CEOS); Schaepman-Strub, G., Román, M., Nickeson, J., Eds.; Committee on Earth Observation Satellites: Maryland, MD, USA, 2014; pp. 1–78. [Google Scholar] [CrossRef]
- Verger, A.; Baret, F.; Weiss, M. Performances of neural networks for deriving LAI estimates from existing CYCLOPES and MODIS products. Remote Sens. Environ. 2008, 112, 2789–2803. [Google Scholar] [CrossRef]
- Baret, F.; Morissette, J.T.; Fernandes, R.A.; Champeaux, J.L.; Myneni, R.B.; Chen, J.; Plummer, S.; Weiss, M.; Bacour, C.; Garrigues, S.; et al. Evaluation of the representativeness of networks of sites for the global validation and intercomparison of land biophysical products: Proposition of the ceos-belmanip. IEEE Trans. Geosci. Remote Sens. 2006, 44, 1794–1803. [Google Scholar] [CrossRef]
- Camacho, F.; Lacaze, R.; Latorre, C.; Baret, F.; De la Cruz, F.; Demarez, V.; Di Bella, C.; García-Haro, J.; González-Dugo, M.P.; Kussul, N. Collection of ground biophysical measurements in support of copernicus global land product validation: The imagines database. In Proceedings of the EGU General Assembly, Vienna, Austria, 17–22 April 2015. Geophysical Research Abstracts, 17 EGU2015-2209-1. [Google Scholar]
- Li, X.; Cheng, G.; Liu, S.; Xiao, Q.; Ma, M.; Jin, R.; Che, T.; Liu, Q.; Wang, W.; Qi, Y.; et al. Heihe watershed allied telemetry experimental research (HiWATER): Scientific objectives and experimental design. Bull. Am. Meteorol. Soc. 2013, 94, 1145–1160. [Google Scholar] [CrossRef]
- Zhao, J.; Li, J.; Liu, Q.; Fan, W.; Zhong, B.; Wu, S.; Yang, L.; Zeng, Y.; Xu, B.; Yin, G. Leaf area index retrieval combining HJ1/CCD and Landsat8/OLI data in the Heihe River Basin, China. Remote Sens. 2015, 7, 6862. [Google Scholar] [CrossRef]
- Zeng, Y.; Li, J.; Liu, Q.; Qu, Y.; Huete, A.; Xu, B.; Yin, G.; Zhao, J. An optimal sampling design for observing and validating long-term leaf area index with temporal variations in spatial heterogeneities. Remote Sens. 2015, 7, 1300. [Google Scholar] [CrossRef]
- Yang, W.; Tan, B.; Huang, D.; Rautiainen, M.; Shabanov, N.V.; Wang, Y.J.; Privette, J.L.; Huemmrich, K.F.; Fensholt, R.; Sandholt, I.; et al. Modis leaf area index products: From validation to algorithm improvement. IEEE Trans. Geosci. Remote Sens. 2006, 44, 1885–1898. [Google Scholar] [CrossRef]
- Tan, B.; Hu, J.N.; Zhang, P.; Huang, D.; Shabanov, N.; Weiss, M.; Knyazikhin, Y.; Myneni, R.B. Validation of moderate resolution imaging spectroradiometer leaf area index product in croplands of Alpilles, France. J. Geophys. Res. Atmos. 2005, 110, D01107. [Google Scholar] [CrossRef]
- Morisette, J.T.; Baret, F.; Privette, J.L.; Myneni, R.B.; Nickeson, J.E.; Garrigues, S.; Shabanov, N.V.; Weiss, M.; Fernandes, R.A.; Leblanc, S.G.; et al. Validation of global moderate-resolution LAI products: A framework proposed within the CEOS land product validation subgroup. IEEE Trans. Geosci. Remote Sens. 2006, 44, 1804–1817. [Google Scholar] [CrossRef]
- Jiang, C.; Ryu, Y.; Fang, H.; Myneni, R.; Claverie, M.; Zhu, Z. Inconsistencies of interannual variability and trends in long-term satellite leaf area index products. Glob. Chang. Biol. 2017, 23, 4133–4146. [Google Scholar] [CrossRef] [PubMed]
- Zhu, Z.; Piao, S.; Myneni, R.B.; Huang, M.; Zeng, Z.; Canadell, J.G.; Ciais, P.; Sitch, S.; Friedlingstein, P.; Arneth, A.; et al. Greening of the earth and its drivers. Nat. Clim. Chang. 2016, 6, 791–795. [Google Scholar] [CrossRef]
- Shabanov, N.V.; Huang, D.; Yang, W.Z.; Tan, B.; Knyazikhin, Y.; Myneni, R.B.; Ahl, D.E.; Gower, S.T.; Huete, A.R.; Aragao, L.E.O.C.; et al. Analysis and optimization of the MODIS leaf area index algorithm retrievals over broadleaf forests. IEEE Trans. Geosci. Remote Sens. 2005, 43, 1855–1865. [Google Scholar] [CrossRef]
- Fang, H.; Wei, S.; Liang, S. Validation of MODIS and Cyclopes LAI products using global field measurement data. Remote Sens. Environ. 2012, 119, 43–54. [Google Scholar] [CrossRef]
- Huete, A.; Didan, K.; Miura, T.; Rodriguez, E.P.; Gao, X.; Ferreira, L.G. Overview of the radiometric and biophysical performance of the MODIS vegetation indices. Remote Sens. Environ. 2002, 83, 195–213. [Google Scholar] [CrossRef]
- Kobayashi, H.; Dye, D.G. Atmospheric conditions for monitoring the long-term vegetation dynamics in the Amazon using normalized difference vegetation index. Remote Sens. Environ. 2005, 97, 519–525. [Google Scholar] [CrossRef]
- Platnick, S.; Cechini, M.; Boller, R.; Schmaltz, J.; Manoharan, S.; Amarasinghe, N.; Levy, R.I. MODIS atmosphere discipline team: C6 status II. MODAWG: MODIS-VIIRS product continuity for cloud mask, cloud-top and optical properties status. In Proceedings of the MODIS/VIIRS 2016 Science Team Meeting, Silver Spring, MD, USA, 6–10 June 2016; Available online: https://modis.gsfc.nasa.gov/sci_team/meetings/201606/presentations/plenary/platnick.pdf (accessed on 9 January 2018).
- Pahlevan, N.; Sarkar, S.; Devadiga, S.; Wolfe, R.E.; Román, M.; Vermote, E.; Lin, G.; Xiong, X. Impact of spatial sampling on continuity of MODIS-VIIRS land surface reflectance products: A simulation approach. IEEE Trans. Geosci. Remote Sens. 2017, 55, 183–196. [Google Scholar] [CrossRef]
- Xu, B.; Li, J.; Park, T.; Liu, Q.; Zeng, Y.; Yin, G.; Zhao, J.; Fan, W.; Yang, L.; Knjazikhin, Y.; et al. An integrated method for validating long-term leaf area index products using global networks of site-based measurements. Remote Sens. Environ. 2018, accepted. [Google Scholar]
- Claverie, M.; Vermote, E.F.; Weiss, M.; Baret, F.; Hagolle, O.; Demarez, V. Validation of coarse spatial resolution LAI and FAPAR time series over cropland in southwest France. Remote Sens. Environ. 2013, 139, 216–230. [Google Scholar] [CrossRef]
- Barr, A.G.; Black, T.A.; Hogg, E.H.; Kljun, N.; Morgenstern, K.; Nesic, Z. Inter-annual variability in the leaf area index of a boreal aspen-hazelnut forest in relation to net ecosystem production. Agric. For. Meteorol. 2004, 126, 237–255. [Google Scholar] [CrossRef]


| Product | Statistical Indicator | Overall | MAM | JJA | SON | DJF |
|---|---|---|---|---|---|---|
| LAI | Mean | −0.008 | −0.007 | −0.014 | −0.003 | −0.006 |
| Std. | 0.313 | 0.300 | 0.284 | 0.327 | 0.348 | |
| FPAR | Mean | −0.003 | −0.004 | −0.004 | −0.001 | −0.002 |
| Std. | 0.036 | 0.035 | 0.033 | 0.038 | 0.039 |
© 2018 by the authors. Licensee MDPI, Basel, Switzerland. This article is an open access article distributed under the terms and conditions of the Creative Commons Attribution (CC BY) license (http://creativecommons.org/licenses/by/4.0/).
Share and Cite
Xu, B.; Park, T.; Yan, K.; Chen, C.; Zeng, Y.; Song, W.; Yin, G.; Li, J.; Liu, Q.; Knyazikhin, Y.; et al. Analysis of Global LAI/FPAR Products from VIIRS and MODIS Sensors for Spatio-Temporal Consistency and Uncertainty from 2012–2016. Forests 2018, 9, 73. https://doi.org/10.3390/f9020073
Xu B, Park T, Yan K, Chen C, Zeng Y, Song W, Yin G, Li J, Liu Q, Knyazikhin Y, et al. Analysis of Global LAI/FPAR Products from VIIRS and MODIS Sensors for Spatio-Temporal Consistency and Uncertainty from 2012–2016. Forests. 2018; 9(2):73. https://doi.org/10.3390/f9020073
Chicago/Turabian StyleXu, Baodong, Taejin Park, Kai Yan, Chi Chen, Yelu Zeng, Wanjuan Song, Gaofei Yin, Jing Li, Qinhuo Liu, Yuri Knyazikhin, and et al. 2018. "Analysis of Global LAI/FPAR Products from VIIRS and MODIS Sensors for Spatio-Temporal Consistency and Uncertainty from 2012–2016" Forests 9, no. 2: 73. https://doi.org/10.3390/f9020073
APA StyleXu, B., Park, T., Yan, K., Chen, C., Zeng, Y., Song, W., Yin, G., Li, J., Liu, Q., Knyazikhin, Y., & Myneni, R. B. (2018). Analysis of Global LAI/FPAR Products from VIIRS and MODIS Sensors for Spatio-Temporal Consistency and Uncertainty from 2012–2016. Forests, 9(2), 73. https://doi.org/10.3390/f9020073