Article

Carbon Mass Change and Its Drivers in a Boreal Coniferous Forest in the Qilian Mountains, China from 1964 to 2013

1
Linze Inland River Basin Research Station, Chinese Ecosystem Research Network, Key Laboratory of Eco-hydrology of Inland River Basin, Northwest Institute of Eco-Environment and Resources, Chinese Academy of Sciences, Lanzhou 730000, China
2
University of Chinese Academy of Sciences, Beijing 100049, China
*
Author to whom correspondence should be addressed.
Forests 2018, 9(2), 57; https://doi.org/10.3390/f9020057
Submission received: 16 November 2017 / Revised: 22 January 2018 / Accepted: 22 January 2018 / Published: 25 January 2018
(This article belongs to the Special Issue Carbon and Nitrogen in Forest Ecosystems—Series I)

Abstract

:
Carbon storage of mountain forests is vulnerable to climate change but the changes in carbon flux through time are poorly understood. Moreover, the relative contributions to carbon flux of drivers such as climate and atmospheric CO2 still have significant uncertainties. We used the dynamic model LPJ-GUESS with climate data from twelve meteorological stations in the Qilian Mountains, China to simulate changes in carbon mass of a montane boreal forest, and the influence of temperature, precipitation, and CO2 concentration from 1964 to 2013 on carbon flux. The results showed that the carbon mass has increased 1.202 kg/m2 from 1964 to 2013, and net primary productivity (NPP) ranged from 0.997 to 1.122 kg/m2/year. We concluded that the highest carbon mass proportion for this montane boreal forest was at altitudes 2700–3100 m (proportion of ecosystem carbon was between 93–97%), with maximum carbon density observed at 2700–2900 m. In the last 50 years, the increase in precipitation and in CO2 concentration is expected to increase carbon mass and NPP of Picea crassifolia Kom. (Pinaceae) (Qinghai spruce). The effect of temperature on NPP was positive but that on carbon mass was not clear. The increase in CO2 concentration over the past 50 years was a major contributor to the increase in carbon storage, and drought was the foremost limiting factor in carbon storage capacity of this montane boreal forest. Picea crassifolia forest was vulnerable to climate change. Further studies need to focus on the impact of extreme weather, especially drought, on carbon storage in Picea crassifolia forests.

1. Introduction

Climate change influences the carbon and water cycles in mountain areas [1]. Forests in mountain areas provide important ecological and socio-economic services; however, carbon storage is vulnerable to the effects of climate change and may decrease its ecological service function over time [2,3]. Research on the response of mountain ecosystems, especially of alpine forests and tree species, to climate change, is lacking [1,2]. Additionally, the impacts of climate change on montane forests are examined distinctively with dendroclimatic techniques [2,3,4]. High mountain boreal forests, which have numerous organic pools stored aboveground and in the permafrost, play an important role in regional carbon budgets and are exposed to rapid climate change; however, research on carbon pools at high elevations and controls on carbon flux through time lag behind [5,6] due primarily to insufficient data [7]. Ecosystem models are useful tools for describing and quantifying water, matter, and momentum fluxes between the biosphere and the atmosphere [8]. Using biomass models to obtain mass data can facilitate simulation of forest carbon dynamics in areas where such data are lacking, while analyses of the montane boreal forest biome will improve the accuracy of global carbon models [3].
Climate change is primarily related to changes since the 1950s in solar radiation, temperature, and precipitation that have not been observed before [9]. Climate change and related disturbances may substantially impact the species ranges, population sizes, and extinction risks in mountain forests, and even shift the carbon sink activity of a forest to a net carbon source [10,11,12]. In a simulation of a species distribution in Mediterranean mountains, the cold-adapted species decreased in significance, and the species range and communities changed under global warming [13]. Extreme climates may change plant intrinsic characteristics and increase the possibility of mountain ecosystem shifts from forest to shrubland or grassland [14]. These climate change-induced species conversions will result in a long-term loss of carbon stock in mountain forest ecosystems [15]. One stark example of this was observed with mountain pine beetle in western North America; this insect outbreak, caused by climate change, compromised the ability of forests to take up and store carbon [12].
The response of mountain forests to climate change depends heavily on relative changes in temperature, precipitation, CO2, and their interaction effect [10]; the relative contributions of individual historical drivers can be assessed by high-resolution climate data and modeling [16,17]. Sensitivity analyses of climate factors focused on tropical and temperate areas. However, analyses of the driving factors of carbon storage changes in recent years at high latitudes and in high elevation areas are still lacking [18]. The sensitivity to climate change of carbon storage in mountain forests is based on initial climatic variability; thus, increased mean annual temperature at high elevations results in sensitivity of tree growth and changes in forest productivity [3]. Examined by three ecological models (LPJ-GUESS, ForClim, LandClim), carbon storage across all elevations revealed a lower sensitivity than other ecosystem services to a 2 °C warming [19]. However, under the influence of global warming, mountain forests at high altitudes exhibited positive growth, whereas drought stress led to a negative effect on carbon mass at lower altitudes [4]. The impacts of climate change on mountain forests were also closely related to the frequency and intensity of extreme weather, especially precipitation-related events [5]. Extreme warming events may influence mountain boreal plant activity, plant litter production, soil moisture, and insect life cycles, while extreme weather events such as precipitation extremes and severe storms may lead to damage and may influence the recovery capacity of mountain boreal forest ecosystems [6]. Uncertainties exist as to the main climatic controls on carbon changes in long-term simulations of carbon mass in mountain forests [9,10]. Investigating carbon flux sensitivity to climate change will reduce the uncertainty of the past factors of climate change and help guide forest management. For a better understanding of the effects of climate change on boreal forests, it is necessary to quantify the driving parameters of carbon changes in boreal forests during the last 50 years.
The Qilian Mountains, located in the northwestern part of China at the north-eastern edge of the Tibetan Plateau, are typical arid mountains, and the source of key inland rivers; these mountains are sensitive to climate change [20]. The average temperature rise is 80% higher than the national rate (0.14 °C/10a), and extreme climate and precipitation events occurred more frequently here in the past 50 years than in other parts of China [21]. Under climate change, environmental degradation, soil erosion, and loss of biodiversity have increased, and vegetation cover and growth in the Qilian Mountains have changed significantly in recent years [22]. Montane Boreal forest is the dominant forest type, and it plays important roles in the hydrology and biogeochemistry of the area due to high altitudes (2000–5500 m) and minimal human-induced ecological deterioration [23]. Between 1957 and 2007, temperature increased by 0.29 °C/10a and precipitation by 5.5 mm/10a, resulting in a shift of the tree line of the montane boreal forest in this area to higher elevations [24]. Simple regression models of phenological dynamics in this montane boreal forest revealed that the length of the growing season can be expected to increase during the next two decades [25]. This prompted new research efforts to determine the relationships between montane boreal forest carbon dynamics and climate change. Ecosystem stability of the montane boreal forest in the Qilian Mountains supports downstream economy and production because the forest serves as the most important water conservation entity in the area. Better understanding of the role of climate and atmospheric CO2 in determining carbon flux in this montane boreal forest, and the relationship between the NPP and biomass is critical for guiding ecology policy to optimize carbon storage.
To address this knowledge need, we used climate and CO2 concentration data to reconstruct carbon storage in living biomass for the montane boreal forest in the Qilian Mountains, China from 1964–2013. With this, we examined the carbon stock in this forest type at different elevations and its carbon flows during the last 50 years. Subsequently, we used the LPJ-GUESS model to explore the sensitivity of forest carbon stocks in this region to temperature, precipitation, CO2, and extreme conditions to determine the main past factor controlling the change in carbon flux in the last 50 years.

2. Materials and Models

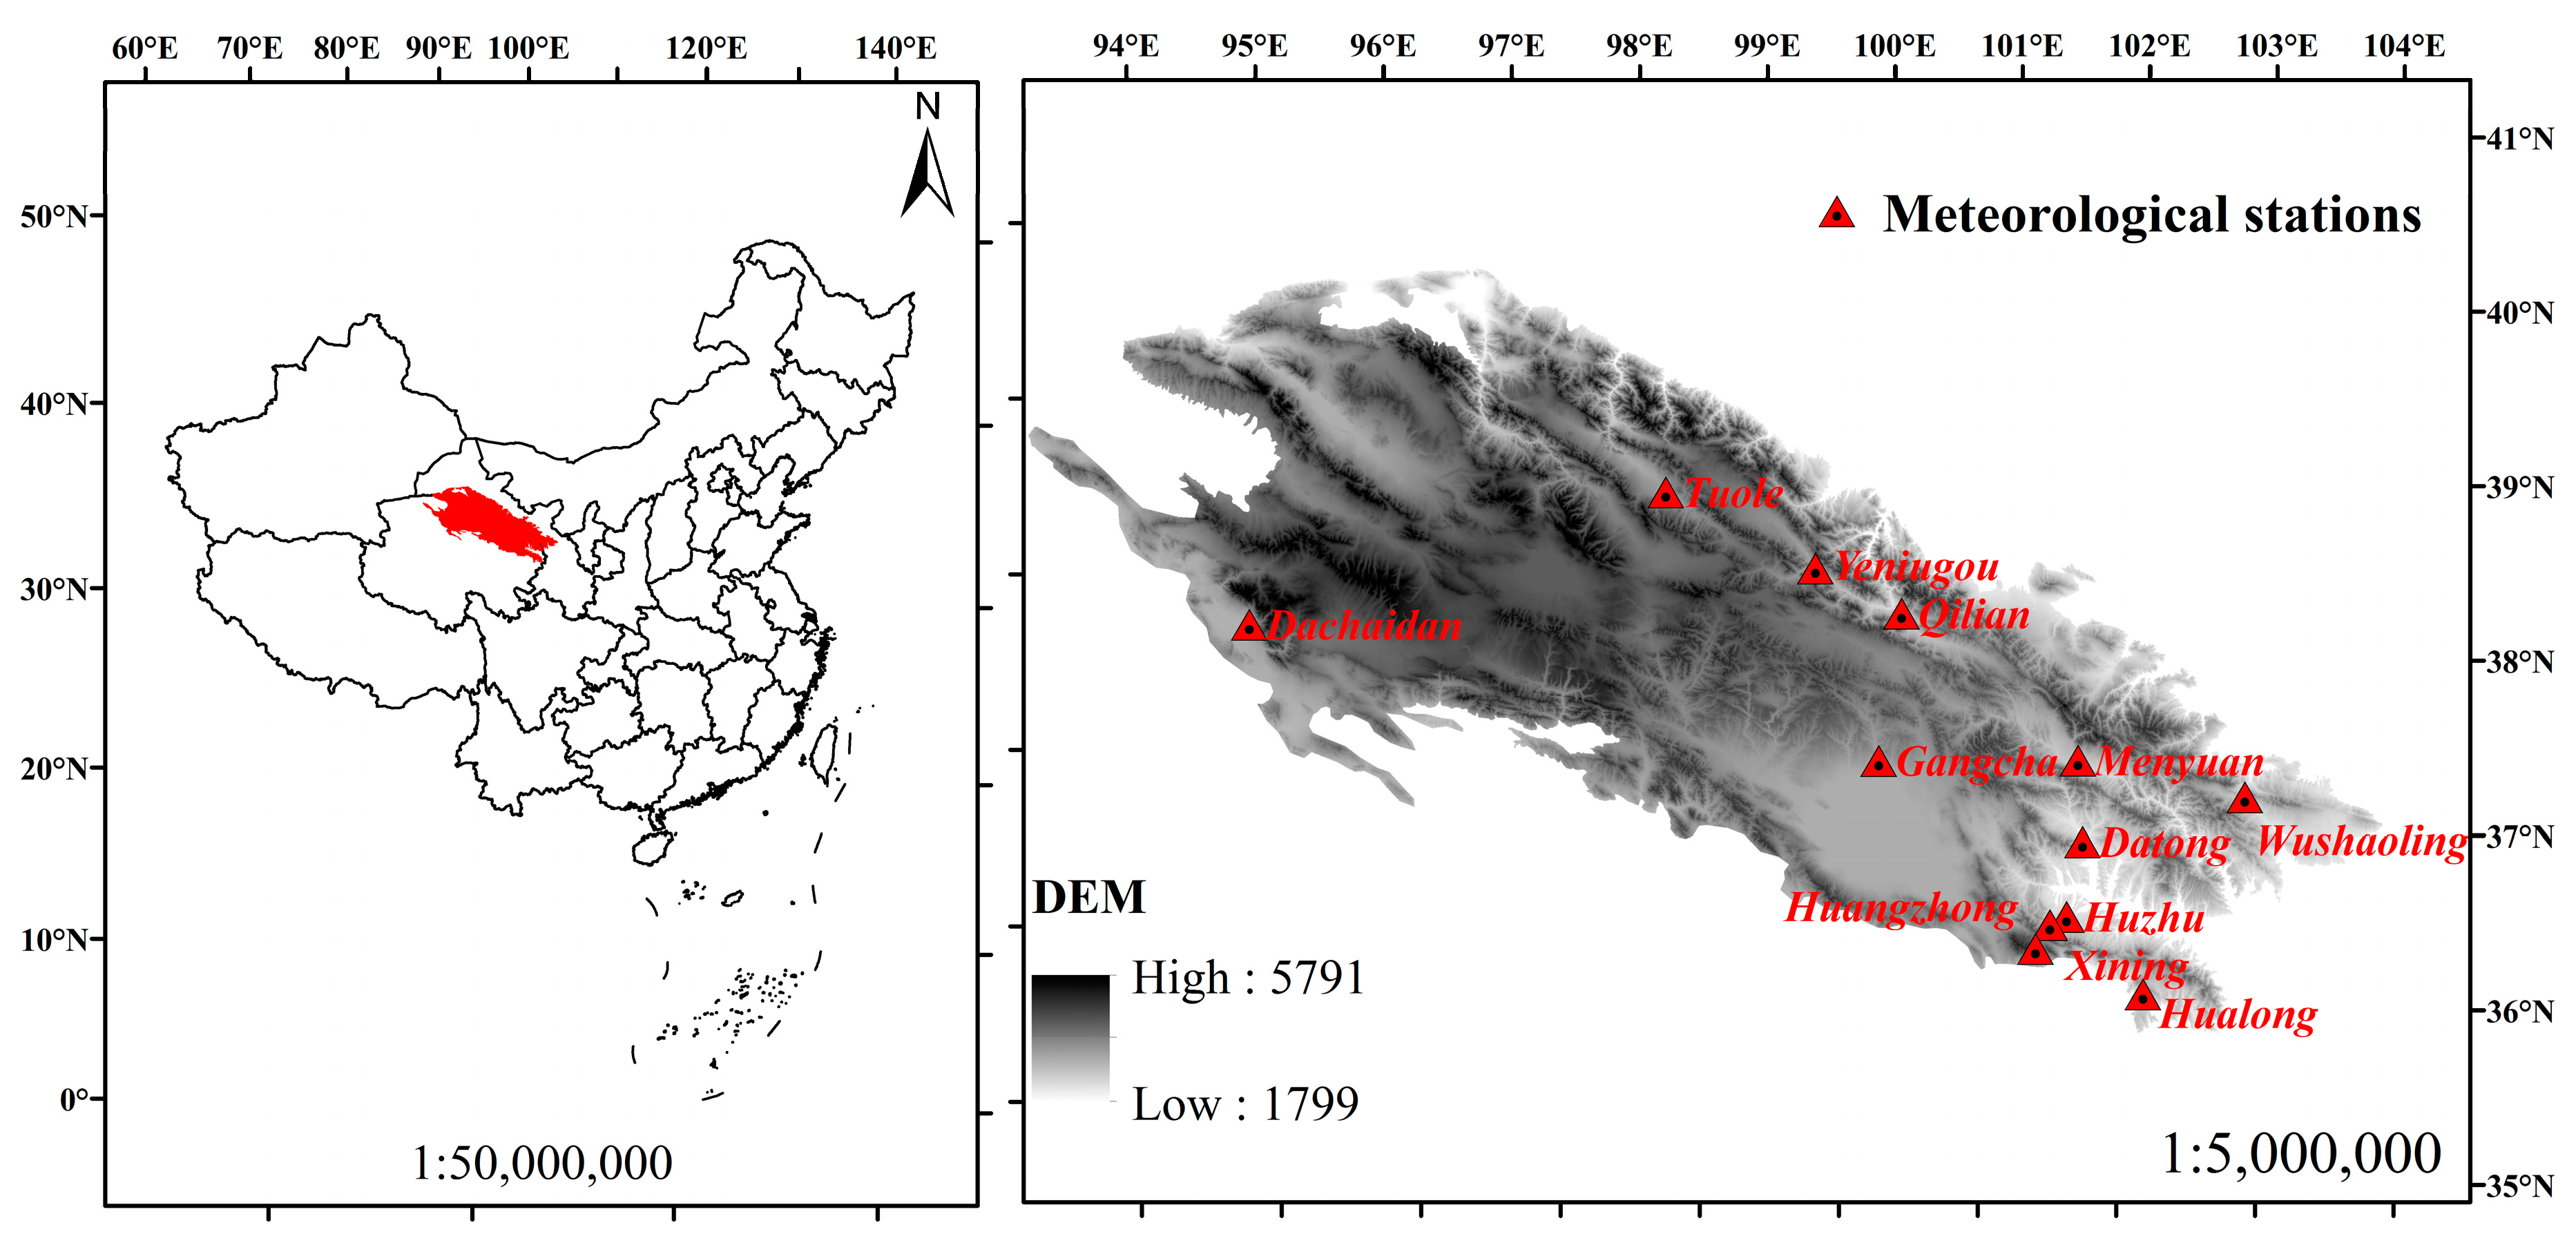
2.1. Area Description and Data Collection

The Qilian Mountains are one of the major arid mountain ranges in northwestern China, located in the northeastern Tibetan Plateau, between 93°33′36″–103°54′00″ E and 35°50′24″–40°01′12″ N. The distribution of vegetation is strongly controlled by altitude and can be separated into five types (from low to high altitude): desert steppe, forest steppe, sub-alpine shrubby meadow, alpine cold desert, and ice/snow zone. In the forest steppe, the montane boreal forest is located at high altitudes where the level of human impact is low [26]. The dominant boreal species, Picea crassifolia, grows on shady and partly-shady north slopes at altitudes ranging from 2600 to 3400 m, and accounts for as much as 76% of the total forested area in the forest steppe zone [27]. In total, twelve sampling sites were selected across an elevation gradient from 2300–3500 m at intervals of 200 m to analyze the carbon change of montane boreal forest by altitude.
We selected twelve meteorological stations located within the tree-growing areas to extract the climate parameters (Figure 1). In an earlier study of the spatial distribution of Picea crassifolia biomass and carbon storage in the Qilian Mountains, the average carbon content was calculated as 0.52 [28]; this was similar to the results based on a synthesis of carbon contents for temperate and boreal conifer wood (n = 36) of 50.8 ± 0.6% [29]. In this study, we used a carbon content of 0.52 for Picea crassifolia.
The climate data, including mean monthly temperature, monthly precipitation, mean monthly daily proportion of sunshine hours, and monthly rainy days, were obtained from the climate data repository of Chinese meteorological stations (http://data.cma.cn/site/index.html), and of Qinghai Province (Table 1). Atmospheric CO2 concentrations for 1964–2013 were derived from the atmospheric carbon dioxide mixing ratios from NOAA (National Oceanic and Atmospheric Administration) ESRL (Earth System Research Laboratory) Carbon Cycle Cooperative Global Air Sampling Network (http://www.esrl.noaa.gov/gmd/ccgg/mbl/data.php).

2.2. The LPJ-GUESS Model

LPJ-GUESS is a validated vegetation carbon dynamics model [30]. The basic use of the model is to simulate carbon balance of different tree species and to predict changes in carbon pools and fluxes under global climate change [31,32]. A LPJ-GUESS simulation of the spatial and temporal patterns of carbon fluxes associated with regrowth after agricultural abandonment indicated that semi-arid regions, where carbon balance was strongly associated with both precipitation and temperature, were key to the understanding and predicting of the global carbon cycle [33]. Further, changes in the spatial patterns of wildfires, estimated by LPJ-GUESS, were critical to the proposal for a more reasonable climate policy [34]. The model can simulate and predict the responses of plant water fluxes to elevated CO2 at leaf and stand scales [35]. In addition to natural vegetation, agricultural crop production and crop responses to climate change were analyzed in an effort to increase food security [36]. In China, the model has been applied in subtropical, temperate, and mountain zones [37,38,39], and to the entire country [40]. Carbon simulation by LPJ-GUESS using an individual climate factor demonstrated carbon release by management, and CO2 as the most important driver for carbon change in Lady Park Wood in the last 20 years [16].
Plant functional types (PFTs), which can simplify species diversity of vegetation, represent groups of species with similar functional traits. Among forest carbon dynamics simulation models, both, the individual-based model GUESS (General Ecosystem Simulator) [30], and the area-based dynamic global vegetation model LPJ (Lund-Potsdam-Jena) [41], can be successful in predicting the carbon flux of PFTs. Subsequently, a new vegetation dynamics model, LPJ-GUESS, was developed by combining the two other models [30].
Two model frameworks exist, the cohort and population. We employed the “cohort mode” in this study. In the “cohort mode”, individual trees are distinguished, but are identical within each cohort (age class) [30]. Population processes and disturbances are modeled stochastically, and stand characteristics are averaged over 100 patches of 0.1 ha, representing “random samples” of the simulated stand. The model is driven by short-wave radiation (photosynthetically active light), temperature, precipitation, CO2 concentration of the air, and soil conditions. The CO2 influences assimilation rate, and soil conditions modify plant water uptake; soil data are already provided in the model. Species information includes the physiological characteristics of PFTs, such as prescribed allometric relationships. Based on physiology, morphology, phenology, and on the response to disturbance and to bio-climatic limiting factors, the model defines ten PFTs, of which 8 are woody, and two are herbaceous [42]. We used the full set of PFTs and added a new PFT for Picea crassifolia to reproduce the current stage of the vegetation.

2.3. Model Forcing and Simulation Protocol

The simulation normally follows two or three phases and begins with “bare ground”, which means that the modelled area is bare, with no vegetation present. The first phase of the simulation is known as the “spin-up”; in this phase, input data are normally based on the first few years of available (historical) data. During the subsequent, “historical” phase, the model uses “observed” climate and CO2 data as input. We chose two phases, “spin-up” and “historical” to run the model for the last fifty years. Climate data for an initial 300-year “spin-up” phase were not available; such “spin-up” equilibrates the initial vegetation and carbon pools with climate at the beginning of the study period. The model was first “spun-up” for 300 years, recycling the observed time series from 1964–1993 [30,43]. The “historical” period then ran from 1964 to 2013; the simulation time interval for the LPJ-GUESS model is five years.
In a study to investigate the ability of LPJ-GUESS to reproduce features of real vegetation, the model was demonstrated to not require site-specific calibration and could be used to simulate vegetation dynamics on a regional basis or under past or future climates and atmospheric CO2 levels for reparameterization becauase plant growth is modeled mechanistically [31]. Many of the parameters of species are decided by its PFTs, such as whether it is needle-leaved or broad-leaved; or whether it is boreal or temperate species. The species-specific parameters such as tree longevity are defined in the article. We referred to the relevant parameters for the boreal forest to define the parameters of Picea crassifolia [31,44]. We specified the mean length of the life of foliage at 11.8 years, as determined in a field investigation [45], and tree longevity at 250 years, as described in the literature [46]. Data used for biomass calculations for the Qilian Mountains were obtained from the literature [28,47,48,49] and were used to verify the accuracy of those that were calculated.

2.4. Sensitivity Analysis of Temperature, CO2, and Extreme Whether

Sensitivity analysis is an important aspect of evaluating the resilience of ecosystems to climate change and can be combined with models to measure the effect of changing input parameters under some climate scenarios and extreme weather conditions [50,51]. Based on the simulation of LPJ-GUESS, further research was conducted to determine the relative effect of climate variables and CO2 concentration on the carbon flux of montane boreal forests in Qilian Mountains for the period 1964–2013.
The temperature increased during the simulation period, but this trend could not be fit by a linear model. Further, the trend in precipitation was not clear. Thus, we first examined the climate effect by simulating the temperature, precipitation, and CO2 independently of each other. Using these climate simulations as a baseline, the uncertainties of these parameters were then compared. The influence of the temperature was observed for an increase or decrease of 1 and 2 °C; precipitation was changed multiplicatively, because it is a zero-based variable, by increasing or decreasing by 10% and 20%. The influence of CO2 was examined by removing its trend and increasing the value by 50 ppm and 100 ppm.
Because the climate variables are strongly related to each other, a comparison of the effects of climate change on carbon flux based on changing a single parameter in the data was incomplete [6,16]. Hence, to preserve the relationship of temperature, precipitation, and radiation, we represented extreme weather as follows to determine the impact of climate factors on carbon mass. Local weather in the study area was ranked in terms of temperature or precipitation levels (annual mean temperature from April to October, and annual mean precipitation from May to September), and the top five warmest, coldest, wettest, and driest years; these were then cycled through the model repeatedly to simulate an extreme climate.

3. Results

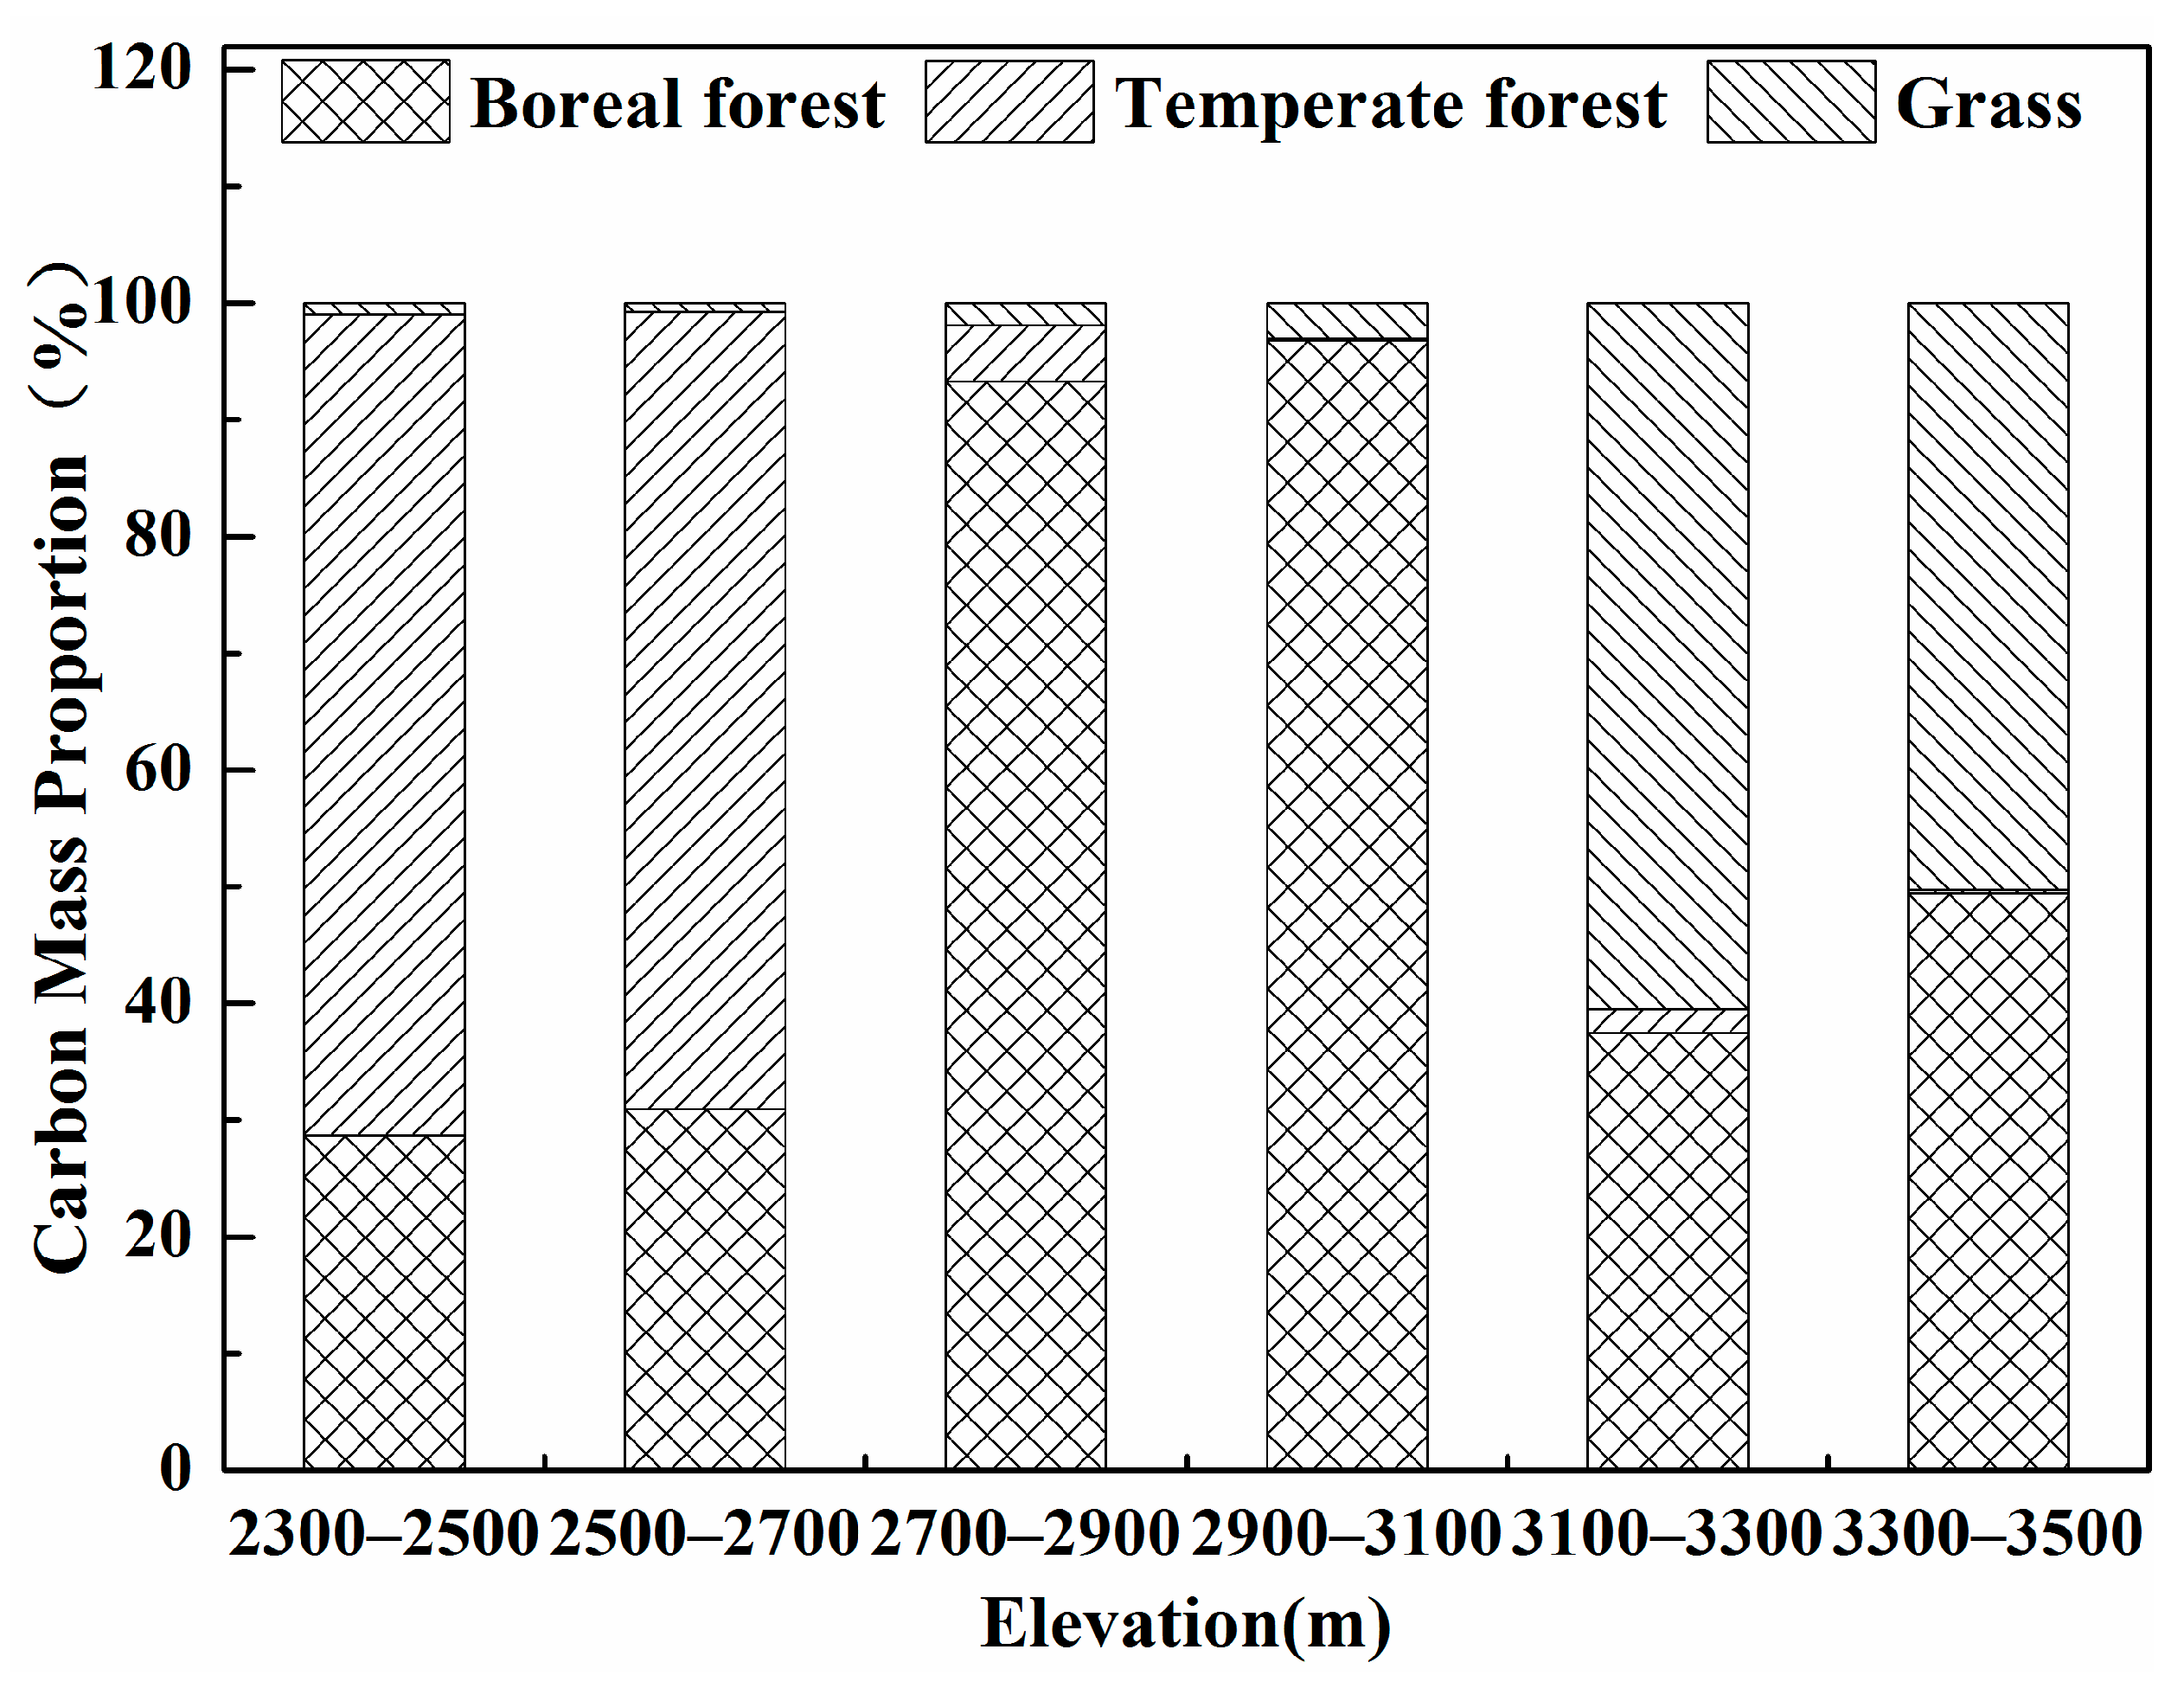
3.1. Changes in Carbon Mass with Altitude

The monthly mean temperature and precipitation in the simulated period followed normal distribution. Warm periods were concentrated in April to October, and high precipitation was concentrated in May to September; almost all of the stations exhibited the same trends. Mean annual temperature at the twelve stations increased by 0.29–3.69 °C between 1964 and 2013, with an average increase of 0.73 °C/10a. Differences in annual precipitation among altitudes were not apparent.
Carbon stocks of the montane boreal forest were concentrated at 2700–3100 m and exhibited a single peak of 11.787 kg/m2 at 2700–2900 m in 2013, with the average carbon mass at 2700–3100 m of 10.503 kg/m2. The calculation of the biomass of Picea crassifolia was different for the different measurement methods and research areas, but the results of our simulation were within the range of other studies (Table 2). The proportion of montane boreal forest was >28% at all altitudes. Specifically, montane boreal forest accounted for 30% at 2300 to 2700 m, increasing to 93% at 2700–2900 m and 97% at 2900–3100 m, declining to 37%, and again reaching 49% at 3300–3500 m (Figure 2). The carbon stored in the ecosystem at 2300–2700 m was 7.068–7.591 kg·C/m2, declining to about 0.242–0.645 kg·C/m2 at 3100–3500 m.
We investigated the NEE (Net ecosystem exchange) and carbon mass change in the mountain boreal forest ecosystem (at 2700–3100 m where the boreal forest accounted for the largest carbon mass) (Figure 3). In the model, a positive value of NEE indicated that the ecosystem was a carbon source, while a negative value indicated a carbon sink. Boreal forest was a carbon sink before the 1980s; sink strength at elevation 2700–2900 m declined, until the sink activity became a carbon source after 1980, and it became a relatively strong source in the 1990s. However, the strength of the carbon source weakened and the forest ecosystem at 2900–3100 m became a carbon sink again after the year 2000. We analysed the change in carbon mass during 1964–2013 and found the there was an upward trend for this montane boreal forest. The biomass of Picea crassifolia forest below 3100 m decreased in the study period, with the greatest decline of 2.595 kg/m2 at 2700–3100 m, and least of 0.125 kg/m2 at 2300–2500 m. The carbon mass increased by 0.035 kg/m2 at 3100–3300 m, and by 0.256 kg/m2 at 3300–3500 m. As the NEE indicated, the decreasing trend of carbon mass for montane boreal forest at 2700–2900 m stabilized in the 2000s and even exhibited a slight increase; carbon mass at 2900–3100 m was stable before the 1990s, and increased after that.

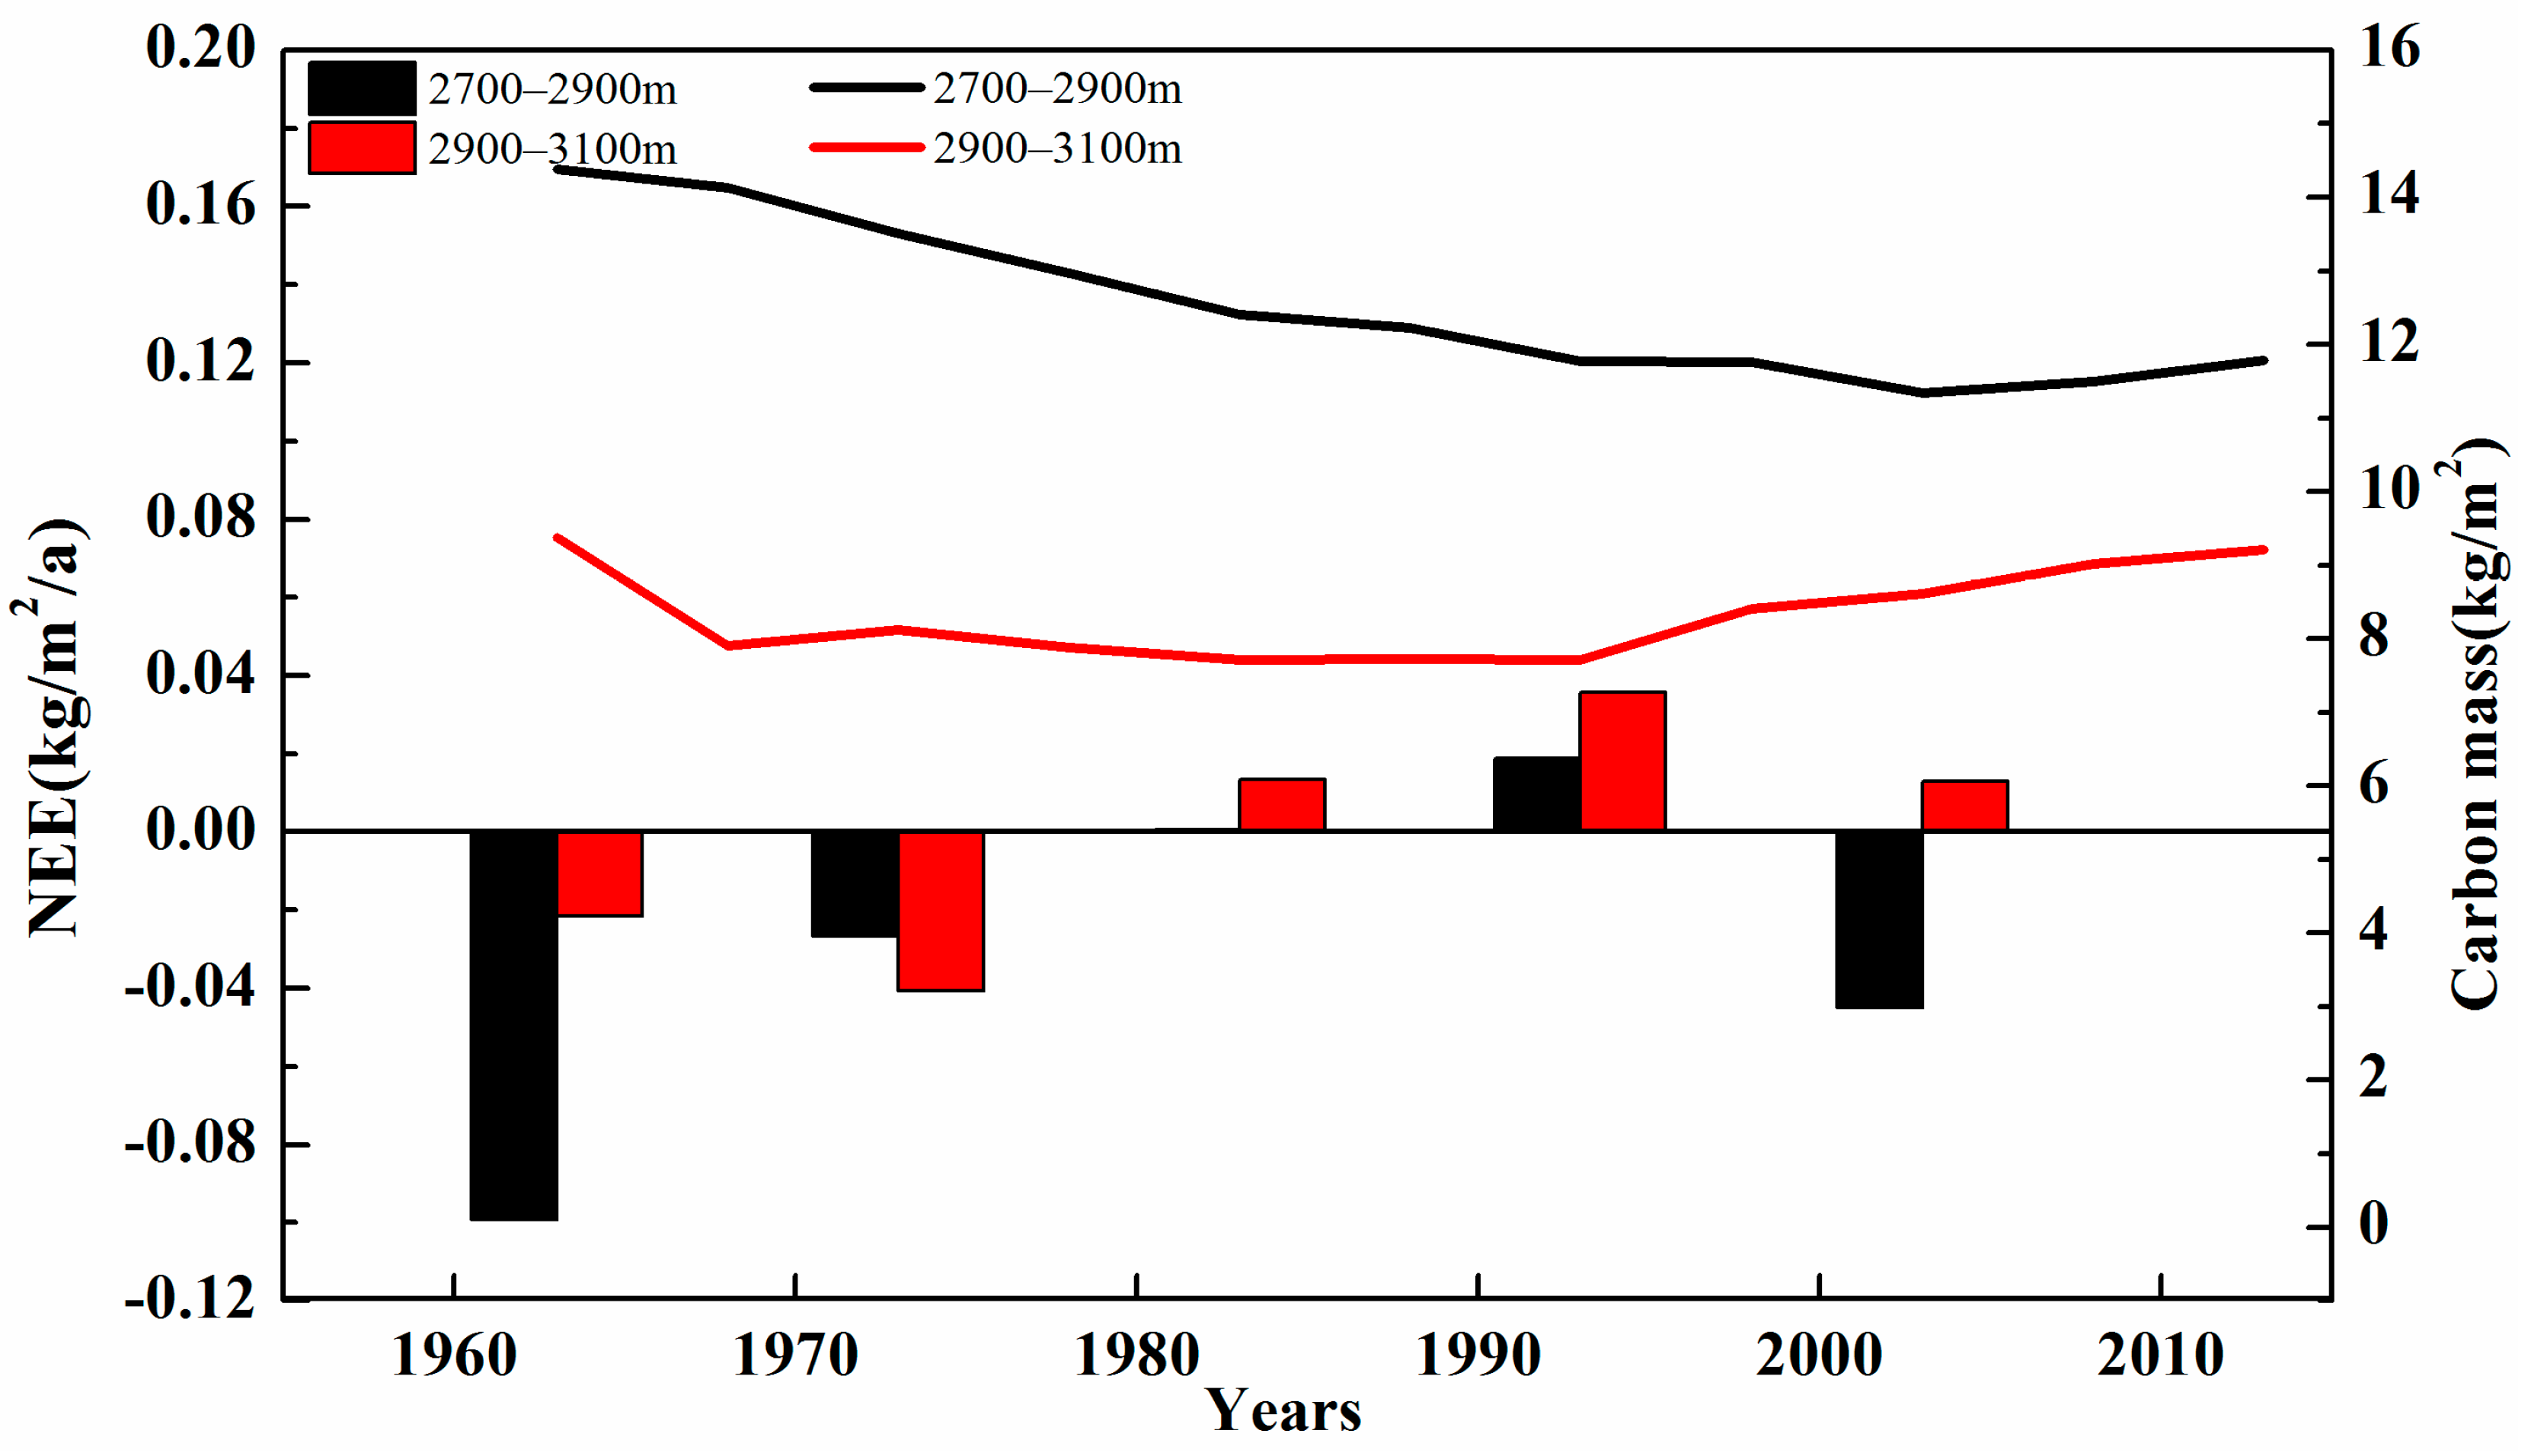
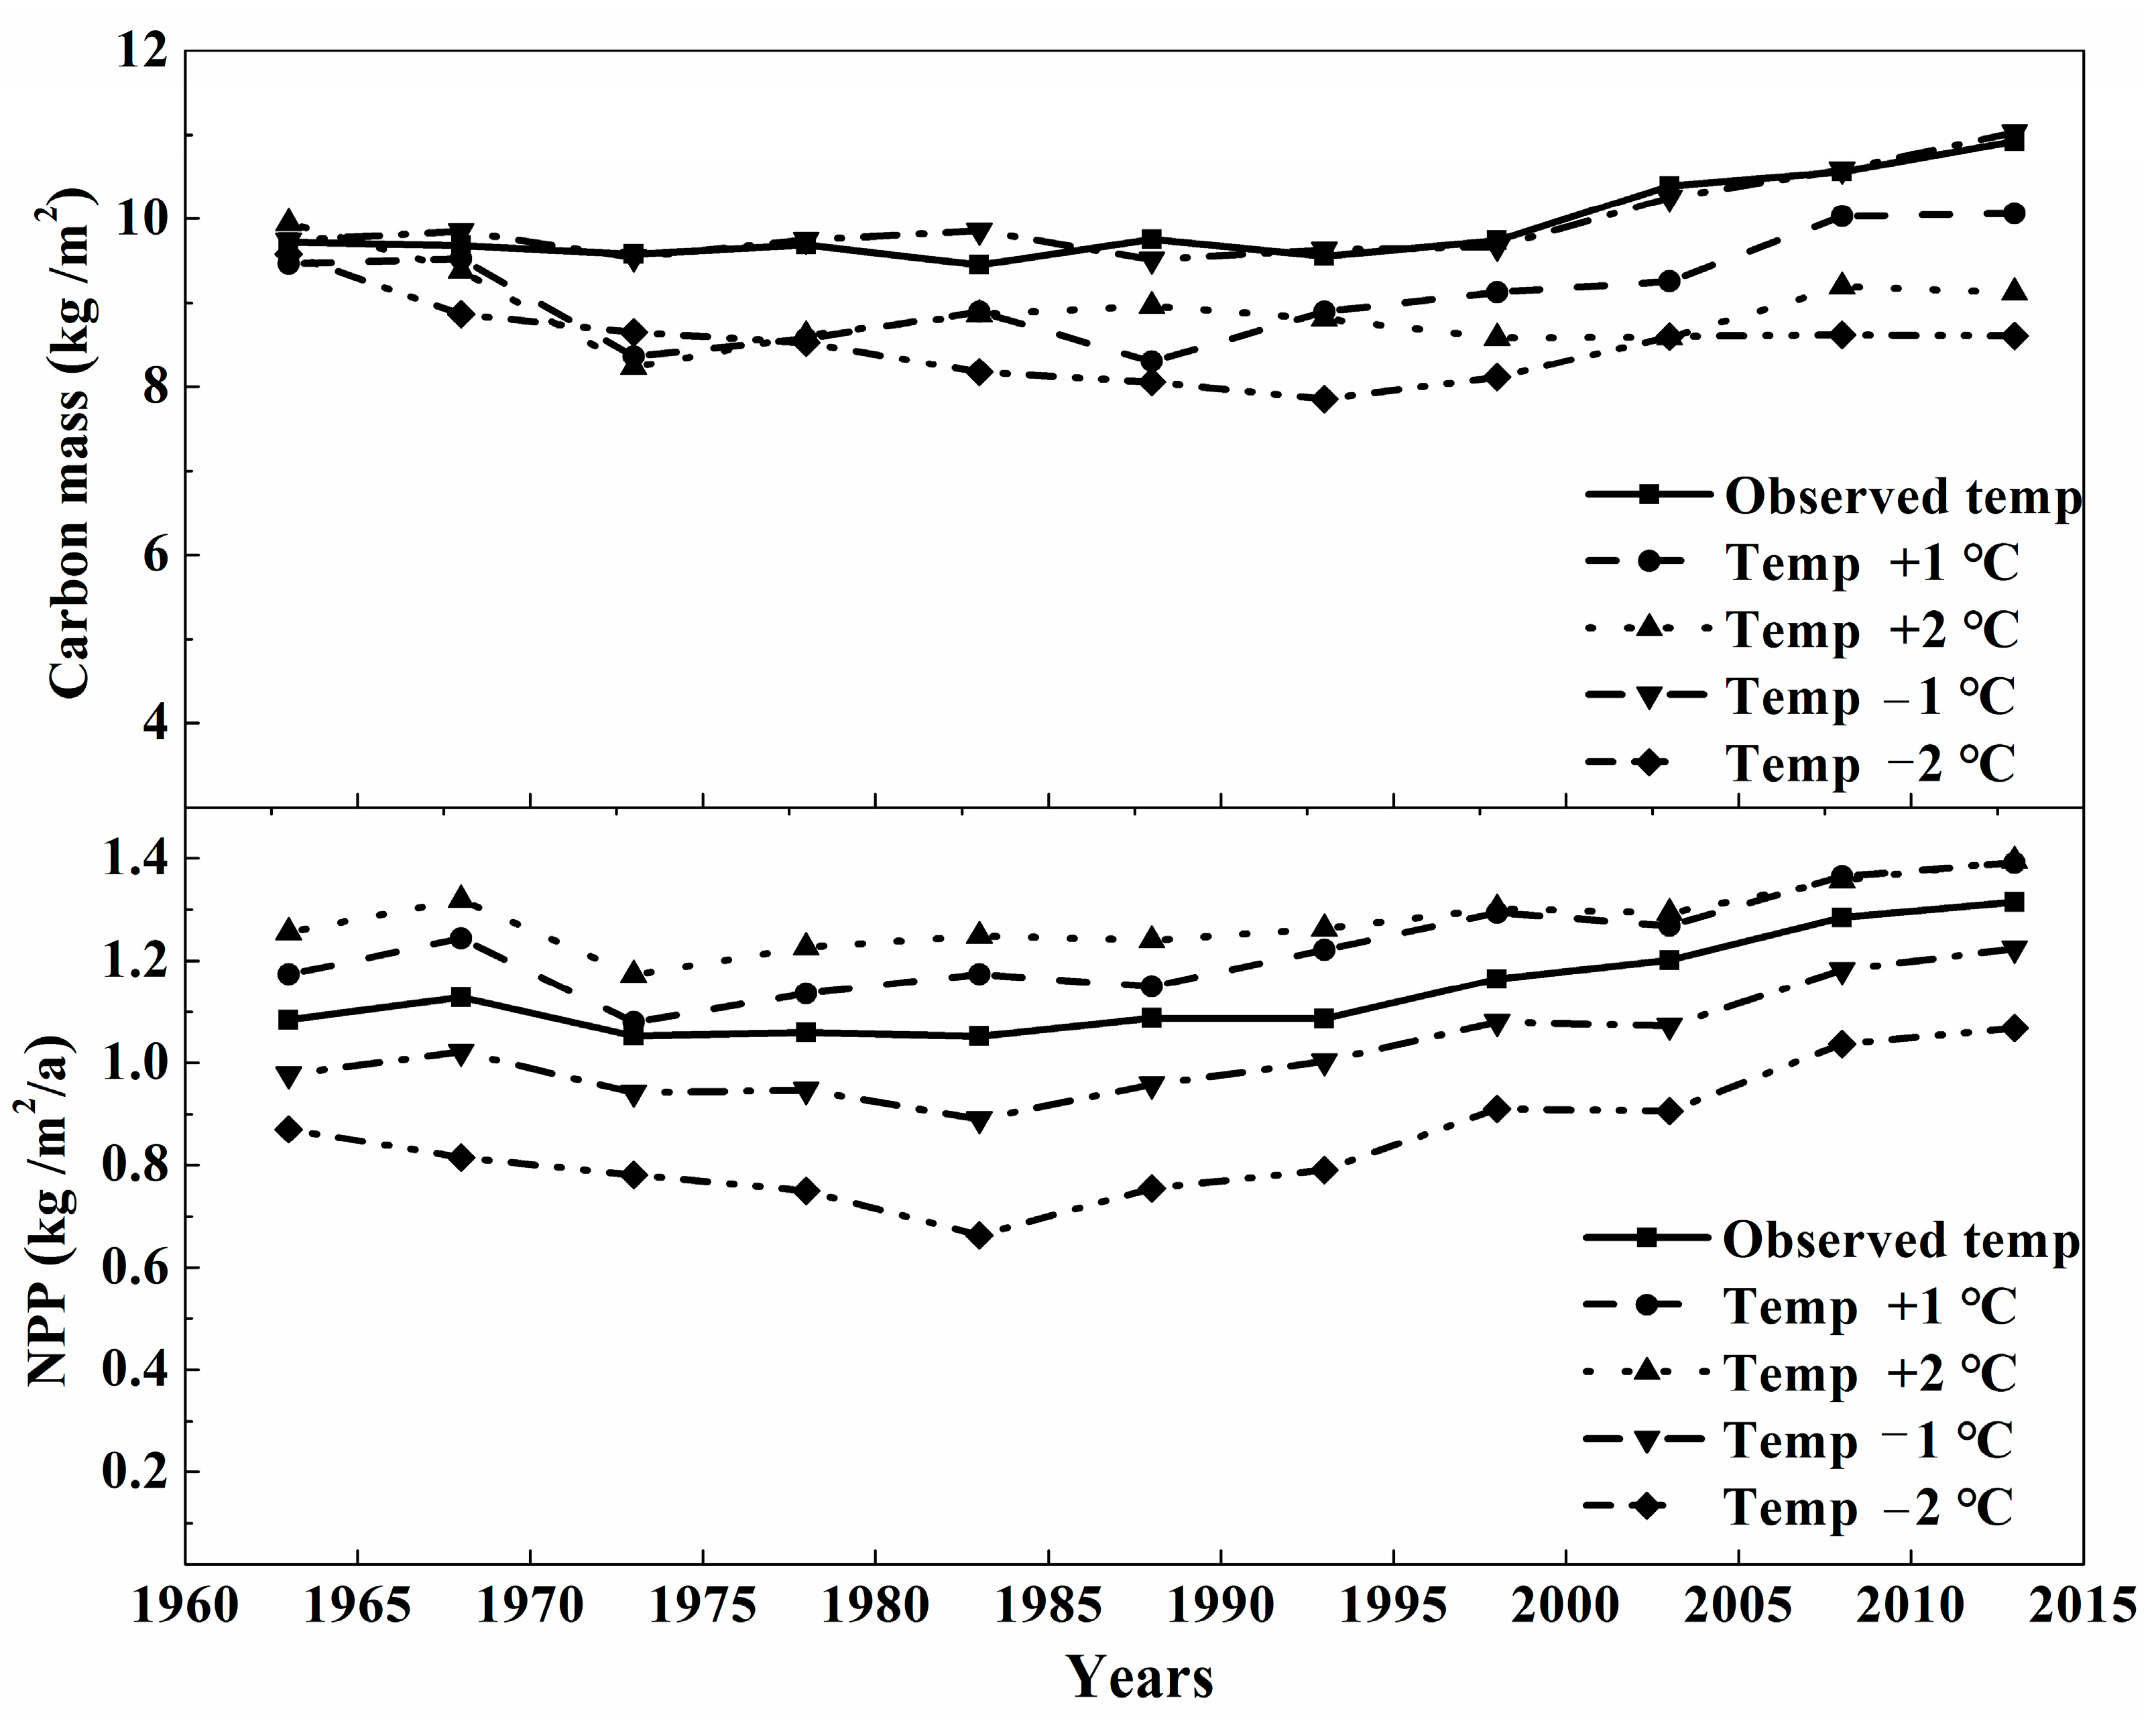
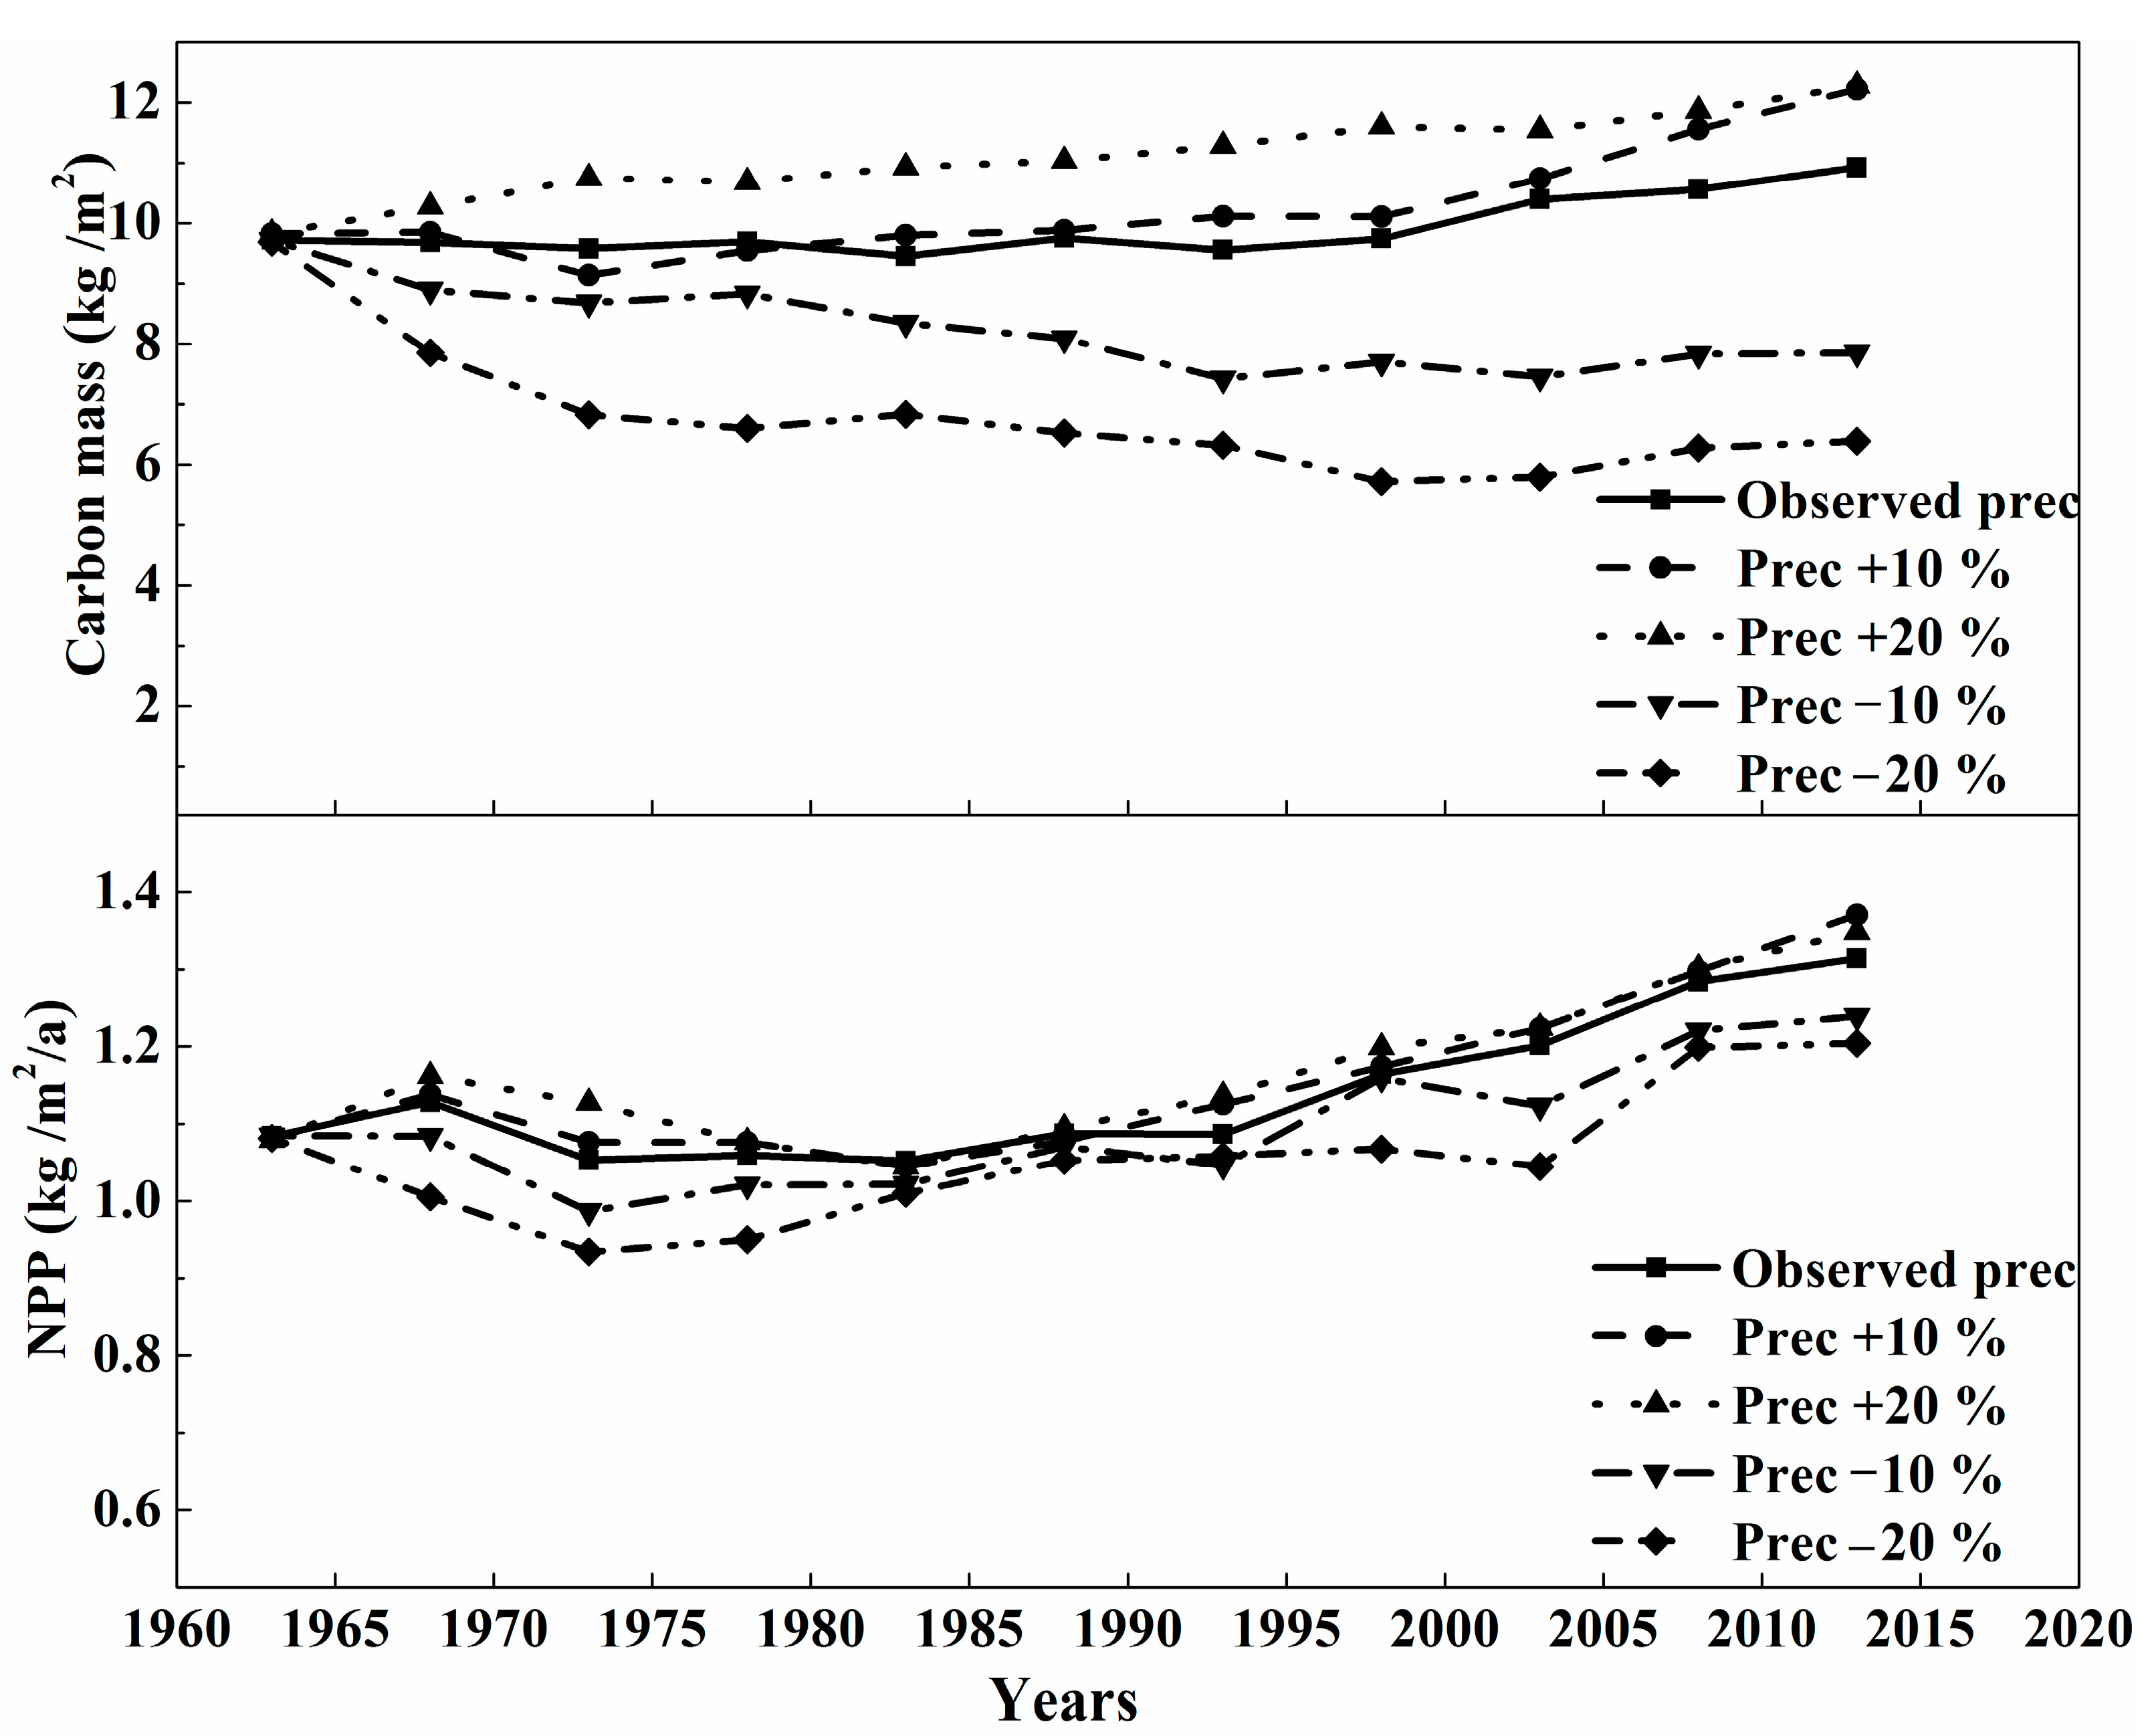
3.2. The Sensitivity Analysis of Carbon Mass of Montane Boreal Forest to Climate Variables and CO2

The simulation showed that the carbon carrying capacity of Picea crassifolia increased in the study period, given no changes to any variable. Mean carbon mass increased by 1.202 kg/m2 from 1964–2013, and the 5-year (simulation time interval for the LPJ-GUESS model) mean NPP increased by 0.023 kg/m2/year to between 0.997 and 1.122 kg/m2/year in the simulation period. Subsequently, each of the climatic variables was changed one at a time.
Following a change in temperature, the trend in NPP did not change, but the NPP value was higher than before (Figure 4). The effect of lower temperature on NPP was greater than that of higher temperature. When the temperature increased by 1 °C, 5-year mean NPP increased by 0.090 kg/m2/year; when the temperature increased by 2 °C, mean NPP increased by 0.148 kg/m2/year per five years. When the temperature decreased by 1 °C, mean NPP decreased 0.113 kg/m2/year per five years; when the temperature decreased by 2 °C, mean NPP decreased by 0.292 kg/m2/year per five years. However, the change in carbon stocks was not consistent with NPP when the temperature changed; increased or decreased temperature appeared to suppress carbon stocks of the montane boreal forest. Mean carbon stock decreased between 1964–2013 by 0.768 kg/m2 per five years; the increments decreased from 12.37% to 6.32% as the temperature increased by 1 °C. As the temperature increased by 2 °C, mean carbon stock decreased by 0.893 kg/m2 per five years, and carbon mass was reduced by 8.24%. With the temperature decrease of 1 °C, carbon stock increased by 0.026 kg/m2 per five years and the increments increased to 13.28%. With the temperature decrease of 2 °C, mean carbon stock decreased by 1.307 kg/m2 per five years, and carbon mass decreased by 10.11% during the last 50 years.
The trend in NPP changed over the course of simulation following changes in precipitation (Figure 5); the more precipitation, the higher the NPP, and the less precipitation, the lower the NPP. The impact of reduced precipitation was greater than that of increased precipitation. A 20% increase in precipitation resulted in a mean 5-year NPP increase of 0.024 kg/m2/year, while a 20% decrease reduced NPP by 0.080 kg/m2/year per five years.
The changes in carbon stock were consistent with NPP. Mean carbon stocks increased 0.242 kg/m2 per five years as precipitation increased by 10%, and 1.165 kg/m2 per five years as the precipitation increased by 20%. As precipitation decreased by 10 and 20%, mean carbon stocks decreased 1.517 and 2.969 kg/m2 per five years, respectively. The increase in carbon mass resulting from increased precipitation was 24.39%, and 24.93%, respectively, (basic value 12.37%), and carbon mass decreased 19.17%, and 34.01%, respectively, if precipitation decreased.
Mean NPP decreased when the CO2 concentration remained unchanged (de-trended) and increased when the CO2 concentration increased (Figure 6). Carbon mass decreased when the CO2 concentration remained unchanged, but it increased as the CO2 concentration levels rose. Overall, the CO2 concentration had an increasingly positive effect as atmospheric levels rose. Carbon mass decreased by 0.240 kg/m2 for the simulation years if CO2 concentrations did not increase after 1964. Mean carbon storage increased by 0.746 and 0.866 kg/m2 per five years for CO2 concentration increases of 50 and 100 ppm. De-trended CO2 supressed carbon mass by about 2.45%, and increased CO2 promoted carbon storage from 12.37% to 18.98%, and to 24.74% in response to 50 and 100 ppm, respectively.
Indeed, in the simulation period, the NPP and carbon mass of the montane boreal forest increased. Combined with the analysis of single-factor changes, carbon stocks decreased as temperature rose but increased as CO2 concentration increased. The actual temperature increased in the study area from 1964 to 2013, precipitation fluctuated, and CO2 concentration increased, and the positive effect of CO2 concentration contributed more to the carbon stocks than the negative effect of temperature.

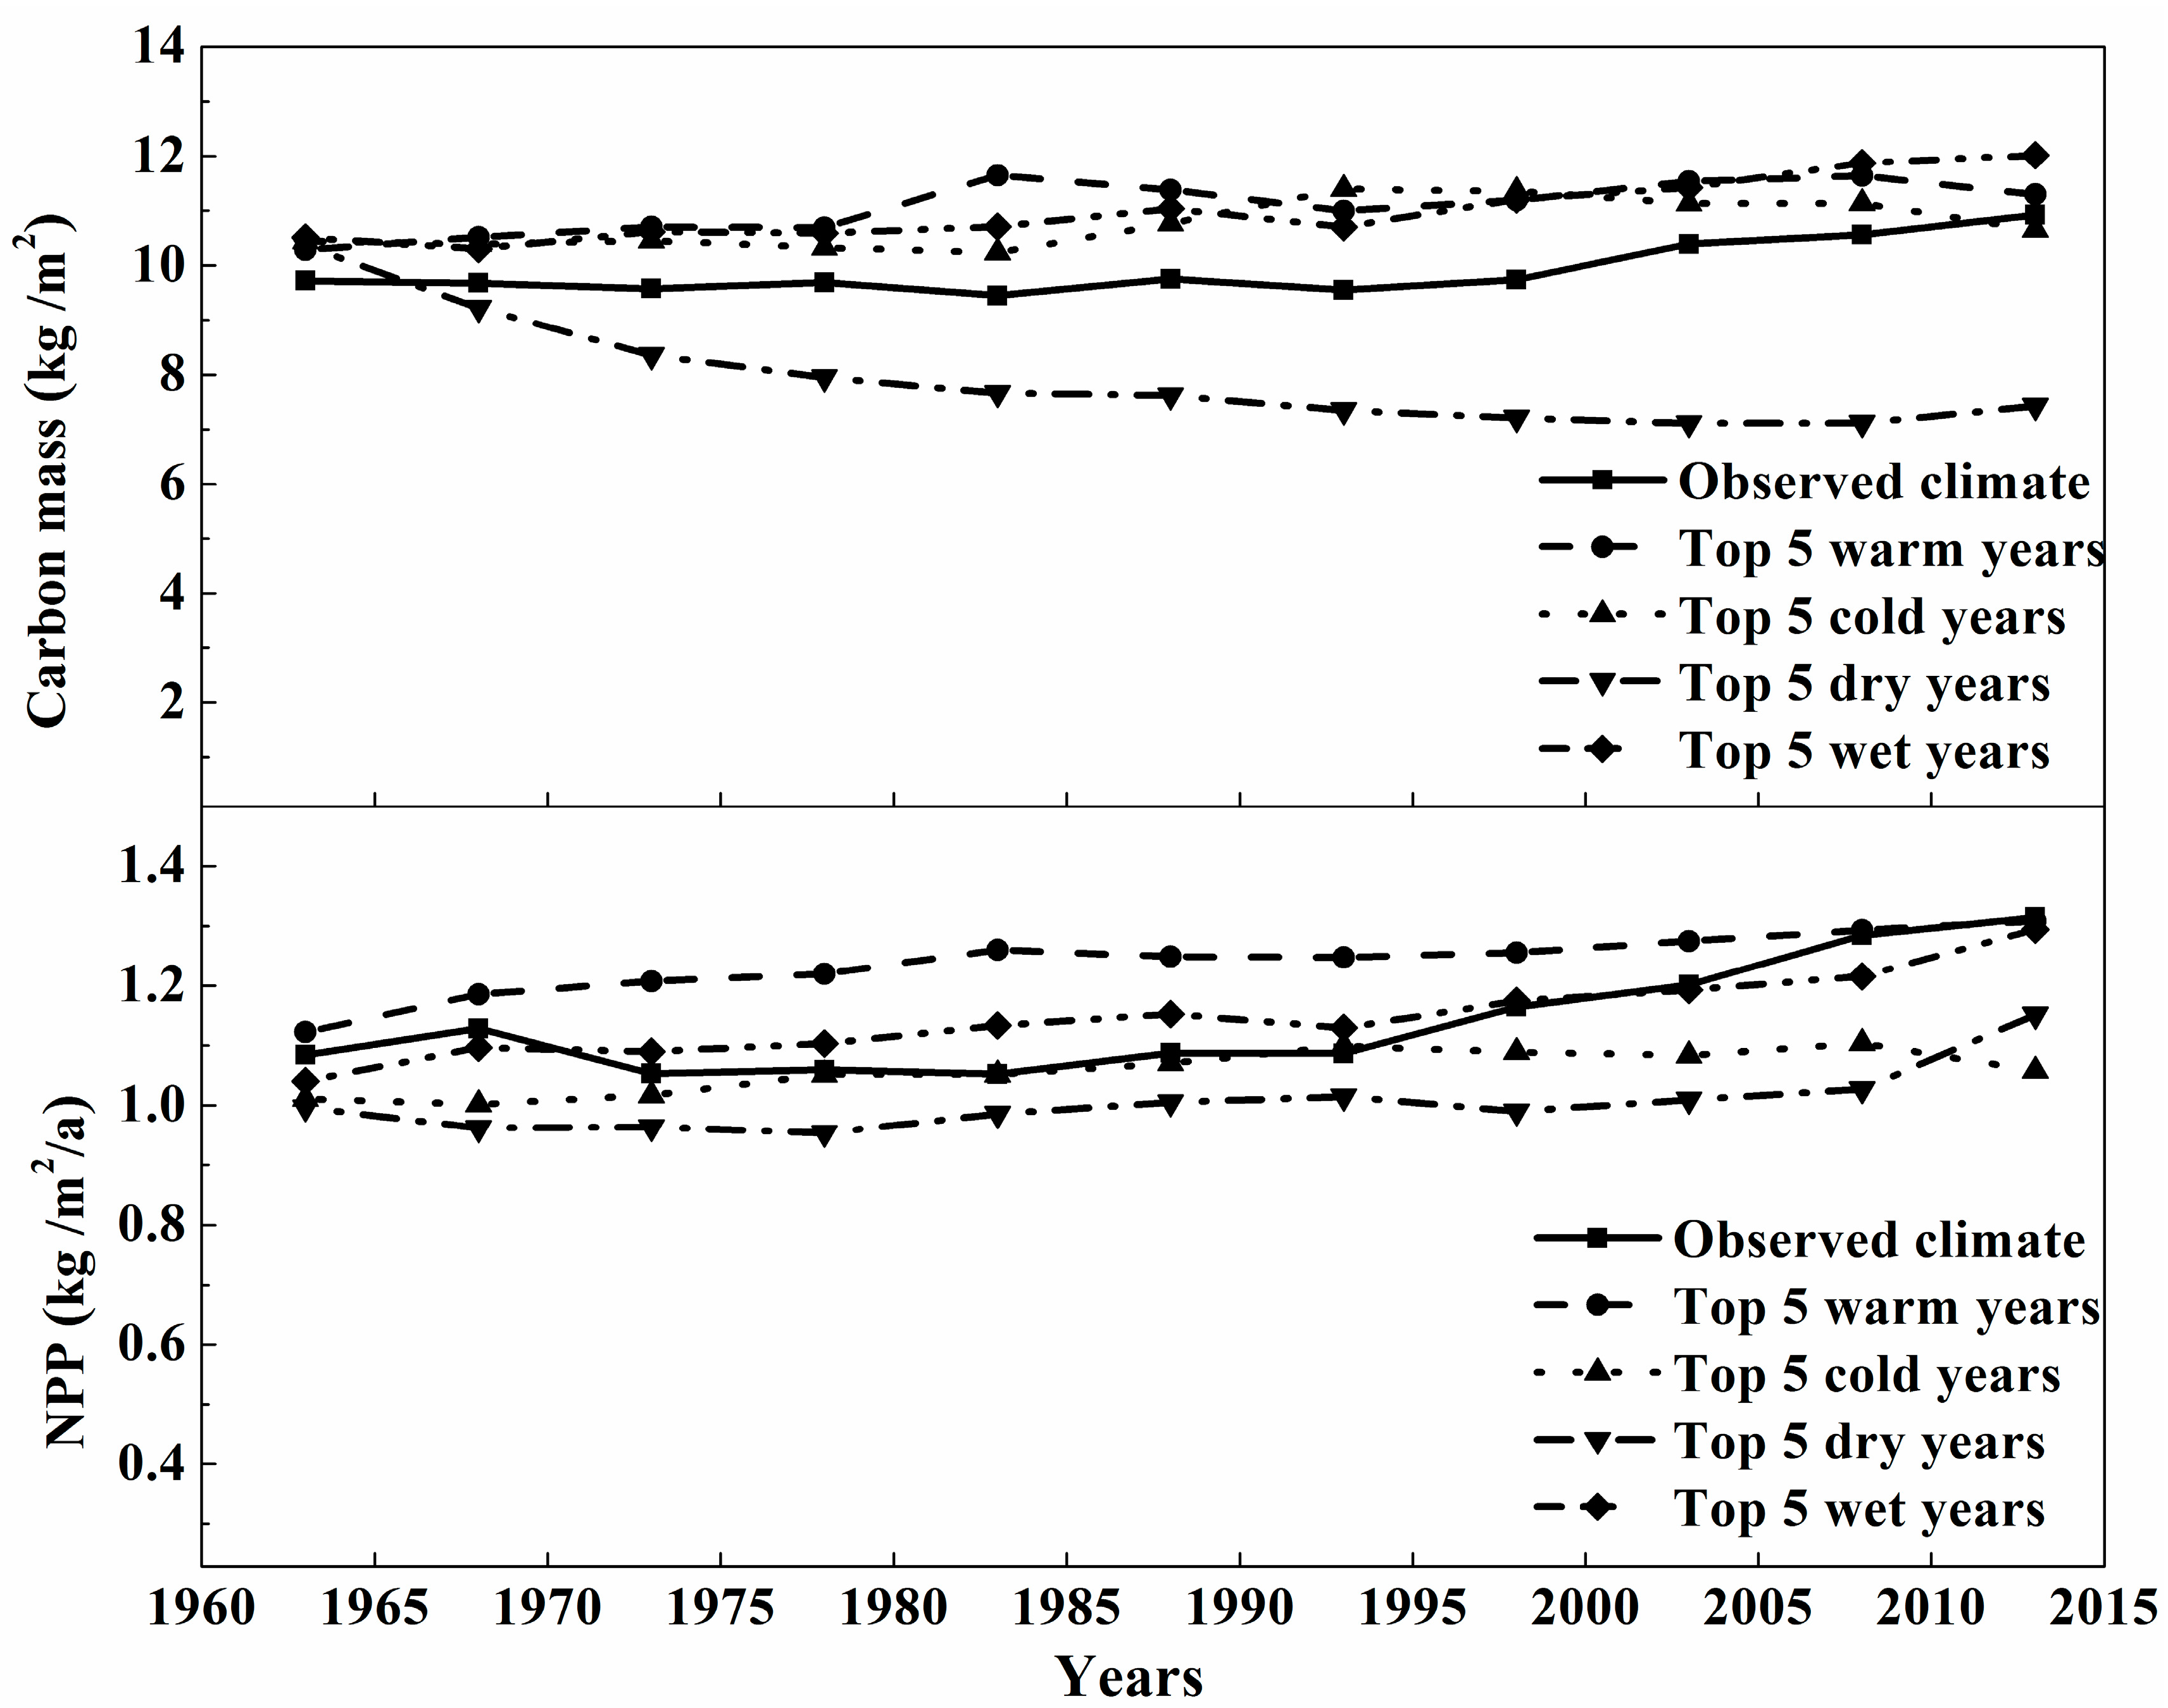
3.3. The Sensitivity Analysis of Carbon Mass of Montane Boreal Forest to Extreme Weather

We analyzed the extremes in weather events from 1964–2013 in stations we chose by ranking the mean value of heat and water in concentration months (annual mean temperature from April to October, and annual mean precipitation from May to September) of each year.
Under warm and wet conditions, NPP increased, and under warm conditions alone, NPP increased more (Figure 7). Under cold and dry conditions, NPP decreased, and it decreased further under dry conditions alone. However, the living biomass was greatly suppressed under dry conditions alone and decreased by 42% compared to the no-change simulation; mean decrease in NPP was 1.816 kg/m2 per five years. Under the other three conditions, biomass production performed better than under the actual climate. Biomass production increased (10% at the end of period) most notably under wet conditions, with a mean increase of 1.085 kg/m2 per five years.

4. Discussion

4.1. Model Applicability and Carbon Mass at Different Altitudes

Our LPJ-GUESS model simulation showed that the main distribution of Picea crassifolia in the Qilian Mountains was at 2700 to 3100 m, and the average carbon storage was 10.503 kg/m2, with a maximum of 11.787 kg/m2. The biomass pools at elevations 2300–2700 m contained more carbon than those at 3100–3500 m for the different dominant species.
The vertical distribution pattern of Picea crassifolia influenced the distribution of carbon density and NPP. Altitude was a dominant factor influencing the soil organic carbon concentration and community pattern of Picea crassifolia [52]; further, altitude exerted a strong influence on the growth of Picea crassifolia by affecting the microclimate, including air temperature and humidity, and soil moisture [24]. Trees were low and forest density was often low at low altitudes, increasing gradually at mid-altitudes, and exhibiting a pattern of isolated trees or scattered patches at the upper growth limit [53]. The most suitable conditions for the growth of Picea crassifolia forest were observed between 2800 and 2900 m [49], with grassland between 3000 to 3700 m [54]. Density and basal area of Picea crassifolia were also higher between 2650 to 3100 m than at other altitudes, and beyond 3100 m, the density decreased with an increase in altitude [55].
Evergreen conifers in cold and high-altitude zones of the montane boreal forest have lower carbon biomass due to low photosynthesis and respiration rates than that in warmer habitats [56]. Carbon mass in the biomass pools examined in this study, i.e., 5.462 kg·C/m2, was similar to the estimate for northern montane boreal forests ranging from 4.2 to 5.3 kg·C/m2 [47]. The focus of current research in the Qilian Mountains is on the main tree species, Picea crassifolia, but results are not uniform. Initial surveys at the Sidalong forest farm on the Qilian Mountain showed that Picea crassifolia biomass was about 24.298 kg/m2 (Chang et al., 1995). Recently, the aboveground carbon stocks of Picea crassifolia at the north-eastern edge of Qilian Mountains were calculated as 4.3 kg/C·m2 [47]. The estimate of the above-ground biomass in southern Qilian Mountains was between 0.1885 and 22.065 kg/m2 [57]. Our simulation of Picea crassifolia NPP was between 0.52–0.58 kg·C/m2/year, which is in the range of 0.3–0.7 kg·C/m2/year for boreal ecosystem productivity examined by remote sensing [58], and higher than the mean NPP (0.38 kg·C/m2/year) of Qilian Mountains [59]. Hydrothermal conditions drove carbon density differences in boreal forests; also, carbon density first increased, and then decreased with stand age, with the highest value at age 183 years [28]. Thus, carbon density calculations were different due to vertical distribution of vegetation patterns and the age of the forest in this study.
The carbon mass and NEE change in Picea crassifolia forest ecosystem we calculated revealed that this mountain forest tended to becoming a carbon source from a carbon sink in the last 50 years; this trend was slow and even reversed in the 2000s. The carbon mass of Picea crassifolia decreased at low elevations and increased at high elevations, showing an upward trend in vegetation distribution, but the highest carbon mass proportion region for the forest did not change in the study period. Similar to other boreal forests, the mountain boreal forest also tended to become a carbon source under climate change [60,61,62], but this trend in the Qilian Mountains slowed in the 2000s.
The LPJ-GUESS model has been used in a large number of studies, and its performance has been evaluated several times. The model has also been used in China. Combined LPJ-GUESS and High Accuracy Surface Modeling (HASM) allowed for an economical estimation of forest biomass and the research used climate data from 735 meteorological stations in Chinese mainland from 1950–2010 and compared the results with the Seventh National Forest Resources Inventory data in China [40]. The results presented in this article indicated that the LPJ-GUESS model was suitable for these 735 meteorological stations; stations used in our study were contained in those stations. A carbon balance calculation by LPJ-GUESS of three deciduous forests in a mountainous area near Beijing showed that the model can be applied to a warm temperate forest in China [37]. Also, the forest production and carbon dynamics study of Masson Pine Forest in the Jigongshan region demonstrated that the model can simulate growth dynamics of subtropical forests [39]. Finally, the simulation of the carbon cycle of a Larix chinensis forest at Taibai Mountains, China, indicated the model was suitable for analyzing vegetation characteristics in mountainous areas [38]. Similar to previous biomass calculations (Table 2), we found that the LPJ-GUESS model was suitable for simulating carbon change of the montane boreal forest in northwestern China. The carbon density calculated by the model is based only on foliage, fine roots, and sapwood and heartwood; thus, the results of the model can be expected to be lower than results of some field measurements.

4.2. The Effects of The Climate Variables on Carbon Cycling in Montane Boreal Forest

Carbon density and NPP in this montane boreal forest ecosystem were concentrated at 2700–3100 m. Mean carbon mass increased by 13.37%, with a 5-year mean of 1.202 kg/m2 from 1964 to 2013; mean NPP increased by 0.023 kg/m2/year per five years.
In this study, NPP clearly increased as temperature increased and under warm conditions. The effect of temperature on carbon storage was complex in this montane boreal forest. Increasing temperature limited the storage of carbon, while decreasing temperature promoted its storage. Under warm conditions, carbon storage increased, and if temperature decreased considerably, carbon mass was reduced. The temperature sensitivity of biomass allocation may be an important but not obvious regulator of the carbon cycle in the boreal forest [19,56]. With an increase in mean annual temperature, and only a modest expected increase in precipitation, a shift in boreal forest may be observed to a woodland/shrubland ecosystem type, which is more suited for such an environment [63]. Further, the overall warming trend may lead to earlier seasonal plant growth; however, incomplete development of green tissues exposed to colder environments may negatively influence tree growth and carbon storage [6]. To the contrary, some researchers concluded that increased temperature and longer growing seasons will increase the NPP and enhance carbon uptake of boreal forests; this response, however, was weak in interannual variations [64]. Boreal forests store vast amounts of carbon in soil, but the temperature effects on soils are challenging to measure. The temperature relationship with above-ground carbon density was affected by baseline temperature such that, at mean annual temperature <8 °C, the relationship was positive, and negative in regions with a mean annual temperature >10 °C for mature boreal forests [65].
Precipitation is positively related to the biomass and NPP of the montane boreal forest. Precipitation has a much greater impact on montane boreal forests than temperature; especially in reduced precipitation and in dry environments, both biomass and NPP decreased significantly and hindered productivity and biomass storage. Drought conditions likely affected the radial growth of Picea crassifolia forest in Qilian Mountains in the last half-century [66]. Drought was the major driver of the release of total original carbon, which reduced soil respiration and NPP in a large boreal watershed [67]. Extreme drought decreases carbon assimilation and reduces the carbon sink strength of forests [6]. Under extremely dry conditions, boreal forests may degrade to low-productivity open woodlands [63].
In this study, the effect of CO2 concentration on the biomass and NPP of montane boreal forest was also consistent, and the parameters were positively correlated. We showed that, if the CO2 concentration remained at the level present 50 years ago, the ability of the montane boreal forest to produce and store carbon would decrease. However, the capacity of forests to store carbon improved with increasing CO2 concentration, and the higher the CO2 amounts, the greater the carbon storage capacity. Although not as pronounced as that in tropical and temperate forests, the increase in CO2 concentration led to an increase in NPP and carbon stocks in boreal forests both at local and global scales [62,68]. A physiologically-based forest model showed that the total NPP and the carbon storage in biomass improved under elevated CO2 concentration due to an increase in net photosynthetic rates at leaf-level and smaller shifts in carbon residence time [56,67]. Using combined satellite and ground observations for 1950–2011, Denos and others (2013) demonstrated that the sequestration of atmospheric CO2 increased due to higher net CO2 uptake associated with spring and fall growth extensions in northern ecosystems. Increasing atmospheric CO2 is expected to increase boreal forest carbon in western China [69]. A simulation by the BIOME-BGC model in Picea crassifolia forest showed that the effect of CO2 concentration on NPP was more significant than that of climate change for future climate [70].

5. Conclusions

The carbon mass of montane boreal forest simulated by LPJ-GUESS was comparable, though lower than that reported in other studies. Carbon storage was concentrated at the altitude of 2700–3100 m in the Qilian Mountains. Within this altitudinal range, carbon storage of Picea crassifolia increased by 1.202 kg/m2 per five years, and NPP was between 0.52–0.58 kg·C/m2/year during the last 50 years. Picea crassifolia exhibited a trend toward climbing higher in elevation and becoming a carbon source in the last 50 years.
The boreal forest is significantly affected by climate change and has a slow recovery process. Under steady precipitation, carbon storage increased with increasing atmospheric CO2 concentration despite the negative effects of warming on montane boreal forest in the Qilian Mountains in the last 50 years. A lack of water is the greatest threat for carbon storage in Picea crassifolia. Under the changing CO2 concentration and precipitation conditions, carbon mass and NPP were positively correlated. The relationship between climate factors, CO2 concentration, extreme conditions, and carbon storage was largely impacted by stand age, geographical location, altitude, and the environment; therefore, further research needs to examine the drivers of interannual variability in the carbon cycle at different scales and under different conditions of climate change.

Acknowledgements

We are very grateful to Kathryn Piatek for her comments and editorial assistance. This work was supported by the National Natural Science Foundation of China (No. 41621001, 41522102 and 41601051) and the Foundation for Excellent Youth Scholars of “Northwest Institute of Eco-Environment and Resources”, Chinese Academy of Sciences.

Author Contributions

Zhibin He and Shu Fang conceived and designed the experiments; Shu Fang performed the experiments, analyzed the data and wrote the paper; Jun Du, Longfei Chen, Pengfei Lin, and Minmin Zhao optimized the experiment and modified the manuscript.

Conflicts of Interest

The authors declare no conflict of interest. The founding sponsors had no role in the design of the study; in the collection, analyses, or interpretation of data; in the writing of the manuscript, and in the decision to publish the results.

References

  1. Rössler, O.; Diekkrüger, B.; Löffler, J. Potential drought stress in a Swiss mountain catchment—Ensemble forecasting of high mountain soil moisture reveals a drastic decrease, despite major uncertainties. Water Resour. Res. 2012, 48. [Google Scholar] [CrossRef]
  2. Hartl-Meier, C.; Dittmar, C.; Zang, C.; Rothe, A. Mountain forest growth response to climate change in the Northern Limestone Alps. Trees 2014, 28, 819–829. [Google Scholar] [CrossRef]
  3. Savva, Y.; Oleksyn, J.; Reich, P.B.; Tjoelker, M.G.; Vaganov, E.A.; Modrzynski, J. Interannual growth response of Norway spruce to climate along an altitudinal gradient in the Tatra Mountains, Poland. Trees 2006, 20, 735–746. [Google Scholar] [CrossRef]
  4. Affolter, P.; Büntgen, U.; Esper, J.; Rigling, A.; Weber, P.; Luterbacher, J.; Frank, D. Inner alpine conifer response to 20th century drought swings. Eur. J. For. Res. 2010, 129, 289–298. [Google Scholar] [CrossRef]
  5. Orlowsky, B.; Seneviratne, S.I. Global changes in extreme events: Regional and seasonal dimension. Clim. Chang. 2012, 110, 669–696. [Google Scholar] [CrossRef]
  6. Frank, D.; Reichstein, M.; Bahn, M.; Thonicke, K.; Frank, D.; Mahecha, M.D.; Smith, P.; Velde, M.; Vicca, S.; Babst, F. Effects of climate extremes on the terrestrial carbon cycle: Concepts, processes and potential future impacts. Glob. Chang. Biol. 2015, 21, 2861–2880. [Google Scholar] [CrossRef] [PubMed] [Green Version]
  7. Thurner, M.; Beer, C.; Carvalhais, N.; Forkel, M.; Santoro, M.; Tum, M.; Schmullius, C. Large-scale variation in boreal and temperate forest carbon turnover rate related to climate. Geophys. Res. Lett. 2016, 43, 4576–4585. [Google Scholar] [CrossRef]
  8. Schlesinger, W.H.; Dietze, M.C.; Jackson, R.B.; Phillips, R.P.; Rhoades, C.C.; Rustad, L.E.; Vose, J.M. Forest biogeochemistry in response to drought. Glob. Chang. Biol. 2016, 22, 2318–2328. [Google Scholar] [CrossRef] [PubMed]
  9. Stocker, T. Climate Change 2013: The Physical Science Basis: Working Group I Contribution to the Fifth Assessment Report of the Intergovernmental Panel on Climate Change; Cambridge University Press: Cambridge, UK, 2014. [Google Scholar]
  10. McCain, C.M.; Colwell, R.K. Assessing the threat to montane biodiversity from discordant shifts in temperature and precipitation in a changing climate. Ecol. Lett. 2011, 14, 1236–1245. [Google Scholar] [CrossRef] [PubMed]
  11. Allen, C.D.; Macalady, A.K.; Chenchouni, H.; Bachelet, D.; McDowell, N.; Vennetier, M.; Kitzberger, T.; Rigling, A.; Breshears, D.D.; Hogg, E.T. A global overview of drought and heat-induced tree mortality reveals emerging climate change risks for forests. For. Ecol. Manag. 2010, 259, 660–684. [Google Scholar] [CrossRef]
  12. Kurz, W.A.; Dymond, C.C.; Stinson, G.; Rampley, G.J.; Neilson, E.T.; Carroll, A.L.; Ebata, T.; Safranyik, L. Mountain pine beetle and forest carbon feedback to climate change. Nature 2008, 452, 987–990. [Google Scholar] [CrossRef] [PubMed]
  13. Ruiz-Labourdette, D.; Nogués-Bravo, D.; Ollero, H.S.; Schmitz, M.F.; Pineda, F.D. Forest composition in mediterranean mountains is projected to shift along the entire elevational gradient under climate change. J. Biogeogr. 2012, 39, 162–176. [Google Scholar] [CrossRef]
  14. Trumbore, S.; Brando, P.; Hartmann, H. Forest health and global change. Science 2015, 349, 814–818. [Google Scholar] [CrossRef] [PubMed]
  15. Rocca, M.E.; Brown, P.M.; MacDonald, L.H.; Carrico, C.M. Climate change impacts on fire regimes and key ecosystem services in rocky mountain forests. For. Ecol. Manag. 2014, 327, 290–305. [Google Scholar] [CrossRef]
  16. Allen, K.A.; Lehsten, V.; Hale, K.; Bradshaw, R. Past and future drivers of an unmanaged carbon sink in European temperate forest. Ecosystems 2016, 19, 545–554. [Google Scholar] [CrossRef]
  17. Williams, C.A.; Collatz, G.J.; Masek, J.; Huang, C.; Goward, S.N. Impacts of disturbance history on forest carbon stocks and fluxes: Merging satellite disturbance mapping with forest inventory data in a carbon cycle model framework. Remote Sens. Environ. 2014, 151, 57–71. [Google Scholar] [CrossRef]
  18. Wit, H.A.; Bryn, A.; Hofgaard, A.; Karstensen, J.; Kvalevåg, M.M.; Peters, G.P. Climate warming feedback from mountain birch forest expansion: Reduced albedo dominates carbon uptake. Glob. Chang. Biol. 2014, 20, 2344–2355. [Google Scholar] [CrossRef] [PubMed]
  19. Elkin, C.; Gutiérrez, A.G.; Leuzinger, S.; Manusch, C.; Temperli, C.; Rasche, L.; Bugmann, H. A 2 °C warmer world is not safe for ecosystem services in the European alps. Glob. Chang. Biol. 2013, 19, 1827–1840. [Google Scholar] [CrossRef] [PubMed]
  20. He, Z.; Zhao, W.; Liu, H.; Tang, Z. Effect of forest on annual water yield in the mountains of an arid inland river basin: A case study in the pailugou catchment on northwestern China’s Qilian Mountains. Hydrol. Process. 2012, 26, 613–621. [Google Scholar] [CrossRef]
  21. Du, J.; He, Z.; Yang, J.; Chen, L.; Zhu, X. Detecting the effects of climate change on canopy phenology in coniferous forests in semi-arid mountain regions of China. Int. J. Remote Sens. 2014, 35, 6490–6507. [Google Scholar] [CrossRef]
  22. Baranova, A.; Schickhoff, U.; Wang, S.; Jin, M. Mountain pastures of Qilian Shan: Plant communities, grazing impact and degradation status (Gansu province, NW China). Hacquetia 2016, 15, 21–35. [Google Scholar] [CrossRef]
  23. Chen, L.; He, Z.; Du, J.; Yang, J.; Zhu, X. Patterns and controls of soil organic carbon and nitrogen in alpine forests of northwestern China. For. Sci. 2015, 61, 1033–1040. [Google Scholar] [CrossRef]
  24. He, Z.; Zhao, W.; Zhang, L.; Liu, H. Response of tree recruitment to climatic variability in the alpine treeline ecotone of the Qilian Mountains, northwestern China. For. Sci. 2013, 59, 118–126. [Google Scholar] [CrossRef]
  25. He, Z.; Du, J.; Zhao, W.; Yang, J.; Chen, L.; Zhu, X.; Chang, X.; Liu, H. Assessing temperature sensitivity of subalpine shrub phenology in semi-arid mountain regions of China. Agric. For. Meteorol. 2015, 213, 45–52. [Google Scholar] [CrossRef]
  26. Chang, X.; Zhao, W.; He, Z. Radial pattern of sap flow and response to microclimate and soil moisture in Qinghai spruce (Picea crassifolia) in the upper Heihe river basin of arid northwestern China. Agric. For. Meteorol. 2014, 187, 14–21. [Google Scholar] [CrossRef]
  27. Tian, F.; Zhao, C.; Feng, Z.-D. Simulating evapotranspiration of Qinghai spruce (Picea crassifolia) forest in the Qilian Mountains, northwestern China. J. Arid Environ. 2011, 75, 648–655. [Google Scholar] [CrossRef]
  28. Peng, S.; Zhao, C.; Zheng, X.; Xu, Z.; He, L. Spatial distribution characteristics of the biomass and carbon storage of Qinghai spruce (Picea crassifolia) forests in Qilian mountains. Chin. J. Appl. Ecol. 2011, 22, 1689–1694. [Google Scholar]
  29. Thomas, S.C.; Martin, A.R. Carbon content of tree tissues: A synthesis. Forests 2012, 3, 332–352. [Google Scholar] [CrossRef]
  30. Smith, B.; Prentice, I.C.; Sykes, M.T. Representation of vegetation dynamics in the modelling of terrestrial ecosystems: Comparing two contrasting approaches within European climate space. Glob. Ecol. Biogeogr. 2001, 10, 621–637. [Google Scholar] [CrossRef]
  31. Hickler, T.; Smith, B.; Sykes, M.T.; Davis, M.B.; Sugita, S.; Walker, K. Using a generalized vegetation model to simulate vegetation dynamics in northeastern USA. Ecology 2004, 85, 519–530. [Google Scholar] [CrossRef]
  32. Ahlström, A.; Schurgers, G.; Arneth, A.; Smith, B. Robustness and uncertainty in terrestrial ecosystem carbon response to CMIP5 climate change projections. Environ. Res. Lett. 2012, 7, 044008. [Google Scholar] [CrossRef]
  33. Korth, H.; Tsyganenko, N.A.; Johnson, C.L.; Philpott, L.C.; Anderson, B.J.; Al Asad, M.M.; Solomon, S.C.; McNutt, R.L. Modular model for mercury’s magnetospheric magnetic field confined within the average observed magnetopause. J. Geophys. Res. Space Phys. 2015, 120, 4503–4518. [Google Scholar] [CrossRef] [PubMed]
  34. Knorr, W.; Arneth, A.; Jiang, L. Demographic controls of future global fire risk. Nat. Clim. Chang. 2016, 6, 781–785. [Google Scholar] [CrossRef]
  35. De Kauwe, M.G.; Medlyn, B.E.; Zaehle, S.; Walker, A.P.; Dietze, M.C.; Hickler, T.; Jain, A.K.; Luo, Y.; Parton, W.J.; Prentice, I.C.; et al. Forest water use and water use efficiency at elevated CO2: A model-data intercomparison at two contrasting temperate forest face sites. Glob. Chang. Biol. 2013, 19, 1759–1779. [Google Scholar] [CrossRef] [PubMed]
  36. Rosenzweig, C.; Elliott, J.; Deryng, D.; Ruane, A.C.; Müller, C.; Arneth, A.; Boote, K.J.; Folberth, C.; Glotter, M.; Khabarov, N.; et al. Assessing agricultural risks of climate change in the 21st century in a global gridded crop model intercomparison. Proc. Natl. Acad. Sci. USA 2014, 111, 3268–3273. [Google Scholar] [CrossRef] [PubMed]
  37. Liu, R.G.; Li, N.; Su, H.X.; Sang, W.G. Simulation and analysis on future carbon balance of three deciduous forests in Beijing mountain area, warm temperate zone of China. Chin. J. Plant Ecol. 2009, 33, 516–534. [Google Scholar]
  38. Li, L.; He, X.; Hu, L.; Li, J. Simulation of the carbon cycle of Larix chinensis forest during 1958 and 2008 at Taibai Mountain, China. Acta Ecol. Sin. 2013, 33, 2845–2855. [Google Scholar]
  39. Peng, X.; Cheng, R.; Xiao, W.; Wang, R.; Wang, X.; Liu, Z. Productivity and carbon dynamic of the masson pine stands in Jigongshan region based on lpj-guess model. Sci. Silvae Sin. 2013, 49, 7–8. [Google Scholar]
  40. Zhao, M.; Yue, T.; Zhao, N.; Sun, X.; Zhang, X. Combining lpj-guess and hasm to simulate the spatial distribution of forest vegetation carbon stock in China. J. Geogr. Sci. 2014, 24, 249–268. [Google Scholar] [CrossRef]
  41. Sitch, S. The Role of Vegetation Dynamics in the Control of Atmospheric CO2 Content; Department of Ecology, Lund University: Lund, Sweden, 2000. [Google Scholar]
  42. Sitch, S.; Smith, B.; Prentice, I.C.; Arneth, A.; Bondeau, A.; Cramer, W.; Kaplans, J.O.; Levis, S.; Lucht, W.; Sykes, M.T.; et al. Evaluation of ecosystem dynamica, olant geography and terrestrial carbon cycling in the lpj dynamic global vegetation model. Glob. Chang. Biol. 2003, 9, 161–185. [Google Scholar] [CrossRef]
  43. Hickler, T.; Fronzek, S.; Araújo, M.B.; Schweiger, O.; Thuiller, W.; Sykes, M.T. An ecosystem model-based estimate of changes in water availability differs from water proxies that are commonly used in species distribution models. Glob. Ecol. Biogeogr. 2009, 18, 304–313. [Google Scholar] [CrossRef]
  44. Hickler, T.; Vohland, K.; Feehan, J.; Miller, P.A.; Smith, B.; Costa, L.; Giesecke, T.; Fronzek, S.; Carter, T.R.; Cramer, W. Projecting the future distribution of European potential natural vegetation zones with a generalized, tree species-based dynamic vegetation model. Glob. Ecol. Biogeogr. 2012, 21, 50–63. [Google Scholar] [CrossRef]
  45. Wu, Q.; Hu, Q.W.; Zheng, L.; Zhang, F.; Song, M.H.; Liu, X.D. Variations of leaf lifespan and leaf mass per area of Picea crassifolia along altitude gradient. Acta Bot. Boreal. Occident. Sin. 2010, 30, 1689–1694. [Google Scholar]
  46. Chen, F.; Yuan, Y.-J.; Wei, W.-S.; Yu, S.-L.; Fan, Z.-A.; Zhang, R.-B.; Zhang, T.-W.; Li, Q.; Shang, H.-M. Temperature reconstruction from tree-ring maximum latewood density of Qinghai spruce in middle Hexi corridor, China. Theor. Appl. Clim. 2012, 107, 633–643. [Google Scholar] [CrossRef]
  47. Wagner, B.; Liang, E.; Li, X.; Dulamsuren, C.; Leuschner, C.; Hauck, M. Carbon pools of semi-arid Picea crassifolia forests in the Qilian Mountains (north-eastern Tibetan Plateau). For. Ecol. Manag. 2015, 343, 136–143. [Google Scholar] [CrossRef]
  48. Jing, W.-M.; Liu, X.-D.; Zhao, W.-J.; Ma, Y. Study on biomass and net productivity of typical forest stand in the Qilian mountains. J. Gansu Agric. Univ. 2011, 6, 017. [Google Scholar]
  49. Zhang, L.; Yu, P.; Wang, Y.; Wang, S.; Liu, X. Biomass change of middle aged forest of Qinghai spruce along an altitudinal gradient on the north slope of Qilian mountains. Sci. Silvae Sin. 2015, 51, 1–7. [Google Scholar]
  50. Allen, D.; Mackie, D.; Wei, M. Groundwater and climate change: A sensitivity analysis for the grand forks aquifer, southern British Columbia, Canada. Hydrogeol. J. 2004, 12, 270–290. [Google Scholar] [CrossRef]
  51. Katz, R. Extreme value theory for precipitation: Sensitivity analysis for climate change. Adv. Water Res. 1999, 23, 133–139. [Google Scholar] [CrossRef]
  52. Zhao, C.; Chen, L.; Ma, F.; Yao, B.; Liu, J. Altitudinal differences in the leaf fitness of juvenile and mature alpine spruce trees (Picea crassifolia). Tree Phys. 2008, 28, 133–141. [Google Scholar] [CrossRef]
  53. Zhao, C.; Nan, Z.; Cheng, G.; Zhang, J.; Feng, Z. Gis-assisted modelling of the spatial distribution of Qinghai spruce (Picea crassifolia) in the Qilian mountains, northwestern china based on biophysical parameters. Ecol. Model. 2006, 191, 487–500. [Google Scholar] [CrossRef]
  54. Liang, B.; Di, L.; Zhao, C.; Peng, S.; Peng, H.; Wang, C.; Wang, Y.; Liu, Y. Altitude distribution of aboveground biomass of typical shrubs in the tianlaochi watershed of Qilian mountains. Acta Agrestia Sin. 2013, 21, 664–669. [Google Scholar]
  55. Zhang, L.; Liu, H. Response of Picea crassifolia population to climate change at the treeline ecotones in Qilian mountains. Sci. Silvae Sin. 2012, 1, 006. [Google Scholar]
  56. Reich, P.B.; Rich, R.L.; Lu, X.; Wang, Y.-P.; Oleksyn, J. Biogeographic variation in evergreen conifer needle longevity and impacts on boreal forest carbon cycle projections. Proc. Natl. Acad. Sci. USA 2014, 111, 13703–13708. [Google Scholar] [CrossRef] [PubMed]
  57. Tian, X.; Li, Z.; Su, Z.; Chen, E.; Tol, C.V.D.; Li, X.; Guo, Y.; Li, L.; Ling, F. Estimating montane forest above-ground biomass in the upper reaches of the Heihe river basin using landsat-tm data. Int. J. Remote Sens. 2014, 35, 7339–7362. [Google Scholar] [CrossRef]
  58. Zhou, Y.; Zhu, Q.; Chen, J.M.; Wang, Y.Q.; Liu, J.; Sun, R.; Tang, S. Observation and simulation of net primary productivity in Qilian mountain, western china. J. Environ. Manag. 2007, 85, 574–584. [Google Scholar] [CrossRef] [PubMed]
  59. Wang, P.; Sun, R.; Hu, J.; Zhu, Q.; Zhou, Y.; Li, L.; Chen, J.M. Measurements and simulation of forest leaf area index and net primary productivity in northern China. J. Environ. Manag. 2007, 85, 607–615. [Google Scholar] [CrossRef] [PubMed]
  60. Wramneby, A.; Smith, B.; Zaehle, S.; Sykes, M.T. Parameter uncertainties in the modelling of vegetation dynamics—Effects on tree community structure and ecosystem functioning in European forest biomes. Ecol. Model. 2008, 216, 277–290. [Google Scholar] [CrossRef]
  61. Smith, B.; Knorr, W.; Widlowski, J.-L.; Pinty, B.; Gobron, N. Combining remote sensing data with process modelling to monitor boreal conifer forest carbon balances. For. Ecol. Manag. 2008, 255, 3985–3994. [Google Scholar] [CrossRef]
  62. Hickler, T.; Smith, B.; Prentice, I.C.; Mjöfors, K.; Miller, P.; Arneth, A.; Sykes, M.T. CO2 fertilization in temperate face experiments not representative of boreal and tropical forests. Glob. Chang. Biol. 2008, 14, 1531–1542. [Google Scholar] [CrossRef]
  63. Clemmensen, K.; Bahr, A.; Ovaskainen, O.; Dahlberg, A.; Ekblad, A.; Wallander, H.; Stenlid, J.; Finlay, R.; Wardle, D.; Lindahl, B. Roots and associated fungi drive long-term carbon sequestration in boreal forest. Science 2013, 339, 1615–1618. [Google Scholar] [CrossRef] [PubMed]
  64. Piao, S.; Liu, Z.; Wang, T.; Peng, S.; Ciais, P.; Huang, M.; Ahlstrom, A.; Burkhart, J.F.; Chevallier, F.; Janssens, I.A. Weakening temperature control on the interannual variations of spring carbon uptake across northern lands. Nat. Clim. Chang. 2017, 7, 359–363. [Google Scholar] [CrossRef]
  65. Liu, Y.; Yu, G.; Wang, Q.; Zhang, Y. How temperature, precipitation and stand age control the biomass carbon density of global mature forests. Glob. Ecol. Biogeogr. 2014, 23, 323–333. [Google Scholar] [CrossRef]
  66. Zhang, Y.; Shao, X.; Wilmking, M. Dynamic relationships between Picea crassifolia growth and climate at upper treeline in the Qilian Mts., northeast Tibetan Plateau, China. Dendrochronologia 2011, 29, 185–199. [Google Scholar] [CrossRef]
  67. Lepistö, A.; Futter, M.N.; Kortelainen, P. Almost 50 years of monitoring shows that climate, not forestry, controls long-term organic carbon fluxes in a large boreal watershed. Glob. Chang. Boil. 2014, 20, 1225–1237. [Google Scholar] [CrossRef] [PubMed]
  68. Schimel, D.; Stephens, B.B.; Fisher, J.B. Effect of increasing CO2 on the terrestrial carbon cycle. Proc. Natl. Acad. Sci. USA 2015, 112, 436–441. [Google Scholar] [CrossRef] [PubMed]
  69. Friend, A.D.; Lucht, W.; Rademacher, T.T.; Keribin, R.; Betts, R.; Cadule, P.; Ciais, P.; Clark, D.B.; Dankers, R.; Falloon, P.D. Carbon residence time dominates uncertainty in terrestrial vegetation responses to future climate and atmospheric CO2. Proc. Natl. Acad. Sci. USA 2014, 111, 3280–3285. [Google Scholar] [CrossRef] [PubMed]
  70. Peng, S.; Zhao, C.; Chen, Y.; Xu, Z. Simulating the productivity of a subalpine forest at high elevations under representative concentration pathway (RCP) scenarios in the Qilian Mountains of northwest China. Scand. J. For. Res. 2016, 32, 1–31. [Google Scholar]
Figure 1. Study area and locations of meteorological stations used in the study in the Qilian Mountains.
Forests 09 00057 g001
Figure 2. Carbon mass proportion at different elevations for twelve meteorological stations. Data are the means of simulated values for each range in elevation.
Forests 09 00057 g002
Figure 3. The carbon flows change in montane boreal forest ecosystem from 1964–2013. kg/m2/a: kg/m2/year.
Forests 09 00057 g003
Figure 4. LPJ-GUESS output showing the effects on stored carbon (top panel) and NPP (bottom panel) of changing the temperature only. Temperature was modified by adding or subtracting 1 (or 2) °C to each daily climate value. Lines represent the means of the simulations. Temp: the abbreviation of temperature.
Forests 09 00057 g004
Figure 5. LPJ-GUESS output showing the effects on stored carbon (top panel) and NPP (bottom panel) of changing precipitation only. Precipitation was changed multiplicatively because it is a zero-based variable. Lines represent the means of the simulations. Prec: the abbreviation of precipitation.
Forests 09 00057 g005
Figure 6. LPJ-GUESS output showing the effect on stored carbon (top panel) and NPP (bottom panel) of changing CO2 concertration only. CO2 concertration was de-trended by using 1964 levels throughout and was modified by adding values to each year value. Lines represent the means of simulations.
Forests 09 00057 g006
Figure 7. LPJ-GUESS output showing the effects of extreme weather conditions on stored carbon (top panel) and NPP (bottom panel). Local weather data were used to determine the most extreme high /low temperature and high/low rainfall from a 5-year period.
Forests 09 00057 g007
Table 1. Site information.
GroupsNameLevelLongitude (°)Latitude (°)Altitude (m)
2300–2500 mXiningProvincial-Qinghai101.4536.442295
HuzhuProvincial-Qinghai101.5736.492480
2500–2700 mDatongProvincial-Qinghai101.6736.922587
HuangzhongProvincial-Qinghai101.3536.32668
2700–2900 mQilianNational-China100.2538.182787
HualongProvincial-Qinghai102.1536.062835
MenyuanNational-China101.6237.382850
2900–3100 mWushaolingNational-China102.5237.123045
3100–3300 mDachaidanNational-China95.3737.853173
YeniugouNational-China99.5838.423180
3300–3500 mGangchaNational-China100.1337.333302
TuoleNational-China98.4238.83367
Table 2. Carbon mass calculations for Picea crassifolia in the literature.
MethodResearch AreaCarbon Mass Sources
LPJ-GUESSQilian Mountains10.924 (kg/m2)This study
Sample measuredSunan County28.250 (kg/m2)[48]
Sample measuredQilian Mountains20.920 (kg/m2)[28]
Vegetation survey and Tree-ring researchPailugou Watershed12.861 (kg/m2)[49]
Sample measuredHaxi forest farm13.290 (kg/m2)
Model simulationQilian Mountains16.980 (kg/m2)
Sample measurednorth-eastern edge Qilian Mountains8.270(kg/m2)[47]

