Article

Current and Potential Spatial Distribution of Six Endangered Pine Species of Mexico: Towards a Conservation Strategy

by
Martin Enrique Romero-Sanchez
*,
Ramiro Perez-Miranda
,
Antonio Gonzalez-Hernandez
,
Mario Valerio Velasco-Garcia
,
Efraín Velasco-Bautista
and
Andrés Flores
National Institute on Forestry, Agriculture and Livestock Research, Progreso 5, Barrio de Santa Catarina, Coyoacan, 04010 Mexico City, Mexico
*
Author to whom correspondence should be addressed.
Forests 2018, 9(12), 767; https://doi.org/10.3390/f9120767
Submission received: 24 October 2018 / Revised: 30 November 2018 / Accepted: 6 December 2018 / Published: 12 December 2018
(This article belongs to the Section Forest Inventory, Modeling and Remote Sensing)

Abstract

:
Mexico is home to the highest species diversity of pines: 46 species out of 113 reported around the world. Within the great diversity of pines in Mexico, Pinus culminicola Andresen et Beaman, P. jaliscana Perez de la Rosa, P. maximartinenzii Rzed., P. nelsonii Shaw, P. pinceana Gordon, and P. rzedowskii Madrigal et M. Caball. are six catalogued as threatened or endangered due to their restricted distribution and low population density. Therefore, they are of special interest for forest conservation purposes. In this paper, we aim to provide up-to-date information on the spatial distribution of these six pine species according to different historical registers coming from different herbaria distributed around the country by using spatial modeling. Therefore, we recovered historical observations of the natural distribution of each species and modelled suitable areas of distribution according to environmental requirements. Finally, we evaluated the distributions by contrasting changes of vegetation in the period 1991–2016. The results highlight areas of distribution for each pine species in the northeast, west, and central parts of Mexico. The results of this study are intended to be the basis of in situ and ex situ conservation strategies for the endangered Mexican pines.

1. Introduction

Pines are the most significant members of the Pinaceae family; there are 113 species widely distributed around the world, most of them in the Northern Hemisphere [1]. Mexico has the highest species diversity of pines (46 species), with contrasting geographical and intraspecific genetic patterns, because of adaptive responses to climate change in the past [2]. The country hosts 29 endemic species, distributed in different ecological environments [1]. In Mexico, pines are usually found in three types of communities, pure pine forests, pine–oak forests, and oak–pine forests, that occur at different elevations, climates, and exposure conditions [3], as representatives of the high ecological diversity of the Mexican landscape. Mexican temperate forests are mainly located in high altitudes over mountainous zones originating from volcanos [4]; however, pine communities can also be found in different vegetation types such as grasslands and scrublands, representatives of arid and semi-arid zones of Mexico [5].
Many coniferous forests have suffered a decrease in area, disappeared, or changed composition, allowing for substitution by angiosperms [5]. The causes of the reduction of forests include the constant increase in the frequency of fires, due to both natural causes and human-made phenomena and excessive logging, whether for the direct harvesting of timber and by-products or the expansion of agricultural and livestock activity. Also, recent trends in global warming pose a threat to many forest species [6], and pine species in particular are more vulnerable because of their specific environmental requirements and the limited distribution of their populations. Habitat fragmentation has straightforward consequences on plant populations as it significantly increases the risk of local extinction. Moreover, fragmentation leads to a reduction in effective population size and an increase in the degree of isolation between populations [7,8]. The immediate effect of fragmentation on remaining populations tends to increase the degree of inbreeding as crosses between related individuals as well as self-fertilization increase would compromise the viability of the species [7]. For instance, there is a need to develop research related to the status of endangered and endemic Mexican pine species populations.
Within the diversity of pines in Mexico, Pinus culminicola Andresen et Beaman, P. jaliscana Perez de la Rosa, P. maximartinenzii Rzed., P. nelsonii Shaw, P. pinceana Gordon, and P. rzedowskii Madrigal et M. Caball. are six Mexican pines catalogued as threatened or endangered species [9] due to their restricted distribution and low population density. These pines occupy diverse habitats, present a variety of ecological roles, and cover a wide range of environments differing in altitude, precipitation, temperature, and soil conditions [10,11,12,13]. Spatial modeling and GIS techniques provide the tools to create current and future scenarios of possible suitable areas of distribution according to available databases and information about these species.
Spatial modeling and niche ecological models combined with other analytical tools (e.g., GIS) allow the evaluation of non-inventoried sites as well as the modeling of past or future scenarios in the distribution of species [14]. Recently, numerous modeling methods and tools have been developed [15,16], although they are mainly used in ecology and biogeography [17,18]. The use of these alternatives accomplishes a double function: first, they provide knowledge about the potential distribution of the species to know the richness and diversity of non-evaluated areas. Secondly, they use said predictions in the choice of sites of particular interest as biological conservation zones [19,20].
In this paper, using spatial modeling, we aim to provide up-to-date data on the spatial distribution of six endangered and endemic pine species of Mexico according to different historical registers coming from different herbaria distributed around the country. The objectives of this study were: (a) to recover historical observations of the natural distribution of each species, (b) model suitable areas of distribution according to environmental requirements and (c) evaluate the model predictions to highlight “hotspots” or areas of possible concern for the conservation of each pine species. All pine species selected are described as “in danger of extinction” by the Ministry of Natural Resources of Mexico. The geographic locations of each pine species were used to explain the distribution due to different conditions through a logistic regression approach and to highlight the most critical environmental factors that drive such distribution.

2. Materials and Methods

This study was divided into two steps. First, we conducted a literature review in scientific databases and performed visits to different herbaria located across the country to collect and retrieve historical information about the location and environmental characteristics of each pine species. Second, the potential distribution was modeled through a multiple logistic regression [21], using the information recovered from the literature and herbarium databases. Logistic regression modeling is a presence/absence-based method used here to model the potential distribution of six pine species. We estimated the probability of occurrence of several predictor variables coming from geographic layers and environmental and climatic databases. Later, the current and potential distribution of each pine species were compared against the official land cover cartography to validate the estimations and discuss whether land cover changes are having a negative impact on the current and potential distribution of the endemic pines of Mexico.

2.1. Study Area

The study area comprised the northern and central part of Mexico and included the States of Durango, Coahuila, Nuevo Leon, Tamaulipas, San Luis Potosi, Jalisco, Queretaro, Hidalgo and Michoacán. The study area mainly focused on temperate coniferous forests but also included other vegetation types such as grasslands, scrublands and secondary vegetation, according to each pine species distribution reported (Figure 1). We focused on the reports of distribution of six endangered and endemic pine species of Mexico: Pinus culminicola, P. jaliscana, P. maximartinezi, P. nelsonii, P. pinceana, and P. rzedowskii. These species were selected because, among all the Mexican pines, they are the only ones that are catalogued as endemic and endangered according to Mexican legislation (Table 1). Also, they represent a variety of bioclimatic conditions and vegetation types that can serve as a basis for further research on modeling species distribution.

2.2. Pine Species Information

The spatial distribution and endangered status of each pine species are described in Table 1. All of the species below are listed as endemic to Mexico [9]. Observations of presence of each species were collected from historical reports associated to a geographic reference. Meanwhile, observations of absence were randomly selected from areas where the vegetation type and conditions matched the distributions described in literature, but no reports of the species were found.
The historical information on pine samples across Mexico was retrieved by visiting different herbaria from different academic and research institutions (Table 2). The goal was to retrieve geographic locations for each pine species to construct a database that could serve as a basis for further modeling.
Furthermore, an electronic search was also conducted to explore databases from different institutional websites. The websites consulted belong to the world network on biodiversity (REMIB), the virtual herbarium of the Biodiversity Conservation Commission (CONABIO; HVC), the Gymnosperm Database, the herbarium network of the northeast of Mexico (Herbanwmex), the Flora of Baja California, Global Biodiversity Information Facility (GBIF), Southeast Regional Network of Expertise and Collections (SERNEC), and the consortium of Midwest Herbaria. Additionally, we explored and analyzed the database of the national forest inventory provided by the National Forestry Commission (CONAFOR) of Mexico.
All the information was filtered and analyzed to avoid inconsistencies. We focused on natural populations. Thus, all the data coming from locations belonging to arboretums or plantations were discarded to avoid bias and misinterpretation during the modeling process.

2.3. Geographic Layers

The National Institute of Statistics and Geography of Mexico (INEGI) produces and publishes land cover and vegetation type maps at the national level at a scale of 1:250,000 using a 25-hectare minimum mapping unit [22]. The first land cover map was published in 1991 and the latest one in 2016. Therefore, we used the first and sixth version of the land cover map to provide a spatial and temporal context for the analysis. A national Digital Elevation Model (DEM) raster dataset with approximately 30-m pixel size was used to create slope and aspect layers for further analysis. All digital geographic data described before are freely available (www.inegi.gob.mx) and were provided by INEGI.
Climatic data layers were retrieved from the Digital Climatic Atlas of Mexico (DCAM). DCAM was developed by the Informatics Unit for Atmospheric and Environmental Sciences (abbreviated as UNIATMOS in Spanish) of the National Autonomous University of Mexico (abbreviated as UNAM in Spanish) available at http://uniatmos.atmosfera.unam.mx/ACDM/. The bioclimatic parameters used in this study (Table 3) for the continental surface of Mexico were calculated per station from the 1902–2011 daily climatological database of the National Meteorological Service according to the ANUCLIM methodology [23]. Additional bioclimatic variables were collected from WorldClim [24], an open climate dataset for ecological modeling and GIS (Table 3). WorldClim is a dataset of global climate layers (gridded climate data) with a spatial resolution of about 1 km2, available at www.worldclim.org.

2.4. Species Distribution Modeling

All pine observations were divided into two groups: 70% of the data were used to develop the models and the remaining 30% were retained to validate the models independently.
We used correlation matrices between the predictors to indicate if there were correlations/associations between predictors. To reduce multicollinearity issues, only bioclimatic regions that had a low correlation between each other were used in the modeling. All data analyses carried out in this study were performed using the R software [25] packages “CAR” [26], “PerformanceAnalytics” [27], and “dplyr” [28].

2.4.1. Logistic Regression

To model the spatial distribution of the species, logistic regression was selected because it assumes the probability distribution as the response variable, and hence for the error terms from the fitted model, is adequately described by the random component chosen [21]. In this study, we considered the response variable Y as the Bernoulli random variable with parameter E ( Y ) = π , taking only the values of 1 (when the species is present) and 0 (when the species is not present) with probabilities π and 1 − π, respectively. Then, the logistic regression model is Y = E ( Y ) + ε , and E ( Y ) = π is expressed as [21]:
E ( Y ) = π = exp ( X β ) 1 + exp ( X β )
where, if we consider p − 1 predictor variables, vectors β and X are expressed as:
β p 1 = [ β 0 β 1 β p 1 ]
and
X p 1 = [ X 0 X 1 X p 1 ]
Then, we have the linear predictor as:
X β = β 0 + β 1 X 1 + + β p 1 X p 1 = π = l o g e π 1 π
Numerical search procedures were used to estimate the values of β0, β1, …, βp−1 that maximize the log-likelihood. These maximum likelihood estimates are denoted by b0, b1, …, bp−1. Therefore, the fitted logistic response function can be expressed as follows:
π ^ = exp ( X β ) 1 + exp ( X β )
where:
b p 1 = [ b 0 b 1 b p 1 ] y
X b = b 0 + b 1 X 1 + + b p 1 X p 1 = π ^ = l o g e π ^ 1 π ^
The estimated odds ratio for predictor variable Xk, denoted by π ^ , is exp(bk). For continuous predictors this is the change in the ratio of probability of the species of pine occurring at any given location; when there is a unit change at X, we assume that all other predictor variables are held constant.

2.4.2. Validation of the Models

As measures of predictive models, the sensitivity, specificity and concordance indices were calculated. These indices were calculated on the validation sample that was not used to train the models. Finally, the overall accuracy was calculated through a confusion matrix. Also, the beta coefficients, standard errors, z values, and p values were retrieved for model diagnosis. Additionally, the receiver operating characteristic curve (ROC) was traced as a measure of fit.

2.5. Identifying Areas of Possible Conservation Concern

Once the current and potential distribution maps were prepared, we used the land use and land cover maps that the Mexican government provides (Series I, published in 1973, and VI, published in 2016) to evaluate changes in the land cover where the endangered Mexican pines are distributed. The main idea was to highlight possible areas of concern by contrasting areas where vegetation is drastically changing against the distribution of pine trees. First, we homogenized land cover classes between epochs. Then, both layers were transformed to raster files and we performed a bi-temporal analysis using the land change modeler of the TerrSet ® Version 18.11 (Clark Labs, Clark University, Worcester, MA, USA). The difference between layers was measured directly from values of the pixel image. The expression of image differencing is as follows:
I d ( x , y ) = I 1 ( x , y ) I 2 ( x , y )
where I1 and I2 are layers from time t1 and t2 and (x, y) are coordinates and Id is the difference image. Pixels with no change are distributed around the mean, while pixels with change are distributed in the tails of the distribution curve. Since change can occur in both directions, it is therefore up to the analyst to decide which image to subtract from which [29]. All spatial analyses using vector files were carried out using the software Arc GIS ® Version 10.6 (ESRI, Redlands, CA, USA).

3. Results

3.1. Pine Species Distribution

Pinus culminicola, P. rzedowskii and P. maximartinezii presented minor presence observations, while P. jaliscana, P. pinceana, and P. nelsonii presented the most substantial presence observations. This is due to the number of localities where these species live. The observations of pine species had a description of the location, geographic coordinates, validation of the observation by a taxonomist and morphological description.
From the National Forest Inventory provided by the National Forestry Commission of Mexico, only observations of Pinus pinceana were reported. A total of 722 registers of the presence of endangered Mexican pines were used to define current distribution. Once the information was prepared, the natural distribution of Mexican pines was mapped out (Figure 2).

3.2. Spatial Distribution of Pines Species According to Logistic Regression

By using geographic information, we developed models that describe in spatial context the probability of the presence of each pine species evaluated. The next section describes the results for each species. We set a threshold of 75% (p > 0.75) as a way of representing the likelihood of presence for each pine.

3.2.1. Pinus culminicola

According to the results, the dwarf pine (P. culminicola) (Figure 3) is found in the east mountains of Saltillo city, and southeast of Monterrey City, as well as small areas in the southeast of Nuevo Leon state. The modeling suggests the mean precipitation of the coldest quarters (Bio19) as the most important environmental variable (Table 4). The area estimated as suitable for P. culminicola is about 421 km2.

3.2.2. Pinus jaliscana

Distribution of P. jaliscana was mainly driven by precipitation variables (Bio18, Bio12, Bio16) as can be seen in Table 5. The results showed that the area suitable for the development of the species was 5502 km2 and was well distributed in Jalisco state (Figure 4).

3.2.3. Pinus maximartinenzii

In the case of P. maximartinenzii, the environmental variables that were significant to the model were the mean precipitation in the warmer (Bio18) and colder (Bio19) quarters of the year (Table 6). The distribution is the western part of the state of Durango and the southwest of Zacatecas, which are dominated by pine forests (Figure 5). The potential suitable area is estimated at 18,355 km2.

3.2.4. Pinus nelsonii

This species (P. nelsonii) is well adapted to the topographic and weather conditions of the northeastern Mexican mountains, between the states of Nuevo Leon, San Luis Potosi, and Tamaulipas, where the main distribution occurs (Figure 6). The modeling procedure selected variables for both precipitation (Bio16, Bio17, Bio19) and topographic (aspect and slope) variables as they had significant contributions to modeling spatial distribution (Table 7). The estimated area was about 814 km2.

3.2.5. Pinus pinceana

This species has a wide distribution in the Sierra Madre Oriental of Mexico (30,745 km2), mainly in the states of Coahuila, Nuevo León, San Luis Potosí, Zacatecas, and part of Durango (Figure 7), as well as scattered areas of Hidalgo and Querétaro. Precipitation (Bio17), topography (aspect), and temperature (Bio6, Bio5, and Bio11) variables significantly determined the distribution of this species (Table 8).

3.2.6. Pinus rzedowskii

This species had a restricted distribution on the Pacific side of the Sierra Madre Occidental (2936 km2), in the state of Michoacán, and some areas to the north of Cerro Tancítaro (Figure 8). Topography (aspect), precipitation (Bio19), and temperature variables (Bio2) determined the distribution of this species (Table 9).

3.3. Validation of the Models

The beta coefficients, standard errors, z values, and p values are presented in Table 10. Additionally, the receiver operating characteristic curve (ROC) was used as a measure of fit (Figure 9).

3.4. Hotspots or Areas of Possible Concern for Conservation

The areas of biggest concern due to a change of vegetation were coniferous forest distributed in the state of Durango, Jalisco, and Michoacán within the mountain range known as “The Sierra Madre Occidental” (Figure 10). This land cover change would affect potential areas of distribution of P. pincena, P. maximartinenzi, P. jaliscana, and P. rzedowskii. Scrubland from the northeast of Mexico is also suffering land cover changes and possible impacts on P. culminicola and P. nelsonii populations and suitable areas of distribution.
During the period evaluated, coniferous forests and grasslands had the most significant loss regarding the area changing to a different vegetation type (Table 11, Figure 11). As was expected, agriculture, secondary vegetation, and urban areas increased due to the loss of forest area, grassland, and scrubland. Still, scrubland covers 42% of the total area evaluated (Table 11, Figure 11).

4. Discussion

The modeling of the ecological niche of the species is a useful tool for biological conservation [30] because it allows us to determine the situation and define conservation strategies, especially for threatened species. To advance the conservation of six endangered and endemic pine species from Mexico, in this paper we defined their natural distribution using historical observations and modeled the suitable areas of distribution based on their environmental requirements. We identified locations where the species are distributed naturally across the country but also the suitable areas that can serve as habitat for those species. Both distributions (natural and potential) let us detect differences, with strong implications for forest conservation. The estimated potential distribution areas varied according to the records of the species; P. rzedowskii and P. pinceana had the smallest and largest distribution areas, respectively. In a similar study [31], the smaller and largest distribution areas were for P. culminicola and P. pinceana, respectively; the differences may be due to the number of records, the method used, the number of interactions, and the different response variables.

4.1. Implications and Conservation Strategies

The modeled distribution of 
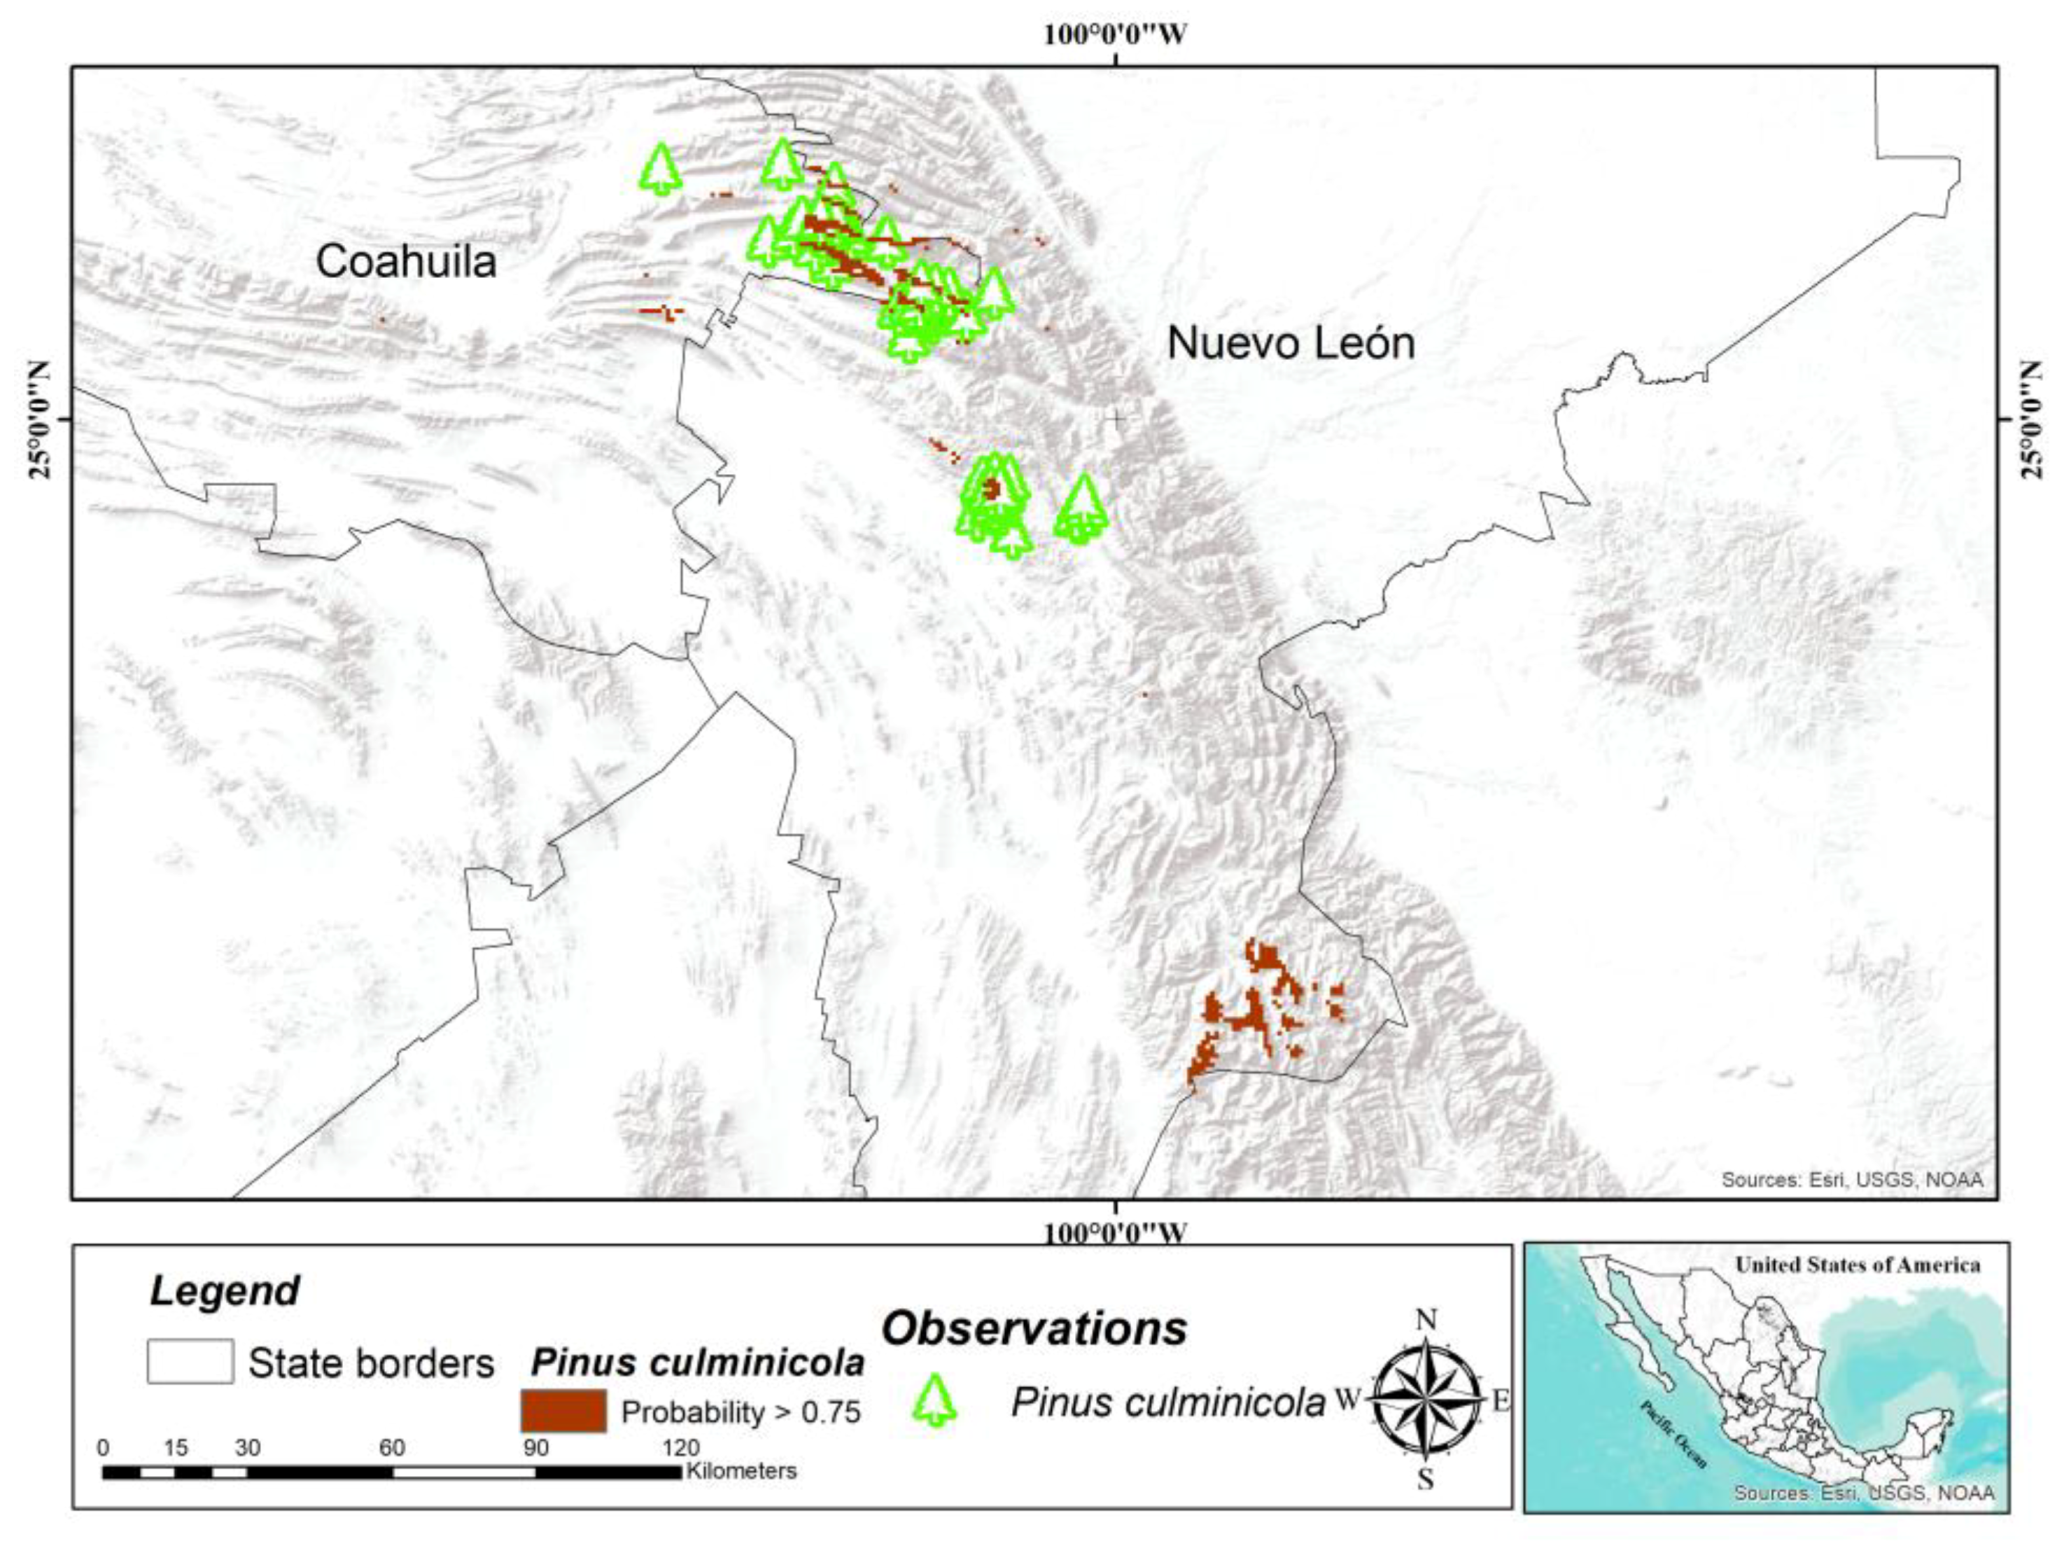
P. culminicola coincided with previous records at Cerro Potosí, Sierra La Viga, and Sierra La Marta in the states of Coahuila and Nuevo León [32,33]. The estimated potential distribution areas reaffirm the restricted distribution of this species, which is strongly determined by precipitation in the coldest quarter (Bio19); however, it has been found that the minimum temperature of the coldest month, precipitation in the wettest quarter, and total precipitation also determine the distribution of this species [33]. Even with the protection of Mexican and international laws, the populations of this species are affected by land use change, road construction, cattle grazing, and forest wildfires [10], causing the population of this species to undergo drastic reductions. For example, in the Cerro Potosí from 1960 to 1970 the population decreased 66% [34]. According to some reports [33,35,36], P. culminicola covers between 10 and 20 km2; however, the potential area determined in this study is higher (421 km2), which suggests that there are large areas with adequate conditions for ex situ conservation of this species. Therefore, the specific in situ conservation activities for P. culminicola should be aimed at reducing the effect of fire and livestock, since no seedling of this species survived the grazing and trampling of cattle after four years [10].
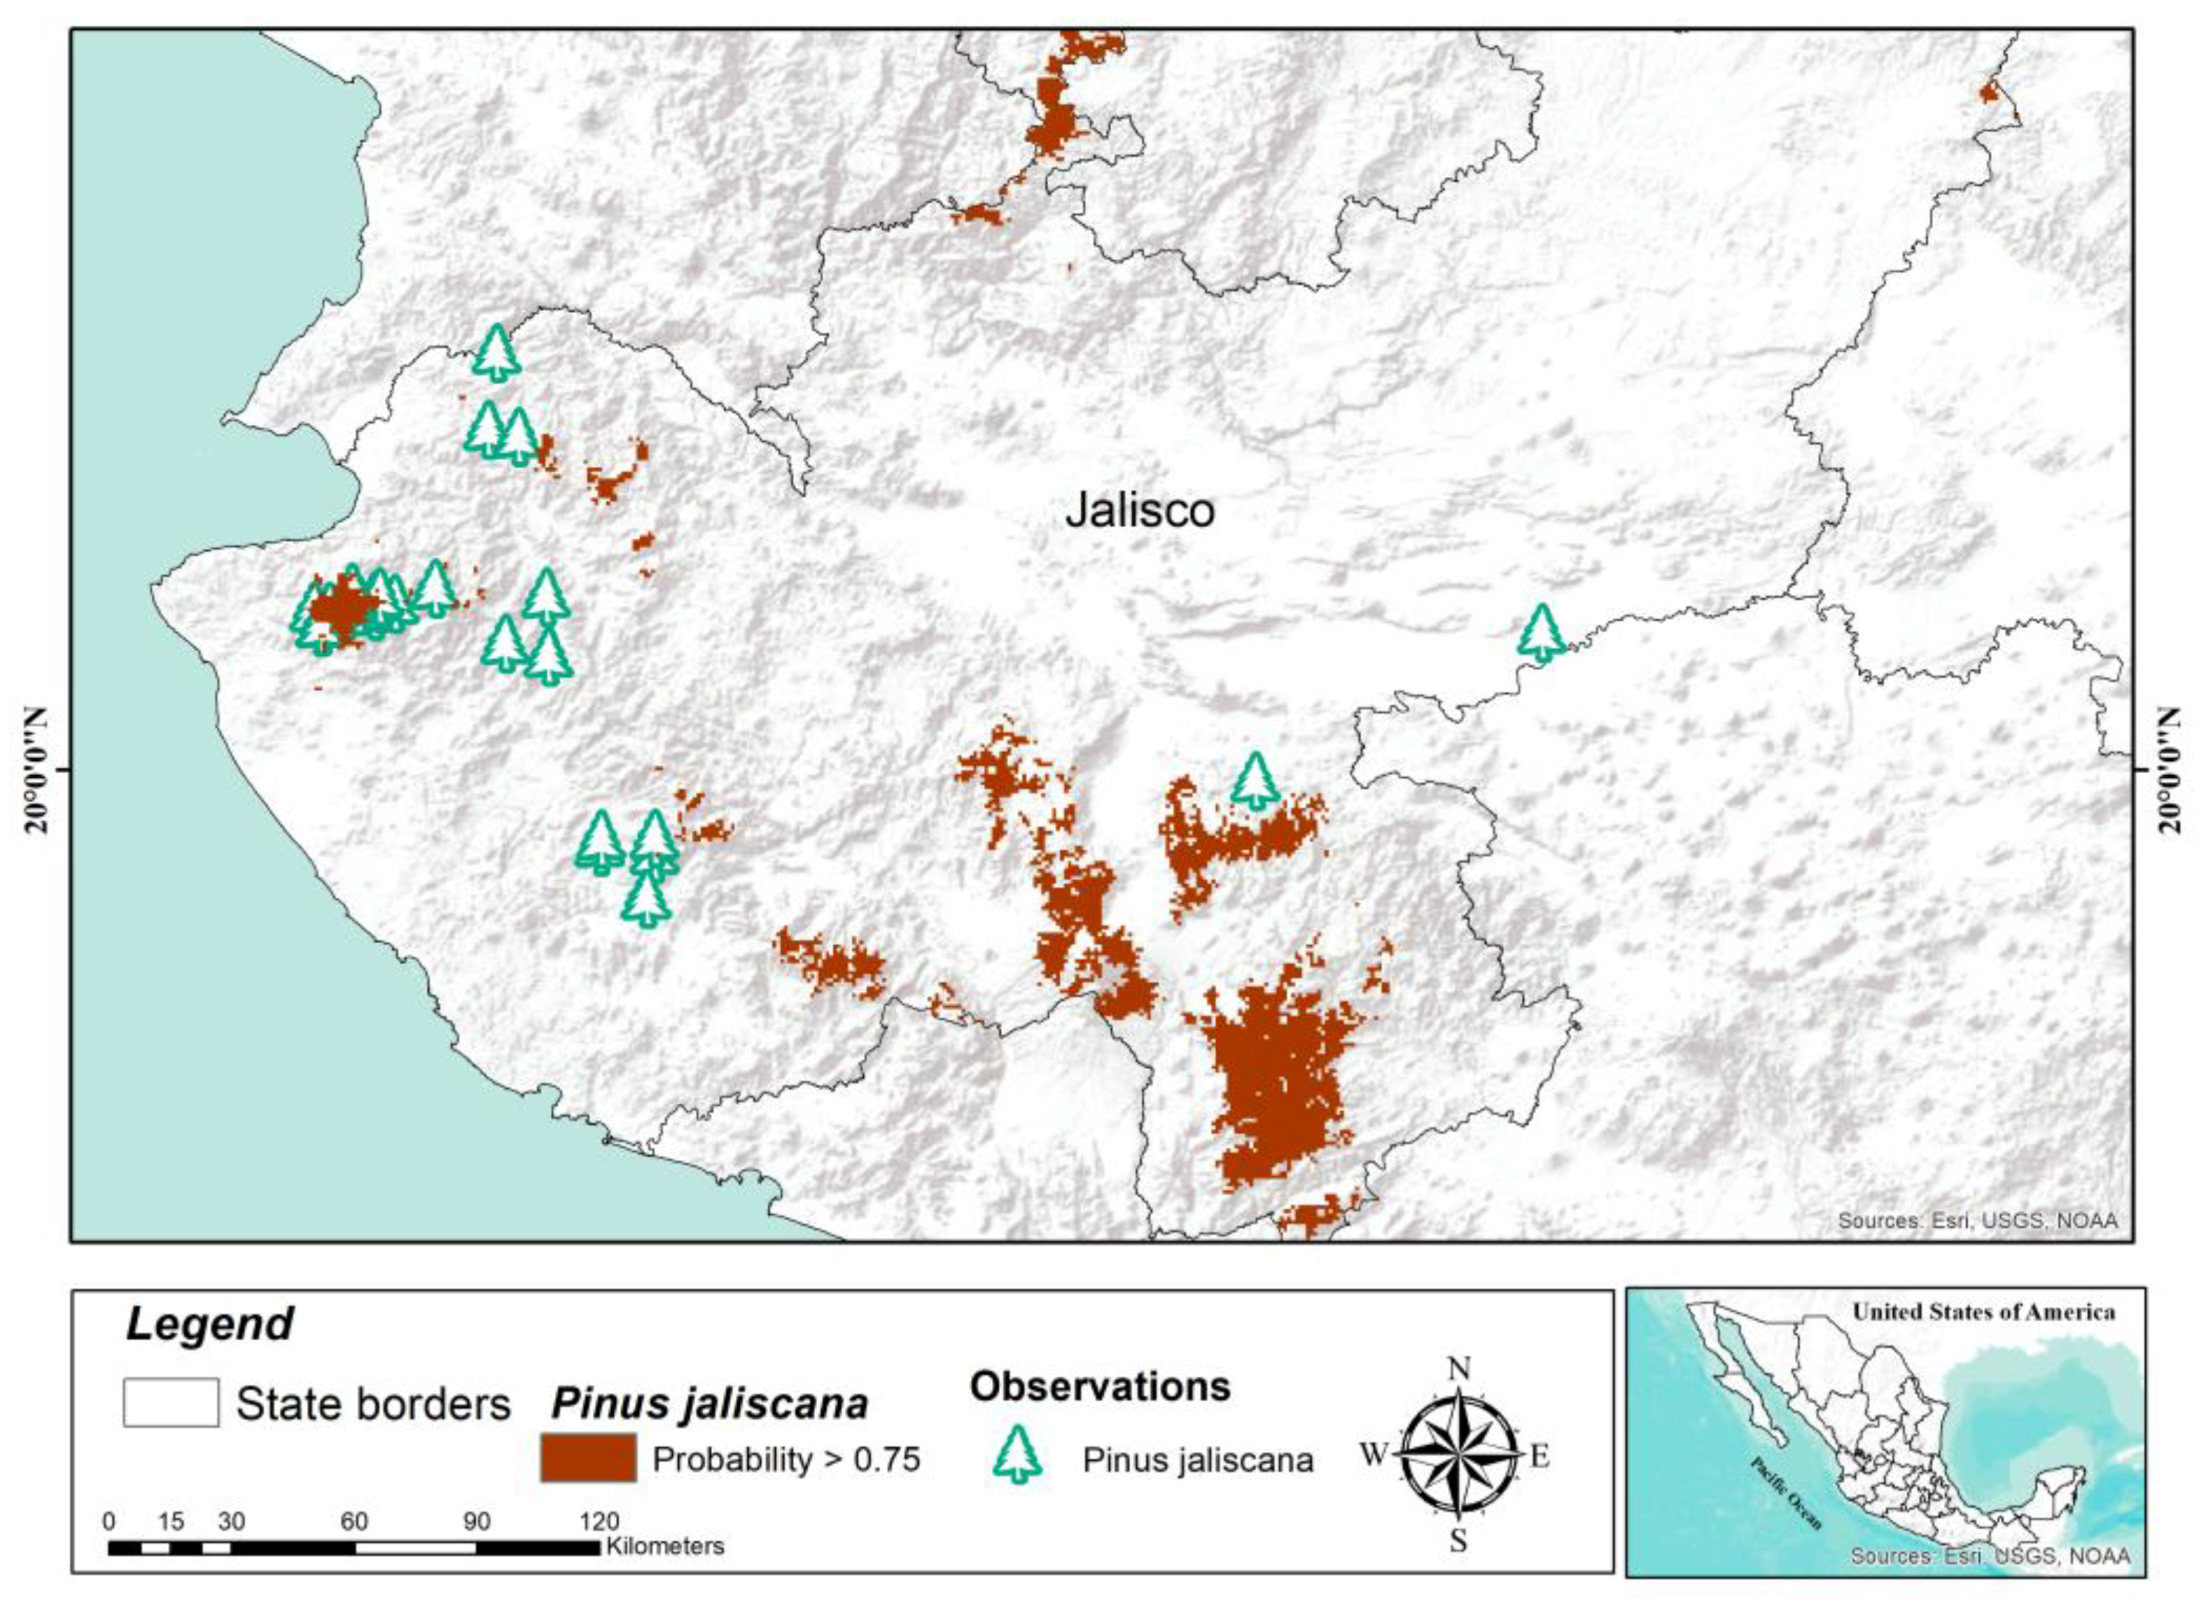
Pinus jaliscana is distributed in nine populations in the west of the state of Jalisco [37,38]. Agricultural activities, livestock, and wildfires put natural regeneration at risk in some populations [38]. It is estimated that this species covers more than 4185 ha [37], which is lower than what was estimated in this study (5502 km2). The above suggests a vast area with potential for ex situ conservation of this species, including areas of the north of the state of Jalisco where there are no reports of P. jaliscana. On the other hand, the seed efficiency rate is 4% [38], which indicates reproductive problems associated with self-fertilization due to the isolation and small size of the populations. Therefore, in situ conservation activities for this species should be oriented towards increasing the genetic variability of the populations to avoid inbreeding problems.
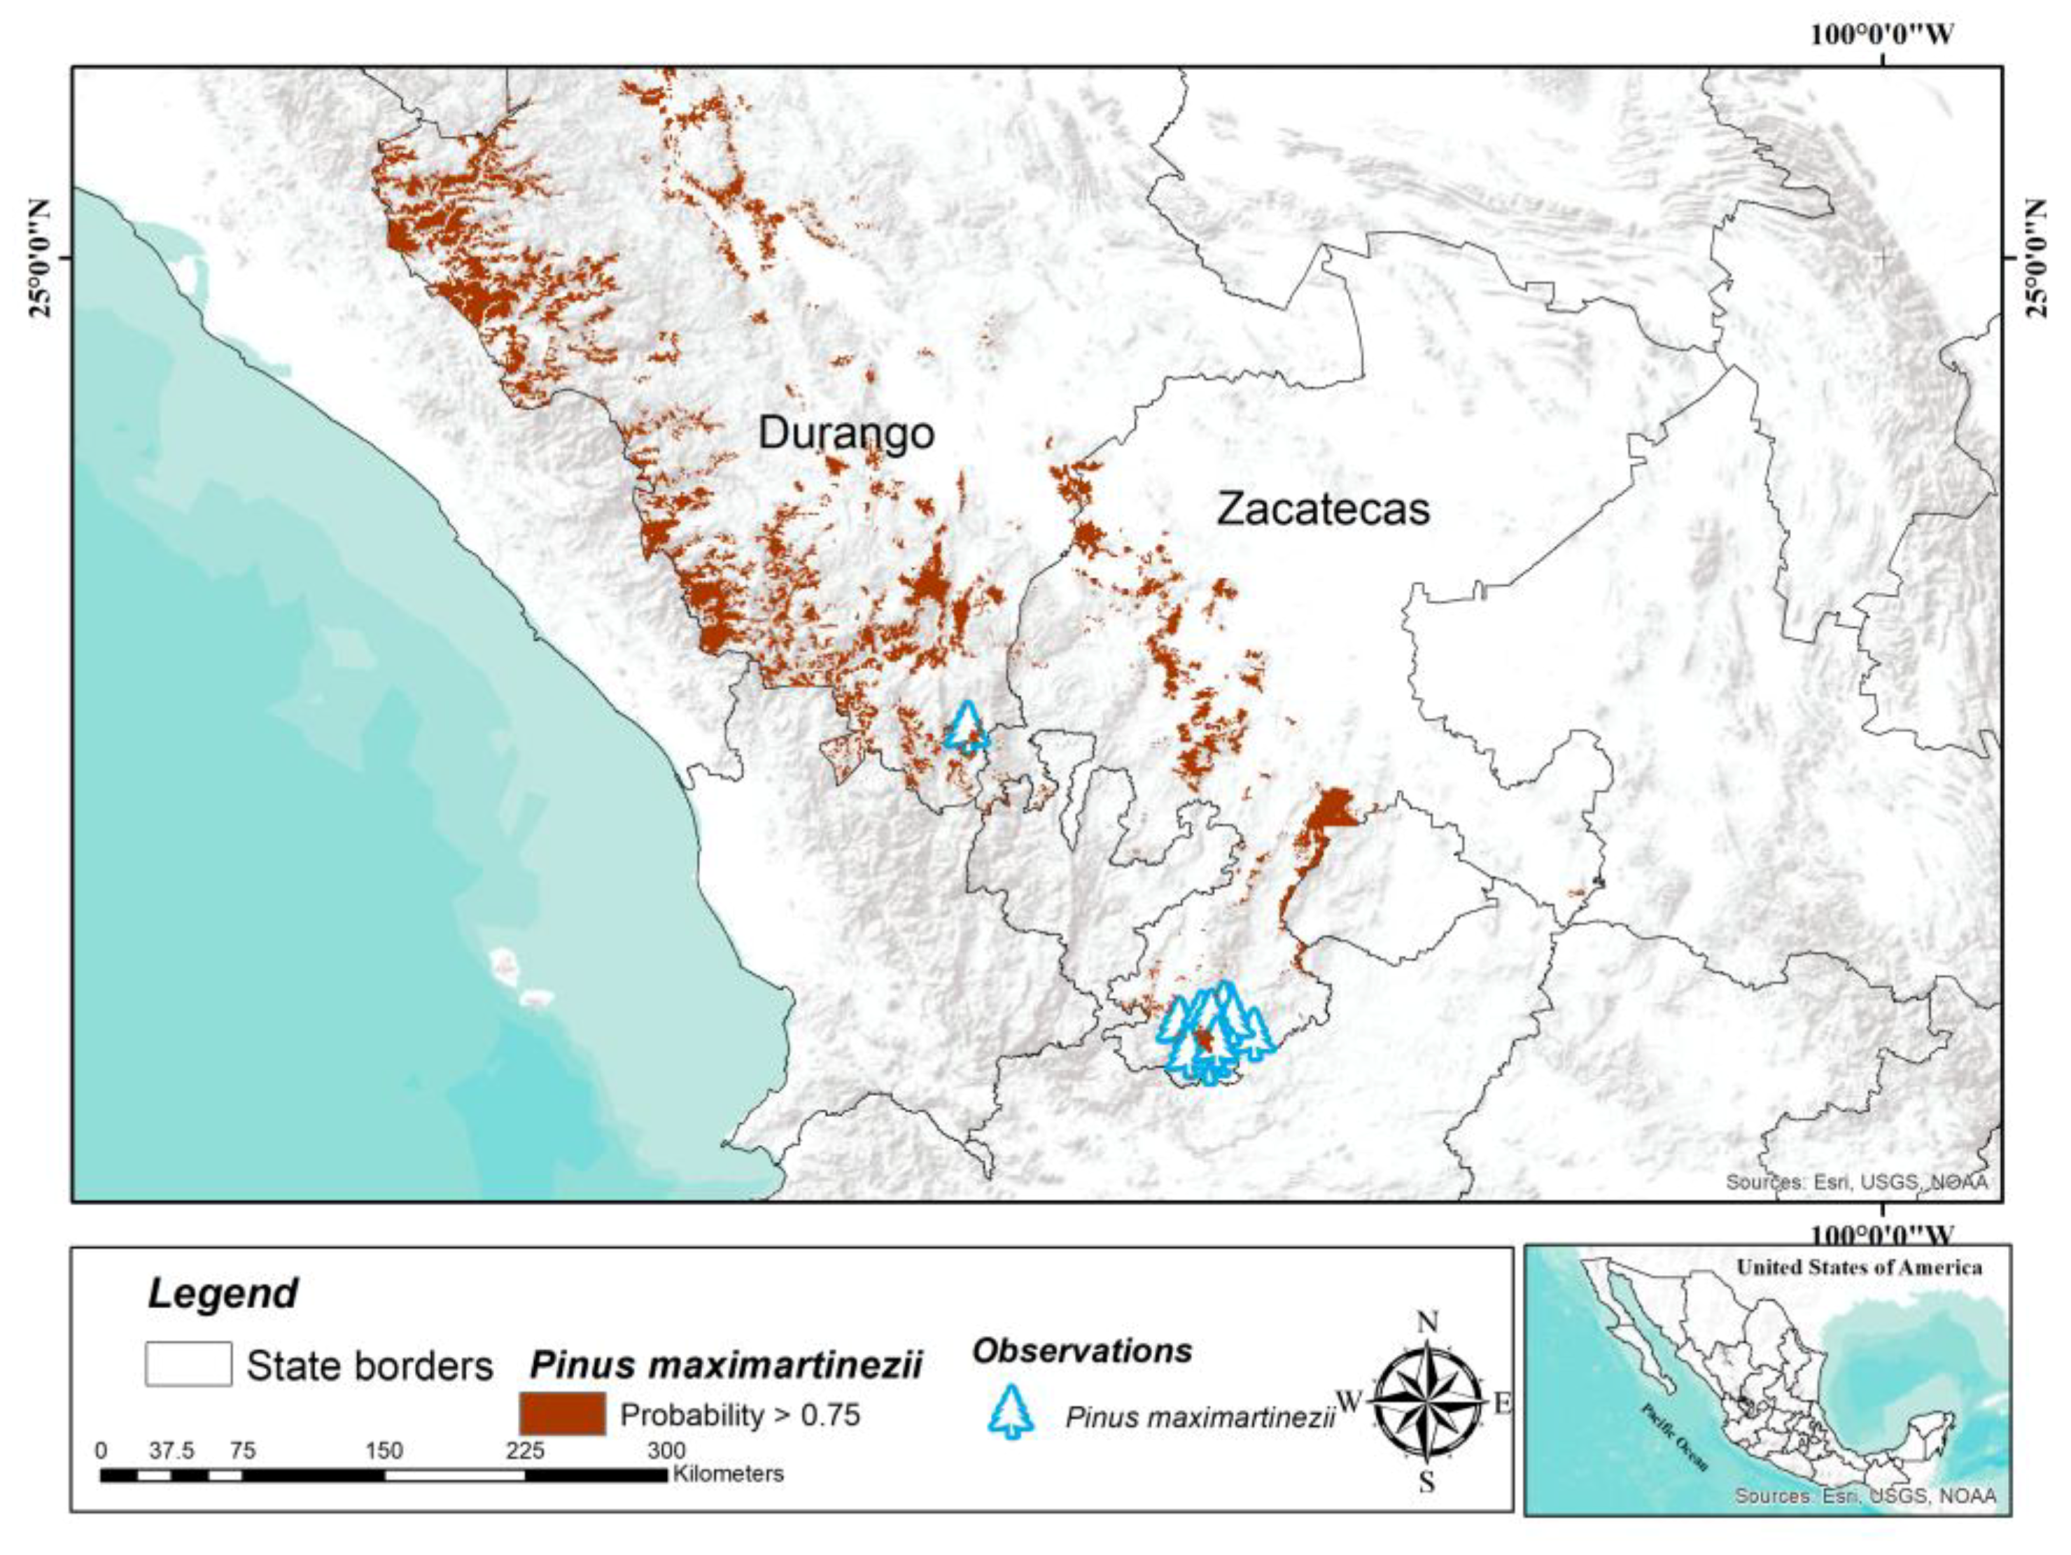
Pinus maximartinezii has only two natural populations, one in the southern state of Zacatecas and another in southern Durango [39]. The population located in the state of Durango has an area of 110 ha, while the population of southern Zacatecas can have up to 925 ha [39]; however, the potential distribution area determined in this study is considerably larger (18,355 km2) and extends north of its distribution, on the Sierra Madre Oriental, in the state of Durango and Zacatecas. Our results suggest the possible existence of other populations that have not yet been located, but also large areas with conditions suitable to establish plantations for ex situ conservation strategies. The seeds of this species are larger and more nutritious than other pine species [40], so they are used as food; however, even with the use of seeds, the population growth rate of the southern Zacatecas population is 1117, which suggests that the use of seeds does not put this population at risk [41]. Still, the population of southern Zacatecas has a low percentage of polymorphic loci (30.3%) and only two alleles per polymorphic locus, suggesting a bottleneck effect less than 100 years ago [42]. The in situ conservation activities for this species should be oriented towards favoring the survival of young and adult individuals during the first reproductive events, protecting the habitat of the species [41], and increasing genetic diversity through the exchange of genetic material of both populations.
Pinus nelsonii is endemic and restricted in distribution to the Sierra Madre Oriental, in the states of Tamaulipas, San Luis Potosí, Nuevo Leon, and Coahuila [43,44]. Due to the decline in its populations, it is categorized as an endangered species by NOM-059-SEMARNAT-2010 (SEMARNAT 2010) and IUCN [45]. Although, among the pines of the Sierra Madre Oriental, P. nelsonii is the second most important species [12], there is little information on the number and size of its populations. It is estimated that it covers only 84 km2 [45], smaller than the potential distribution area (814 km2) defined in this study, but partially coinciding with the current distribution; if we know the zones we can carry out ex situ conservation programs such as protection plantations. The natural populations of this species are severely affected by pests and forest fires. For example, in a population of Tamaulipas, 98% of the plants were affected by the pinyon pitch nodule moth (Retinia arizonensis) [44], and 30% of the area was affected by droughts, which reduced their rate of population growth (from 1.083 to 0.990) in a single year [12]. On the other hand, the variation and genetic differentiation of several populations of this species are low to moderate [43]. Therefore, the in situ conservation activities of P. nelsonii should be oriented to avoid forest fires to favor natural regeneration, monitoring and control of sanitation, as well as increasing the genetic diversity of the populations.
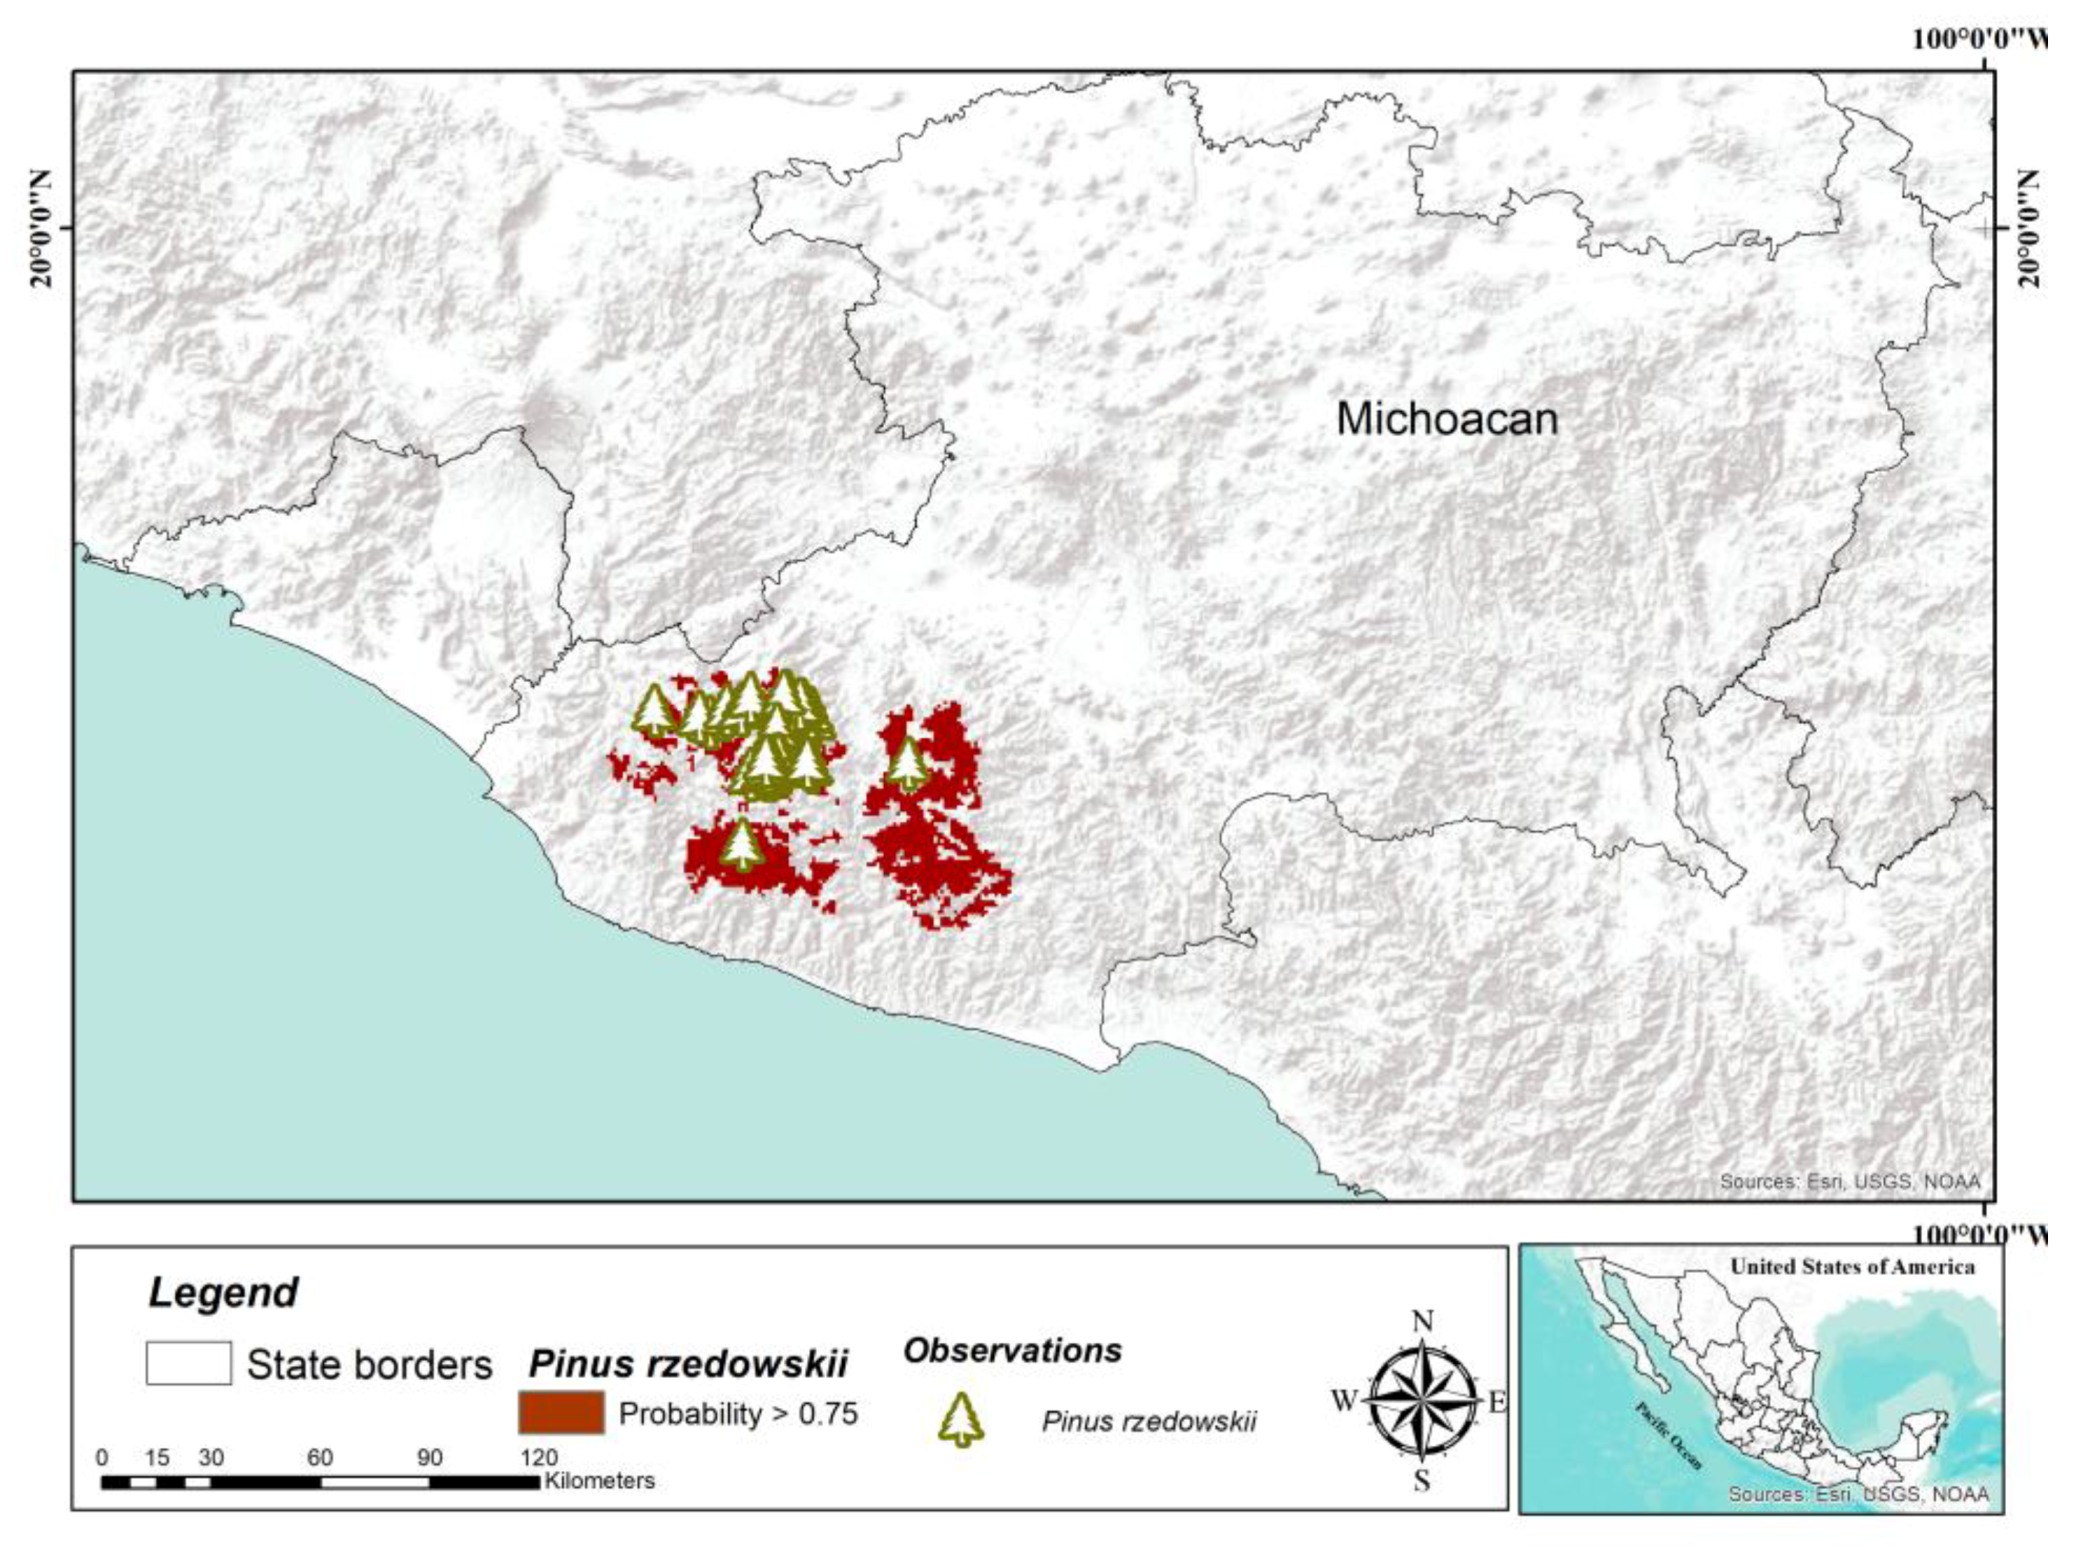
Among the species studied in this work, P. rzedowskii has a more restricted distribution; it is only distributed in the state of Michoacán [5]. Only one population with 12 localities is recognized, which in total hold approximately 6500 individuals [46]. Although the genetic structure is marked, and the genetic diversity is moderate to high [46,47], because the populations are tiny, the risk of extinction due to significant forest fires is high [48]. Therefore, in situ conservation activities for this species should be oriented towards forest fire prevention measures, as well as avoiding activities related to agriculture and grazing. Of the six species studied, P. rzedowskii has a big potential area of modeled distribution (2936 km2), which can be explained by its restricted distribution; this area is enough to establish plantations for ex situ conservation.
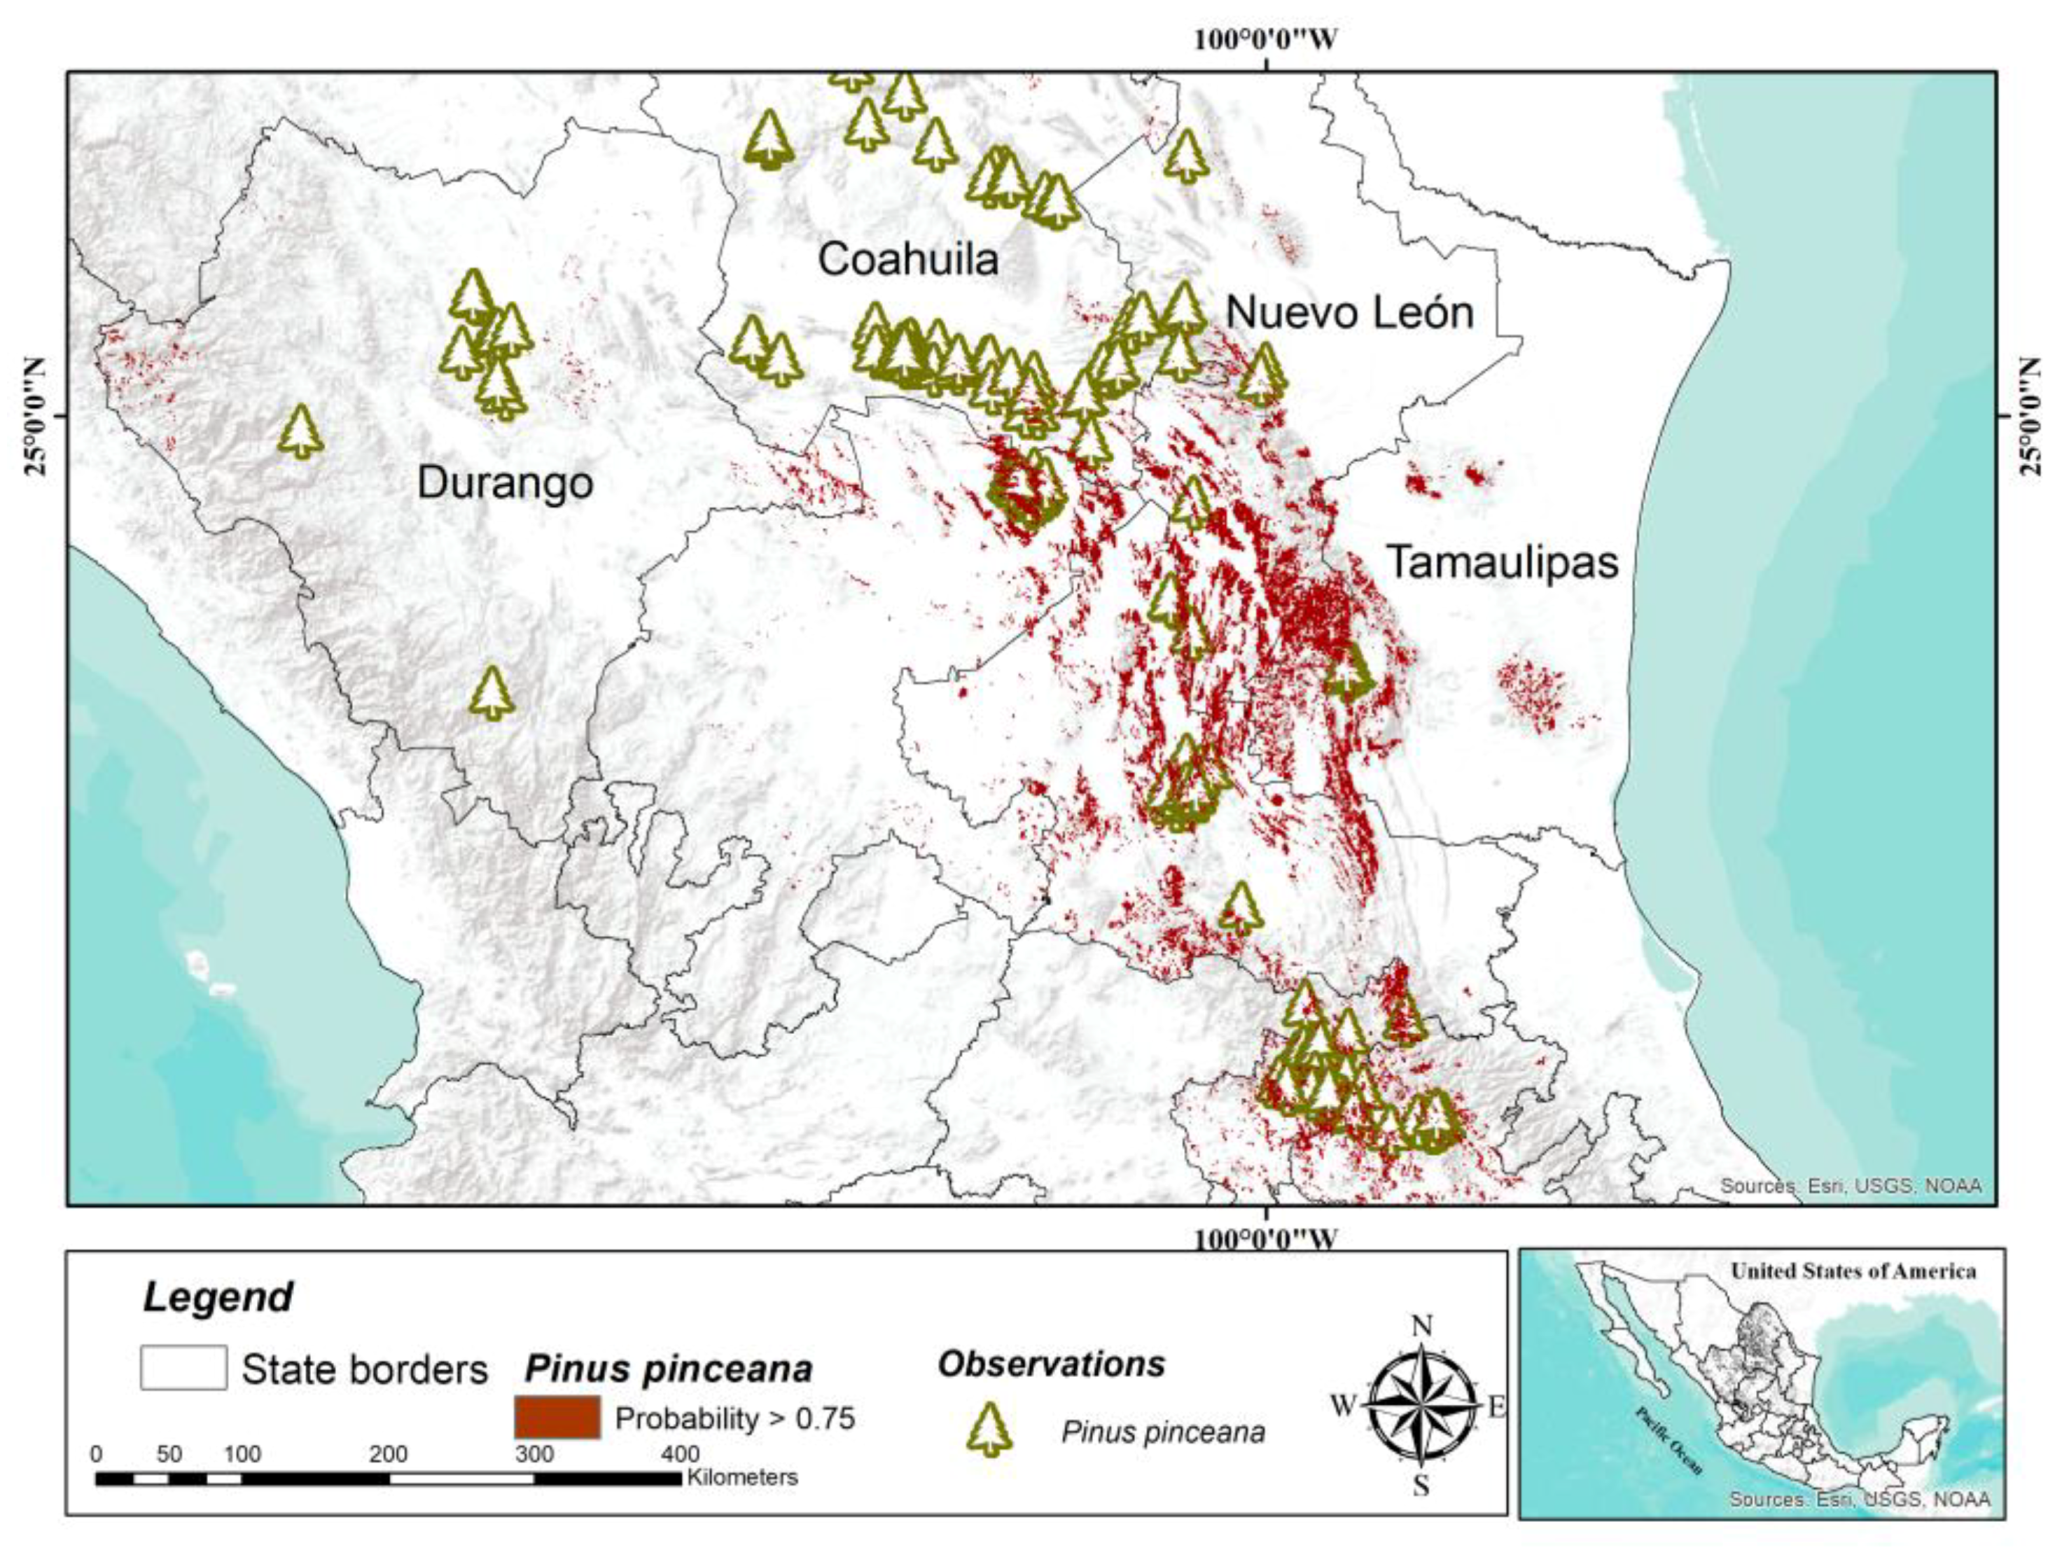
Among the species studied, P. pinceana has the widest distribution; its distribution extends 750 km along the Sierra Madre Oriental [49] in the states of Hidalgo, Querétaro, San Luis Potosí, Zacatecas, and Coahuila [50,51]. Despite its wide distribution, its populations are fragmented; there is low natural regeneration and potential threats due to the collection of firewood and seeds, but there are no signs of significant recent or current decline, which is why IUCN considers it to be of less concern [49]. Also, the differentiation and genetic diversity of the populations are high [11]. Within the natural distribution of P. pinceana, according to the composition and coefficient of floristic similarity, they differ among three sets of communities [50], which coincides partially with genetic isolation between populations from the north, center, and south [11]. The exact area covered by this species is unknown, but it is estimated at 2000 km2 [49], which is lower than the potential area modeled in the present study (30,745 km2). On the other hand, the northeast of Mexico presents conditions of high aptitude for this species, with 10,268 km2 suitable for the distribution of the species [52]. These results suggest a large potential area for the establishment of conservation plantations of this species as an ex situ conservation strategy.
For target species, there are seed dispersal limitations due to low tree density, wildfires, grazing, small animals, and extreme climatic conditions: e.g., P. culminicola seedlings were not detected in Cerro El Potosí for four years due to them being consumed by rodents [10], and the survival of the species was strongly affected by low temperatures, strong winds, scarce rainfall, low relative humidity, little soil depth, and loss of edaphic material [53]. Seedlings of P. maximartinezi have growth problems in natural stands because of soil degradation due to grazing, fires, agricultural activities, and desiccation [41]. P. nelsonii populations have fewer than 10,000 mature trees and face two main problems: increased cattle and incidence of destructive fires [54], both of which reduce seed germination and seedling growth.
In Mexico, the primary strategy of in situ conservation is the establishment of Protected Natural Areas (ANPs). In this sense, the studied species can be conserved in the existing ANPs, and, in the case of P. pinceana, P. culminicola, and P. nelsonii, also in proposed ANPs [55]. In the present study, although the percentage of the potential distribution area corresponding to ANPs was not determined, between 1.4% (P. rzedowskii) and 17.0% (P. maximartinezii) of this surface could encompass ANPs [31]. However, the network of ANPs in Mexico does not adequately protect the Pinus species [31], so the in situ conservation activities discussed for each species are necessary, as is the primary strategy of in situ conservation. Special attention should be given to strategies related to the use of seeds for human consumption; the establishment of Management Units for the Conservation of Wildlife (UMAs) could be proposed as an option because the owners can make sustainable use of the habitat, and at the same time work towards the conservation of the species [56]. Although in situ conservation is essential to renew genetic diversity and face future environmental changes, ex situ conservation is operationally convenient for short-term results [57]. It is suggested that the main ex situ conservation strategy should be the establishment of conservation plantations in the areas determined in this study.
The establishment of conservation plantations exclusively in the areas determined for each species should enhance the success and adaptation of the plantations. Also, ex situ conservation strategies should include the collection, storage, and conservation of germplasm in botanical gardens, germplasm banks, and plant tissue culture laboratories in Mexico [58]. Due to the genetic problems that several of these species present, the germplasm collection for ex situ conservation must be carried out in all the localities or populations of each species. Although Mexico has made significant progress in regulating the use of plant species [56], legislation must be revised and adapted to favor in situ and ex situ conservation activities with the species studied in this work, as well as others that are at risk.

4.2. Final Considerations

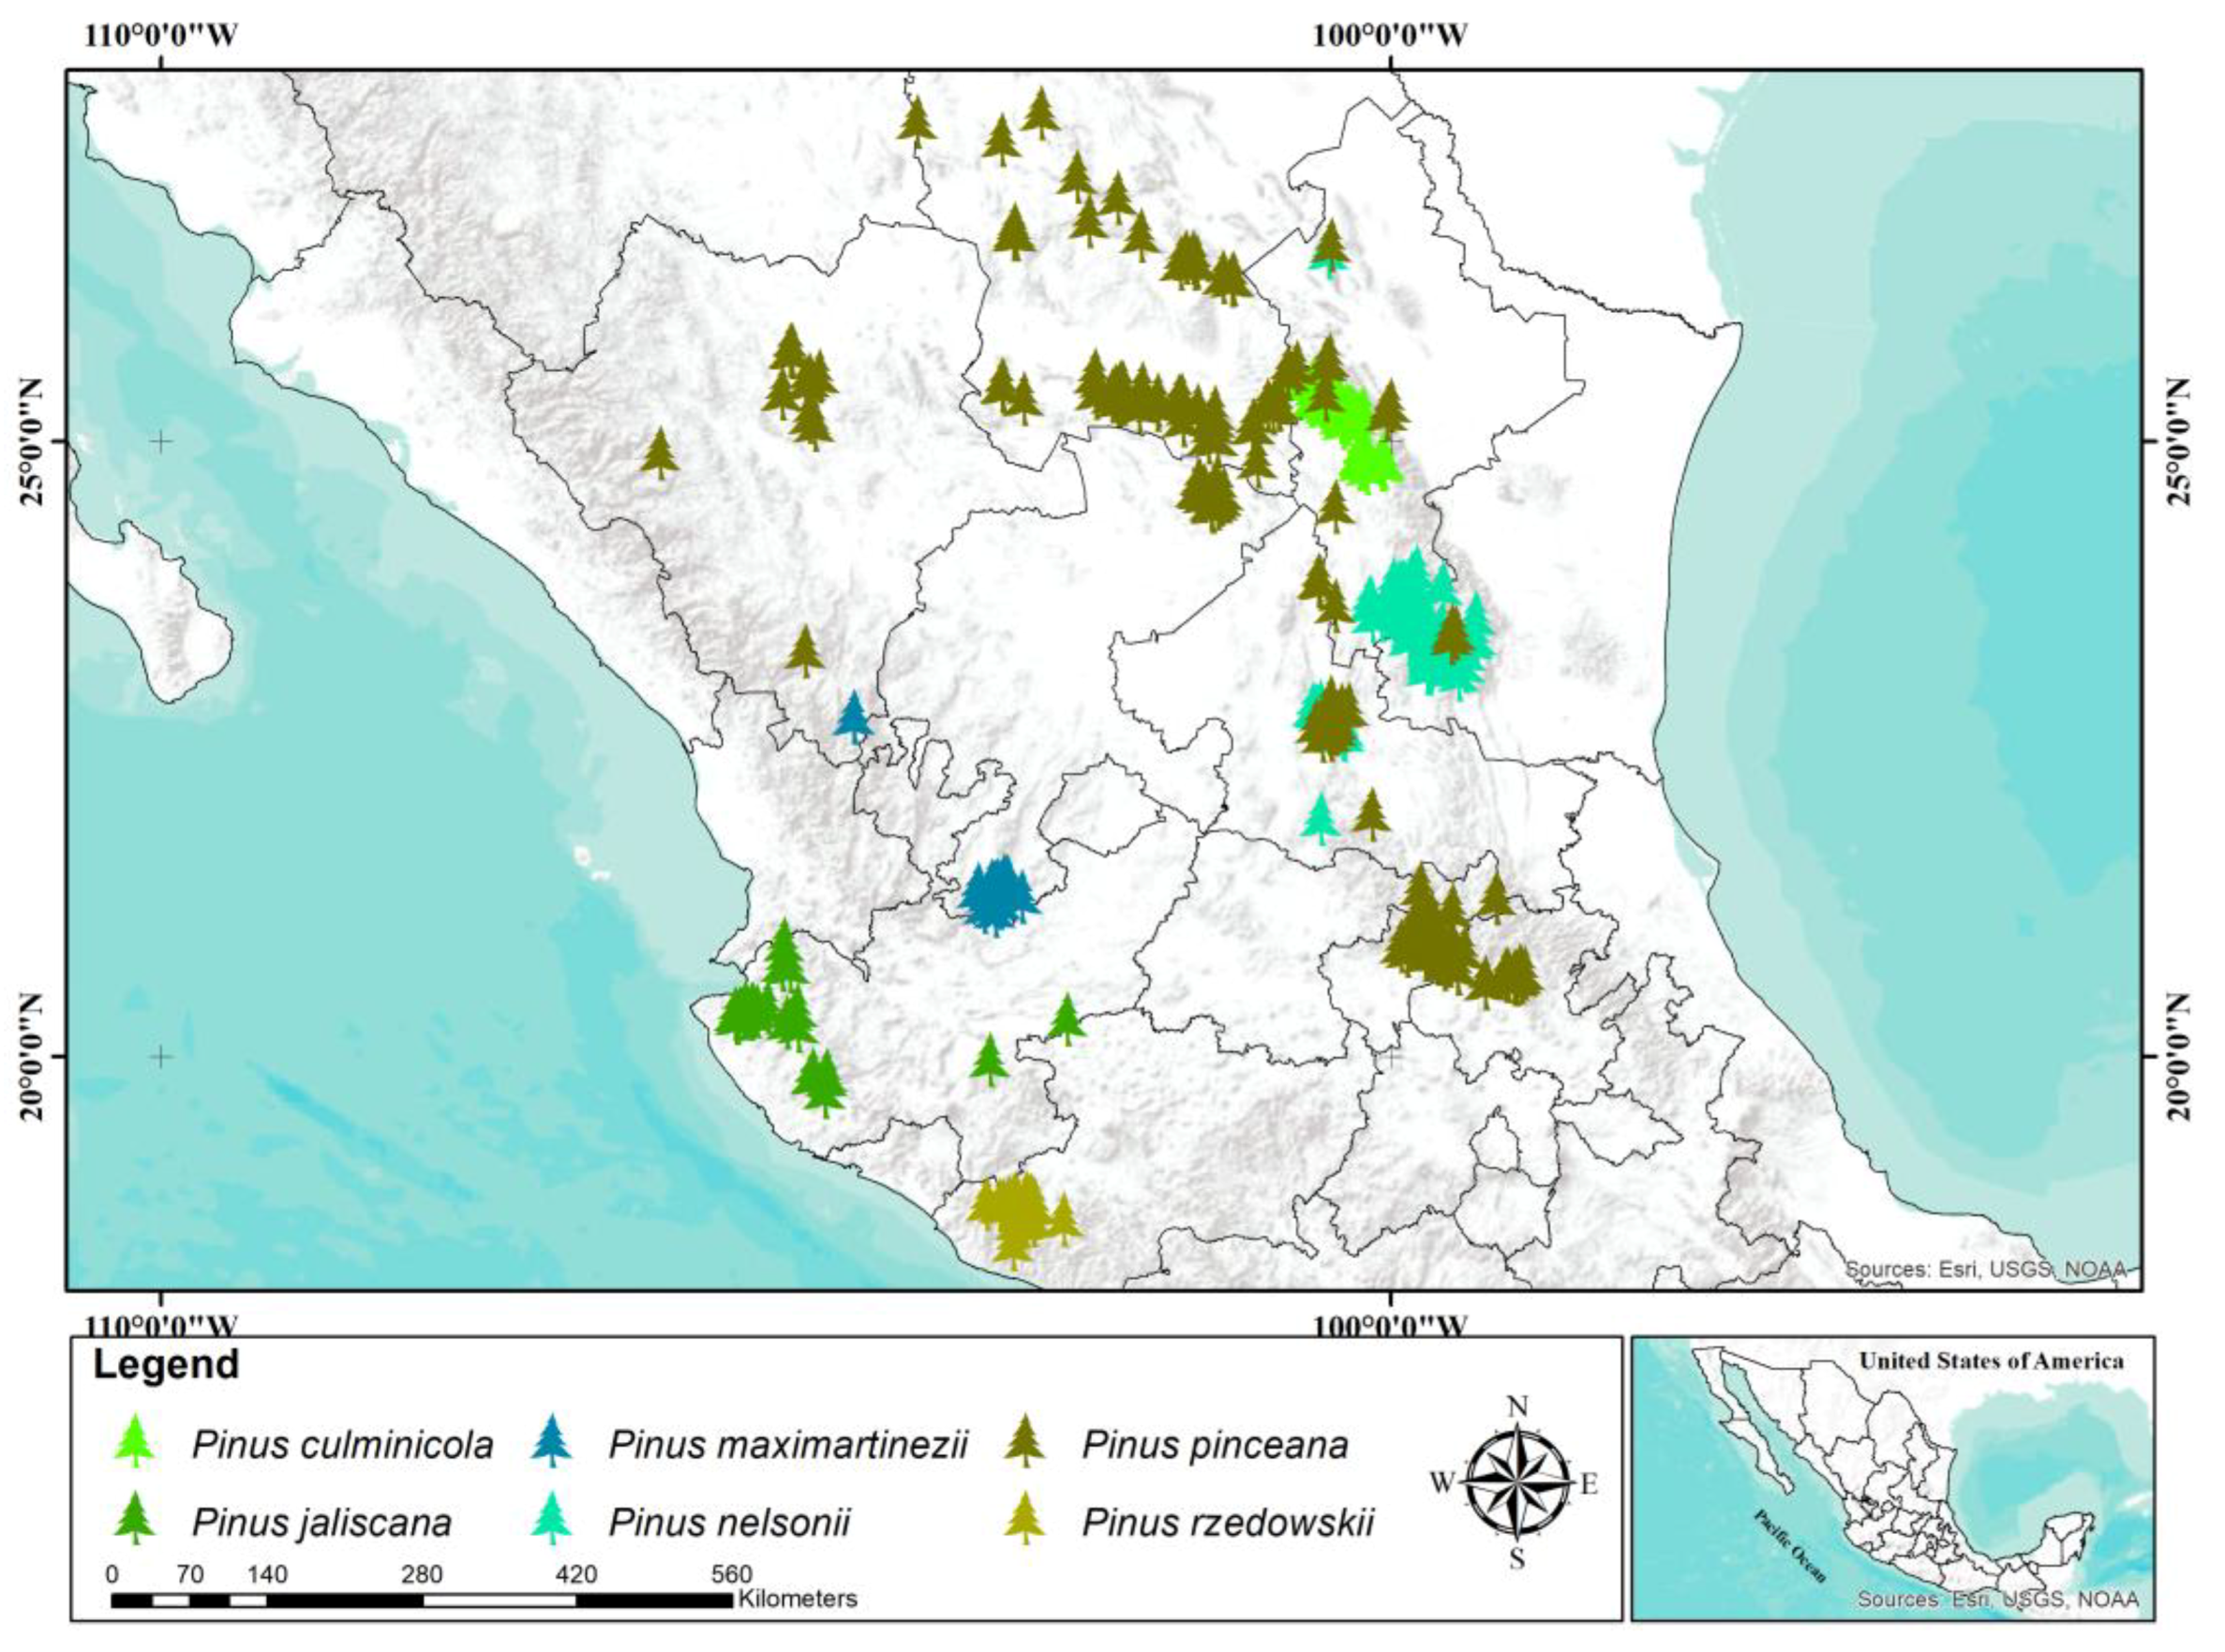
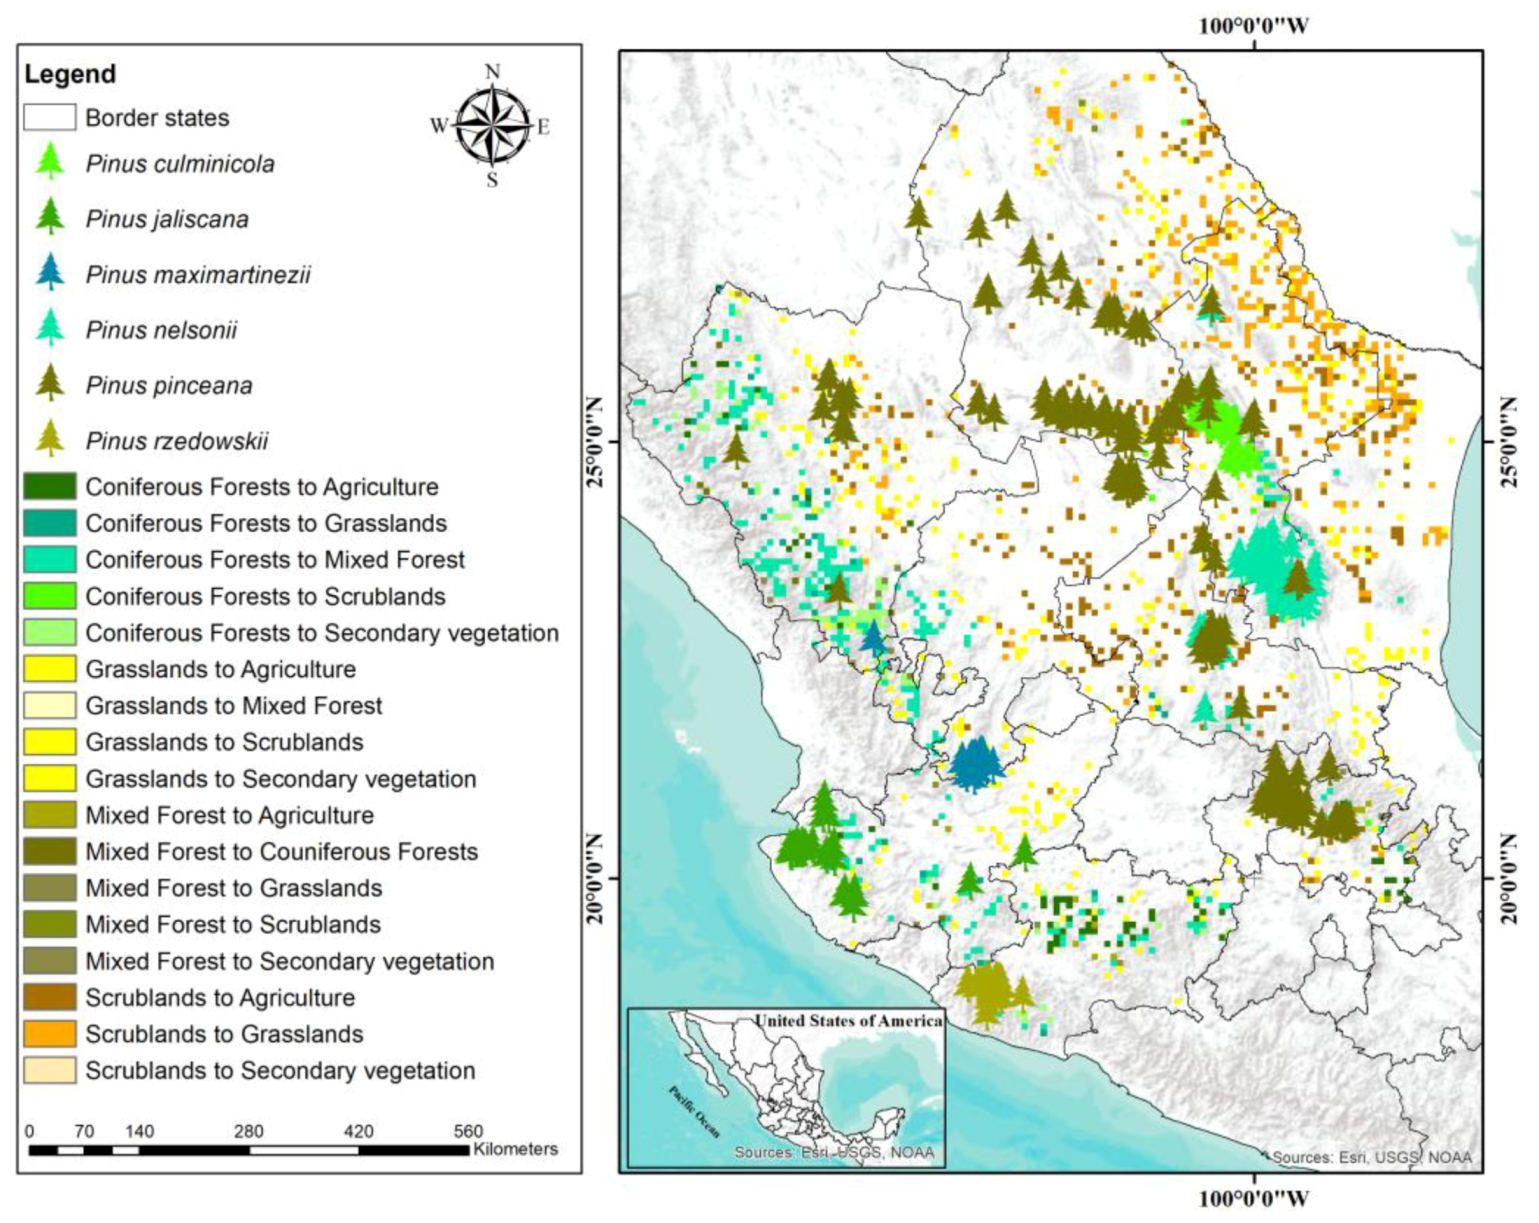
In this study, the primary potential distribution of the target species was located within the temperate coniferous forest from the central part of Mexico (part of the “Sierra Madre Occidental” and “Sierra Madre Oriental” systems), but also within other vegetation communities such as mixed forests and scrubland. Our results are in agreement with some previous reports on the distribution of endangered Mexican pines [5,31,33,39,44]. It is important to highlight that the spatial distribution and number of observations collected and retrieved from the diverse databases were an essential factor in the performance of all models and the ability to predict the potential spatial distribution of Mexican pines accurately.
Although it was not part of this study, it would be worth performing an analysis by region including other crucial variables such as distance to roads or population density, as they are considered factors in the vulnerability of Mexican forests [59]. It is also important to highlight that land cover change is affecting potential suitable areas of distribution of the species. Forest net loss was about 25%. It is imperative to consider land use change and land cover dynamics to promote conservation strategies for each species. The Mexican territory suffers fragmentation, disturbances, and some degradation processes [59,60,61], causing changes in the structure, function, composition, productivity, and extent of forests that may contribute to the diminishing of forest species [62,63].
In this paper we used spatial modeling and niche ecological models combined with other analytical tools (e.g., GIS) to evaluate non-inventoried sites as well as model the distribution of species [14]. The selection of methods used accomplished a double function: first, to provide knowledge about the potential distribution of the species and use said predictions in the choice of sites of particular interest as biological conservation zones [19,20]. Although species distribution models (e.g., MaxEnt algorithm) can fit with limited presence-only data [64], logistic regression was considered a better option as it allows better control of modeling compared to MaxEnt [16,65]. Still some issues need to be considered before selecting the appropriate modeling method: the clarification of the niche concept, sampled data, parametrization strategies, model selection and predictor contribution, and evaluation strategies [66].
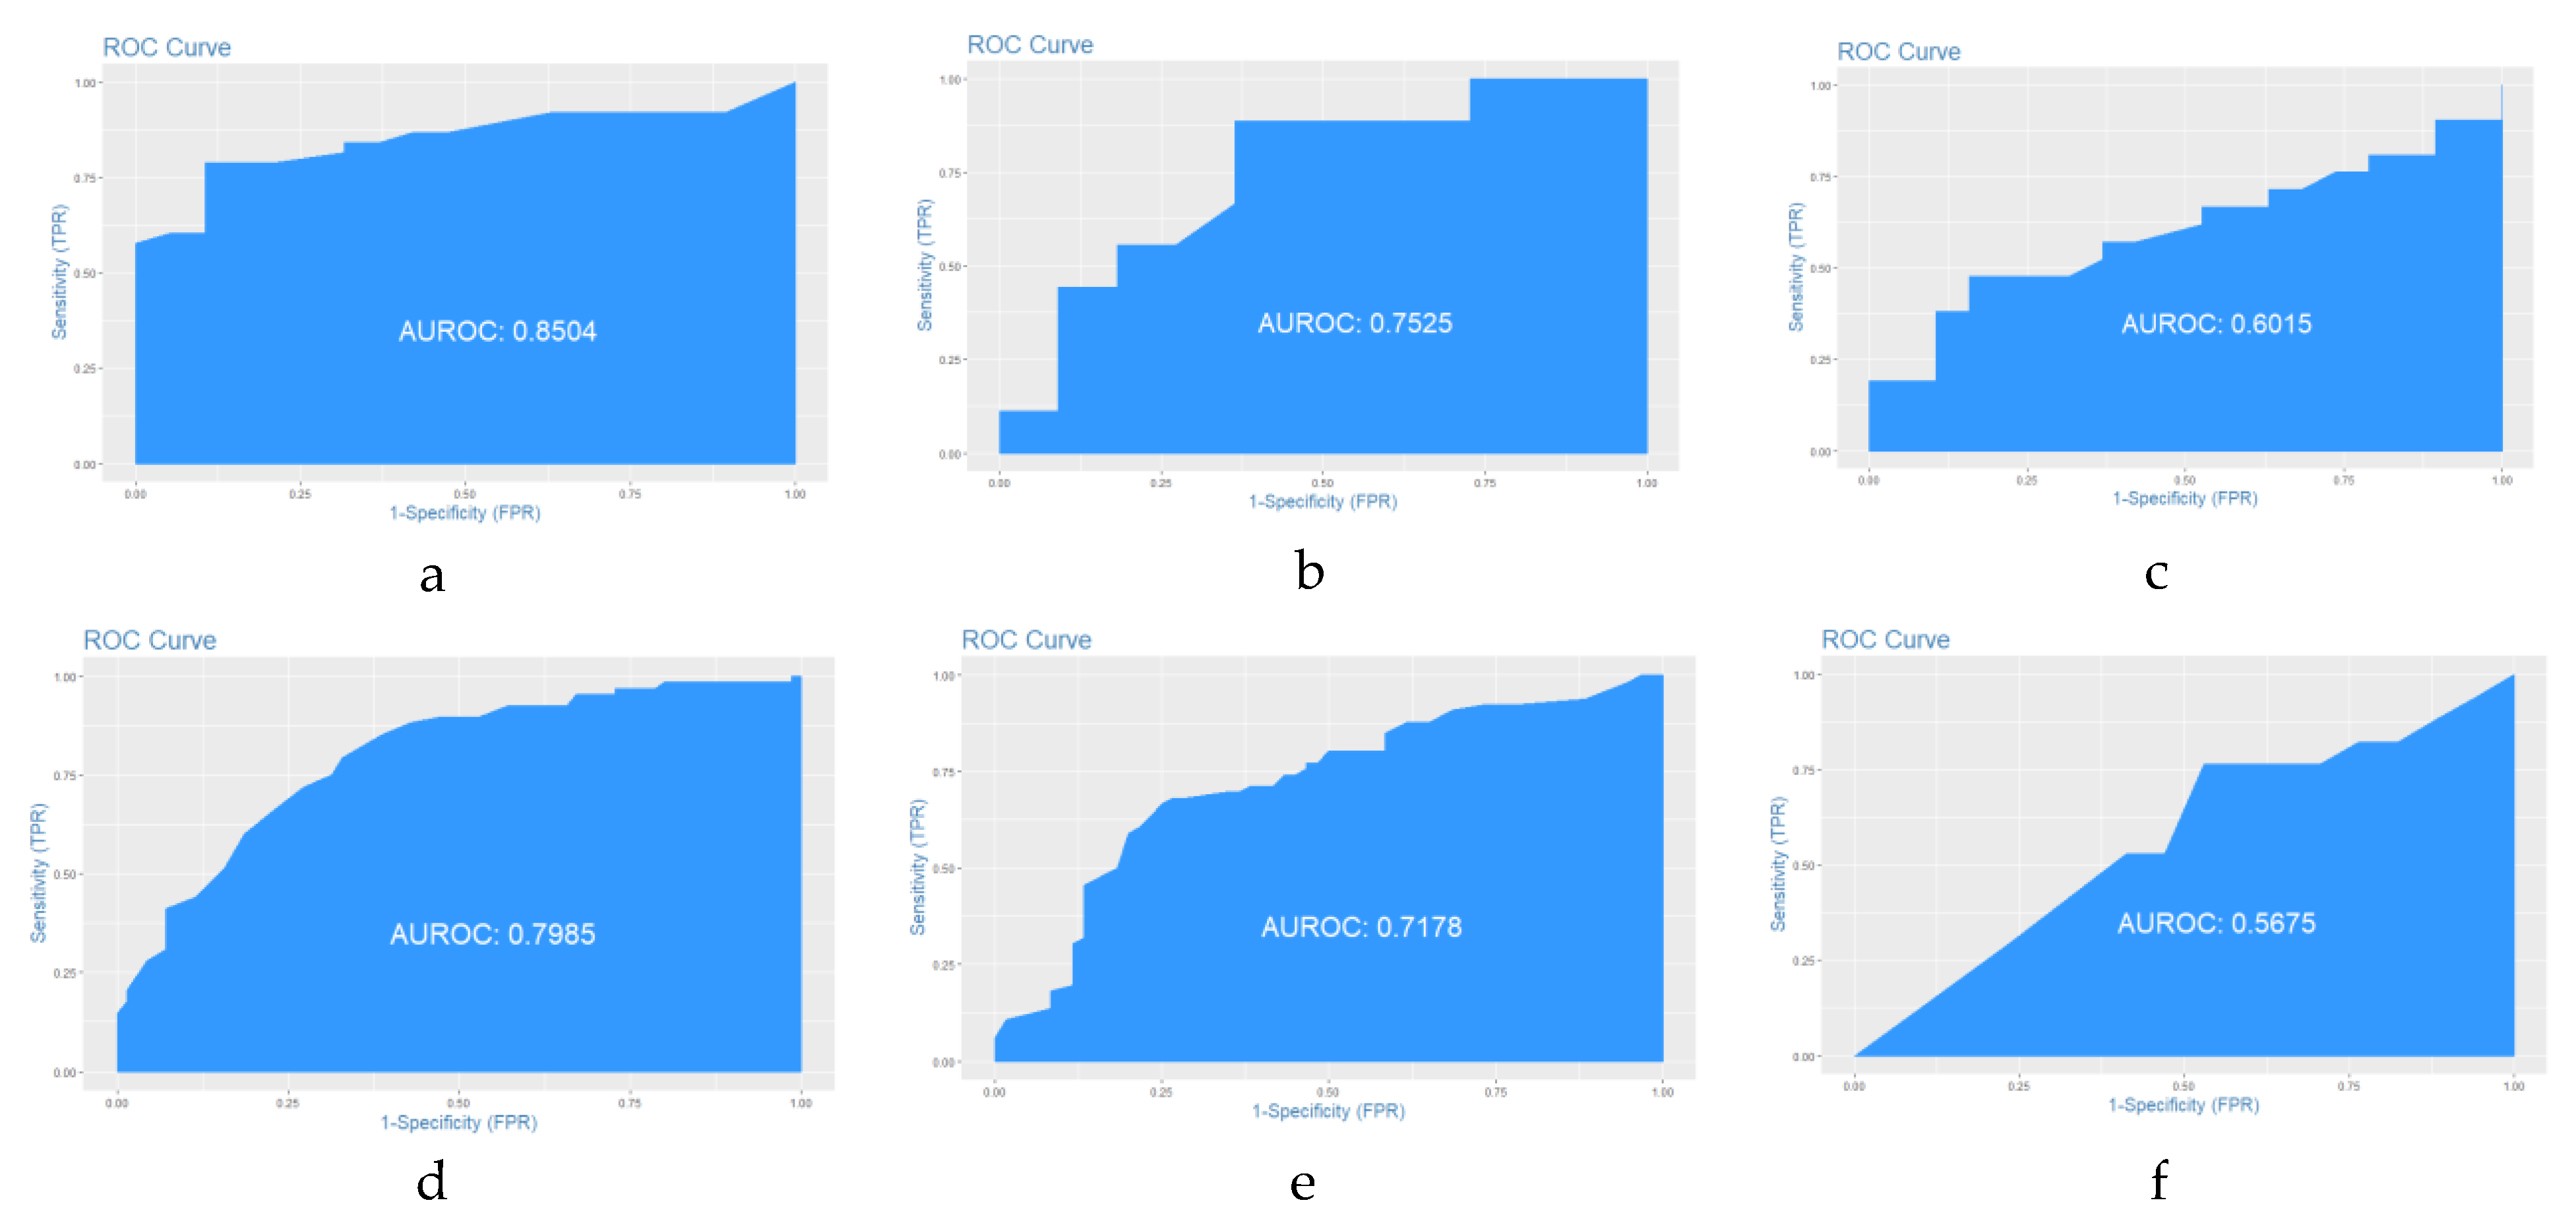
Our approach, as we stated before, took advantage of freely available data and, although there was quality control during the modeling, we may have carried over some errors from the data collection, identification of the species, and registration of the geographic data. Still, our results showed good agreement with the performance of all models according to the validation process. As far as we know, there is no maximum number of observations suitable for spatial modeling; however, species distributions models (SDMs) provide the most useful performance using a minimum of 14 to 25 observations for narrow-ranged and widespread species, respectively [67]. In this study, we had a variety in the number of observations from the field, and assumed that the spatial distribution and number for each pine species were important to the performance of each of the models developed in this study. Our results corroborated the importance and usefulness of diagnosis data for occurrence prediction and their contribution to a better understanding of a species’ reaction to climatic variables [68].
Finally, we would like to highlight, as future research endeavors, the inclusion of the effects of disturbances, landscape fragmentation and land use dynamics, and climate change on species distribution modeling to provide more comprehensive and accurate results for the implementation of conservation strategies.

5. Conclusions

This study presents valuable information about the distribution of six Mexican pine species catalogued as endemic and endangered. The approach followed here takes advantage of the freely available data and resources that academic institutions can provide in monitoring critical species such as P. culminicola, P. jaliscana, P. maximartinenzi, P. nelsonii, P. pinceana, and P. rzedoswki. We were able to model suitable potential areas of distribution of each species evaluated. The results of this study are intended to be the basis of in situ and ex situ conservation strategies.

Author Contributions

M.E.R.-S. and R.P.-M. conceived and designed the research, performed the analysis, and wrote the manuscript. A.G.-H. retrieved and analyzed geographic information and contributed to the modeling process. M.V.V.-G. and E.V.-B. provided technical support to statistical modeling and wrote part of the manuscript. A.F. revised and wrote the manuscript and provided meaningful guidance during the development of the study.

Acknowledgments

The authors are grateful to the National Institute of Forestry, Agriculture, and Livestock Research of Mexico for funding all stages of this study through research grant No. 15144934483. Also, we are grateful to the staff of Mexican herbaria CHAP, CHAPA, INIF, CIDIR, CFNL, XAL, MEXU, ANSM, USON, and EBUM for their aid and facilities provided. The authors are deeply grateful for comments and suggestions during the review process, which were helpful in improving the manuscript.

Conflicts of Interest

The authors declare no conflict of interest.

References

  1. Farjon, A.; Filer, D. An Atlas of the World’s Conifers: An Analysis of Their Distribution, Biogeography, Diversity and Conservation Status; Brill: Leiden, The Netherlands, 2013; ISBN 978-90-04-21180-3. [Google Scholar]
  2. Flores, A.; Climent, J.; Pando, V.; López-Upton, J.; Alía, R. Intraspecific Variation in Pines from the Trans-Mexican Volcanic Belt Grown under Two Watering Regimes: Implications for Management of Genetic Resources. Forests 2018, 9, 71. [Google Scholar] [CrossRef]
  3. Rzedowski, J. Vegetacion de Mexico, 1st ed.; Comision Nacional para el Uso y Conocimiento de la Biodiversidad: Tlalpan, Mexico, 2006. [Google Scholar]
  4. Gebhardt, S.; Wehrmann, T.; Ruiz, M.; Maeda, P.; Bishop, J.; Schramm, M.; Kopeinig, R.; Cartus, O.; Kellndorfer, J.; Ressl, R.; et al. MAD-MEX: Automatic Wall-to-Wall Land Cover Monitoring for the Mexican REDD-MRV Program Using All Landsat Data. Remote Sens. 2014, 6, 3923–3943. [Google Scholar] [CrossRef] [Green Version]
  5. Gernandt, D.S.; Pérez-de la Rosa, J.A. Biodiversidad de Pinophyta (coníferas) en México. Rev. Mex. Biodivers. 2014, 85, 126–133. [Google Scholar] [CrossRef] [Green Version]
  6. Sáenz-Romero, C.; Rehfeldt, G.E.; Duval, P.; Lindig-Cisneros, R.A. Abies religiosa habitat prediction in climatic change scenarios and implications for monarch butterfly conservation in Mexico. For. Ecol. Manag. 2012, 275, 98–106. [Google Scholar] [CrossRef]
  7. Rattis, L.; Dobrovolski, R.; Talebi, M.; Loyola, R. Geographic range-scale assessment of species conservation status: A framework linking species and landscape features. Perspect. Ecol. Conserv. 2018, 16, 97–104. [Google Scholar] [CrossRef]
  8. Hernández-Stefanoni, J.L.; Dupuy, J.M.; Tun-Dzul, F.; May-Pat, F. Influence of landscape structure and stand age on species density and biomass of a tropical dry forest across spatial scales. Landsc. Ecol. 2010, 26, 355–370. [Google Scholar] [CrossRef]
  9. SEMARNAT. PROYECTO de Modificación del Anexo Normativo III, Lista de especies en riesgo de la Norma Oficial Mexicana NOM-059-SEMARNAT-2010, Protección ambiental-Especies nativas de México de flora y fauna silvestres- Categorías de riesgo y especificaciones para su; Diario Oficial: Mexico City, Mexico, 2018; p. 119. [Google Scholar]
  10. Jimenez, J.; Jurado, E.; Aguirre, O.; Estrada, E. Effect of Grazing on Restoration of Endemic Dwarf Pine (Pinus culminicola Andresen et Beaman) Populations in Northeastern Mexico. Restor. Ecol. 2005, 13, 103–107. [Google Scholar] [CrossRef]
  11. Ledig, F.T.; Capó-Arteaga, M.A.; Hodgskiss, P.D.; Sbay, H.; Flores-López, C.; Conkle, M.T.; Bermejo-Velázquez, B. Genetic diversity and the mating system of a rare Mexican piñon, Pinus pinceana, and a comparison with Pinus maximartinezii (Pinaceae). Am. J. Bot. 2001, 88, 1977–1987. [Google Scholar] [CrossRef]
  12. Suzán-Azpiri, H.; Sánchez-Rámos, G.; Martínez-Avalos, J.G.; Villa-Melgarejo, S.; Franco, M. Population structure of Pinus nelsoni Shaw, an endemic pinyon pine in Tamaulipas, Mexico. For. Ecol. Manag. 2002, 165, 193–203. [Google Scholar] [CrossRef]
  13. Sánchez-González, A. Diversity and distribution of Mexican pines, an overview. Madera y Bosques 2008, 14, 107–120. [Google Scholar] [CrossRef]
  14. Manzo-Delgado, L.; López-García, J.; Alcántara-Ayala, I. Role of forest conservation in lessening land degradation in a temperate region: The Monarch Butterfly Biosphere Reserve, Mexico. J. Environ. Manag. 2014, 138, 55–66. [Google Scholar] [CrossRef] [PubMed]
  15. Guisan, A.; Zimmermann, N.E. Predictive habitat distribution models in ecology. Ecol. Model. 2000, 135, 147–186. [Google Scholar] [CrossRef]
  16. Ray, D.; Behera, M.D.; Jacob, J. Evaluating Ecological Niche Models: A Comparison between Maxent and GARP for Predicting Distribution of Hevea brasiliensis in India. Proc. Natl. Acad. Sci. India Sect. B Biol. Sci. 2018, 88, 1337–1343. [Google Scholar] [CrossRef]
  17. Anderson, R.P.; Lew, D.; Peterson, A.T. Evaluating predictive models of species’ distributions: Criteria for selecting optimal models. Ecol. Model. 2003, 162, 211–232. [Google Scholar] [CrossRef]
  18. Phillips, S.J.; Anderson, R.P.; Schapire, R.E. Maximum entropy modeling of species geographic distributions. Ecol. Model. 2006, 190, 231–259. [Google Scholar] [CrossRef]
  19. Meggs, J.M.; Munks, S.A.; Corkrey, R.; Richards, K. Development and evaluation of predictive habitat models to assist the conservation planning of a threatened lucanid beetle, Hoplogonus simsoni, in north-east Tasmania. Biol. Conserv. 2004, 118, 501–511. [Google Scholar] [CrossRef]
  20. Chefaoiu, R.M.; Hortal, J.; Lobo, J.M. Potential distribution modelling, niche characterization and conservation status assessment using GIS tools: A case study of Iberian Copris species. Biol. Conserv. 2005, 122, 327–338. [Google Scholar] [CrossRef]
  21. Quinn, G.P.; Keough, M.J. Experimental Design and Data Analysis for Biologists; Cambridge University Press: Cambridge, UK, 2002; ISBN 9780521811286. [Google Scholar]
  22. INEGI. Conjunto de datos vectoriales de la carta de uso del suelo y Vegetación, Escala 1:250,000, Serie IV (Continuo Nacional); INEGI: Aguascalientes, Mexico, 2008. [Google Scholar]
  23. Xu, T.; Hutchinson, M.F. New developments and applications in the ANUCLIM spatial climatic and bioclimatic modelling package. Environ. Model. Softw. 2013, 40, 267–279. [Google Scholar] [CrossRef]
  24. Hijmans, R.J.; Cameron, S.E.; Parra, J.L.; Jones, P.G.; Jarvis, A. Very high resolution interpolated climate surfaces for global land areas. Int. J. Climatol. 2005, 25, 1965–1978. [Google Scholar] [CrossRef] [Green Version]
  25. R Core Team. R: A Language and Environment for Statistical Computing; R Foundation for Statistical Computing: Vienna, Austria, 2013. [Google Scholar]
  26. Fox, J.; Weisberg, S. An {R} Companion to Applied Regression, 2nd ed.; Sage: Thousand Oaks, CA, USA, 2011. [Google Scholar]
  27. Peterson, B.G.; Carl, P. Performance Analytics: Econometric Tools for Performance and Risk Analysis; R Package. Version 1.5.2. 2018. Available online: https://CRAN.R-project.org/package=PerformanceAnalytics (accessed on 12 July 2018).
  28. Wickham, H.; François, R.; Henry, L.; Müller, K. dplyr: A Grammar of Data Manipulation, R Package Version 0. 7. 6; 2018. Available online: https//:CRAN.R-project.org/package=dplyr (accessed on 7 July 2018).
  29. Gao, J. Digital Analysis of Remotely Sensed Imagery; McGraw-Hill: New York, NY, USA, 2009; ISBN 9780071604659. [Google Scholar]
  30. Soberon, J.; Peterson, A.T. Interpretation of models of fundamental ecological niches and species’s distributional areas. Biodivers. Inform. 2005, 2, 1–10. [Google Scholar] [CrossRef]
  31. Gutiérrez, A.; Joost, F. Can we expect to protect threatened species in protected areas? A case study of the genus Pinus in Mexico Podemos proteger especies en riesgo en áreas protegidas? Un estudio de caso del genero Pinus. Rev. Mex. Biodivers. 2010, 875–882. [Google Scholar]
  32. Zavarin, E.; Snajberk, K. Monoterpene differentiation in relation to the morphology of Pinus culminicola, Pinus nelsonii, Pinus pinceana and Pinus maximartinezii. Biochem. Syst. Ecol. 1987, 15, 307–312. [Google Scholar] [CrossRef]
  33. Flores-Rentería, L.; Wegier, A.; Ortega Del Vecchyo, D.; Ortíz-Medrano, A.; Piñero, D.; Whipple, A.V.; Molina-Freaner, F.; Domínguez, C.A. Genetic, morphological, geographical and ecological approaches reveal phylogenetic relationships in complex groups, an example of recently diverged pinyon pine species (Subsection Cembroides). Mol. Phylogenet. Evol. 2013, 69, 940–949. [Google Scholar] [CrossRef] [PubMed]
  34. Sanchez Silva, R.; Lopez Garcia, J.; Espinoza, J.M. Cambios en la comunidad de Pinus culminicola andersen & beaman en el cerro potosi, N. L. México. Bol. Inst. Geogr. 1987, 65–73. [Google Scholar]
  35. Riskind, D.H.; Patterson, T.F. Distributional and Ecological Notes on Pinus culminicola. Madroño 1975, 23, 159–161. [Google Scholar]
  36. García-Aranda, M.A.; Méndez-González, J.; Hernández-Arizmendi, J.Y. Distribución potencial de Pinus cembroides, Pinus nelsonii y Pinus culminicola en el Noreste de México. Ecosist. Recur. Agropec. 2018, 5, 3–13. [Google Scholar] [CrossRef]
  37. Dvorak, W.S.; Nel, A.; Espinoza, J.A. Evidence of low-levels of natural introgression between Pinus jaliscana and Pinus oocarpa in an open-pollinated progeny trial using near-infrared spectroscopy. For. Ecol. Manag. 2013, 295, 20–27. [Google Scholar] [CrossRef]
  38. Dvorak, W.; de la Rosa, J.A.; Mápula Larreta, M.; Reyes-Hernandez, V. The ecology and conservation of Pinus jaliscana. For. Genet. Resour. 1998, 26, 13–19. [Google Scholar]
  39. González-Elizondo, M.; González-Elizondo, M.S.; Ruacho-González, L.; Molina-Olvera, M. Pinus maximartinezii Rzed. (Pinaceae), primer registro para Durango, segunda localidad para la especie. Acta Bot. Mex. 2011, 96, 33. [Google Scholar] [CrossRef]
  40. López-Mata, L. Proteins, amino acids and fatty acids composition of nuts from the Mexican endemic rarity, Pinus maximartinezii, and its conservation implications. Interciencia 2001, 26, 606–610. [Google Scholar]
  41. López-Mata, L. The impact of seed extraction on the population dynamics of Pinus maximartinezii. Acta Oecol. 2013, 49, 39–44. [Google Scholar] [CrossRef]
  42. Ledig, F.T.; Conkle, M.T.; Bermejo-Velázquez, B.; Eguiluz-Piedra, T.; Hodgskiss, P.D.; Johnson, D.R.; Dvorak, W.S. Evidence for an Extreme Bottleneck in a Rare Mexican Pinyon: Genetic Diversity, Disequilibrium, and the Mating System in Pinus maximartinezii. Evolution 1999, 53, 91–99. [Google Scholar] [CrossRef] [PubMed]
  43. Cuenca, A.; Escalante, A.E.; Piñero, D. Long-distance colonization, isolation by distance, and historical demography in a relictual Mexican pinyon pine (Pinus nelsonii Shaw) as revealed by paternally inherited genetic markers (cpSSRs). Mol. Ecol. 2003, 12, 2087–2097. [Google Scholar] [CrossRef] [PubMed]
  44. Fernando-Luis, I.; Sanchez-Ramos, G.; Martinez-Avalos, J.G.; Reyes-Castillo, P. Evaluacion del daño por Retinia Arizonensis (Heinrich) (Lepidoptera: Tortricidae), parametros estructurales y regeneracion natural en Pinus nelsonii (Shaw) y P. cembroides (Zucc.) en Miquihuana, Tamaulipas, Mexico. Acta Zool. Mex. 2015, 31, 367–379. [Google Scholar]
  45. Farjon, A. Pinus nelsonii. The IUCN Red List of Threatened Species 2013. Available online: http://dx.doi.org/10.2305/IUCN.UK.2013-1.RLTS.T32628A2822530.en (accessed on 7 July 2018).
  46. Delgado, P.; Pinero, D.; Chaos, A.; Perez-Nasser, N.; Alvarez-Buylla, E.R. High population differentiation and genetic variation in the endangered Mexican pine Pinus rzedowskii (Pinaceae). Am. J. Bot. 1999, 86, 669–676. [Google Scholar] [CrossRef] [PubMed]
  47. Quijada, A.; Liston, A.; Delgado, P.; Vázquez-Lobo, A.; Alvarez-Buylla, E.R. Variation in the nuclear ribosomal DNA internal transcribed spacer (ITS) region of Pinus rzedowskii revealed by PCR-RFLP. Theor. Appl. Genet. 1998, 96, 539–544. [Google Scholar] [CrossRef] [PubMed]
  48. Farjon, A. Pinus rzedowskii. The IUCN Red List of Threatened Species 2013. Available online: http://dx.doi.org/10.2305/IUCN.UK.2013-1.RLTS.T33924A2839273.en (accessed on 7 July 2018).
  49. Favela, S.; Thomas, P. Pinus pinceana. The IUCN Red List of Threatened Species 2013. Available online: http://dx.doi.org/10.2305/IUCN.UK.2013-1.RLTS.T32629A2822604.en (accessed on 7 July 2018).
  50. Villareal Quintanilla, J.A.; Mares Arreola, O.; Cornejo Oviedo, E.; Capo Arteaga, M.A. Estudio florístico de los piñonares de Pinus pinceana Gordon. Acta Bot. Mex. 2009, 124, 87–124. [Google Scholar] [CrossRef]
  51. Santillan-Hernandez, M.; Cornejo-Oviedo, E.H.; Villanueva-Diaz, J.; Cerano-Paredes, J.; Valencia-Manzo, S.; Arteaga, M.A. Potencial dendroclimatico de Pinus pinceana Gordon en la Sierra Madre Oriental. Madera y Bosques 2010, 16, 17–30. [Google Scholar] [CrossRef]
  52. López Martínez, J.I.; Marroquín Castillo, J.J.; Treviño Garza, E.J. Modelo de la distribucioón potencial de Pinus pinceana Gord en el noreste de Meéxico. Rev. Cienc. UANL 2018, 21, 1–10. [Google Scholar] [CrossRef]
  53. Jiménez Pérez, J.; Yerena Yamallel, J.I.I.; Alanís Rodríguez, E.; Aguirre Calderón, O.A.; Martínez Barrón, R.A. Effect of cattle and wildlife exclusion areas on the survival and growth of Pinus culminicola Andresen & Beaman. Ecosist. Recur. Agropec. 2018, 5, 157–163. [Google Scholar] [CrossRef]
  54. Farjon, A. A Handbook of the World’s Conifers VOLUME I; Brill: Leiden, The Netherlands, 2010; ISBN 978-90-04-17718-5. [Google Scholar]
  55. Salinas-Rodríguez, M.M.; Sajama, M.J.; Gutiérrez-Ortega, J.S.; Ortega-Baes, P.; Estrada-Castillón, A.E. Identification of endemic vascular plant species hotspots and the effectiveness of the protected areas for their conservation in Sierra Madre Oriental, Mexico. J. Nat. Conserv. 2018, 46, 6–27. [Google Scholar] [CrossRef]
  56. Pisanty, I.; Urquiza-Haas, E.; Vargas-Mena y Amezcua, A.; Ruiz-González, S.P.; Urquiza-Haas, T.; García-Méndez, G. Instrumentos de conservación in situ en México: Logros y retos. In Capital Natural de México; Sarukhán, J., Pisanty, I., Eds.; CONABIO: Tlalpan, Mexico, 2016; pp. 245–302. ISBN 978-607-8328-69-7. [Google Scholar]
  57. Rong-Cai, Y.; Yeh, F.C. 94Z/00002 Genetic consequences of in situ and ex situ conservation of forest trees. Biol. Conserv. 1995, 71, 211. [Google Scholar] [CrossRef]
  58. Lascuráin, M.; List, R.; Barraza, L.; Díaz-Pardo, E.; Gual-Sill, F.; Maunder, M.; Dorantes, J.; Luna, V. Conservación de especies ex situ. In Capital Natural de México; Dirzo, R., González, R., March, I., Eds.; CONABIO: Tlalpan, Mexico, 2009; pp. 517–544. ISBN 978-607-7607-08-3. [Google Scholar]
  59. Moreno-Sanchez, R.; Torres-Rojo, J.M.; Moreno-Sanchez, F.; Hawkins, S.; Little, J.; McPartland, S. National assessment of the fragmentation, accessibility and anthropogenic pressure on the forests in Mexico. J. For. Res. 2012, 23, 529–541. [Google Scholar] [CrossRef]
  60. Dale, V.H.; Joyce, L.A.; Mcnulty, S.; Neilson, R.P.; Ayres, M.P.; Flannigan, M.D.; Hanson, P.J.; Irland, L.C.; Lugo, A.E.; Peterson, C.J.; et al. Climate Change and Forest Disturbances. Bioscience 2001, 51, 723. [Google Scholar] [CrossRef] [Green Version]
  61. Romero-Sanchez, M.E.; Ponce-Hernandez, R. Assessing and monitoring forest degradation in a deciduous tropical forest in Mexico via remote sensing indicators. Forests 2017, 8, 302. [Google Scholar] [CrossRef]
  62. Sánchez-Martínez, G.; Wagner, M.R. Host Preference and Attack Pattern of Dendroctonus rhizophagus (Coleoptera: Curculionidae: Scolytinae): A Bark Beetle Specialist on Pine Regeneration. Environ. Entomol. 2009, 38, 1197–1204. [Google Scholar] [CrossRef]
  63. Smith, S.E.; Mendoza, M.G.; Zúñiga, G.; Halbrook, K.; Hayes, J.L.; Byrne, D.N. Predicting the distribution of a novel bark beetle and its pine hosts under future climate conditions. Agric. For. Entomol. 2013, 15, 212–226. [Google Scholar] [CrossRef]
  64. West, A.M.; Kumar, S.; Brown, C.S.; Stohlgren, T.J.; Bromberg, J. Field validation of an invasive species Maxent model. Ecol. Inform. 2016, 36, 126–134. [Google Scholar] [CrossRef] [Green Version]
  65. Gastón, A.; García-Viñas, J.I. Modelling species distributions with penalised logistic regressions: A comparison with maximum entropy models. Ecol. Model. 2011, 222, 2037–2041. [Google Scholar] [CrossRef]
  66. Araújo, M.B.; Guisan, A. Five (or so) challenges for species distribution modelling. J. Biogeogr. 2006, 33, 1677–1688. [Google Scholar] [CrossRef]
  67. Van Proosdij, A.S.J.; Sosef, M.S.M.; Wieringa, J.J.; Raes, N. Minimum required number of specimen records to develop accurate species distribution models. Ecography 2016, 39, 542–552. [Google Scholar] [CrossRef]
  68. Narouei-Khandan, H.A.; Harmon, C.L.; Harmon, P.; Olmstead, J.; Zelenev, V.V.; van der Werf, W.; Worner, S.P.; Senay, S.D.; van Bruggen, A.H.C. Potential global and regional geographic distribution of Phomopsis vaccinii on Vaccinium species projected by two species distribution models. Eur. J. Plant Pathol. 2017, 148, 919–930. [Google Scholar] [CrossRef]
Figure 1. Vegetation types from the study area.
Forests 09 00767 g001
Figure 2. The natural distribution of the six Mexican pines evaluated in this study.
Forests 09 00767 g002
Figure 3. Spatial potential distribution of P. culminicola.
Forests 09 00767 g003
Figure 4. Spatial potential distribution of P. jaliscana.
Forests 09 00767 g004
Figure 5. Spatial potential distribution of P. maximartinenzii.
Forests 09 00767 g005
Figure 6. Spatial potential distribution of P. nelsonii.
Forests 09 00767 g006
Figure 7. Spatial potential distribution of P. pinceana.
Forests 09 00767 g007
Figure 8. Spatial potential distribution of P. rzedoswkii.
Forests 09 00767 g008
Figure 9. ROC of Pinus culminicola (a), P. Jaliscana (b), P. maximartinenzi (c), P. nelsonii (d), P. pinceana (e), and P. rzedoswki (f).
Forests 09 00767 g009
Figure 10. Areas of land cover change in the period 1991–2016. Colors indicate changes from one vegetation class to another during the period evaluated.
Forests 09 00767 g010
Figure 11. Land cover change in the period 1991–2016.
Forests 09 00767 g011
Table 1. Characteristics of the pine species selected in this study.
Pinus SpeciesDistribution in Mexico 1NOM-059-Semarnat StatusIUCN Red List StatusObservations of PresenceObservations of Absence
P. culminicolaCoahuila, San Luis Potosí and Nuevo LeónEndangeredEndangered B1 ab (ii,iii,iv,v) + 2ab (ii,iii,iv,v)12663
P. jaliscanaJaliscoEndangeredNear Threatened2935
P. maximartineziZacatecas and DurangoEndangeredEndangered B1ab (ii,iii) + 2ab (ii,iii)6765
P. nelsoniiCoahuila (Mont. del Carmen), Nuevo León, San Luis Potosí, and Tamaulipas.EndangeredEndangered B2ab (ii,iii,iv,v)226232
P. pinceanaDurango, Coahuila, Nuevo León, Zacatecas, San Luis Potosí, Querétaro and HidalgoEndangeredLeast Concern220199
P. rzedowskiiWestern MichoacánEndangeredVulnerable D1 + 25456
1 According to the Ministry of Natural Resources of Mexico (SEMARNAT in Spanish) and IUCN Red List.
Table 2. Herbaria consulted in this study.
InstitutionHerbarium KeycodeLocation
Chapingo Autonomous UniversityCHAPTexcoco, Mexico
Postgraduate CollegeCHAPAMontecillo, Mexico
Autonomous Metropolitan UniversityUAMIZIztapalapa, Mexico City
National Institute of Forestry, Agriculture and Livestock ResearchINIFCoyoacan, Mexico City
National Polytechnic InstituteCIDIRDurango, Durango
Autonomous University of Nuevo LeonCFNLLinares, Nuevo Leon
Ecology Institute A.C.XALXalapa, Veracruz
National Mexican HerbariumMEXUCoyoacan, Mexico
Autonomous Agronomic Antonio Narro UniversityANSMSaltillo, Coahuila
University of SonoraUSONHermosillo, Sonora
Michoacan University of San Nicolas de HidalgoEBUMMorelia, Michoacán
Table 3. Bioclimatic variables used in this study [24].
Environmental VariablesUnitsBIO Variable Code
Annual mean temperature°CBio1
Mean Diurnal Range (Mean of monthly (max temp–min temp))°CBio2
Isothermality (BIO2/BIO7) (multiply by 100)°CBio3
Temperature Seasonality (standard deviation multiply by 100)%Bio4
Max temperature of warmer month°CBio5
Min temperature of coldest month°CBio6
Temperature Annual Range (Bio5-Bio6)°CBio7
Mean temperature of wettest quarter°CBio8
Mean temperature of driest quarter°CBio9
Mean temperature of warmest quarter°CBio10
Mean temperature of coldest quarter°CBio11
Total precipitationMmBio12
Precipitation of wettest seasonmmBio13
Precipitation of driest seasonmmBio14
Precipitation Seasonality (Coefficient of Variation)%Bio15
Precipitation of wettest quartermmBio16
Precipitation of driest quartermmBio17
Precipitation of warmer quartermmBio18
Precipitation of coldest quartermmBio19
Altitudem above sea levelBio20
AspectDegrees (°)Aspect
SlopeDegrees (°)Slope
Table 4. Model summary for P. culminicola.
Pine SpeciesModelEstimatesStandard Errorz-Valuep-Value
P. culminicola π ^ = l o g e π ^ 1 π ^ = β 0 + β 1 ( B i o 19 ) β 0 = −8.661.57−5.50<0.005
β 1 = 0.12 0.02589<0.005
Table 5. Model summary for P. jaliscana.
Pine SpeciesModelEstimatesStandard Errorz-Valuep-Value
P. jaliscana π ^ = l o g e π ^ 1 π ^ = β 0 + β 1 ( B i o 18 ) + β 2 ( B i o 12 )          + β 3 ( B i o 16 ) + β 4 ( B i o 19 ) β 0 = 5.131 8.501.980.047
β 1 = 0.157 0.022−1.520.12
β 2 = 0.102 0.0031.390.163
β 3 = 0.111 0.037−1.740.810
β 4 = 0.062 1.3111.550.120
Table 6. Model summary for P. maximartinenzii.
Pine SpeciesModelEstimatesStandard Errorz-Valuep-Value
P. maximartinenzii π ^ = l o g e π ^ 1 π ^ = β 0 + β 1 ( B i o 17 ) β 0 = 3.504 0.963−3.638<0.005
β 1 = 0.247 0.0633.879<0.005
Table 7. Model summary for P. nelsonii.
Pine SpeciesModelEstimatesStandard Errorz-Valuep-Value
P. nelsonii π ^ = l o g e π ^ 1 π ^ = β 0 + β 1 ( B i o 16 ) + β 2 ( B i o 19 )          + β 3 ( B i o 17 ) + β 4 ( a s p e c t )          + β 5 ( s l o p e ) β 0 = 0.156 0.7210.2160.828
β 1 = 0.0108 0.002−4.363<0.005
β 2 = 0.115 0.028−4.043<0.005
β 3 = 0.183 0.0345.271<0.005
β 4 = 0.002 0.001−2.1370.0326
β 5 = 0.054 0.278−1.9490.051
Table 8. Model summary for P. pinceana.
Pine SpeciesModelEstimatesStandard Errorz-Valuep-Value
P. pinceana π ^ = l o g e π ^ 1 π ^ = β 0 + β 1 ( B i o 17 )          + β 2 ( a s p e c t )          + β 3 ( B i o 11 ) + β 4 ( B i o 6 )          + β 5 ( B i o 5 ) β 0 = 6.448 2.571−2.5510.010
β 1 = 0.074 0.001−5.483<0.005
β 2 = 0.005 0.283−5.364<0.005
β 3 = 1.140 0.228−3.161<0.005
β 4 = 0.815 0.0163.227<0.005
β 5 = 0.19 0.183−2.1530.031
Table 9. Model summary for P. rzedoswkii.
Pine SpeciesModelEstimatesStandard Errorz-Valuep-Value
P. rzedoswkii π ^ = l o g e π ^ 1 π ^ = β 0 + β 1 ( a s p e c t ) + β 2 ( B i o 19 )            + β 3 ( B i o 2 ) β 0 = 23.53
β 1 = 0.074
β 2 = 0.005
1.631.020.307
β 3 = 1.140 0.09−1.060.03
Table 10. Indices used for validation of the models.
Model SpeciesSensitivitySpecificityConcordanceOverall Accuracy (%)Kappa
P. culminicola0.780.890.8482.450.64
P. jaliscana0.880.630.7575.000.51
P. maximartinenzii0.470.840.6065.000.31
P. nelsonii0.720.750.8073.910.48
P. pinceana0.680.730.7170.630.41
P. rzedoswki0.760.470.5461.760.23
Table 11. Land cover changes in the study area.
1991 (ha)2016 (ha)Difference (ha)
Agriculture108,109.64134,461.0326,351.39
Coniferous Forest62,278.4826,888.60−35,389.88
Grassland68,293.0677,797.269504.20
Mixed Forest13,836.6737,272.1323,435.46
Scrubland247,888.00217,221.03−30,666.98
Secondary vegetation1925.8310,426.658500.82
Urban Areas574.806418.895844.09

