Article

Spatial Association and Diversity of Dominant Tree Species in Tropical Rainforest, Vietnam

1
Faculty of Silviculture, Vietnam National University of Forestry, 02433840 Hanoi, Vietnam
2
Department of Natural Resources and Environment, Shiraz University, 7144165186 Shiraz, Iran
3
Transilvania University, Sirul Beethoven 1, ROU-500123 Brasov, Romania
*
Author to whom correspondence should be addressed.
Forests 2018, 9(10), 615; https://doi.org/10.3390/f9100615
Submission received: 5 September 2018 / Revised: 3 October 2018 / Accepted: 4 October 2018 / Published: 7 October 2018
(This article belongs to the Special Issue Causes and Consequences of Species Diversity in Forest Ecosystems)

Abstract

:
Explaining the high diversity of tree species in tropical forests remains a persistent challenge in ecology. The analysis of spatial patterns of different species and their spatial diversity captures the spatial variation of species behaviors from a ‘plant’s eye view’ of a forest community. To measure scale-dependent species-species interactions and species diversity at neighborhood scales, we applied uni- and bivariate pair correlation functions and individual species area relationships (ISARs) to two fully mapped 2-ha plots of tropical evergreen forests in north-central Vietnam. The results showed that (1) positive conspecific interactions dominated at scales smaller than 30 m in both plots, while weak negative interactions were only observed in P2 at scales larger than 30 m; (2) low numbers of non-neutral interactions between tree species were observed in both study plots. The effect of scale separation by habitat variability on heterospecific association was observed at scales up to 30 m; (3) the dominance of diversity accumulators, the species with more diversity in local neighborhoods than expected by the null model, occurred at small scales, while diversity repellers, the species with less diversity in local neighborhoods, were more frequent on larger scales. Overall, the significant heterospecific interactions revealed by our study were common in highly diverse tropical forests. Conspecific distribution patterns were mainly regulated by topographic variation at local neighborhood scales within 30 m. Moreover, ISARs were also affected by habitat segregation and species diversity patterns occurring at small neighborhood scales. Mixed effects of limited dispersal, functional equivalence, and habitat variability could drive spatial patterns of tree species in this study. For further studies, the effects of topographical variables on tree species associations and their spatial autocorrelations with forest stand properties should be considered for a comprehensive assessment.

1. Introduction

One of the fundamental goals of community ecology is to understand the underlying ecological processes that form the patterns of species and species diversity in space. Previous studies have investigated conspecific and heterospecific interactions [1,2], dispersal limitation [3], environmental heterogeneity [2,4,5], neutral theory [6], and the individual species-area relationships [7,8] of plant communities. The authors of these studies proposed the underlying ecological processes that regulate the distribution patterns of species and species diversity in space. The neutral theory assumes demographic equivalence of individuals in terms of their birth, reproduction, and death, regardless of species identity [6]. McGill [9] argued that a stochastic geometry of biodiversity is exposed by intraspecific clustering and independent species placement from other species. Uriarte et al. [10] also found that the majority of species did not respond to the identity of neighbors in Barro Colorado Island, which supports the neutral theory. Recent studies have predicted that stochastic dilution effects may result in species rich communities with independence of species spatial distribution [9,11,12], and even the underlying ecological processes structuring the community are driven by deterministic niche differences. Consequently, the identities of the nearest neighborhood individuals of a given species could be unpredictable because each individual may be neighbored by a different set of competitors (e.g., [13,14]). However, several studies using individual-based analyses of local neighborhoods pointed out that direct plant-plant interactions may operate within local plant neighborhoods on scales smaller than 30 m, and fade away on larger scales [2,10,15]. Under habitat heterogeneity, direct plant interactions on small scales (e.g., facilitation or competition) may be marked by habitat preference on large scales (e.g., shading, nutrients, soil moisture) [2,4,16]. Additionally, habitat conditions (e.g., elevation, soil moisture, aspect) vary typically on large scales along environmental topographical gradients [17,18]. Therefore, using the appropriate null models can account for the effects of habitat heterogeneity and plant interactions [19]. In heterogeneous habitats, using inhomogeneous Poisson processes [20,21] as null models retains the large scales of pattern structure but removes the small-scale correlation structure.
The analysis of scale-dependent patterns of diversity in neighborhoods of individuals may also provide insights into the mechanisms of community assembly. Analysis of individual species-area relationships (ISAR) [7,21] is an efficient technique to quantify changes in species richness and species-specific effects on local diversity. ISAR is used to detect spatial patterns in diversity from the perspective of individual plants, and to relate them to the underlying mechanisms [19]. If positive interactions with other species occur, such as shared responses to abiotic conditions or dispersion by the same frugivores, the target species accumulates and maintains an over-representative proportion of species diversity in its proximity [22]; therefore, it is known as a diversity accumulator. In contrast, if negative interactions occur, such as competition for space, it can result in a lower density of heterospecific neighbors. Consequently, there is an under-representative proportion of other species neighboring the focal species, which is therefore named a diversity repeller. Hence, the net balance of positive and negative interactions can reduce or elevate the species richness of the neighbors of a focal species, or the richness of neighborhood species may not significantly differ from that of randomly distributed neighbors [22].
In this study, we used point-pattern analyses to examine the species interactions and species diversity in two 2-ha plots of tropical evergreen forest stands in Vietnam, and then investigated the effects of habitat variability on tree species demography. Our general hypothesis is that stochastic effects dilute species associations in species-rich forest communities. Specifically, we hypothesized that: (1) The underlying mechanisms regulating conspecific and heterospecific interactions, such as habitat variability, functional equivalence, limited dispersal or species interaction, are mixed in these species-rich forest communities. (2) Species interactions are commonly observed on local neighborhood scales and blurred on larger scales in species-rich communities. Our aim was to disentangle the effects of environmental variability on species association in space, and the potential ecological processes structuring the spatial patterns of these forests.

2. Materials and Methods

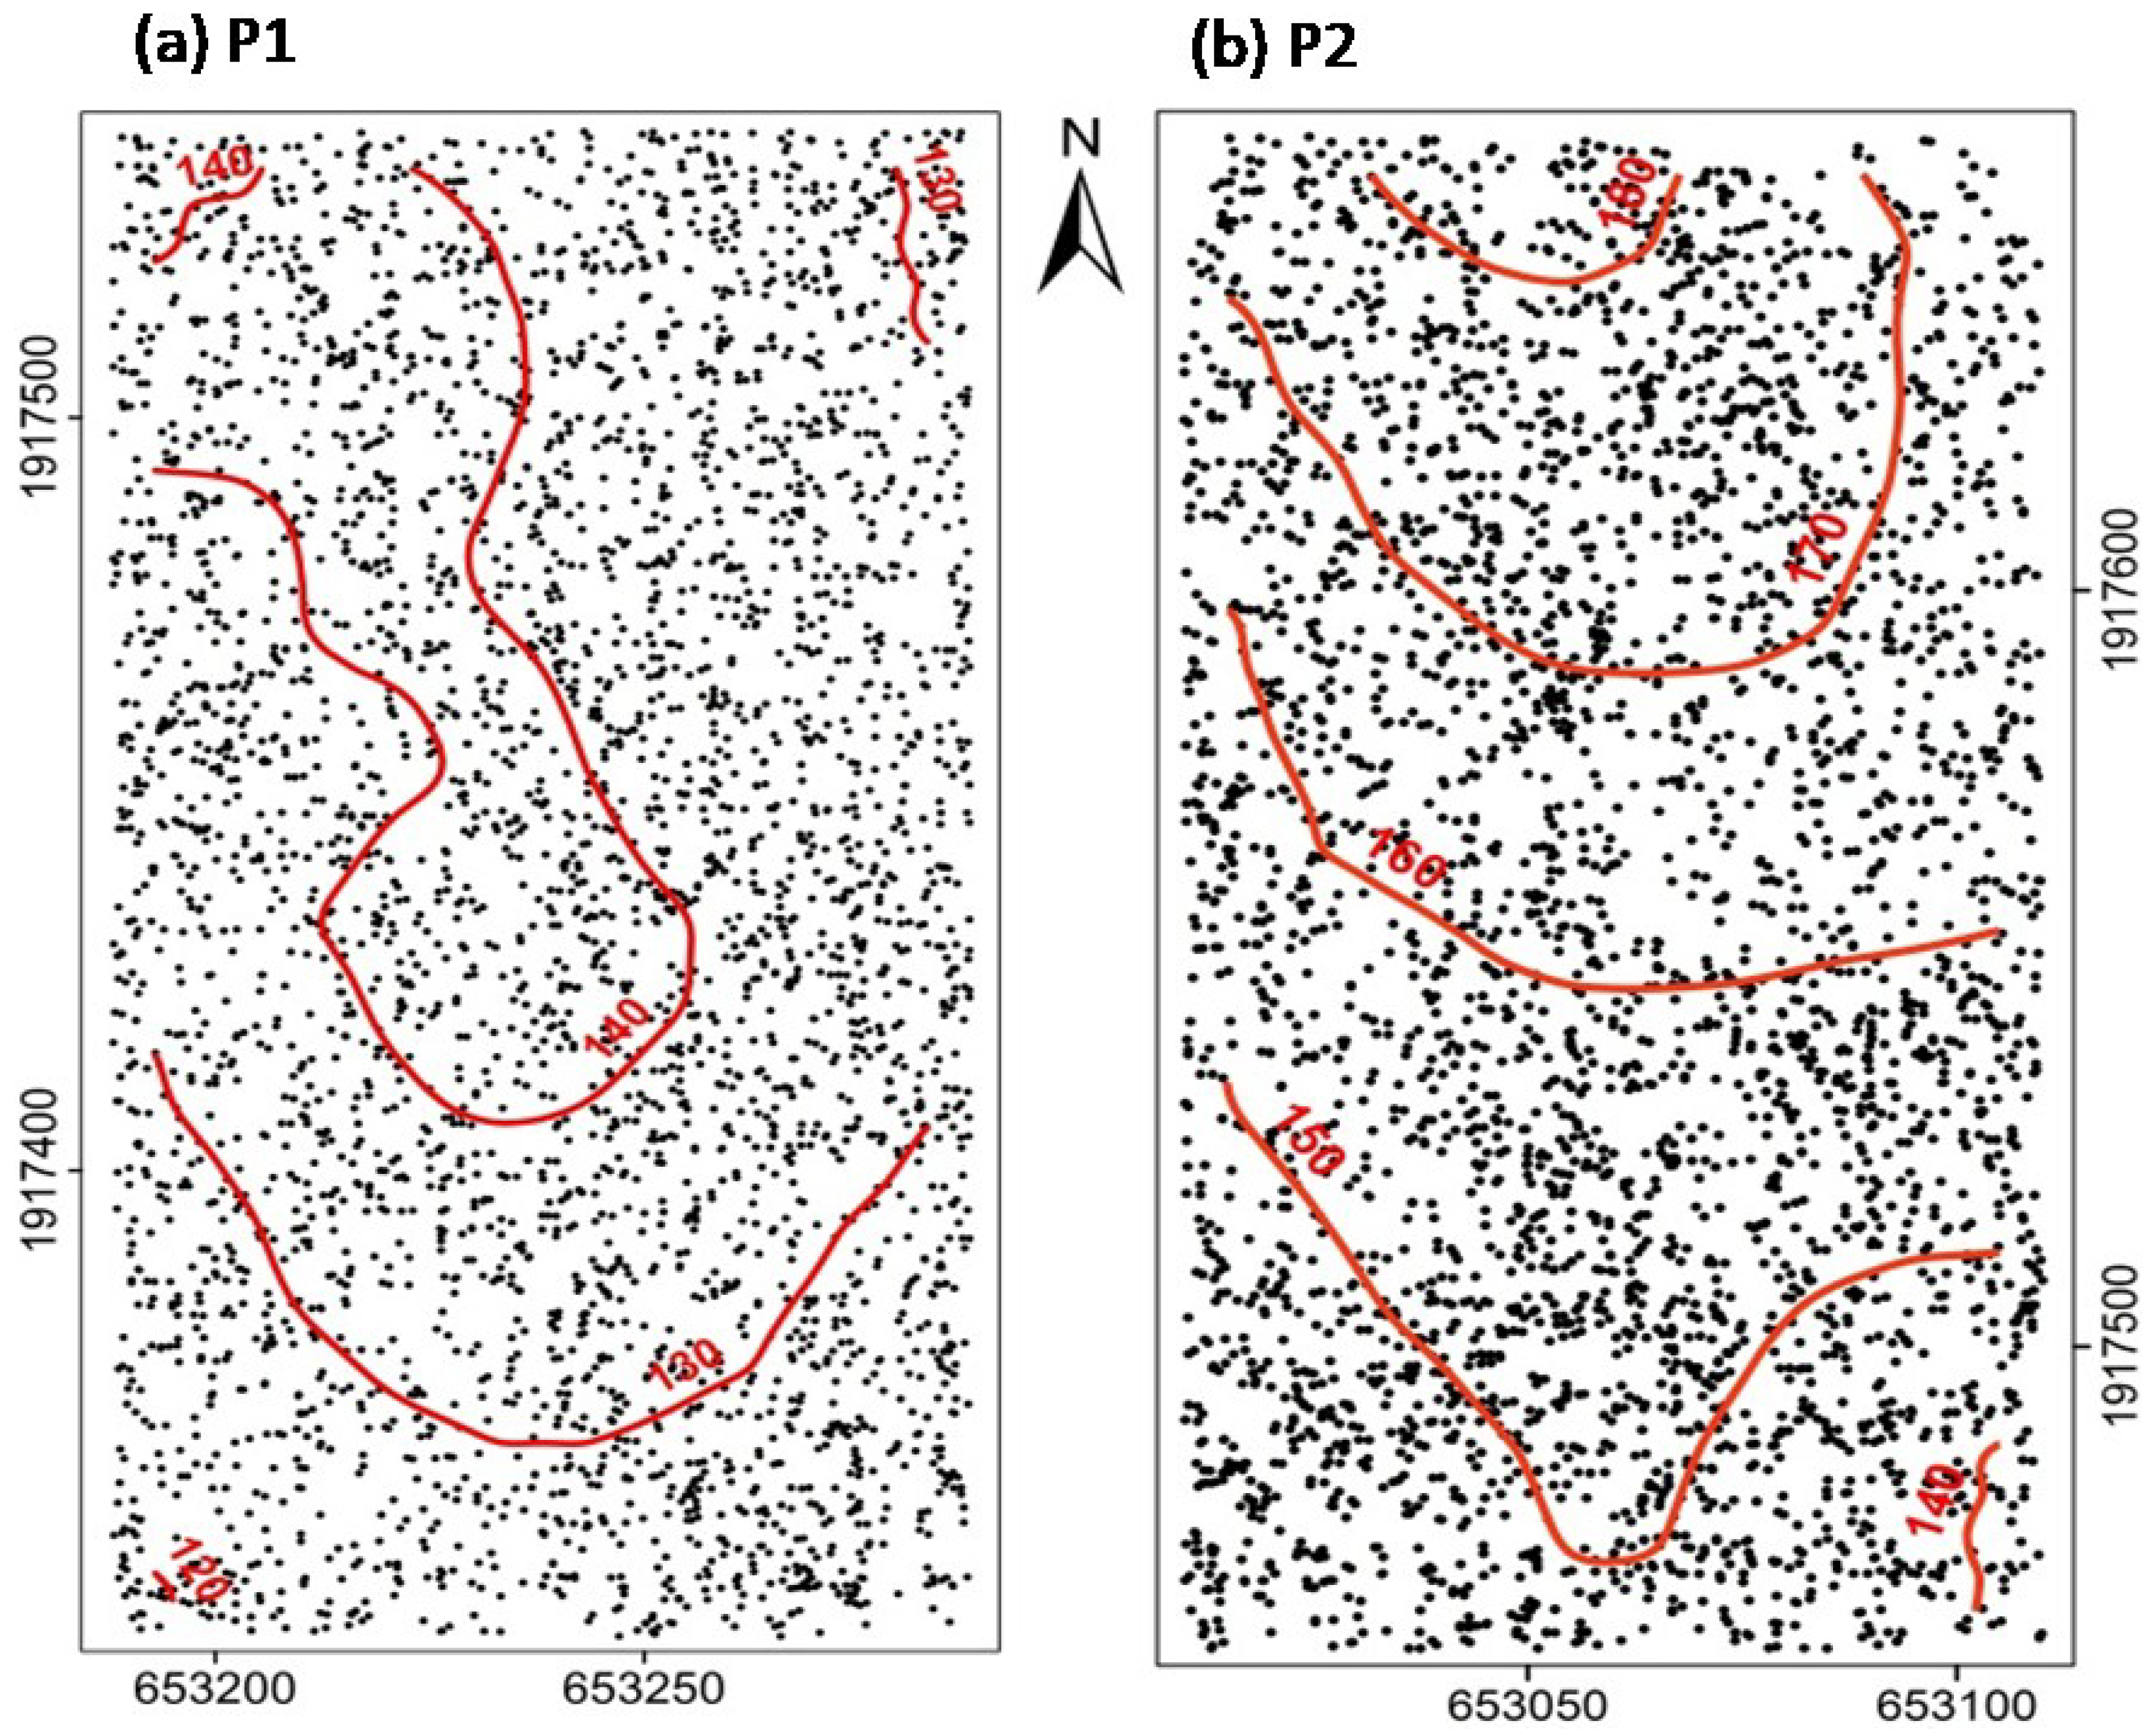
2.1.Study Site and Data Collection

In 2017, two 2-ha study plots (100 m × 200 m) were established at 17°20’11″ N, 106°26’30″ E (P1) and 17°20’15″ N, 106°26’24″ E (P2) in tropical evergreen forest of north-central Vietnam. P1 exhibited an elevation ranging from 119 to 148 m above sea level (a.s.l.) and slope fluctuating from 5 to 40 degrees (Table 1), whereas Plot P2 presented an elevation varying from 137 to 184 m a.s.l. (Table 1), and slope ranging from 5 to 45 degrees, with good drainage. The climate regime characteristic for both plots is tropical monsoon, with an average annual temperature of 23.5 °C and average annual precipitation of 3000 mm. About 60–70% of the total precipitation falls from October to November in the rainy season; the dry season lasts from March to August.
All live trees with diameter at breast height (DBH) ≥2.5 cm were mapped, and tree positions and their characteristics (species and DBH) were recorded. The topographic slope and relative coordinates (x,y) of each tree were recorded via a grid system of subplots (10 m × 10 m) by using a laser distance measurer (Leica Disto D2, Leica Geosystems AG, Heerbrugg, Switzerland) and compass. Elevation was calculated for each subplot as the mean of the elevation at its four corners. Both study plots were developed on secondary forest and selectively logged under reduced-impact logging before 2006, and they were highly protected afterward. Seven stumps of Erythrophfloeum fordii Oliver and Tarrietia javanica Blume were recorded in P1, and eighteen logged stumps of Erythrophfloeum fordii, Tarrietia javanica, Vatica odorata (Griff.) Symington, and Garuga pierrei Guillaumin were found in P2.

2.2. Data Analysis

2.2.1. Uni- and Bivariate Pair Correlation Functions

We used the pair correlation functions [20,23] as summary statistics to quantify the spatial structure of the uni- and bivariate patterns. The pair correlation function g11(r) for the univariate pattern of species 1 can be defined based on the neighborhood density, which is the mean density of trees of species 1 within rings with radius r and width dr centered on the trees of species 1 [23] where λ1 is the density of species 1 trees in the plot. Therefore, the pair correlation function is the ratio of the observed mean density of trees in the rings to the expected mean density of trees. The univariate pair correlation function g11(r) can be used to find out whether the distribution of a species is random (g11(r) = 1), aggregated (g11(r) > 1), or segregated (g11(r) < 1), and at which distances r these patterns occur. The pair correlation function for bivariate patterns (i.e., species 1 and species 2) follows intuitively: the value of g12(r) is the ratio of the observed mean density of species 2 trees in the rings around species 1 trees to the expected mean density of species 2 trees in these rings [23]. The association of a species pair is that of independence if g12(r) = 1, attraction if g12(r) > 1, or repulsion if g12(r) < 1 at distances r.
The above assessment is applied in cases of environmental homogeneity, where the tree locations are independently and randomly distributed over the entire plot under the null model of complete spatial randomness (CSR). In the case of environmental heterogeneity, where the tree distribution contains areas with low point density, the local neighborhood density is larger than the expected density under CSR; therefore, spurious aggregation appears, which may also obscure an existing small-scale regularity (i.e., virtual aggregation; [4]). Considering this issue, we used the inhomogeneous Poisson process (IPP) as a null model [4,23]. This null model can approximately factor out the effects of heterogeneity by placing the points of the tree distribution only within areas of radius R. It maintains the observed large-scale structure, but removes potential non-random local spatial structures at distances r below R [4]. The constant density of points in the null model of CSR is replaced by an intensity function λ(x,y) that varies with location (x,y) in the null model of IPP [4,23]. To estimate the intensity function, a non-parametric kernel estimation of the intensity function based on the Epanechnikov kernel with a bandwidth R = 50 m was used. In the estimation, all potential spatial structures in the pattern of the target species on scales up to 50 m were removed, while spatial structures were maintained on larger scales.
To test species association, we used different null models. Under CSR, we applied the null model of independence, in which the locations of tree species 1 are fixed and that of tree species 2 are randomly shifted within the study plot. With environmental heterogeneity, we kept the locations of the first species fixed, and randomized the locations of the second species by using the IPP null model. We assessed both g12(r) and g21(r) for each species association due to the asymmetric interactions of species.

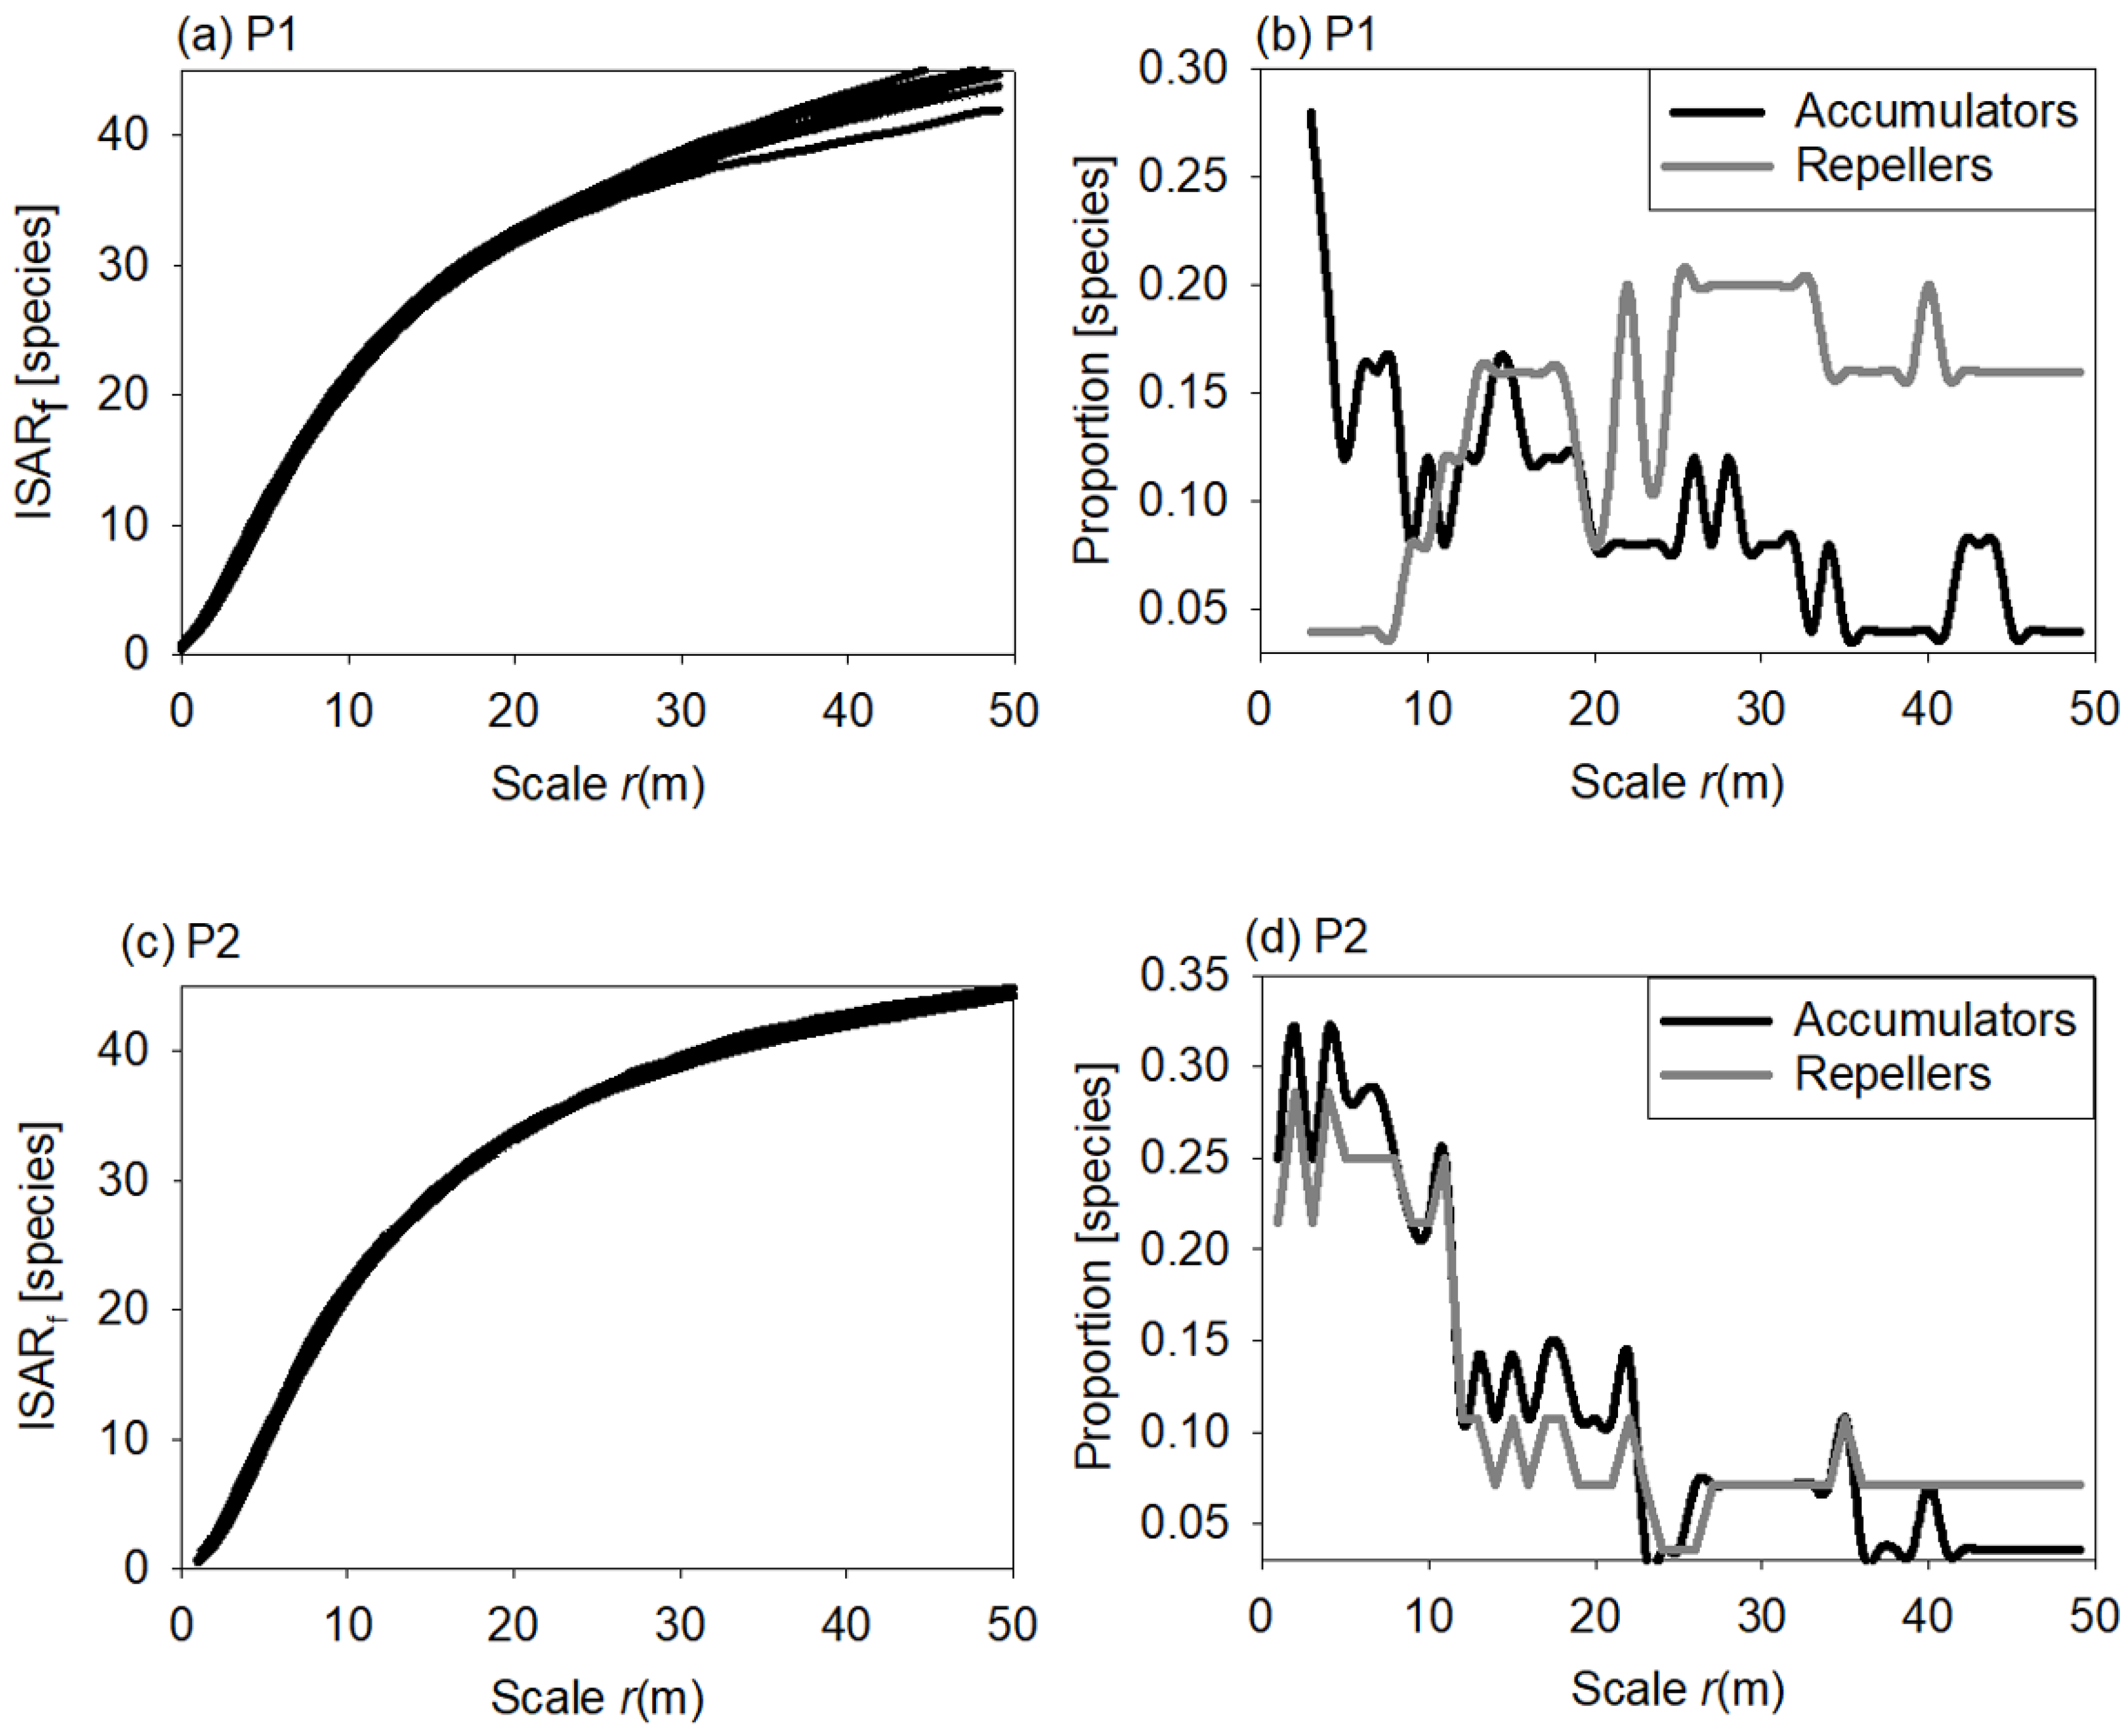
2.2.2. Individual Species—Area Relationship

The ISAR(r) function is the expected number of species within circular areas of radius r, with a = πr2, around an arbitrarily chosen individual of a target species t [7]. ISAR is used to analyze the spatial diversity structure in forest ecosystems and combine the species–area relationship with the individual perspective of point pattern analysis [21]. For a species, the ISAR can be estimated as:
  ISAR ( r ) = j = 1 N [ 1 P t j ( 0 , r ) ]  
Ptj(0, r) is the emptiness probability that species j is not present in the circle with radius r around individuals of the target species t. If a = πr2, the ISAR function can be expressed in terms of circular area a to resemble the common species area relationship [7].

2.2.3. Used Software Package

For both analyses types (pair-correlation function and ISAR), to assess departure from the null models on different scales r, the 5th lowest and 5th highest values of 199 Monte Carlo simulations were used to construct confidence envelopes by using the grid-based software Programita ([23], updated version of February 2014 from http://programita.org/) with spatial resolution of 2 m. Then, the Goodness-of-Fit (GoF) test was applied with ≤5% error to reduce type I error inflation [24]. In our study, we selected a distance interval of 0–30 m to assess overall departures from the null model. Significant deviations from the null model were only considered as such if the observed p value of the GoF test was ≤0.05.
Thus, the univariate analysis indicated aggregation if the observed g11(r) was above the simulation envelopes and regularity if it was below. Conversely, the bivariate analysis indicated a positive interaction if the observed g12(r) was above the simulation envelopes, and a negative interaction if it was below.
In ISAR analysis, a species is regarded as a diversity accumulator with an approximate α level of 0.05 if the empirical ISAR(r) is above the confidence envelopes on scale r. That means that the target species has more diverse local neighborhoods on scale r than expected by the null model. Conversely, a species is regarded as a diversity repeller if the empirical ISAR(r) is below simulation envelopes on scale r, thereby having a less diverse local neighborhood on scale r than expected by the null model.

3. Results

Plot P2 had fewer individuals and lower species richness, but it had a higher basal area and higher dominance of the common species (having ≥30 individuals) than plot P1 (Table 1). In plot P1, the most common tree species were Ormosia balansae Drake, Garuga pierrei, Erythrophfloeum fordii, Paviesia annamensis Pierre, Castanopsis tonkinensiss (Rox. Ex Lin.) A., and Tarrietia javanica, which contributed 44% of the total basal area and 32% of all individuals. In plot P2, the dominant species were Cinnamomun obtusifolium Nees, Garuga pierrei, Ormosia balansae, Engelhardtia roxburghiana Lindl., and Endosperrmun sinensis Benth., covering 42% of the total basal area and 22% of all individuals. Figure 1 shows distribution maps of studied species in plot P1 and P2. For characteristics of other common species, see Appendix Table A1.

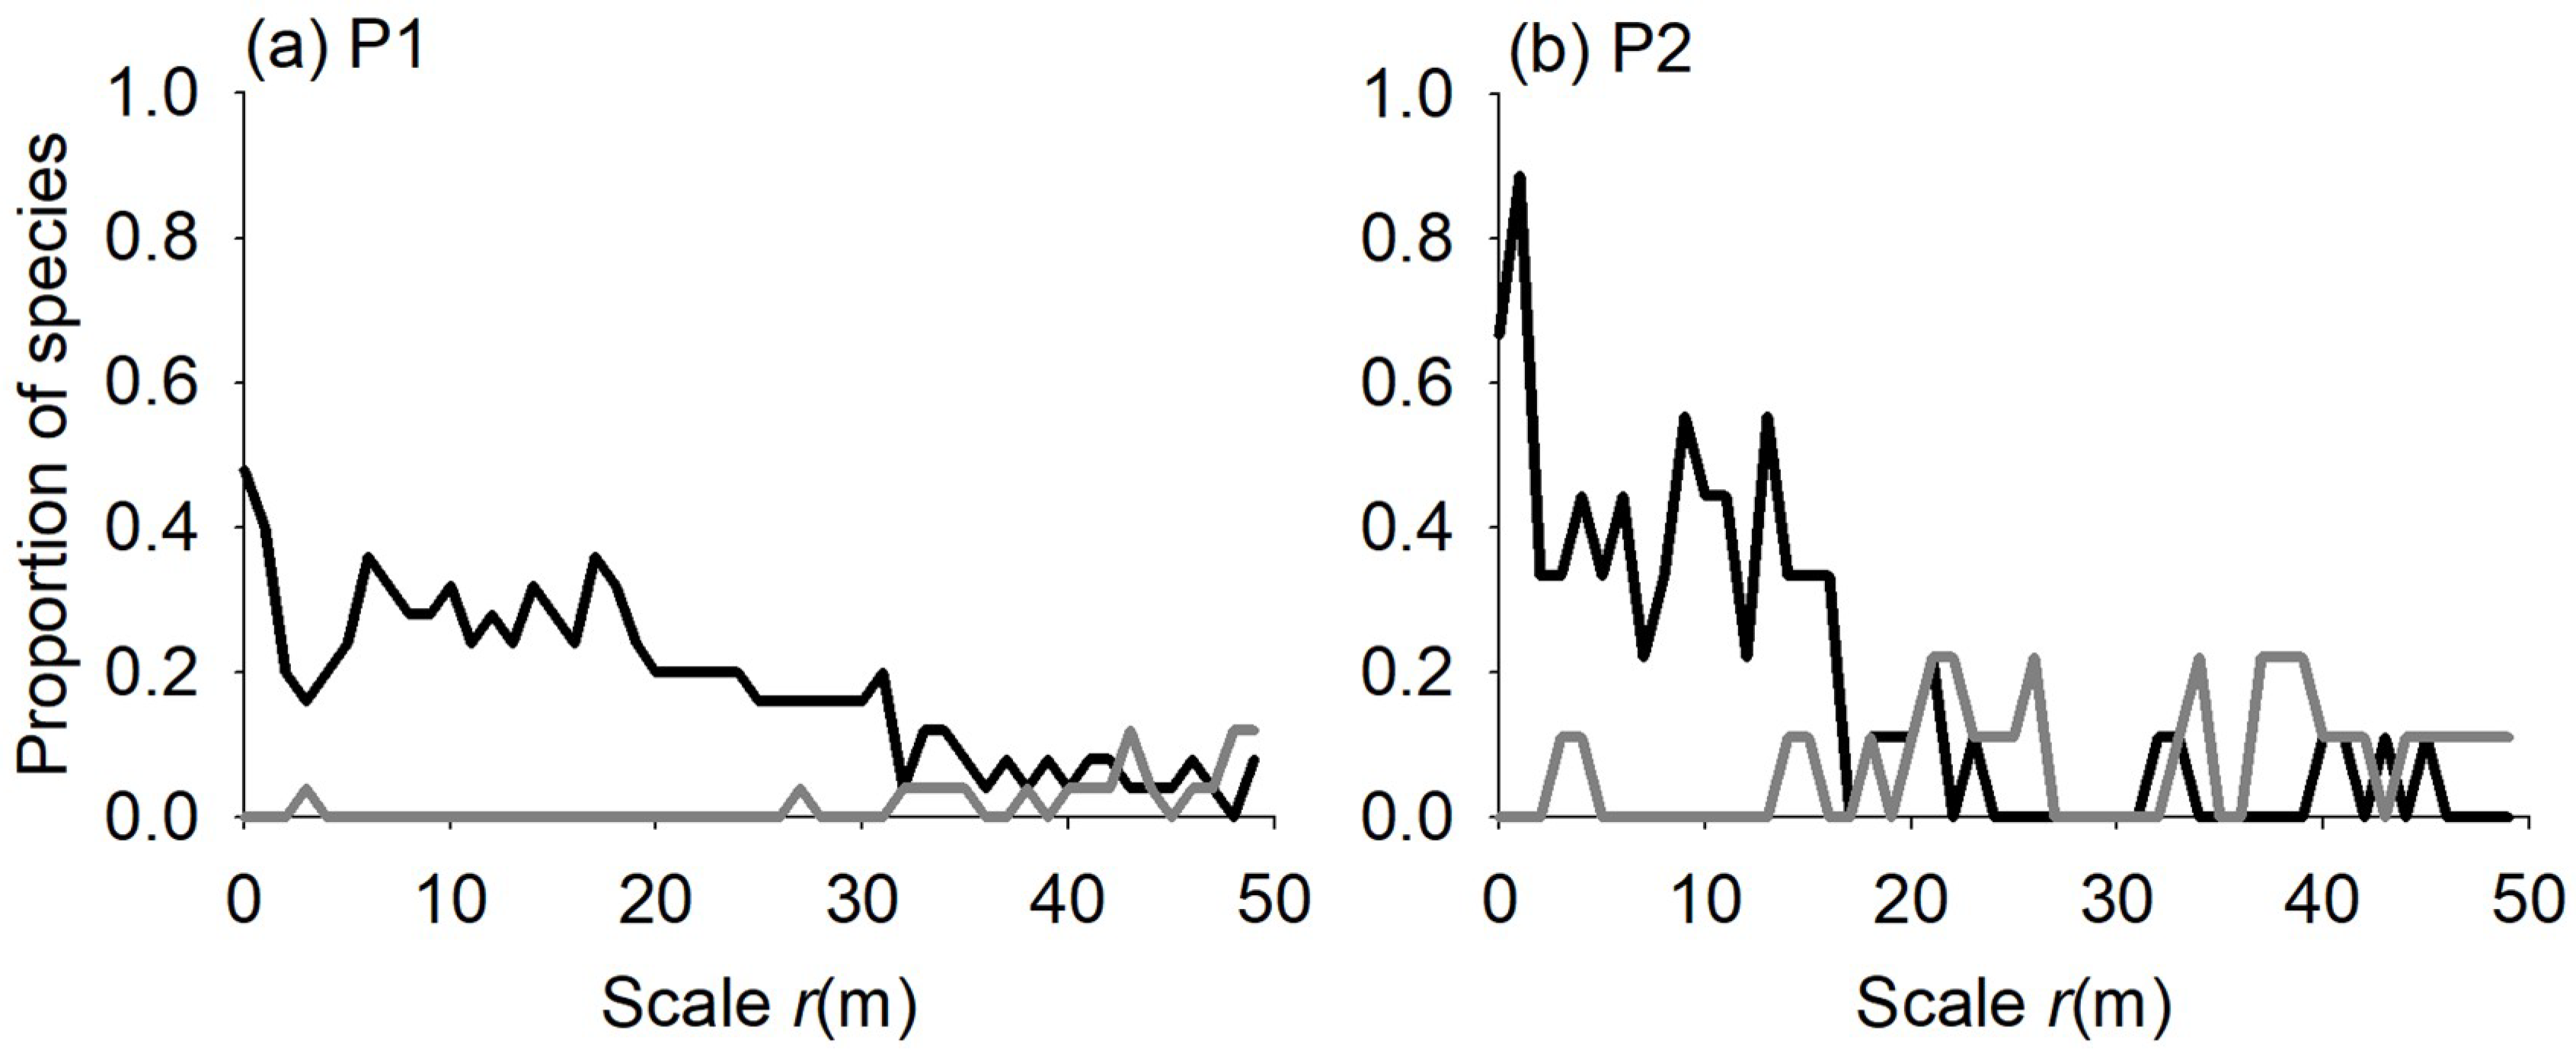
3.1. Species Distribution Patterns

We performed a total of 53 univariate point-pattern analyses for 30 species with at least 30 individuals in both plots (Table A1). The number of species that showed a significant departure from the null models substantially decreased on scales up to 20–30 m and saturated at larger scales (Figure 2).
Of the 25 most abundant species in plot P1, the individual distribution of 15 species (60%) showed a significant departure from the null model of CSR (p ≤ 0.05) (Figure 2a), the individual distribution of another 12 species (48%) showed aggregated patterns, and three species (12%) had random distribution patterns (not shown) on scales up to 30 m. Strongly aggregated species on different scales were shade intolerant species, including Bursera tonkinensis Guillaumin, T. javanica, Polyalthia nemoralis Aug. DC, Mallotus kurzii Hook.f., C. indica, O. balansae, E. sinensis, and V. odorata.
The heterogeneity of plot P2 was established based on the rejection of the null model of CSR for trees with DBH ≥10 cm of all species on large scales, as described in [23] (results shown in Appendix Figure A1). Therefore, the null model of IPP was applied for further simulation processes on P2. Among 28 analyzed species in P2, individuals of 9 species (32%) displayed a significant departure under the null model of IPP (p ≤ 0.05) (Figure 2b). Of these nine, six species (21%) exhibited the individuals aggregated patterns up to scales of 20 m included T. javanica, C. obtusifolium, Polyalthia cerasoides (Roxb.) Bedd, M. kurzii and E. sinensis, and three species (11%) showed no difference from the null model (data not shown). On scales larger than 20 m, three species (11%), including C. obtusifolium, M. kurzii and E. sinensis, also showed regular distribution patterns.
In comparison, positive conspecific interactions dominated on small scales up to 30 m, while weak negative interactions were only observed in P2 on large scales.

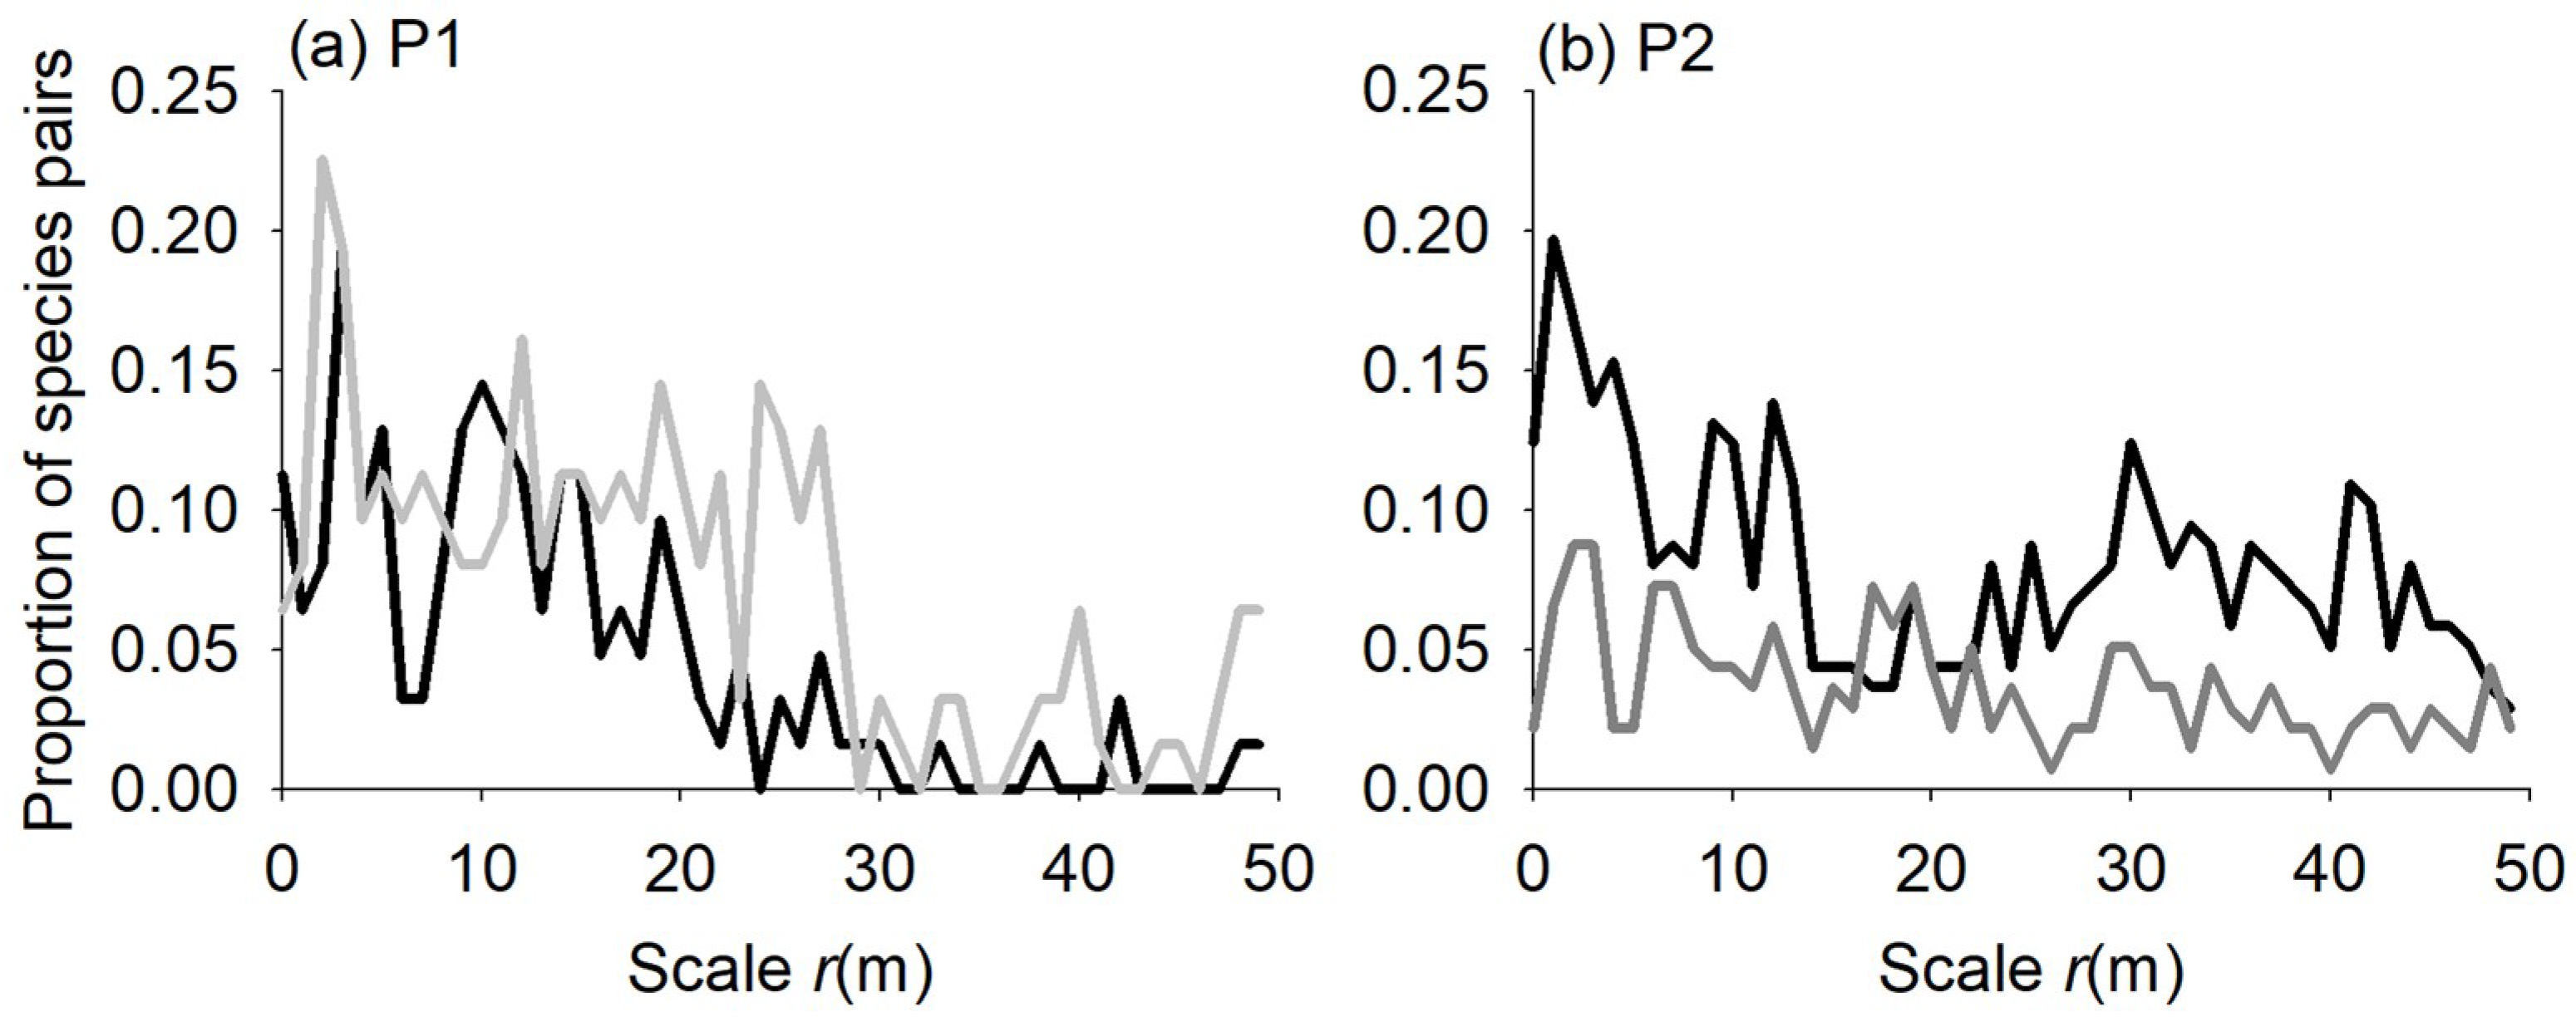
3.2. Species Associations

For species associations, 600 species pairs were tested for P1 (Figure 3a) and 756 species pairs were tested for P2 (Figure 3b). Most of the species pairs (i.e., 89.7% in P1 and 81.8% in P2) showed no significant deviation from the null models (independence) for species associations at p ≤ 0.05. In P1, 12 species pairs (2%) were positively associated (attraction) on scales smaller than 30 m, and 14 species pairs (2.3%) were negatively associated (repulsion) on these scales at p ≤ 0.05 (Figure 3a). The number of repulsions were higher than that of attractions for all scales up to 50 m. Positive associations were found in species such as P. nemoralis, Alangium ridleyi King, Vitex trifolia L., M. kurzii, Litsea vang Lecomte, E. sinensis, C. indica, V. odorata, O. balansae, and C. obtusifolium. Negative associations were found in species pairs of M. kurzii vs. (G. pierrei, P. annamensis, and V. trifolia); C. indica vs. (P. nemoralis, Koilodepas hainanense (Merr.) Croizat and C. obtusifolium).
In P2, the number of positive associations, with 23 species (3%) pairs balanced that of negative associations, with 12 species (1.5%) combinations for all scales from 0–50 m (Figure 3b). Positive associations were found mainly for C. obtusifolium, B. tonkinensis, P. annamensis, O. balansae, and Symplocos laurina (Retz.) Wall. Ex G. while negative associations were observed in P. nemoralis, M. kurzii, Canarium album (Lour.) DC., and Gironniera Subaequalis Planch.

3.3. Individual Species Area Relationship

ISAR analyses for 25 focal species of P1 were performed and 10 species (40%) were significantly different from the null model of CSR at p ≤ 0.05 (Figure 4a,b). The results showed a similar trend, where 10 focal species had up to 40 different species within neighborhoods of 40 m; species identity slightly differed on larger scales up to 50 m (Figure 4a). Among these, the number of accumulators (for example, B. tonkinensis, T. javanica, P. annamensis, Amoora dasyclada C.Y. Wu, and O. balansae) dominated and dropped linearly from 0–10 m and slowly decreased on larger scales, while that of repellers (such as M. kurzii, Syzygium wightianum Wall. Ex Wig.&Arn., Garcinia oblongifolia Chanp. Ex Benth., and V. odorata) dominated on spatial scales of 25–50 m (Figure 4b).
In P2, 28 focal species were analyzed, and 10 species (35.7%) showed a significant departure from the null model of IPP at p ≤ 0.05 under the GoF test (Figure 4c,d). The ISARs for these 10 focal species were similar to the explored 45 different species neighborhoods (Figure 4c). The number of accumulators (such as T. javanica, C. obtusifolium, P. annamensis, G. pierrei, S. laurina, A. dasyclada, E. roxburghiana, P. cerasoides, and Madhuca pasquieri (Dubard) H.J. Lam) was slightly higher than that of repellers (e.g, M. kurzii) on scales up to 10 m (Figure 4d). These numbers decreased linearly up to the scale of 25 m, and became lower than that of repellers on larger scales of 35–50 m.

4. Discussion

We performed spatial pattern analysis for 53 intra- and 1056 interspecific associations respectively, within two fully mapped 2-ha plots of tropical evergreen forest stands. One methodological challenge was to separate first-order effects (e.g., caused by environmental heterogeneity) and second-order effects (e.g., small-scale tree–tree interactions), in order to identify appropriate biological interpretations of the underlying mechanisms or processes regulating spatial association of tree species in space. To deal with this challenge, we applied different null models according to different environmental conditions (less homogeneity in P2). Our findings are consistent with the general hypotheses that (1) stochastic effects dilute species associations in highly diverse communities, making them weak on average, and (2) non-random patterns occur mainly on local neighborhood scales.
Dominance of diversity accumulators occurred on small scales, while diversity repellers were more frequent on larger scales up to 50 m. The assemblage of species richness varied up to scales of 30 m. M. kurzii was found to be a diversity repeller in both investigated plots; this finding was also in accordance with results of species association analyses.

4.1. Species Distribution Patterns

Aggregation is a common distribution pattern of tree species in nature, particularly in species-rich tropical forests [2,25,26]. Aggregated distributions may result mainly from limited seed dispersal [27] and/or environmental heterogeneity [2,4]. In this study, the null models of CSR and IPP were applied to P1 and P2, respectively, to control for a variety of habitat conditions in space. The results showed that aggregated patterns were dominant in both study sites with 48% in P1 and 21% in P2. T. javanica, M. kurzii and E. sinensis were aggregated in both plots, while segregated patterns were found mainly in P2 on scales larger than 20 m, e.g., spatial arrangement of M. kurzii and E. sinensis. These species are shade intolerant (Table A1), having similar habitat requirements [28]; therefore, they showed similar spatial distributions. Debski et al. [29] concluded that species sharing a habitat preference exhibit similar distribution patterns. In our study, the evidence suggests that on small scales, dispersal limitation could be one of the main drivers of species aggregation, while environmental variability could regulate species distribution on larger scales by separating conspecific trees in space [1,2]. Moreover, a wider extent of the clumped patterns of tree species in P1 than P2, and the occurrence of a dispersed pattern in P2, suggest effects of scale separation on scales of 30 m.

4.2. Species Associations

Low numbers of non-neutral interactions between tree species were observed in both plots. In comparison, positive associations were more frequent in P2 than P1, while negative associations exhibited the opposite trend. The effect of scale separation by habitat heterogeneity on interspecies associations occurred on scales of 30 m. It is not surprising that only about 5% of all species–species pairs where significantly non-neutral (i.e., attraction or repulsion) at p ≤ 0.05 in this study. These results can be interpreted as equilibrated neutral bivariate patterns in the spatial distribution of tree species. This argument is in accordance with the unified neutral theory [15], which hypothesizes that species may be functionally identical and drift randomly in abundance. In addition, this viewpoint is also supported by [11], wherein the authors found only 5.8% of non-independent species associations in a Dipterocarp forest, Sri Lanka, and 5.3% in a tropical forest, Barro Colorado Island. In our study, the percentage of non-neutral species interactions is quite similar, regardless of environmental variability between sampled plots. Moreover, negative interactions decreased and disappeared on scales larger than 30 m, showing that scale separation matched environmental heterogeneity. Hai et al. [2] also found that most of the tree–tree interactions occurred on scales smaller than 30 m in a tropical evergreen forest of Vietnam. Hurtt and Pacala [30] argued that if demographic heterogeneity is strong, it will not allow similar or identical responses at the species level, which would leave neighborhood patterns as predicted by coexistence theory. In this study, under habitat variability in P2, competitive interactions between species were prevented, and that could be a consequence of dispersal limitation, and because the best-adapted species are not always able to colonize newly available gaps. In addition, past logging activities could also affect the low frequency of non-neutral interactions between tree species. These findings also support our hypothesis of scaling on local neighborhood interactions.

4.3. Individual Species—Area Relationship

The presence of diversity-accumulating species suggests that negative intraspecific interactions were stronger than negative interspecific interactions [31], and negative density dependence within species was stronger than that between species. The negative density dependence within species is an ecological process which is considered fundamental to maintaining species diversity in tropical forests [16], while also supporting the segregation hypothesis [32]. Wiegand et al. [4] argued that a species with a highly aggregated distribution will be surrounded by more conspecific individuals and fewer heterospecific individuals than expected on average; therefore, it would appear as a diversity repeller. Conversely, a segregated species may be surrounded by more heterospecific individuals and would appear as a diversity accumulator.
Using data from the bivariate spatial patterns of 30 species in two contrasting environmental habitats, we found that about 40% of the species effected local tree diversity on spatial scales below 30 m. The results from ISAR analysis showed assemblage of species richness on local scales smaller than 25 m in both study plots, which also agreed with uni- and bivariate point pattern analyses of species associations. This confirmed that species–species interactions in the studied forest stands operate only in local plant neighborhoods on scales smaller than 30 m. Our finding is also similar to that of previous studies in tropical forests [4,10,33], where neighborhood effects responded within a distance of 20–30 m.
Environmental conditions were considered as homogeneous in P1; the diversity accumulators decreased while the diversity repellers increased with increasing spatial scales, emphasizing a clear effect of limited dispersal. Under habitat conditions of variability in P2, both diversity accumulators and repellers decreased with increasing spatial scales, showing mixed effects of limited dispersal and habitat variability. Moreover, neutral diversity patterns can be explained by ‘balanced’ species–species interactions, as are characteristic of species-rich forests [7]; therefore, this finding is in accordance with a low-significance departure from the null models of species–species interactions in our study.

5. Conclusions

The general hypotheses—that stochastic effects dilute species associations in highly diverse communities making them weak on average and that non-random patterns occur mainly on local neighborhood scales—are confirmed by our findings. Intra-species distribution patterns at local scales may be regulated by dispersal limitation and habitat variability. On small scales, dispersal limitation was the main driver of species aggregation. However, environmental variability regulated species distribution on larger scales by separating conspecific trees in space. Overall, low numbers of non-neutral interactions (i.e., attraction or repulsion) between tree species were observed in both plots, mainly due to tree performance that equilibrates and produces neutral bivariate patterns in the spatial distribution of tree species. Individual species-area relationship analysis confirmed that species–species interactions operate only in local plant neighborhoods on scales smaller than 30 m. Moreover, individual species-area relationships are also affected by the mixed effects of limited dispersal and habitat segregation, and occur on local neighborhood scales. For further studies, the effects of topographical variables on tree species associations and their spatial autocorrelations with forest stand properties should be considered for a comprehensive assessment.

Author Contributions

H.H.N., V.D.P., X.T.L. and T.D.B. conceived and designed the experiment and collected the data; H.H.N., V.D.P., X.T.L. and T.D.B. analyzed the data; H.H.N., Y.E., V.D.P., X.T.L. and T.D.B. and I.C.P. wrote the paper.

Funding

This research was funded by Vietnam National Foundation for Science and Technology Development (NAFOSTED) under grant number 106-NN.06-2016.22.

Acknowledgments

We also would like to thank Thorsten Wiegand that kindly made Programita software available for this work and guided data analysis as well as our team work including Ngoc Bac Nguyen, Van Cuong Kim, Van Thoai Bui, Quoc Khanh Truong, Tran Manh Pham and Ngoc Tra Nguyen for data collection. We are grateful for constructive comments and suggestions of two anonymous reviewers and subject editor, which were really helpful to improve the manuscript.

Conflicts of Interest

The authors declare no conflict of interest.

Appendix

Table A1. Characteristics of common species in both study plots. N—number of individuals, IVI—Important Value Index, (relative abundance + relative basal area)/2, expressed as percentage proportion. DBH—Diameter at Breast Height (mean ± Standard deviation).
NoTree SpeciesP1P2Shade Tolerance
NDBH (cm) IVI (%)NDBH (cm)IVI (%)
1Garuga pierrei Guillaumin28210.08 ± 10.898.98523211.30 ± 13.267.72Tolerant
2Tarrietia javanica Blume3835.62 ± 6.397.2853304.52 ± 3.585.14Intolerant
3Ormosia balansae Drake13817.05 ± 12.977.2618714.75 ± 10.816.605Intolerant
4Bursera tonkinensis Guillaumin 3846.15 ± 4.166.722536.67 ± 4.124.41Medium
5Paviesia annamensis Pierre.2409.18 ± 7.646.0252396.94 ± 4.864.325Intolerant
6Litsea glutinosa (Loureiro) C.B. Rob. 2298.06 ± 6.214.9652648.26 ± 6.705.495Intolerant
7Castanopsis indica (Rox. ex Lin.) A.16810.21 ± 8.274.65-- Intolerant
8Polyalthia nemoralis Aug.DC.3035.02 ± 1.774.582445.53 ± 1.883.78Intolerant
9Syzygium wightianum Wall. ex Wig. & Arn. 1799.36 ± 7.044.4058111.56 ± 8.171.545Intolerant
10Erythrophloeum fordii Oliver6318.52 ± 15.353.963619.33 ± 21.972.475Medium
11Mallotus kurzii Hook.f.2654.01 ± 0.983.761143.71 ± 0.731.63Intolerant
12Amoora dasyclada C.Y. Wu1487.99 ± 6.733.285968.89 ± 6.932.08Medium
13Cinnamomun obtusifolium Nees10010.71 ± 9.253.00526713.01 ± 10.598.51Intolerant
14Vatica odorata (Griff.) Symington4817.67 ± 15.902.9454823.46 ± 16.733.24Intolerant
15Gironniera Subaequalis Planch 929.71 ± 6.652.2713711.19 ± 9.283.73Medium
16Endospermun sinensis Benth.5411.77 ± 13.182.148321.67 ± 13.334.63Intolerant
17Sindora cochinchinensis auct. non Baill.4116.52 ± 13.442.1253315.77 ± 14.192.77Intolerant
18Garcinia oblongifolia Chanp. ex Benth.1216.23 ± 4.082.115676.22 ± 3.481.115Tolerant
19Canarium album (Lour.) DC.4615.01 ± 8.881.7915511.03 ± 6.043.685Intolerant
20Koilodepas hainanense (Merr.) Croizat1045.83 ± 2.611.685808.41 ± 4.521.545Tolerant
21Cassine glauca (Rottb.) Kuntze748.41 ± 5.511.59898.69 ± 7.661.97Tolerant
22Vitex trifolia L. 3314.83 ± 9.631.305-- Intolerant
23Litsea vang Lecomte716.54 ± 3.301.27768.72 ± 4.671.5Intolerant
24Symplocos laurina (Retz.) Wall. ex G. 559.31 ± 5.611.25514511.81 ± 6.863.715Intolerant
25Alangium ridleyi King407.89 ± 5.190.81499.10 ± 6.271.045Tolerant
26Engelhardtia roxburghiana Lindl.-- 6328.78 ± 11.914.845Tolerant
27Antheroporum pierrei Gagnep-- 4719.81 ± 7.392Intolerant
28Knema pierrei Warb.-- 4610.05 ± 4.860.99Tolerant
29Polyalthia cerasoides (Roxb.) Bedd.-- 3325.59 ± 20.801.4Intolerant
30Madhuca pasquieri (Dubard) H.J. Lam-- 3214.69 ± 9.761.07Medium
Figure A1. Spatial patterns of all trees with DBH ≥10 cm in two plots P1 and P2 using univariate pair-correlation g-function (a,c,e,g) and L-function (b,d,f,h). Null models were CSR (ab,ef) and IPP (cd,gh) with R = 50 m. In the P1, the g-function and L-function showed no large scale departure from the null model of CSR (a,b) indicating environmental homogeneity. In the P2, the g-function was significant (>1) for scales larger than 10 m (e), the L-function showed a clear departure from scales r > 25 m and did not approach value 0 (f) under the null model of CSR. Moreover, the spatial arrangement of trees >10 cm fitted very well under the null model of IPP with R = 50 m (cd,gh) when analyzed by the g- and L-functions. These evidences significantly exhibited large scale homogeneity at P1 and heterogeneity at P2. Note: L-function is a transformation of Ripley’s K-function, L(r) = (K(r)/π)0.5r. The g pair-correlation function is the derivative of the K function, g(r) = K’(r)/(2πr) and r is radius of the circle from a randomly chosen tree (please see more details about K function in [23]).
Forests 09 00615 g0a1

References

  1. Hai, N.H.; Wiegand, K.; Getzin, S. Spatial distributions of tropical tree species in northern Vietnam under environmentally variable site conditions. J. For. Res. 2014, 25, 257–268. [Google Scholar] [CrossRef]
  2. Hai, N.H.; Uria-Diez, J.; Wiegand, K. Spatial distribution and association patterns in a tropical evergreen broad-leaved forest of north-central Vietnam. J. Veg. Sci. 2016, 27, 318–327. [Google Scholar]
  3. Hubbell, S.P. Tree Dispersion, Abundance, and Diversity in a Tropical Dry Forest. Science 1979, 203, 1299–1309. [Google Scholar] [CrossRef] [PubMed]
  4. Wiegand, T.; Gunatilleke, S.; Gunatilleke, N. Species associations in a heterogeneous Sri Lankan dipterocarp forest. Am. Nat. 2007, 170. [Google Scholar] [CrossRef] [PubMed]
  5. Getzin, S.; Wiegand, T.; Wiegand, K.; He, F. Heterogeneity influences spatial patterns and demographics in forest stands. J. Ecol. 2008, 96, 807–820. [Google Scholar] [CrossRef] [Green Version]
  6. Hubbell, S.P. Neutral theory in community ecology and the hypothesis of functional equivalence. Funct. Ecol. 2005, 19, 166–172. [Google Scholar] [CrossRef] [Green Version]
  7. Wiegand, T.; Savitri Gunatilleke, C.V.; Nimal Gunatilleke, I.A.U.; Huth, A. How individual species structure diversity in tropical forests. Proc. Natl. Acad. Sci. USA 2007, 104, 19029–19033. [Google Scholar] [CrossRef] [PubMed] [Green Version]
  8. Tsai, C.H.; Lin, Y.C.; Wiegand, T.; Nakazawa, T.; Su, S.H.; Hsieh, C.H.; Ding, T.S. Individual Species-Area Relationship of Woody Plant Communities in a Heterogeneous Subtropical Monsoon Rainforest. PloS ONE 2015, 10. [Google Scholar] [CrossRef] [PubMed]
  9. McGill, B.J. Towards a unification of unified theories of biodiversity. Ecol. Lett. 2010, 13, 627–642. [Google Scholar] [CrossRef] [PubMed] [Green Version]
  10. Uriarte, M.; Condit, R.; Canham, C.D.; Hubbell, S.P. A spatially explicit model of sapling growth in a tropical forest: does the identity of neighbours matter? J. Ecol. 2004, 92, 348–360. [Google Scholar] [CrossRef] [Green Version]
  11. Wiegand, T.; Huth, A.; Getzin, S.; Wang, X.; Hao, Z.; Savitri Gunatilleke, C.V.; Nimal Gunatilleke, I.A.U. Testing the independent species’ arrangement assertion made by theories of stochastic geometry of biodiversity. Proc. R. Soc. B 2012, 279, 3312–3320. [Google Scholar] [CrossRef] [PubMed]
  12. Wang, X.; Wiegand, T.; Kraft, N.J.B.; Swenson, N.G.; Davies, S.J.; Hao, Z.; Howe, R.; Lin, Y.; Ma, K.; Mi, X.; et al. Stochastic dilution effects weaken deterministic effects of niche-based processes in species rich forests. Ecology 2016, 97, 347–360. [Google Scholar] [CrossRef] [PubMed]
  13. Hubbell, S.P.; Foster, R.B. Biology, Chance, and History and the Structure of Tropical Rain Forest Tree Communities. In Community Ecology; Diamond, J., Case, T.J., Eds.; Harper and Row Publishers: New York, NY, USA, 1986; pp. 314–329. [Google Scholar]
  14. Hubell, S. P. Neutral Theory and the Evolution of Ecological Equivalence. Ecology 2006, 87, 1387–1398. [Google Scholar] [CrossRef]
  15. Hubbell, S.P. The Unified Neutral Theory of Biodiversity and Biogeography (MPB-32); Princeton University Press: Princeton, NJ, USA, 2001. [Google Scholar]
  16. Wright, J.S. Plant diversity in tropical forests: A review of mechanisms of species coexistence. Oecologia 2002, 130, 1–14. [Google Scholar] [CrossRef] [PubMed]
  17. Harms, K.E.; Condit, R.; Hubbell, S.P.; Foster, R.B. Habitat associations of trees and shrubs in a 50-ha neotropical forest plot. J. Ecol. 2001, 89, 947–959. [Google Scholar] [CrossRef] [Green Version]
  18. John, R.; Dalling, J.W.; Harms, K.E.; Yavitt, J.B.; Stallard, R.F.; Mirabello, M.; Hubbell, S.P.; Valencia, R.; Navarrete, H.; Vallejo, M.; et al. Soil nutrients influence spatial distributions of tropical tree species. Proc. Natl. Acad. Sci. USA. 2007, 104, 864–869. [Google Scholar] [CrossRef] [PubMed] [Green Version]
  19. Rayburn, A.P.; Wiegand, T. Individual species–area relationships and spatial patterns of species diversity in a Great Basin, semi-arid shrubland. Ecography 2012, 35, 341–347. [Google Scholar] [CrossRef]
  20. Stoyan, D.; Stoyan, H. Random Shapes and Point Fields: Methods of Geometrical Statistics; John Wiley & Sons: Chichester, UK, 1994. [Google Scholar]
  21. Wiegand, T.; Moloney, K.A. Handbook of Spatial Point-Pattern Analysis in Ecology; Chapman and Hall/CRC: Boca Raton, FL, USA, 2014. [Google Scholar]
  22. Punchi-Manage, R.; Wiegand, T.; Wiegand, K.; Getzin, S.; Huth, A.; Savitri Gunatilleke, C.V.; Nimal Gunatilleke, I.A.U. Neighborhood diversity of large trees shows independent species patterns in a mixed dipterocarp forest in Sri Lanka. Ecology 2015, 96, 1823–1834. [Google Scholar] [CrossRef] [PubMed]
  23. Wiegand, T.; Moloney, K.A. Rings, circles, and null-models for point pattern analysis in ecology. Oikos 2004, 104, 209–229. [Google Scholar] [CrossRef] [Green Version]
  24. Loosmore, N.B.; Ford, E.D. Statistical Inference Using the G or K Point Pattern Spatial Statistics. Ecology 2006, 87, 1925–1931. [Google Scholar] [CrossRef]
  25. Itoh, A.; Yamakura, T.; Ogino, K.; Lee, H.S.; Ashton, P.S. Spatial distribution patterns of two predominant emergent trees in a tropical rainforest in Sarawak, Malaysia. Plant Ecol. 1997, 132, 121–136. [Google Scholar] [CrossRef]
  26. Plotkin, J.B.; Potts, M.D.; Leslie, N.; Manokaran, N.; LaFrankie, J.; Ashton, P.S. Species-area Curves, Spatial Aggregation, and Habitat Specialization in Tropical Forests. J. Theor. Biol. 2000, 207, 81–99. [Google Scholar] [CrossRef] [PubMed]
  27. Dalling, J.W.; Hubbell, S.P.; Silvera, K. Seed dispersal, seedling establishment and gap partitioning among tropical pioneer trees. J. Ecol. 1998, 86, 674–689. [Google Scholar] [CrossRef] [Green Version]
  28. Chinh, N.N.; Dung, V.V.; Dai, T.D.; Dao, N.K; Hien, N.H; Lien, T.K. Vietnam Forest Trees; Agricultural Publishing House: Hanoi, Vietnam, 1996. [Google Scholar]
  29. Debski, I.; Burslem, D.F.R.P.; Palmiotto, P.A.; Lafrankie, J.V.; Lee, H.S.; Manokaran, N. Habitat Preferences of Aporosa in Two Malaysian Forests: Implications for Abundance and Coexistence. Ecology 2002, 83, 2005–2018. [Google Scholar] [CrossRef]
  30. Hurtt, G.C.; Pacala, S.W. The consequences of recruitment limitation: reconciling chance, history and competitive differences between plants. J. Theor. Biol. 1995, 176, 1–12. [Google Scholar] [CrossRef]
  31. Comita, L.S.; Hubbell, S.P. Local neighborhood and species’ shade tolerance influence survival in a diverse seedling bank. Ecology 2009, 90, 328–334. [Google Scholar] [CrossRef] [PubMed]
  32. Pacala, S.W.; Levin, S.A. Biologically Generated Spatial Pattern and the Coexistence of Competing Species. In Spatial Ecology: The Role of Space in Population Dynamics and Interspecific Interactions (MPB-30); Tilman, D., Kareiva, P., Eds.; Princeton University Press: Princeton, NJ, USA, 1997; pp. 204–232. [Google Scholar]
  33. Hubbell, S.P.; Ahumada, J.A.; Condit, R.; Foster, R.B. Local neighborhood effects on long-term survival of individual trees in a Neotropical forest. Ecol. Res. 2001, 16, 859–875. [Google Scholar] [CrossRef]
Figure 1. Distribution maps of investigated trees on the two 2-ha plots P1 (a) and P2 (b) with 10 m contour lines of altitude.
Forests 09 00615 g001
Figure 2. Significant conspecific associations analyzed by the univariate pair-correlation function g11(r) from 199 Monte Carlo simulations under the null models of CSR at P1 (a) and IPP at P2 (b) at p values ≤ 0.05. Black lines indicate aggregation, grey lines indicate regularity.
Forests 09 00615 g002
Figure 3. Significant heterospecific associations analyzed by the bivariate pair-correlation function g12(r) from 199 Monte Carlo simulations at p values ≤ 0.05. The null models were independence at P1 (a), and pattern 1 fixed and pattern 2 randomized by inhomogeneous Poisson process at P2 (b). Black lines indicate attraction, grey lines indicate repulsion.
Forests 09 00615 g003
Figure 4. Results of ISAR analyses from 199 Monte Carlo simulations under null models of CSR in P1 (ab) and IPP in P2 (cd); significant at p ≤ 0.05.
Forests 09 00615 g004
Table 1. Basic description of two sampled plots.
CharacteristicPlot P1Plot P2
Elevation (m): mean ± standard deviation (min–max)134 ± 6.3
(119–148)
160 ± 11.1
(137–184)
Slope (degree):mean ± standard deviation (min–max)20 ± 6.6
(5–40)
26 ± 7.5
(5–45)
Number of individuals39363731
Total basal area (m2)48.464.6
DBH (cm) (mean, min–max)8.6 (2.5–79.6)10.3 (2.5–95.5)
Number of species6152
Number of species with one individual137
Number of species with ≥30 individuals2528
Number of shared species4747
Number of individuals from shared species37323698

