Article

Groundwater Depth and Soil Properties Are Associated with Variation in Vegetation of a Desert Riparian Ecosystem in an Arid Area of China

1
Key Laboratory of Plant Resources, West China Subalpine Botanical Garden, Institute of Botany, Chinese Academy of Sciences, Xiangshan, Beijing 100093, China
2
College of Resources and Environment, University of Chinese Academy of Sciences, Beijing 100049, China
*
Author to whom correspondence should be addressed.
Forests 2018, 9(1), 34; https://doi.org/10.3390/f9010034
Submission received: 23 November 2017 / Revised: 10 January 2018 / Accepted: 12 January 2018 / Published: 15 January 2018
(This article belongs to the Special Issue Forest Sustainable Management)

Abstract

:
Groundwater is a major driving force for plant community distribution in arid areas worldwide. Although it is well known that groundwater has a significant impact on soil and vegetation, there is little information on how groundwater depth affects soil and vegetation in an arid inland basin desert riparian ecosystem. Therefore, quantitative analysis of the relationships among groundwater depth, soil properties and plant community distribution is necessary. A desert riparian ecosystem in the lower reaches of the Heihe River in an arid area of Northwest China was used to determine quantitative relationships among groundwater depth, soil and vegetation. Groundwater depth significantly increased with increased distance from the river. Soil and vegetation characteristics showed a significant trend with increasing groundwater depth. With increasing groundwater depth, soil water content, soil total nitrogen, soil total carbon, soil available phosphorus and soil available potassium decreased, while the soil bulk density and soil carbon:nitrogen (C:N) ratio increased. Soil pH and soil electrical conductivity followed quadratic function relationships with groundwater depth. Species richness, aboveground biomass, community coverage, community height, foliage projective cover and leaf area index all significantly decreased with increased groundwater depth. Groundwater depth and soil were associated with vegetation variance, explaining 85.8% of the vegetation variance. Groundwater depth was more important in explaining vegetation variance than soil properties (soil bulk density) and soil pH. Our observations indicate that changes in groundwater depth would have a significant influence on desert riparian forest vegetation, and that maintaining appropriate groundwater depth is necessary to preserve the riparian ecosystem.

1. Introduction

Water is considered a key factor affecting ecosystem structure and function, particularly in arid and semiarid regions where a tight coupling exists between ecosystem productivity, surface energy balance and water source availability [1]. Water availability is the main driver of productivity and sustainability of many terrestrial ecosystems [2,3]; alterations in hydrology can have significant impacts on vegetation and soil properties [4,5]. In arid regions, water deficit can lead to serious vegetation degradation; interestingly, desert plants could maintain stable eco-physiological activity under conditions of seasonal or even chronic drought in extremely arid environments [6]. Both direct and indirect water availability or uptake from groundwater has been suggested as a potential mechanism to explain the drought tolerance of desert plants [6,7]. For species such as Prosopis tamarugo Phil., survival in arid ecosystems depends exclusively on the capacity to extend roots to the groundwater in the virtually rainless Atacama Desert in Chile [8]. In groundwater-dependent ecosystems, groundwater represents a permanent source of water for the local plant community [9,10] and exerts strong control over the plant community composition, life histories, physiological properties and resource availability, thereby impacting eco-hydrological processes [9,11,12]. In fact, the relationship of groundwater fluctuations with vegetation and soil properties is complicated, representing a dynamic balance between groundwater, soil, and vegetation [13,14]. To understand such complex relationships is of the utmost importance for the management and restoration of these ecosystems.
The desert riparian ecosystem, a typical groundwater-dependent system, is the main conservation system for ecological stability and biodiversity of rivers in arid regions [15,16,17]. River flow is currently recognized as a major driver for most processes occurring in fluvial landscapes [18], and the interactions with groundwater contribute to the determination of form and functioning of riverine ecosystems [19]. In arid and semiarid catchments, many studies have reported the relationships between vegetation and groundwater in inland river basins [11,17,20]. When compared with the groundwater, soil plays an important role in providing physical support and regulating nutrient and water availability for plant growth. Previous studies reported that desert riparian vegetation restoration was threatened by distribution differences in soil salinization [21,22], indicating that soil physical and chemical properties affect the growth of vegetation in desert riparian forest. Some studies have indicated that the spatial variability of the soil physical and chemical properties is likely to become an important selective force in shaping plant adaptation strategies and vegetation distribution patterns [23,24]. In addition, plant–soil feedback plays an important role in affecting plant community structure [13]. Therefore, it is necessary to improve the understanding of the relationship between vegetation, soil and changes in groundwater depth in arid regions.
Water discharge to the lower reaches of the Heihe River, a typical arid region inland river in Northwest China, has decreased by 40% as a result of the increasing water consumption in the upper and middle reaches of the river during the last five decades [25], and the desert riparian forest ecosystem in the lower reaches has been significantly influenced [26]. In the lower reaches of the Heihe River, the Gobi and desert steppe are the primary landscapes, with riparian vegetation accounting for less than 10% of the area of the lower reaches [27]. However, the riparian forest plays an irreplaceable role in the subsistence and development of the oasis along rivers and functions as an important ecological defense against sandstorms in Northwest China [24]. Most parts of the lower reaches eventually peter out and the tail-end lakes such as West and East Juyan lakes have been dried up since 1961 and 1992, respectively. This has directly resulted in declining groundwater levels and the riparian forest being dominated by Populus euphratica Oliv. and Tamarix spp. that is severely affected by drought stress and has faced extinction in recent years [25,28]. For example, since the 1950s, the area covered by P. euphratica has decreased from 50,000 to 26,000 ha [27]; stands of P. euphratica have been reduced to a small fraction of their original area and are now only scattered along the banks of the main stream and the riparian forest in Ejin oasis has experienced severe degradation [25,27]. The changing hydrological environment has become one of the most challenging problems in the process of conservation and restoration of the lower reaches of the riparian forest ecosystem [28].
In 2000, an annual fixed water supply was implemented by the ecologically emergent water project to alleviate the riparian vegetation and soil degradation [15,26,28]. Some studies reported that the influence of ecological water conveyance may reach as far as 2000 m from the river [29,30]. After the application of this water diversion, the lower reaches of the river flow stabilized in the growing season of each year; groundwater depth remains below 4 m even at a distance of 3800 m from the river channel and retains a small fluctuation in Ejin oasis at a level of approximately 3 m [26]; groundwater has been gradually increasing and the riparian vegetation status has changed correspondingly [31]. Water diversion-induced changes in groundwater along the river are likely to be the most important factor potentially affecting vegetation and soil properties of the desert riparian ecosystem [32]. However, the responses of riparian vegetation and soil properties to groundwater change at the local scale were rarely discussed, and empirical studies on the relationships between soil and plant communities were still limited in this region [20].
Eleven sites with natural vegetation at different distances perpendicular to the lower reaches of the Heihe River were used to understand the soil and vegetation changes with groundwater depth. The study aimed to (1) evaluate the impact of changes in groundwater depth on soil physical and chemical properties; (2) evaluate the impact of changes in groundwater depth on the plant community; (3) evaluate how soil properties, especially saline-alkali properties, influence vegetation in a natural desert riparian ecosystem along a river. These findings could be useful to manage natural desert riparian ecosystems.

2. Materials and Methods

2.1. Study Area and Site Description

The Heihe River basin (Figure 1) is the second largest inland river basin in Northwest China, with a length of 821 km in its main stream and a catchment area of 14.29 × 10⁴ km2. The river originates from the middle part of the Qilian Mountains, on the northern Tibet Plateau, then flows through Qinghai Province, Gansu Province and the Inner Mongolia Autonomous Region, and terminates at the north end of Juyan Lake in Ejin County, Inner-Mongolia. The Heihe River basin has a varied topography, with elevation between about 900 and 5500 m, and the integrated topographic landscape can be divided into the glaciology and geocryology zone, the alpine vegetation zone, the piedmont oasis zone and the desert zone; the desert zone accounts for more than 75% of the total land area [27]. The upper reaches are covered with thick vegetation and have well-developed glaciology and geocryology, which means they qualify as the main runoff generating region [33]. The middle and lower reaches have a great deal of farmland and desert, which has become the primary runoff consumption region [25].
The study was conducted in a typical desert riparian ecosystem in an area near the county of Ejin, located in the lower reaches of the Heihe River (42°06′2.58″–42°06′51.78″ N, 100°59′13.44″–101°03′7.38″ E, 921–925 m a.s.l.). The region is characterized by the typical continental arid climate, which is dominated by a warm-humid summer and cold-dry winter. The mean annual precipitation is 37.4 mm, of which the majority (more than 75%) falls from July to August, and pan evaporation is about 100 times greater than the precipitation [34]. The mean annual temperature is 8.9 °C, with the warmest and coldest mean monthly temperatures of 27 °C for July and −11.4 °C for January, respectively. The regional hydrogeological structure is controlled by Quaternary geological conditions, mainly composed of the multi-water bearing beds structure with an upper phreatic water layer and lower confined water layers [35]. Groundwater recharges mainly from precipitation and the Heihe River; groundwater discharge is affected by vegetation transpiration, soil evaporation, and artificial exploitation [35]. The zonal soil type is gray-brown desert soil, with forest-shrub meadow soil derived from fluvial sediments in the riparian ecosystem. Across the river gradient, soil types change from loam soil to sandy soil. The soil grain sizes ≤0.002 mm account for 1.3–15% in the soil layer of 0–20 cm between 0 and 3000 m from the river channel; the grain sizes (0.002–0.02 mm) account for 12.7–47.6%; the grain sizes (0.02–2 mm) account for 37.36–85.46%; the soil grain sizes >2 mm account for 0.54–4.52% [24,35]. The vegetation, being perpendicular to the rivers, generally shifts from riparian forest to desert scrub. Desert riparian forests distribute along the river bank, with the dominant vegetation including P. euphratica, Tamarix ramosissima Lebed., Sophora alopecuroides Linn., Lycium ruthenicum Murr. and Karelinia caspica (Pall.) Less. Sparse and drought-tolerant desert species are mainly distributed in the Gobi desert, with the dominant vegetation including Reaumuria songarica (Pall.) Maxim. and Calligonum mongolicum Turcz. [26,36].

2.2. Experimental Design and Data Collection

The desert riparian vegetation is the main component of the Ejin Oasis. Some studies have reported that the spatial distribution extent of the riparian zone is difficult to precisely delineate because of the influence of landform heterogeneity and groundwater provided from the river [24,37]. In this hyperarid region, desert riparian forests are distributed between 0–3200 m from the river channel due to the ecological water conveyance project [24,26]. Our study sites covered the entire distribution range of desert riparian vegetation.
In the lower reaches of the Heihe River, river runoff was mainly from the upper and middle water conveyance. In order to maintain the groundwater level and ecosystem stability of the lower reaches, ecological water conveyance is implemented in April, July, August, September and November through Dongfeng reservoir in the Langxin mountain [38]. The river may dry up in other months due to the termination of water conveyance. Our field survey was conducted at the end of July 2015 after 20 days of ecological water conveyance. Groundwater depth stabilized in the growing season of each year and the flooding only affects areas within 100 m of the river channel [26,35]. The region belongs to an extremely arid climate area and there was no rain two weeks before our observations. In our study, 11 sampling sites were prepared that were generally perpendicular to the lower reaches of the Heihe River, located at 300, 800, 1300, 2200, 2450, 2700, 2950, 3200, 3700, 4000 and 4500 m from the river channel (Table 1). At each site, based on the community type, plots of different sizes were prepared: 5 m × 5 m for shrub communities, with three replicates for each site, and 1 m × 1 m for grass communities, with three replicates for each shrub plot. In the shrub plots, species composition, coverage, leaf area index (LAI), aboveground biomass, basal diameter and height and width of canopy were recorded. In the grass plots, the number of species, coverage, aboveground biomass and height were recorded. Aboveground biomass was determined by the harvest method; biomass was oven-dried at 80 °C to constant weight, and then the weight was recorded. The geographic coordinates and elevation of each plot were recorded using a global positioning system (GPS). Foliage projective cover (FPC) was measured with a simple FPC measuring tube, with three replicates. Along a 30-m sampling line, the interval for observation points was 0.5 m; FPC readings were taken from the proportion of green leaves observed through cross-wires embedded in the measuring tube [39]. LAI was measured with a LAI-2200 Plant Canopy Analyzer (LI-COR, Lincoln, NE, USA), by using one sensor with a 90° view cap. LAI readings were taken from the results calculated by subtracting the canopy area index (obtained during leafless periods) from the total plant area index [40,41].
At each site, intact soil cores were collected using a cutting ring (volume of 100 cm3) from five soil depths (0–10, 10–20, 20–30, 30–40 and 40–50 cm) in each shrub plot after removing any rocks and litter, with three replicates. Soil samples were oven dried at 105 °C to a constant weight to determine the gravimetric soil water content. Soil bulk density was measured using a stainless steel cutting ring (100 cm3) by the cutting ring method at 0–10, 10–20, 20–30, 30–40 and 40–50 cm depths in each sampling plot. Soil samples were air-dried and then passed through a 2-mm sieve. Soil pH and electrical conductivity (EC) were measured in 1:1 soil:water and 1:5 soil:water suspensions (Multiline F/SET-3, WTW, Weilheim, Germany), respectively [42]. Soil total carbon (C) and nitrogen (N) were measured using a C/H/N analyzer (Vario EL III, Elementar, Hanau, Germany) [43]; soil available phosphorus (P) was measured by the Olsen method, and soil available potassium (K) was obtained with 1 M ammonium acetate and measured by atomic absorption spectroscopy [44].

2.3. Groundwater Depth Data

Groundwater depth data were downloaded from the Cold and Arid Regions Science Data Center at Lanzhou [45]; the data were collected as 18 h averages with a three decimal places accuracy using the Hobo automatic groundwater monitoring device in 2010–2014 at 6 monitoring wells (7.62–9.66 m deep) [26,45]. These groundwater monitoring wells perpendicular to the river channel, were located at 300, 2200, 2700, 3200, 3700 and 4300 m from the river channel (Figure 1). Due to the relative stabilized groundwater depth in the growing season (July to September) from 2010 to 2014 [24,26], in our study, the average values of growing season groundwater depth from 2010 to 2014 were used. Among our sampling sites, the groundwater depth data for sites 1, 4, 6, 8 and 9 were obtained directly from monitoring wells and the data for sites 2, 3, 5, 7, 10 and 11 were obtained by the cokriging interpolation method; this method has been widely applied to analyze spatial heterogeneity to provide exact interpolated groundwater levels at the measurement locations [46], and Ahmadi and Sedghamiz confirmed that this method is relatively accurate in mapping and estimating the groundwater depth in arid and semi-arid regions [47].

2.4. Data Analysis

Species richness was determined from the total species numbers of each plot. Species importance value for each species was calculated as (RD + RC + RF)/3 to indicate the dominant species, where RD is the relative density, RC is the relative coverage and RF is the relative frequency [48]. Gravimetric soil water content data were averaged across two soil layers of 0–30 and 30–50 cm; other soil data were averaged across 0–50 cm soil depth.
All data were log 10 transformed to meet the homogeneity of variance and normality. One-way analysis of variance was applied to compare the differences in groundwater depth, soil properties and community characteristics in different plots; if significant differences were found, Tukey’s test was used to determine the differences. Regression models were used to identify relationships between plant community characteristics and groundwater depth and/or soil properties. Statistical analyses were carried out using SPSS Version 18.0 (SPSS, Chicago, IL, USA). Stepwise regression was used to build the relationship between community characteristics and environmental variables. Forward selection with redundancy analysis (RDA) was used to determine the key influencing factors of the 11 environmental variables. Statistical testing for each added variable was conducted with Monte Carlo permutation tests (9999 permutations). Marginal and conditional effects were expressed by canonical eigenvalues [49]. Marginal effects showed the effects of the environmental variables on community characteristics, and conditional effects showed the effects of the environmental variables on community characteristics after the anterior variable was eliminated by the forward selection method [20,24]. A Monte Carlo test of forward selection was performed to exclude variables that did not contribute significantly (p > 0.05) to the explained variation. After forward selection with redundancy analysis, variation partitioning was used to separate the variation in the community characteristics among the three groups of significant predictors: groundwater depth, soil spatial heterogeneity factors (soil water content and soil bulk density) and soil saline-alkali (soil pH). Given that soil water content and soil bulk density were highly correlated with each other, only soil bulk density was included in the explanatory model to avoid multiple collinearity in the variation partitioning analysis. The independent effects of each factor and the interactive effects between factors were included in the final model [50]. The forward selection, Monte Carlo test and variation partitioning were conducted using CANOCO for Windows program (version 5.0) [49].

3. Results

3.1. Variation in Groundwater Depth with Distance from the River

Groundwater depth varied significantly among sampling sites with distance from the river (F = 2.365, p = 0.028), ranging from 2.25 to 3.26 m (Table 1). The variation in groundwater depth showed a linear increasing trend with distance from the river (Y = 0.0002X + 2.176, R2 = 0.963, p < 0.001) and peaked at the distance of 4500 m.

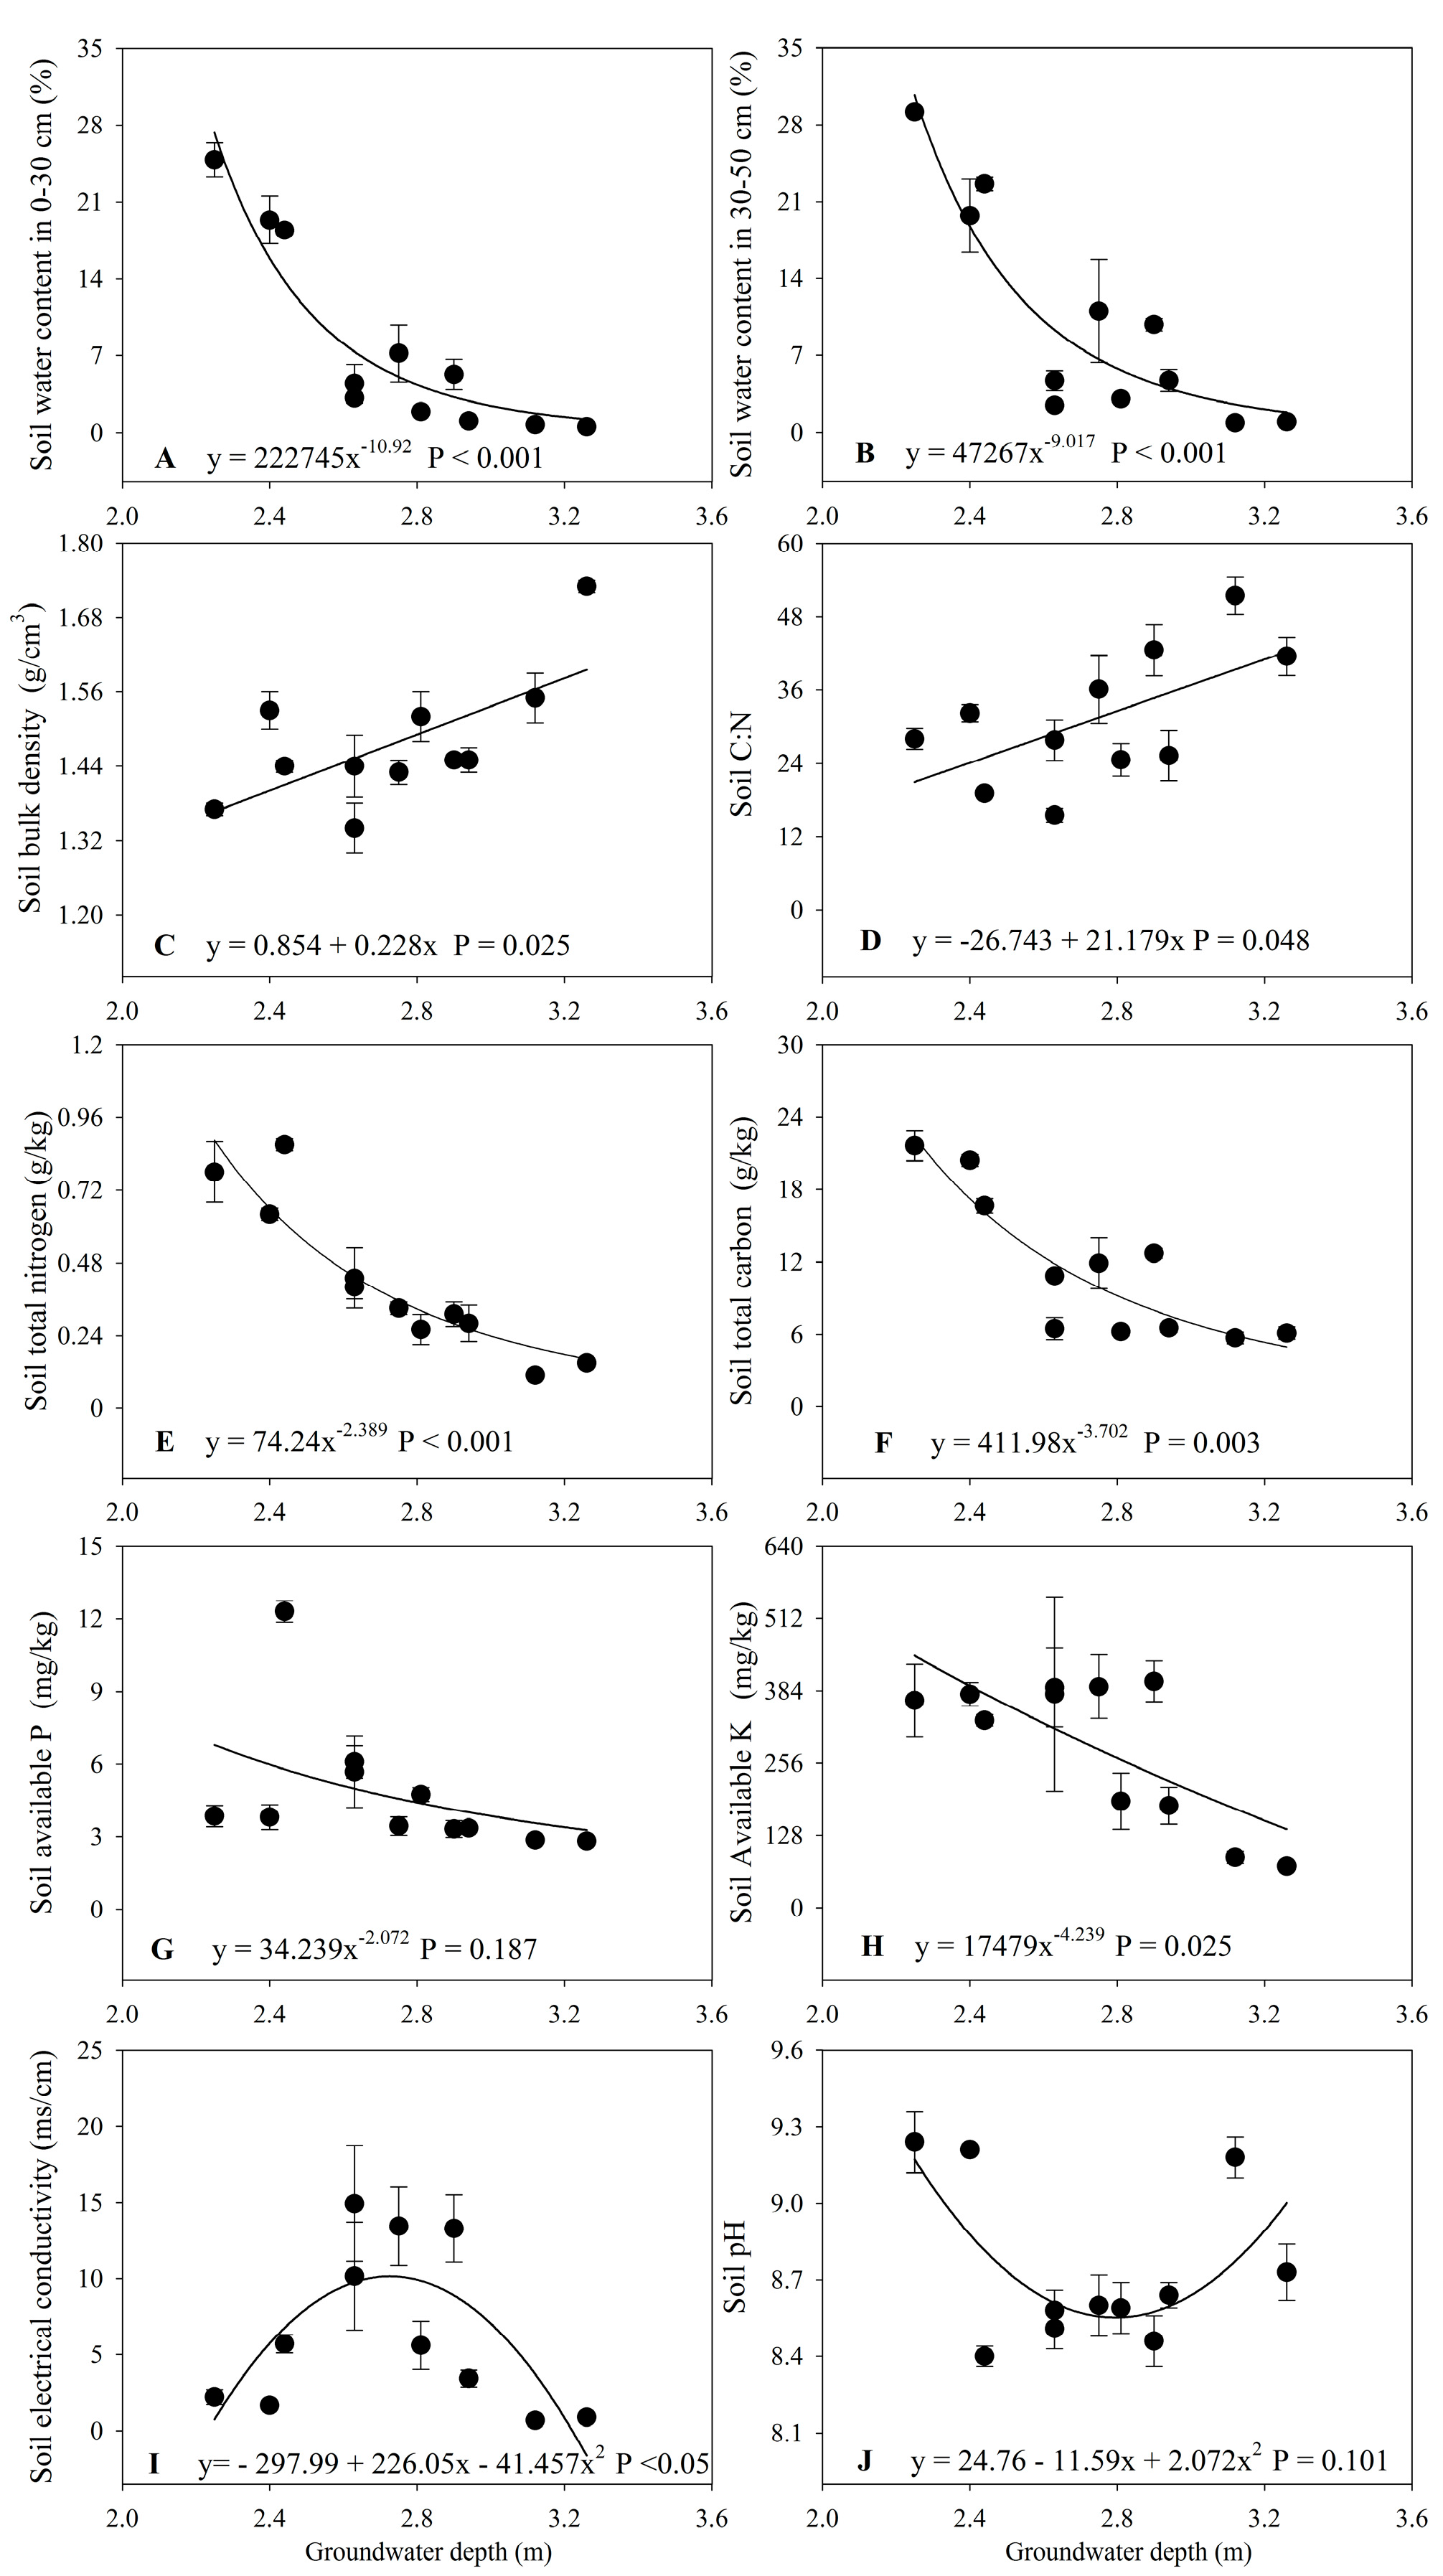
3.2. Changes in Soil Properties with Groundwater Depth

Gravimetric soil water content in the 0–30 cm soil layer (GSWC30) (F = 63.41, p < 0.001), gravimetric soil water content in the 30–50 cm soil layer (GSWC50) (F = 54.569, p < 0.001), soil bulk density (F = 14.246, p < 0.001), soil total N (F = 40.727, p < 0.001), soil total C (F = 57.082, p < 0.001), soil carbon:nitrogen (C:N) ratio (F = 18.639, p < 0.001), soil available P (F = 31.839, p < 0.001), soil available K (F = 29.506, p < 0.001), soil pH (F = 26.526, p < 0.001) and soil EC (F = 76.226, p < 0.001) varied significantly in different ranges among the sample sites with different groundwater depths (Table 2). In addition, soil depth significantly affected soil bulk density (F = 35.463, p < 0.001), soil total N (F = 11.623, p < 0.001), soil C:N ratio (F = 15.239, p < 0.001), soil available P (F = 13.843, p < 0.001), soil available K (F = 26.804, p < 0.001) and soil EC (F = 61.083, p < 0.001).
With increasing groundwater depth, GSWC30 and GSWC50 generally decreased and could be described by power functions (Figure 2A,B). Soil bulk density and the C:N ratio increased with increasing groundwater depth and could be described by linear functions (Figure 2C,D). Soil total N, soil total C, soil available P and soil available K generally decreased with increasing groundwater depth and could be described by power functions (Figure 2E–H). Soil EC showed a hump-shaped pattern, increasing and then decreasing rapidly with increased groundwater depth, which could be described by quadratic curves (Figure 2I). Soil pH showed the opposite trend to soil EC with increased groundwater depth and could be described by quadratic curves (Figure 2J).

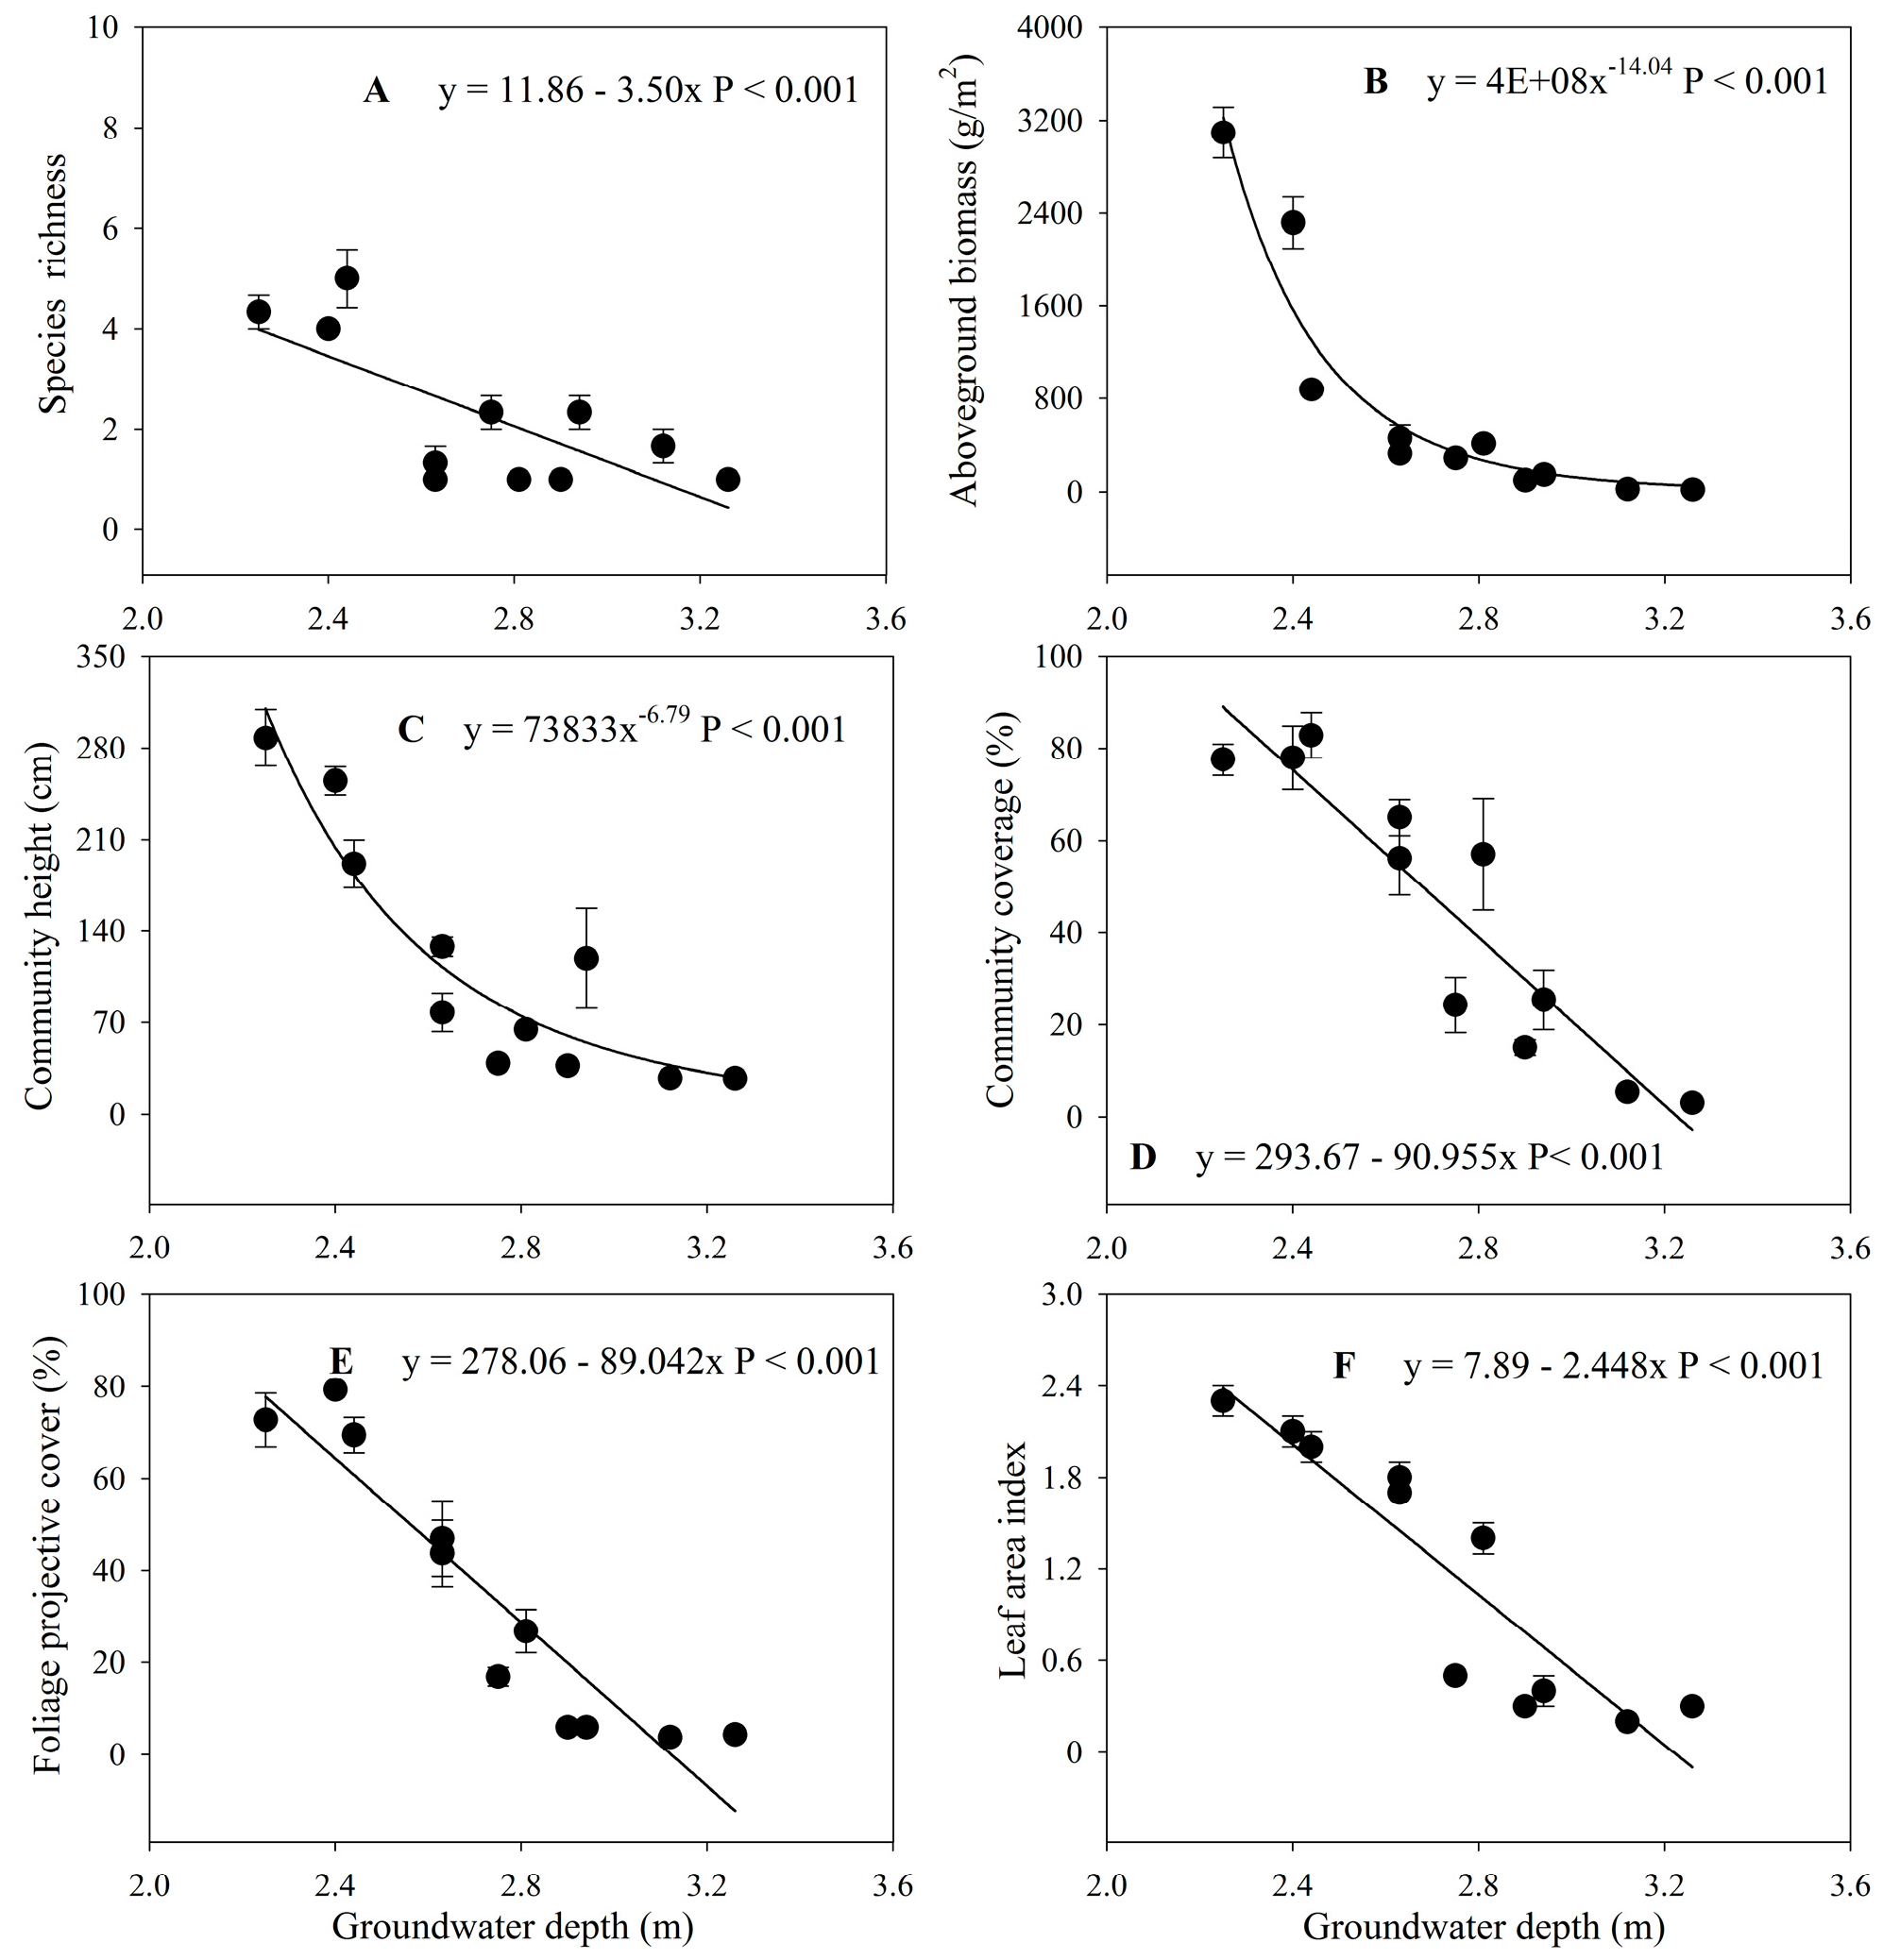
3.3. Changes in Plant Communities with Groundwater Depth

Generally, plant communities changed from the desert riparian forest vegetation of Tamarix ramosissima to the typical desert plant community of Reaumuria songarica with increasing distance from the river (Table 1).
Species richness (F = 27.038, p < 0.001), aboveground biomass (F = 151.572, p < 0.001), community coverage (F = 47.837, p < 0.001), community height (F = 37.449, p < 0.001), FPC (F = 77.025, p < 0.001) and LAI (F = 103.228, p < 0.001) were significantly different and varied in different ranges among different sites with different groundwater depth (Table 1).
Species richness decreased with increasing groundwater depth and could be described by linear equations (Figure 3A). Aboveground biomass and community height decreased with increasing groundwater depth and could be described by power equations (Figure 3B,C). Community coverage, FPC and LAI generally decreased with increasing groundwater depth and could be described by linear equations (Figure 3D–F). The maximum species richness, coverage and FPC did not appear in the shallowest groundwater depth (Figure 3).

3.4. Changes in Plant Communities with Soil Properties

Species richness, aboveground biomass, community coverage, community height, FPC and LAI generally increased with increasing gravimetric soil water content in the 0–30 and 30–50 cm soil layers; this was also the case for soil total N, soil total C, soil available P and soil available K. Additionally, species richness, aboveground biomass, community coverage, community height, FPC and LAI significantly deceased with increasing soil bulk density and soil C:N ratio, the exception being to the relationships between species richness and soil bulk density, and species richness and soil C:N ratio (Table A1 and Table A2). These community indices could be described by different regression equations with different soil properties (Table A1 and Table A2).

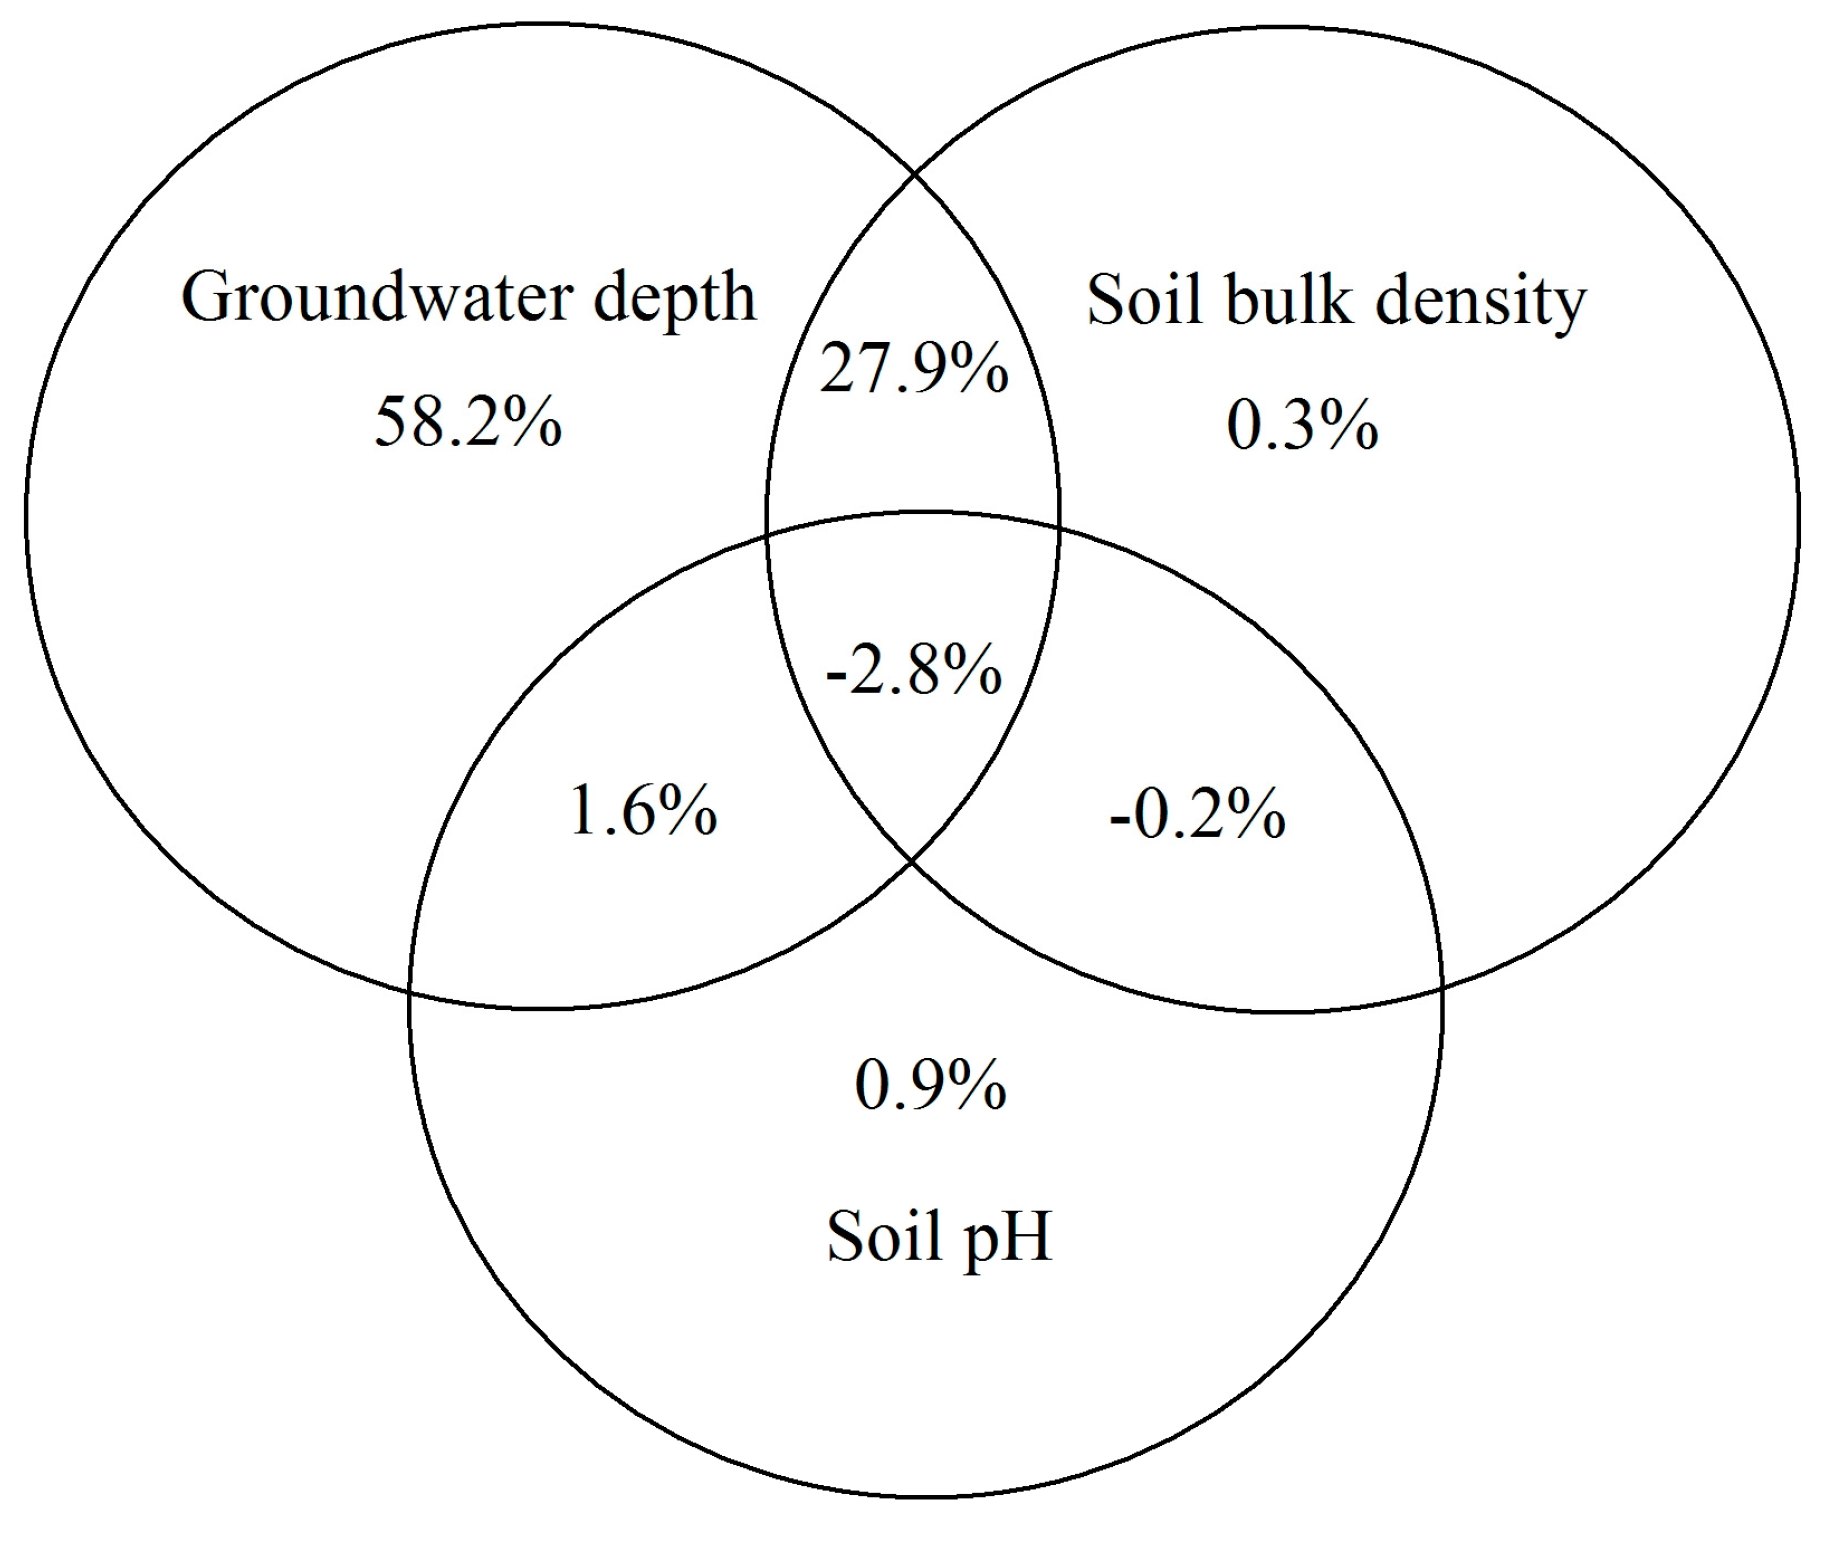
3.5. Changes in Plant Communities with Soil and Groundwater Depth

Stepwise regression analysis indicated that groundwater depth, soil water content and soil properties had a significant effect on species richness, aboveground biomass, community coverage, community height, FPC and LAI (Table A3). In the Monte Carlo test of forward selection (p < 0.05), groundwater depth, soil bulk density, soil pH and soil water content (30–50 cm) passed the test (Table 3). The variation partitioning showed that groundwater depth, soil bulk density and soil pH together explained 85.8% of the vegetation variance. Groundwater depth had the largest contribution (58.2%), followed by the interaction of groundwater depth and soil bulk density (27.9%), and then the interaction of groundwater depth and soil pH (1.6%), although soil bulk density and soil pH had a relatively small contribution (Figure 4).

4. Discussion

4.1. Impacts of Increased Groundwater Depth on Soil Properties

A previous study reported that soil physical and chemical properties were strongly affected by groundwater depth in an arid inland river basin [23]. Tamea et al. [12] concluded that the dynamics of soil moisture relative to groundwater fluctuations were considered as the most important driving force controlling the overall ecosystem dynamics. In arid regions, soil water content is affected primarily by groundwater because of small precipitation events and high evaporation [3,6,51]. Our results showed that soil water content decreased significantly with increased groundwater depth (Figure 2), and this is consistent with many other studies in the Tarim River [10,22]. In addition, human irrigation disturbances and high community coverage might significantly affect soil water content and lead to high soil moisture for sites near the river bank (Table 2). In arid regions, groundwater depth could also affect soil physical properties such as soil bulk density, increased groundwater depth, deteriorated vegetation structure and functions, resulting in lower soil organic matter; soil bulk density increased accordingly [52]. Some studies reported that soil with high bulk density results in low water holding capacity in the surface soil and might induce drought stress in the surface soil in arid regions [53,54]. This was consistent with our results that soil bulk density showed the opposite trend to surface soil water content with groundwater depth (Figure 2).
In hyperarid regions, hydraulic lifting could enable plant roots to obtain their required water from different soil layers and groundwater, and forage for mineral nutrients mainly in the surface soil layer (upper 30 cm) when the surface soil dries out [6,9,55]. Therefore, soil chemical properties might be influenced by a combination of biotic and abiotic factors related to groundwater. Our results showed that soil total C, soil total N, available P and available K decreased with increased groundwater depth (Figure 2). This result might be because increases in groundwater depth lead to decreases in soil C and N content, which is associated with large decreases in species richness, coverage, biomass and height [23,56,57], this was also confirmed by our results (Table A1 and Table A2). Further, soil C content contributes to N and P supply, and a good soil structure that favors plant growth [58]. Additionally, the loss of soil water content would increase organic matter decomposition rates and affect net N mineralization in hyperarid regions, which leads to losses of soil C and N content [59].
Our results showed that soil EC experienced a hump-shaped pattern, peaking at around 2.6 m groundwater depth, then dropped rapidly with increased groundwater depth, whereas soil pH showed the opposite trend (Figure 2I,J). In the lower reaches of the Heihe River, the soil had high clay content at sites of around 2.6 m groundwater depth; the groundwater at these sites might reach the upper soil layer through capillary rising force [26]. The low community coverage and bare soil with high evaporation enhanced salt accumulation at the soil surface, therefore, soil EC was high in sites S4, S5, S6, S7 and S8 (Table 2). Community coverage could reach more than 75% in the sites with the shallowest groundwater depth (Table 1), and salt accumulation was reduced; in addition, desalinization exchange and the Chenopodiaceae alkalization process led to low soil EC and high soil pH. With increasing groundwater depth, bare soil evaporation did not reduce, for example, in sites S10 and S11, where the soil was sandy and groundwater depth was above 3 m, it was difficult for groundwater to reach the upper soil layer through capillary rising force, and the soil parent material promoted the formation of alkaline soil. Our results suggested that soil EC and pH might be affected by both biotic and abiotic factors related to groundwater.

4.2. Impacts of Increased Groundwater Depth on the Plant Community

Vegetation dynamics are tightly coupled with hydrological processes [60]. Previous studies have reported that a decline in species diversity is caused mainly by the disappearance of herb plants in arid region inland river basins and that the optimal groundwater depth for species richness is not the shallowest groundwater depth [22]. In arid regions, herb plants with shallow root systems contribute greatly to community coverage and species diversity [53]. Hao et al. [22] suggested that herb plants were restrained by high salinity even though good water conditions exist in the Tarim River. In our study, species richness, community coverage and FPC were not highest in the sites with the shallowest groundwater depth (high pH and low EC; Table 1 and Table 2), whereas the maximum species richness (i.e., S3) mainly occurred in the sites with low soil pH and EC (Table 2). Potential mechanisms for this result may be that physiological stress limits the number of species adapted to high pH [61]. In the lower reaches of the Heihe River, species richness, community coverage and FPC were mainly influenced by groundwater depth, and then affected by soil saline-alkali when groundwater depth increased to a specific value, at which point community coverage decreased. In addition, the aboveground biomass, community height and leaf area index were highest for the shallowest groundwater depth. T. ramosissima shrub contributed greatly to aboveground biomass, community height and LAI, because this species could survive by extending its roots to a low saline-alkali underground region, which is mainly affected by the groundwater depth but not by high saline-alkali [62].
Many studies have reported that herb plants such as Sophora alopecuroides, Karelinia caspia and Peganum harmala L. mainly absorb shallow soil moisture [26]; however, groundwater depths along the river were above 2 m, especially from sites 7 to 9 where groundwater depth ranged from 2.75 to 2.94 m, but herb species still existed under the shrub layer (Table 1). In this hyperarid region, mean annual precipitation was only 30–40 mm, and pan evaporation was about 100 times greater than precipitation [34]. Hydraulic redistribution is a possible mechanism to explain the drought tolerance of herb species. T. ramosissima plays a water-supplier role for herbs by lifting or transporting water from groundwater [6,63]. Fu et al. [26] suggested that the combined community of phreatophytes and shallow-rooted plants can improve the utilization of water resources, and is the best species combination for restoring and developing desert riparian vegetation. Notably, the desert riparian vegetation mainly distributed around the 3-m zone of groundwater depth in this hyperarid region (Table 1). This result indicated that the appropriate groundwater depth should be 2–3 m to support the desert riparian vegetation restoration in the lower reaches of the Heihe River.

4.3. Relationships among Soil, Vegetation and Groundwater

In the lower reaches of the Heihe River, groundwater plays an important role in plant community structure and composition [20,27]. Our results showed that groundwater depth was the major driving force for community characteristics; groundwater depth and soil jointly explained 85.8% of the community characteristics variance (Figure 4). In this hyperarid region, groundwater was the main water resource for vegetation survival, and indirectly mediated vegetation variance through interactions with abiotic factors such as soil water content and soil nutrition. Soil water content in different soil layers is recognized as an important ecological factor that affects plant growth and development in arid and semiarid regions [3]. In this hyperarid region, surface soil water (0–30 cm) may be an important water resource for the herb plants due to the roots of most herb species being mainly distributed in a 0–30-cm soil layer [26]. Hydraulic redistribution might benefit the growth of the shallow rooted herb species in arid and semiarid regions. Some studies have reported that capillary water can rise to heights of up to 73 cm in sandy soil and up to 100 cm in loamy soil [63]. The soil particles of loam concentrate at the underground layer of 0–1.8 m between 0 and 3000 m from the river channel [35]; groundwater depth (2.25–2.81 m) may, through capillary rising force, reach soil depths of 1.2–1.8 m where fine roots of T. ramosissima are distributed [26]. Therefore, T. ramosissima could supply water to the soil layer affected by drought stress. For S10 and S11, soil particles were sandy, and groundwater depths were 3.12–3.26 m; vegetation changed from desert riparian forest to typical desert shrubland. These changes might be related to increasing groundwater depth. Our results showed that soil properties such as soil saline-alkali affected the herb layer, which contributed greatly to community coverage and species richness. Some studies have reported that soil has greater porosity and water holding capacity due to the well plant community structure [14,52]. These results indicated that vegetation might affect soil nutrition and water availability by complex interactions between the above- and belowground interface.
Our results showed that species richness significantly increased with soil water content in the growing season (Table A1); this is in contrast to what was obtained in a previous study in an alpine wetland ecosystem [64], but is consistent with the results of Wu et al. [65] and Deng et al. [3] in arid and semiarid regions. This difference might result from the relatively small effects of interspecific competition in arid regions, whereas high species density in humid environments leads to interspecific competition and decreased species diversity [65]. In addition, Ross [58] concluded that plant cover and plant community composition could alter soil chemical properties, contributing to nutrient input and cycling. Some studies reported that species diversity can control P erosion [65]; our results indicated that species richness was significantly positively related to soil available P (Table A1). These results confirmed that plant–soil feedback can influence plant community structure and soil properties [13,66]. Although our results are consistent with previous conclusions obtained in arid and semi-arid regions, our results were derived from one-time field observations; the relationship between plant communities and environment may change in different seasons, so long-term field experiments are necessary in the future. In this region, mean annual precipitation was only 30–40 mm; one-time rain may have little effect on the function of stable scrub communities, but rain can maintain the desert plant community, and little rain may affect the surface soil water and shallow groundwater. The relationship between soil water and groundwater would be affected by the interval between the ecological water conveyance and observation timing; this is worthy of further research.
Desert riparian forest vegetation restoration followed changes in water diversion that increased water flow into the river bed [28]. In the lower reaches of the Heihe River, the groundwater was affected by the following factors: water diversion, groundwater overdraft and unreasonable agriculture development [67]. When the water diversion stops or decreases rapidly, the groundwater depth will increase along the river, and soil and riparian vegetation will degrade. Therefore, long-term regulated water diversion, to increase surface runoff, thus restoring appropriate groundwater depth, is necessary to preserve the stability and sustainability of the riparian ecosystem in the lower reaches of the Heihe River.

5. Conclusions

This study has provided comprehensive data on soil and vegetation responses to variation in groundwater depth along an inland river in an arid area. Groundwater depth significantly increased with distance from the river. Increased groundwater depth had a significant negative effect on soil water content, soil total C, soil total N, and soil available K, while soil bulk density and the soil carbon:nitrogen ratio increased with increased groundwater depth. Increased groundwater depth significantly decreased species richness, aboveground biomass, community coverage, community height, FPC and LAI. Vegetation was mainly influenced by groundwater depth, followed by the interaction of groundwater depth and soil bulk density, and then the interaction of groundwater depth and soil pH. If the groundwater depth continues to increase in this region, the riparian shrub vegetation will be gradually replaced by desert shrub in the near future, which will lead to a reduction in biodiversity and a decrease in productivity. Long-term water diversion and field experiments should be conducted and appropriate groundwater depth should be maintained to ensure the stability and sustainability of riparian forest ecosystems in the lower reaches of inland rivers in arid areas.

Acknowledgments

This work was funded by National Natural Science Foundation of China [91425301]. We are grateful for the reviews from the editor, Audrey He, and four anonymous reviewers, who significantly improved the quality of this article. We are thankful to Yaning Chen and Honghua Zhou for providing groundwater depth data.

Author Contributions

Yuanrun Zheng and Lianhe Jiang conceived and designed the study; Xiaolong Zhang and Tianyu Guan carried out the calculation and result analysis; Xiaolong Zhang took the lead in writing the manuscript; Xiaolong Zhang, Tianyu Guan, Jihua Zhou, Wentao Cai, Nannan Gao, Du Hui and Liming Lai conducted field investigations. All authors gave their approval of the version submitted for publication.

Conflicts of Interest

The authors declare no conflict of interest.

Appendix A

Table A1. Regression equations of species richness, aboveground biomass, community coverage and soil properties. Abbreviations: GSWC30, soil water content (0–30 cm); GSWC50, soil water content (30–50 cm); SBD, Soil bulk density; STN, soil total nitrogen; STC, soil total carbon; C:N, soil C:N ratio; SAP, soil available phosphorus content; SAK, soil available potassium content; SEC, soil electrical conductivity.
Soil VariablesSpecies RichnessAboveground Biomass Community Coverage
ModelpModelpModelp
GSWC30Y = 0.149X + 1.0920.001Y = 70.568X1.0160.001Y = 0.024X + 0.2540.001
GSWC50Y = 0.128X + 1.0010.001Y = 43.216X1.0850.001Y = 0.019X + 0.2590.001
SBDY = −3.626X + 7.6270.135Y = 29047X−12.090.001Y = −1.174X + 2.1790.014
STNY =4.866X + 0.2560.001Y = 2834.9X2.1950.001Y = −1.058X2 + 2.039X − 0.1530.001
STCY = 0.202X − 0.0260.001Y = 1.3664X2.2940.001Y = 0.033X + 0.0710.001
C:NY = −0.040X + 3.6860.058Y = 509,279X−2.1540.002Y = −0.014X + 0.9500.001
SAPY = 0.249X + 1.0900.007Y = 23.851X1.6800.027Y = 0.004X3 − 0.101X2 + 0.804X − 1.3640.001
SAKY = −1.881E-5X2 − 0.014X + 0.1170.001Y = 0.021X1.7270.001Y =2E-08X3 − 2E-05X2 + 0.009X − 0.5390.001
pHY = 5.624X2 − 98.226X + 430.570.042Y = 3E-05X7.4310.340Y = 0.793X2 − 13.953X + 61.7270.371
SECY = −0.065X + 2.6970.148Y = 151.66X0.4160.111Y = 0.001X3 − 0.022X2 + 0.195X + 0.1190.040
Table A2. Regression equations of community height, foliage projective cover, leaf area index and soil properties. Other abbreviations are given in Table A1.
Soil VariablesCommunity HeightFoliage Projective CoverLeaf Area Index
ModelpModelpModelp
GSWC30Y = 44.224X0.4540.001Y = 7.836X0.7010.001Y = 0.067X + 0.6600.001
GSWC50Y = 34.701X0.4990.001Y = 6.693X0.6420.001Y = 0.051X + 0.6800.001
SBDY = 688.36X−5.5410.006Y = 420.41X−7.8950.004Y = −3.150X + 5.8380.014
STNY = 262.5X1.1020.001Y = 106.32X1.5700.001Y = −3.126X2 + 5.718X − 0.4540.001
STCY = 5.7563X1.1450.001Y = 0.6289X1.4960.001Y = 0.086X + 0.2080.001
C:NY = 9724.9X−1.770.009Y = 154.29X−1.4890.001Y = −0.039X + 2.5610.001
SAPY = 20.874X0.9350.004Y = 1.784X1.6660.001Y = 0.009X3 − 0.224X2 + 1.899X − 3.2420.001
SAKY = 1.686X0.7050.001Y = 0.031X1.1780.001Y = 4E-08X3 − 5E-05X2 + 0.021X − 1.0220.008
pHY = 0.001X5.4840.185Y = 0.1632X2.2140.701Y = 2.410X2 − 42.163X + 185.340.18
SECY = 74.075X0.0610.671Y = 12.569X0.3270.088Y = 0.002X3 − 0.051X2 + 0.415X + 0.5630.136
Table A3. Summary Multivariate stepwise regression between community characteristics and environment factors. Other abbreviations are given in Table A1.
ModelR2p
Species richness = 0.149 GSWC30 + 1.0920.737<0.001
Aboveground biomass = 48.865 GSWC30 + 565.815 pH − 1742.385GWD − 74.315SAP − 26.357SEC0.932<0.001
Community coverage = −133.822GWD − 1.232GSWC50 + 87.606SBD + 2.174SAP + 283.6110.893<0.001
Community height = −194.949GWD − 4.321SEC + 652.4670.827<0.001
Foliage projective cover = −93.229GWD+73.952SBD + 2.446SAP + 12.918pH0.917<0.001
Leaf area index = −3.972GWD − 0.055STC + 2.09SBD + 9.1120.879<0.001

References

  1. Wang, L.; D’Odorico, P.; Evans, J.P.; Eldridge, D.J.; McCabe, M.F.; Caylor, K.K.; King, E.G. Dryland ecohydrology and climate change: Critical issues and technical advances. Hydrol. Earth Syst. Sci. 2007, 16, 2585–2603. [Google Scholar] [CrossRef] [Green Version]
  2. Loheide, S.P.; Gorelick, S.M. Riparian hydroecology: A coupled model of the observed interactions between groundwater flow and meadow vegetation patterning. Water Resour. Res. 2007, 43, 931–936. [Google Scholar] [CrossRef]
  3. Deng, L.; Wang, K.B.; Li, J.P.; Shangguan, Z.P. Effect of soil moisture and atmospheric humidity on both plant productivity and diversity of native grasslands across the loess plateau, China. Ecol. Eng. 2016, 94, 525–531. [Google Scholar] [CrossRef]
  4. Noy-Meir, I. Desert ecosystems: Environment and producers. Annu. Rev. Ecol. Syst. 1973, 4, 25–51. [Google Scholar] [CrossRef]
  5. Mitchell, P.J.; O’Grady, A.P.; Pinkard, E.A.; Beodribb, T.J.; Arndt, S.; Blackman, C.J.; Duursma, R.A.; Fensham, R.J.; Hilbert, D.W.; Nitschke, C.R.; et al. An ecoclimatic framework for evaluating the resilience of vegetation to water deficit. Glob. Chang. Biol. 2016, 21, 1677–1689. [Google Scholar] [CrossRef] [PubMed]
  6. Yu, T.F.; Feng, Q.; Si, J.H.; Xi, H.Y.; Li, Z.X.; Chen, A.F. Hydraulic redistribution of soil water by roots of two desert riparian phreatophytes in northwest China’s extremely arid region. Plant Soil 2013, 372, 297–308. [Google Scholar] [CrossRef]
  7. Lang, P.; Ahlborn, J.; Schäfer, P.; Wommelsdorf, T.; Jeschke, M. Growth and water use of Populus euphratica trees and stands with different water supply along the Tarim River, NW China. For. Ecol. Manag. 2016, 380, 139–148. [Google Scholar] [CrossRef]
  8. Garrido, M.; Silva, P.; Acevedo, E. Water Relations and Foliar Isotopic Composition of Prosopis tamarugo Phil., an Endemic Tree of the Atacama Desert Growing at Three Levels of Water Table Depth. Front. Plant Sci. 2016, 7, 375. [Google Scholar] [CrossRef] [PubMed]
  9. Gries, D.; Zeng, F.; Foetzki, A.; Arndt, S.K.; Bruelheide, H.; Thomas, F.M.; Zhang, X.; Runge, M. Growth and water relations of Tamarix ramosissima and Populus euphratica on Taklamakan desert dunes in relation to depth to a permanent water table. Plant Cell Environ. 2003, 26, 725–736. [Google Scholar] [CrossRef]
  10. Chen, Y.N.; Pang, Z.; Chen, Y.P.; Li, W.H.; Xu, C.C.; Hao, X.M.; Huang, X.; Huang, T.M.; Ye, Z.X. Response of riparian vegetation to water-table changes in the lower reaches of Tarim River, Xinjiang Uygur, China. Hydrogeol. J. 2008, 16, 1371–1379. [Google Scholar] [CrossRef]
  11. Muñoz-Reinoso, J.C. Vegetation changes and groundwater abstraction in SW Doñana, Spain. J. Hydrol. 2001, 242, 197–209. [Google Scholar] [CrossRef]
  12. Tamea, S.; Laio, F.; Ridolfi, L.; D’Odorico, P.; Rodriguez-Iturbe, I. Ecohydrology of groundwater-dependent ecosystems: 2. Stochastic soil moisture dynamics. Water Resour. Res. 2009, 45, W05420. [Google Scholar] [CrossRef]
  13. Kardol, P.; Bezemer, T.M.; Putten, W.H.V.D. Temporal variation in plant-soil feedback controls succession. Ecol. Lett. 2006, 9, 1080–1088. [Google Scholar] [CrossRef] [PubMed]
  14. Celentano, D.; Rousseau, G.X.; Engel, V.L.; Zelarayán, M.; Oliveira, E.C. Degradation of riparian forest affects soil properties and ecosystem services provision in eastern amazon of Brazil. Land Degrad. Dev. 2017, 28, 482–493. [Google Scholar] [CrossRef]
  15. Xi, H.Y.; Feng, Q.; Si, J.H.; Chang, Z.Q.; Cao, S.K. Impacts of river recharge on groundwater level and hydrochemistry in the lower reaches of Heihe River Watershed, northwestern China. Hydrogeol. J. 2010, 18, 791–801. [Google Scholar] [CrossRef]
  16. Stromberg, J.C.; McCluney, K.E.; Dixon, M.D.; Meixner, T. Dryland riparian ecosystems in the American southwest: Sensitivity and resilience to climatic extremes. Ecosystems 2013, 16, 411–415. [Google Scholar] [CrossRef]
  17. Han, M.; Zhao, C.Y.; Feng, G.; Disse, M.; Shi, F.Z.; Li, J.Y. An eco-hydrological approach to predicting regional vegetation and groundwater response to ecological water conveyance in dryland riparian ecosystems. Quat. Int. 2015, 380–381, 224–236. [Google Scholar] [CrossRef]
  18. Doulatyari, B.; Basso, S.; Schirmer, M.; Botter, G. River flow regimes and vegetation dynamics along a river transect. Adv. Water Resour. 2014, 73, 30–43. [Google Scholar] [CrossRef]
  19. Brunke, M.; Hoehn, E.; Gonser, T. Patchiness of river-groundwater interactions within two floodplain landscapes and diversity of aquatic invertebrate communities. Ecosystems 2003, 6, 707–722. [Google Scholar] [CrossRef]
  20. Zhu, J.T.; Yu, J.J.; Wang, P.; Zhang, Y.C.; Yu, Q. Interpreting the groundwater attributes influencing the distribution patterns of groundwater-dependent vegetation in northwestern China. Ecohydrology 2012, 5, 628–636. [Google Scholar] [CrossRef]
  21. Kong, W.; Sun, O.J.; Chen, Y.; Yu, Y.; Tian, Z. Patch-level based vegetation change and environmental drivers in Tarim River drainage area of West China. Landsc. Ecol. 2010, 25, 1447–1455. [Google Scholar] [CrossRef]
  22. Hao, X.M.; Li, W.H.; Huang, X.; Zhu, C.G.; Ma, J.X. Assessment of the groundwater threshold of desert riparian forest vegetation along the middle and lower reaches of the Tarim River, China. Hydrol. Process. 2010, 24, 178–186. [Google Scholar] [CrossRef]
  23. Zhou, H.H.; Chen, Y.N.; Li, W.H. Soil properties and their spatial pattern in an oasis on the lower reaches of the Tarim River, northwest China. Agric. Water Manag. 2010, 97, 1915–1922. [Google Scholar] [CrossRef]
  24. Ding, J.Y.; Zhao, W.W.; Daryanto, S.; Wang, L.X.; Fan, H.; Feng, Q.; Wang, Y.P. The spatial distribution and temporal variation of desert riparian forests and their influencing factors in the downstream Heihe River basin, China. Hydrol. Earth Syst. Sci. 2017, 21, 2405–2419. [Google Scholar] [CrossRef]
  25. Peng, X.M.; Xiao, S.C.; Xiao, H.L. Preliminary dendrochronological studies on Populus euphratica in the lower reaches of the Heihe River basin in northwest China. Dendrochronologia 2013, 31, 242–249. [Google Scholar] [CrossRef]
  26. Fu, A.H.; Chen, Y.N.; Li, W.H. Water use strategies of the desert riparian forest plant community in the lower reaches of Heihe River Basin, China. Sci. China. Earth Sci. 2014, 57, 1–13. [Google Scholar] [CrossRef]
  27. Cheng, G.D. Study on the Integrated Management of the Water-Ecology-Economy System of Heihe River Basin; Science Press: Beijing, China, 2009; pp. 208–212. ISBN 9787030245823. [Google Scholar]
  28. Zhu, Y.H.; Chen, Y.N.; Ren, L.L.; Lü, H.S.; Zhao, W.Z.; Yuan, F.; Xu, M. Ecosystem restoration and conservation in the arid inland river basins of Northwest China: Problems and strategies. Ecol. Eng. 2016, 94, 629–637. [Google Scholar] [CrossRef]
  29. Si, J.H.; Feng, Q.; Zhang, X.Y.; Su, Y.H.; Zhang, Y.W. Vegetation changes in the lower reaches of the Heihe river after its water import. Acta Bot. Boreal. Occident. Sin. 2005, 25, 631–640. [Google Scholar] [CrossRef]
  30. Zeng, Y.; Xie, Z.; Yu, Y.; Liu, S.; Wang, L.; Jia, B.; Qin, P.; Chen, Y. Ecohydrological effects of stream-aquifer water interaction: A case study of the Heihe River basin, northwestern China. Hydrol. Earth Syst. Sci. 2016, 20, 2333–2352. [Google Scholar] [CrossRef]
  31. Wang, P.; Zhang, Y.C.; Yu, J.J.; Fu, G.B.; Ao, F. Vegetation dynamics induced by groundwater fluctuations in the lower Heihe River Basin, northwestern China. J. Plant Ecol. 2011, 4, 77–90. [Google Scholar] [CrossRef]
  32. Chen, Y.N.; Chen, Y.P.; Xu, C.C.; Ye, Z.X.; Li, Z.Q.; Zhu, C.G.; Ma, X.D. Effects of ecological water conveyance on groundwater dynamics and riparian vegetation in the lower reaches of Tarim River, China. Hydrol. Process. 2010, 24, 170–177. [Google Scholar] [CrossRef]
  33. Gao, B.; Qin, Y.; Wang, Y.H.; Yang, D.W.; Zheng, Y.R. Modeling ecohydrological processes and spatial patterns in the upper Heihe Basin in China. Forests 2016, 7, 10. [Google Scholar] [CrossRef]
  34. Li, W.; Yu, T.F.; Li, X.Y.; Zhao, C.Y. Sap flow characteristics and their response to environmental variables in a desert riparian forest along lower Heihe River Basin, Northwest China. Environ. Monit. Assess. 2016, 188, 561. [Google Scholar] [CrossRef] [PubMed]
  35. Liu, W.; Wang, Z.J.; Xi, H.Y. Variations of physical and chemical properties of water and soil and their significance to ecosystem in the Lower reaches of Heihe River. J. Glaciol. Geocryol. 2008, 30, 688–696. [Google Scholar]
  36. Chen, Y.N.; Li, W.H.; Zhou, H.H.; Chen, Y.P.; Hao, X.M.; Fu, A.H.; Ma, J.X. Analysis of water use strategies of the desert riparian forest plant community in inland rivers of two arid regions in northwestern China. Biogeosci. Discuss. 2014, 11, 14819–14856. [Google Scholar] [CrossRef]
  37. Décamps, H.; Pinay, G.; Naiman, R.J.; Petts, G.E.; Mcclain, M.E.; Hillbricht-Ilkowska, A.; Hanley, T.A.; Holmes, R.M.; Quinn, J.; Gibert, J.; et al. Riparian zones: Where biogeochemistry meets biodiversity in management practice. Pol. J. Ecol. 2004, 52, 3–18. [Google Scholar]
  38. Feng, Q. Ecological Water Requirements and Ecological Water Regulation in the Lower Reaches of Heihe; Science Press: Beijing, China, 2015; ISBN 9787030433305. [Google Scholar]
  39. Jiang, L.H.; Wang, J.Z.; Zheng, Y.R. Foliage projective cover, effective tool for describing structure of plant communities. Acta Bot. Yunnanica 2004, 26, 166–172. [Google Scholar] [CrossRef]
  40. Wilson, K.B.; Baldocchi, D.D. Seasonal and interannual variability of energy fluxes over a broadleaved temperate deciduous forest in North America. Agric. For. Meteorol. 2000, 100, 1–18. [Google Scholar] [CrossRef]
  41. Broeckx, L.; Verlinden, M.S.; Berhongaray, G.; Zona, D.; Fichot, S.; Ceulemans, R. The effect of a dry spring on seasonal carbon allocation and vegetation dynamics in a poplar bioenergy plantation. GCB Bioenergy 2014, 6, 473–487. [Google Scholar] [CrossRef]
  42. Zuo, X.A.; Wang, S.K.; Lv, P.; Zhou, X.; Zhao, X.Y.; Zhang, T.H.; Zhang, J. Plant functional diversity enhances associations of soil fungal diversity with vegetation and soil in the restoration of semiarid sandy grassland. Ecol. Evol. 2016, 6, 318–328. [Google Scholar] [CrossRef] [PubMed]
  43. Köppler, M.R.; Kowarik, I.; Kühn, N.; Lippe, M.V. Enhancing wasteland vegetation by adding ornamentals: Opportunities and constraints for establishing steppe and prairie species on urban demolition sites. Landsc. Urban Plan. 2014, 126, 1–9. [Google Scholar] [CrossRef]
  44. Institute of Soil Sciences, Chinese Academy of Sciences (ISSCAS). Physical and Chemical Analysis Methods of Soils; Shanghai Science Technology Press: Shanghai, China, 1978. [Google Scholar]
  45. Cold and Arid Regions Science Data Center at Lanzhou. Available online: http://westdc.westgis.ac.cn (accessed on 21 April 2017).
  46. Hoeksema, R.J.; Clapp, R.B.; Thomas, A.L.; Hunley, A.E.; Farrow, N.D.; Dearstone, K.C. Cokriging model for estimation of water table elevation. Water Resour. Res. 1989, 25, 429–438. [Google Scholar] [CrossRef]
  47. Ahmadi, S.H.; Sedghamiz, A. Application and evaluation of kriging and cokriging methods on groundwater depth mapping. Environ. Monit. Assess. 2008, 138, 357–368. [Google Scholar] [CrossRef] [PubMed]
  48. Zhang, J.T.; Dong, Y. Factors affecting species diversity of plant communities and the restoration process in the loess area of China. Ecol. Eng. 2010, 36, 345–350. [Google Scholar] [CrossRef]
  49. Ter Braak, C.J.F.; Smilauer, P. Canoco Reference Manual and User’s Guide: Software for Ordination Version 5.0; Microcomputer Power: Ithaca, NY, USA, 2012. [Google Scholar]
  50. Heikkinen, R.K.; Luoto, M.; Kuussaari, M.; Pöyry, J. New insights into butterfly-environment relationships using partitioning methods. Proc. R. Soc. Lond. B Biol. Sci. 2005, 272, 2203–2210. [Google Scholar] [CrossRef] [PubMed]
  51. Lu, Z.X.; Wei, Y.P.; Xiao, H.L.; Zou, S.B.; Ren, J.; Lyle, C. Trade-offs between midstream agricultural production and downstream ecological sustainability in the Heihe River basin in the past half century. Agric. Water Manag. 2015, 152, 233–242. [Google Scholar] [CrossRef]
  52. Han, L.; Wang, H.Z.; Peng, J.; Chen, Y.L.; Pang, M. Soil physical and chemical properties under succession of plant community in desert riparian forest of the Tarim River. Ecol. Environ. Sci. 2010, 19, 2808–2814. [Google Scholar] [CrossRef]
  53. Stirzaker, R.J.; Passioura, J.B.; Wilms, Y. Soil structure and plant growth: Impact of bulk density and biopores. Plant Soil 1996, 185, 151–162. [Google Scholar] [CrossRef]
  54. Ravi, S.; Breshears, D.D.; Huxman, T.E.; D’Odorico, P. Land degradation in drylands: Interactions among hydrologic-aeolian erosion and vegetation dynamics. Geomorphology 2010, 116, 236–245. [Google Scholar] [CrossRef]
  55. Prieto, I.; Armas, C.; Pugnaire, F.I. Hydraulic lift promotes selective root foraging in nutrient-rich soil patches. Funct. Plant Biol. 2012, 39, 804–812. [Google Scholar] [CrossRef]
  56. Tilman, D.; Wedin, D.; Knops, J. Productivity and sustainability influenced by biodiversity in grassland ecosystems. Nature 1996, 379, 718–720. [Google Scholar] [CrossRef]
  57. Wang, H.Q.; Hall, C.A.S.; Cornell, J.D.; Hall, M.H.P. Spatial dependence and the relationship of soil organic carbon and soil moisture in the Luquillo experimental forest, Puerto Rico. Landsc. Ecol. 2002, 17, 671–684. [Google Scholar] [CrossRef]
  58. Ross, S.M. Organic matter in tropical soils: Current conditions, concerns and prospects for conservation. Prog. Phys. Geogr. 1993, 17, 265–305. [Google Scholar] [CrossRef]
  59. Jones, M.L.M.; Sowerby, A.; Williams, D.L.; Jones, R.E. Factors controlling soil development in sand dunes: Evidence from a coastal dune soil chronosequence. Plant Soil 2008, 307, 219–234. [Google Scholar] [CrossRef] [Green Version]
  60. Saco, P.M.; Willgoose, G.R.; Hancock, G.R. Eco-geomorphology and vegetation patterns in arid and semi-arid regions. Hydrol. Earth Syst. Sci. 2007, 11, 1717–1730. [Google Scholar] [CrossRef]
  61. Palpurina, S.; Wagner, V.; Von Wehrden, H.; Hájek, M.; Horsák, M.; Brinkert, A.; Hölzel, N.; Wesche, K.; Kamp, J.; Hájková, P.; et al. The relationship between plant species richness and soil pH vanishes with increasing aridity across Eurasian dry grasslands. Glob. Ecol. Biogeogr. 2017, 26, 425–434. [Google Scholar] [CrossRef]
  62. Li, J.; Yu, B.; Zhao, C.; Nowak, R.S.; Zhao, Z.; Sheng, Y.; Li, J. Physiological and morphological responses of Tamarix ramosissima and Populus euphratica to altered groundwater availability. Tree Physiol. 2013, 33, 57–68. [Google Scholar] [CrossRef] [PubMed]
  63. Feng, Q. Properties of ameliorated sandy land soil on semi-humid area. Bull. Soil Water Conserv. 1998, 18, 1–4. [Google Scholar] [CrossRef]
  64. Wu, G.L.; Ren, G.H.; Wang, D.; Shi, J.H.; Warrington, D. Above- and below-ground response to soil water change in an alpine wetland ecosystem on the Qinghai-Tibetan Plateau, China. J. Hydrol. 2013, 476, 120–127. [Google Scholar] [CrossRef]
  65. Wu, G.L.; Zhang, Z.N.; Wang, D.; Shi, J.H.; Zhu, Y.J. Interactions of soil water content heterogeneity and species diversity patterns in semi-arid steppes on the Loess Plateau of China. J. Hydrol. 2014, 519, 1362–1367. [Google Scholar] [CrossRef]
  66. Porazinska, D.L.; Bardgett, R.D.; Blaauw, M.B.; Hunt, H.W.; Parsons, A.N.; Seastedt, T.R.; Wall, D.H. Relationships at the aboveground-belowground interface: Plants, soil biota, and soil processes. Ecol. Monogr. 2003, 73, 377–395. [Google Scholar] [CrossRef]
  67. Zhu, Y.H.; Ren, L.L.; Skaggs, T.H.; Lu, H.S.; Yu, Z.B.; Wu, Y.Q. Simulation of Populus euphratica root uptake of groundwater in an arid woodland of the Ejina Basin, China. Hydrol. Process. 2009, 23, 2460–2469. [Google Scholar] [CrossRef]
Figure 1. The Heihe River basin in northwestern China and the locations of the sampling sites.
Forests 09 00034 g001
Figure 2. Relationship between soil properties and groundwater depth. (A) Gravimetric soil water content in 0–30 cm soil layer (%); (B) Gravimetric soil water content in 30–50 cm soil layer (%); (C) Soil bulk density (g/cm3); (D) Soil C:N ratio; (E) Soil total N (g/kg); (F) Soil total C (g/kg); (G) Soil available P (mg/kg); (H) Soil available K (mg/kg); (I) Soil electrical conductivity (ms/cm); (J) Soil pH.
Forests 09 00034 g002
Figure 3. Relationship between community characteristics and groundwater depth. (A) Species richness; (B) Aboveground biomass (g/m2); (C) Community height (cm); (D) Community coverage (%); (E) Foliage projective cover (%); (F) Leaf area index.
Forests 09 00034 g003
Figure 4. Variation partitioning of groundwater depth, soil bulk density, soil pH and their interactions in accounting for the variation of community characteristics. The numbers indicate the explanation percentage of variables and their interactions for variation.
Forests 09 00034 g004
Table 1. Plant community characteristics and mean groundwater depth from the close site to the far site perpendicular to the lower reaches of the Heihe River. Values are means ± SE (Standard Error). The site codes are the same as in Figure 1.
SiteDistance from RiverGroundwater Depth (m)Dominant SpeciesSpecies RichnessAboveground Biomass (g/m2)Community Coverage (%)Community Height (cm)Foliage Projective Cover (%)Leaf Area Index
S1300 m2.25 ± 0.14Tamarix ramosissima,
Sophora alopecuroides,
Salsola laricifolia Turcz.
43091 ± 218.777.6 ± 3.4287.7 ± 21.572.7 ± 5.82.3 ± 0.1
S2800 m2.40 ± 0.18T. Ramosissima, S. Alopecuroides, S. laricifolia42317.01 ± 223.478 ± 6.9254.7 ± 10.879.2 ± 0.52.1 ± 0.1
S31300 m2.44 ± 0.17T. Ramosissima, Lycium ruthenicum, Karelinia caspia, Peganum harmala5877.2 ± 46.082.9 ± 5.0191.3 ± 18.469.4 ± 3.82.0 ± 0.1
S42200 m2.63 ± 0.03T. Ramosissima, L. ruthenicum2326.9 ± 9.965 ± 3.9128 ± 7.243.7 ± 7.21.7 ± 0.0
S52450 m2.63 ± 0.08T. ramosissima1458.4 ± 113.156.2 ± 8.077.7 ± 14.746.9 ± 8.21.8 ± 0.1
S62700 m2.81 ± 0.17T. ramosissima1413.1 ± 35.457 ± 12.164.6 ± 1.226.8 ± 4.71.4 ± 0.1
S72950 m2.75 ± 0.19T. Ramosissima,
K. Caspia,
L. ruthenicum
3287.4 ± 40.224.3 ± 6.038.7 ± 0.916.9 ± 2.00.5 ± 0.0
S83200 m2.90 ± 0.34K. caspia197.5 ± 2.415 ± 1.736.8 ± 1.46 ± 1.10.3 ± 0.0
S93700 m2.94 ± 0.23T. ramosissima, L. ruthenicum,
K. caspia
3146.8 ± 18.425.4 ± 6.5118.9 ± 38.36 ± 1.10.4 ± 0.1
S104000 m3.12 ± 0.12Reaumuria songarica, Calligonum mongolicum222.6 ± 4.35.4 ± 0.527.5 ± 0.63.8 ± 0.50.2 ± 0.0
S114500 m3.26 ± 0.24R. songarica118.6 ± 3.43.2 ± 0.927.1 ± 3.64.4 ± 0.50.3 ± 0.0
Table 2. Soil properties of sampling sites. Values are means ± SE (Standard Error). The site codes are the same as in Figure 1.
SiteGravametric Soil Water Content in 0–30 cm (GSWC30) (%)Gravametric Soil Water Content in 30–50 cm (GSWC50) (%)Soil Bulk Density (SBD) (g/cm3)Soil Total Nitrogen (STN) (g/kg)Soil Total Carbon (STC) (g/kg)Soil Total Carbon/Soil Total Nitrogen (C:N)Soil Available P (SAP) (mg/kg)Soil Available K (SAK) (mg/kg)Soil pH (pH)Soil Electrical Conductivity (SEC) (ms/cm)
S124.82 ± 1.5529.19 ± 0.371.37 ± 0.010.78 ± 0.1021.63 ± 1.2428.01 ± 1.733.85 ± 0.44366.85 ± 64.289.24 ± 0.122.21 ± 0.48
S219.38 ± 2.1819.73 ± 3.331.53 ± 0.030.64 ± 0.0220.42 ± 0.5032.19 ± 1.393.81 ± 0.51378.34 ± 20.849.21 ± 0.011.68 ± 0.13
S318.43 ± 0.3822.61 ± 0.611.44 ± 0.010.87 ± 0.0216.64 ± 0.5819.04 ± 0.3112.30 ± 0.44331.58 ± 10.138.40 ± 0.045.71 ± 0.60
S44.45 ± 1.722.45 ± 0.241.34 ± 0.040.40 ± 0.0410.84 ± 0.0927.80 ± 3.316.09 ± 0.67390.28 ± 69.918.58 ± 0.0814.92 ± 3.80
S53.14 ± 0.474.68 ± 0.901.44 ± 0.050.43 ± 0.106.47 ± 0.9215.50 ± 1.135.68 ± 1.48378.63 ± 171.758.51 ± 0.0810.16 ± 3.54
S61.89 ± 0.333.03 ± 0.091.52 ± 0.040.26 ± 0.056.23 ± 0.3324.56 ± 2.684.75 ± 0.29188.67 ± 49.778.59 ± 0.105.60 ± 1.59
S77.19 ± 2.6211.03 ± 4.691.43 ± 0.020.33 ± 0.0211.90 ± 2.1136.13 ± 5.573.44 ± 0.38391.66 ± 56.388.60 ± 0.1213.44 ± 2.60
S85.27 ± 1.379.81 ± 0.581.45 ± 0.000.31 ± 0.0412.72 ± 0.4242.54 ± 4.213.32 ± 0.35401.12 ± 36.268.46 ± 0.1013.29 ± 2.22
S91.05 ± 0.224.70 ± 1.001.45 ± 0.020.28 ± 0.066.53 ± 0.3725.25 ± 4.153.36 ± 0.20181.07 ± 32.788.64 ± 0.053.42 ± 0.55
S100.73 ± 0.040.85 ± 0.091.55 ± 0.040.11 ± 0.015.71 ± 0.4951.43 ± 3.012.86 ± 0.1689.46 ± 10.599.18 ± 0.800.68 ± 0.13
S110.54 ± 0.110.95 ± 0.181.73 ± 0.010.15 ± 0.016.11 ± 0.5141.51 ± 3.132.81 ± 0.1273.76 ± 7.048.73 ± 0.110.89 ± 0.03
Table 3. Marginal and conditional effects obtained from the forward selection of the Monte Carlo test.
Marginal EffectsConditional Effectsp ValueF Value
Environmental VariablesEigenvaluesEnvironmental VariablesEigenvalues
Groundwater depth85.3Groundwater depth85.30.001180.0
Soil total nitrogen64.6Soil bulk density1.10.0332.7
GSWC3056.9Soil pH1.10.0352.5
Soil total carbon50.9GSWC501.00.0472.4
GSWC5050.6Soil total nitrogen0.80.0782.1
Soil C:N31.1Soil C:N0.70.1591.7
Soil available K29.7SEC0.50.2531.4
Soil bulk density27.4Soil total carbon0.50.2621.3
Soil available P20.2Soil available P0.50.2771.3
Soil pH2.6GSWC300.20.6510.6
SEC1.4Soil available K0.10.8470.3

