Adaptation to Climate Change in Forestry: A Multiple Correspondence Analysis (MCA)


Abstract
1. Introduction
2. Materials and Methods
2.1. Definitions
2.2. Data
- -
- Climat * (Climate, Climate change, Climatic) OR Adapt * (Adaptation, Adaptive)
- -
- Forest * (Forest, Forestry, Forest management, Forest owner)
- -
- Risk * (Risk, Risk perception, Risk management, Risk attitude)
- -
- Econo * (Economics, Economy)
2.3. Statistical Analysis
2.3.1. Indicator Matrix
2.3.2. Burt Matrix
2.3.3. Adjusted Multiple Correspondence Analysis (MCA)
3. Results
3.1. Descriptive Statistics
3.2. Dimensional Presentation of MCA
3.2.1. Intra-Dimensional Results
3.2.2. Inter-Dimensional Results
4. Discussion
5. Conclusions
Two Other Findings Emerging from This Work
Supplementary Materials
Acknowledgments
Author Contributions
Conflicts of Interest
Appendix A


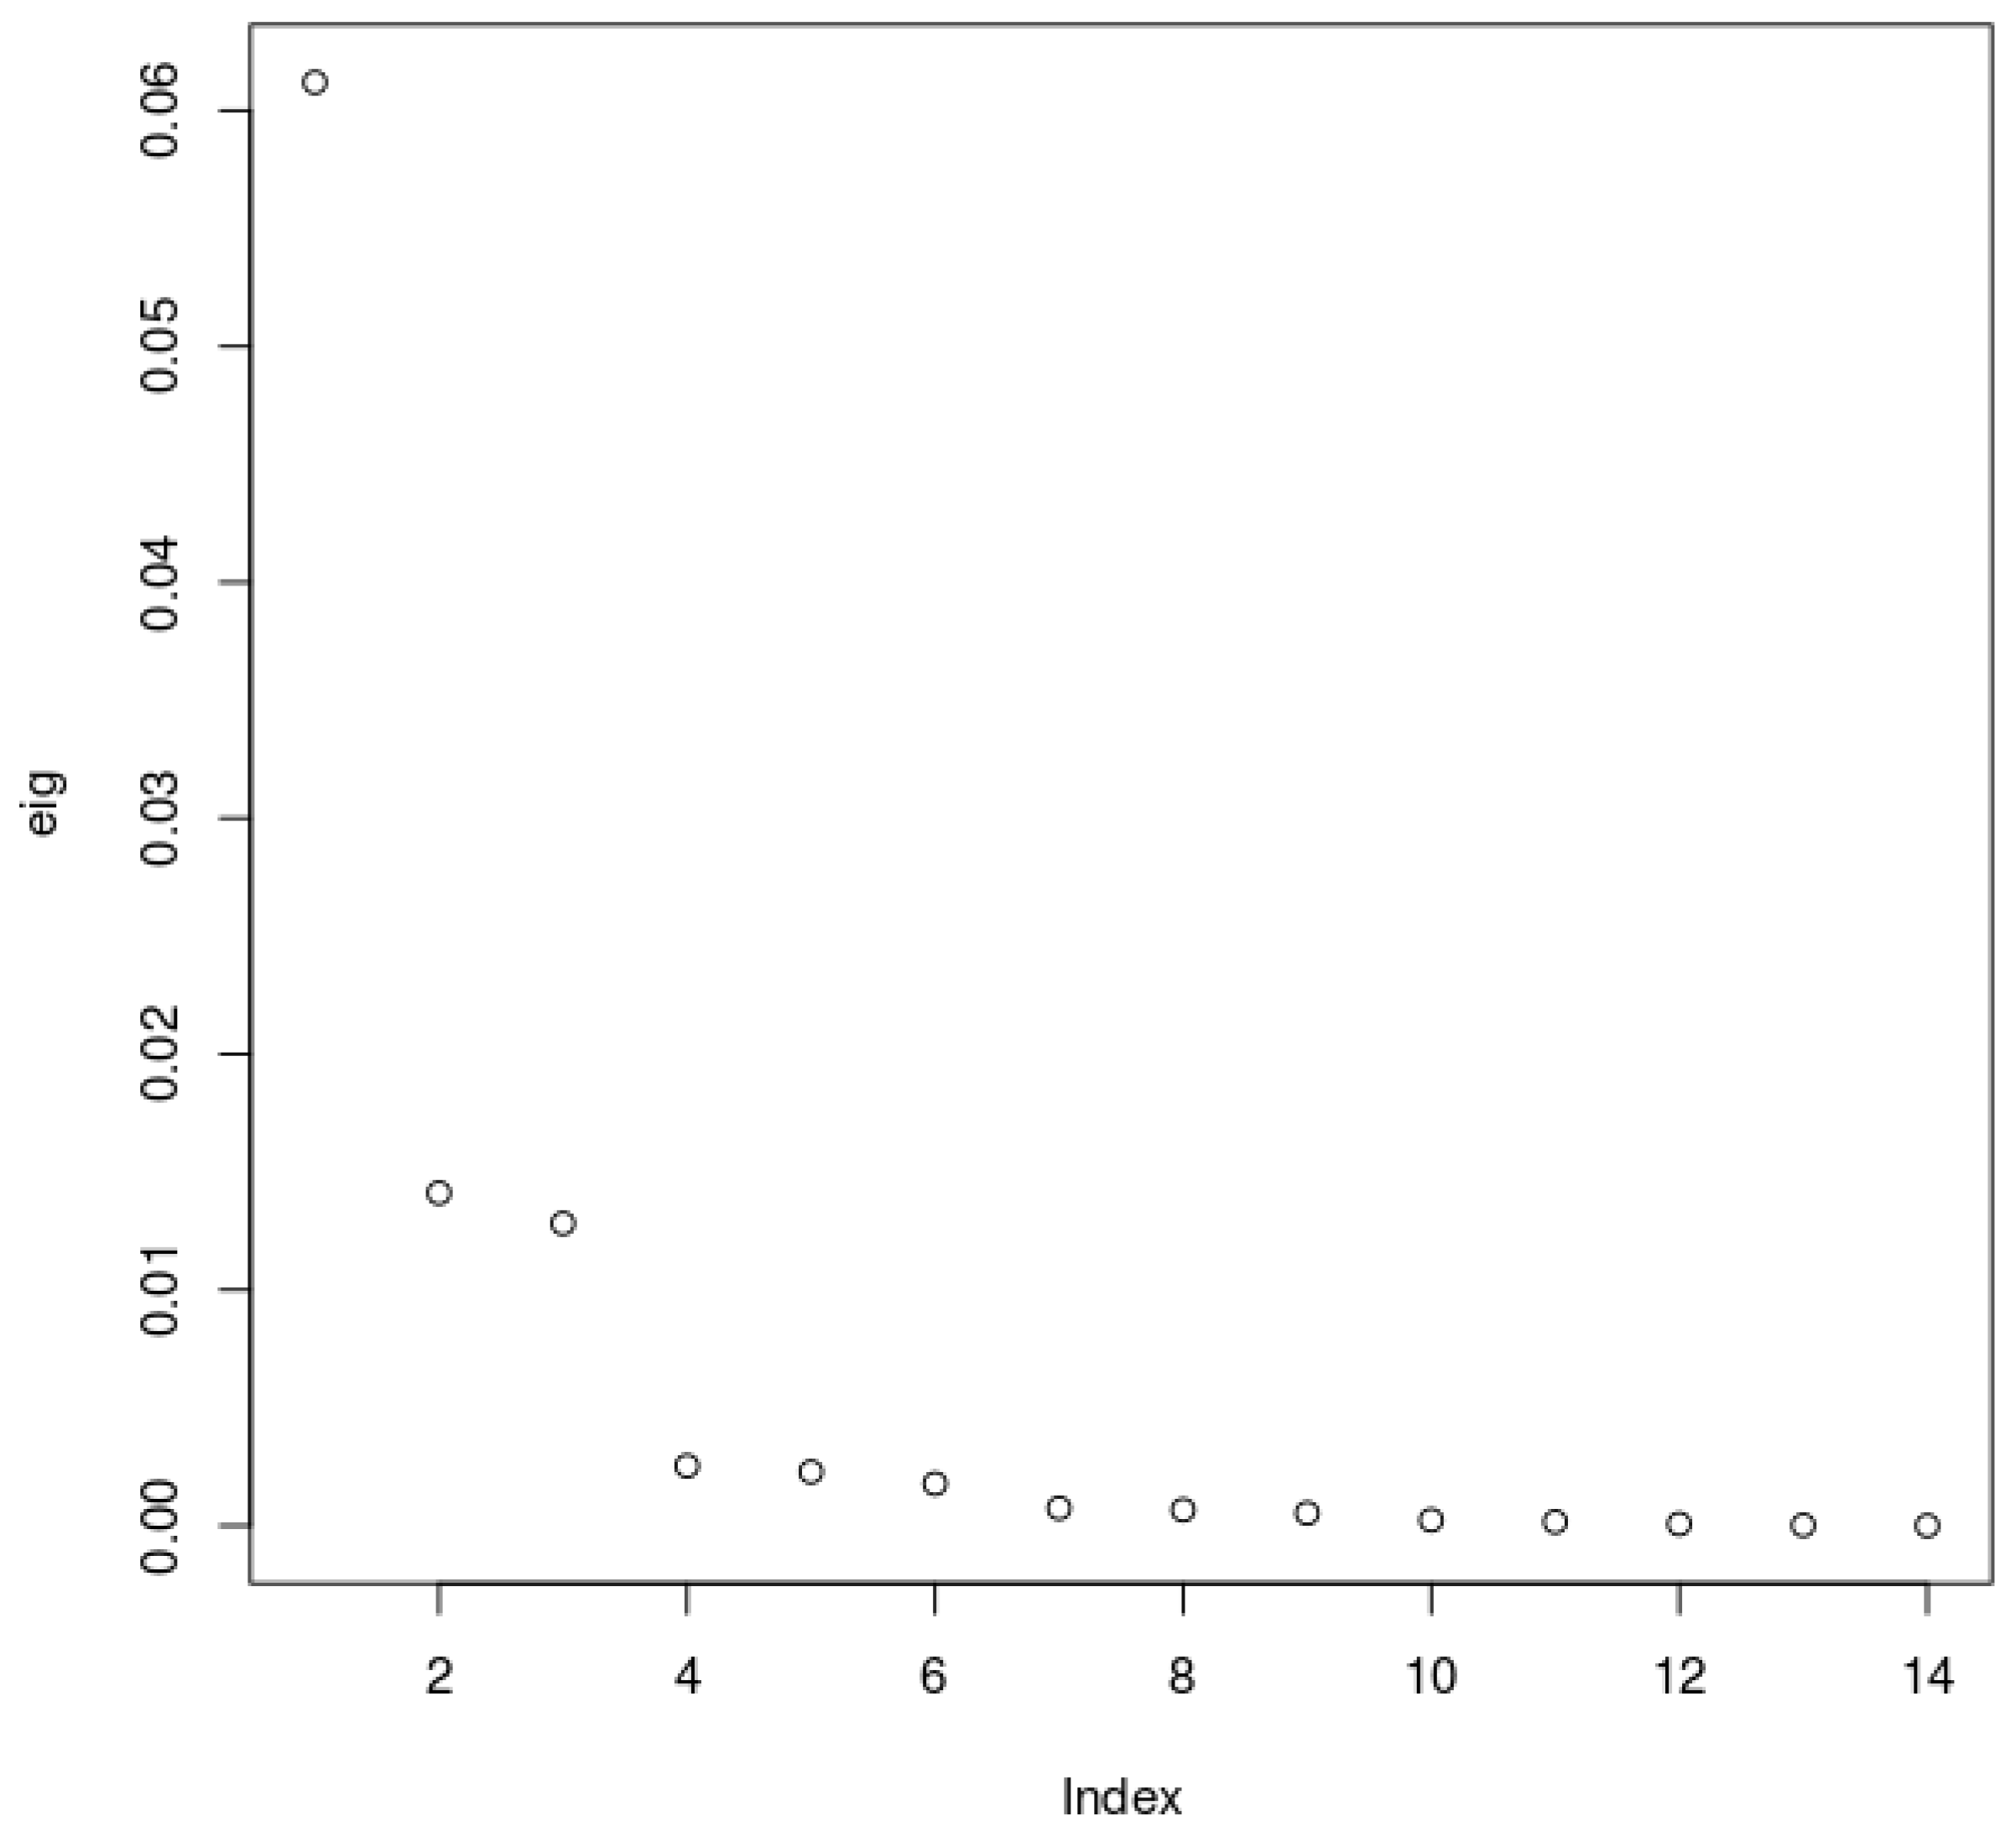
| Dimension No. | Eigenvalue | % Explained Variance | Cumulative Explained Variance % |
|---|---|---|---|
| 1 | 0.061195 | 50.4 | 50.4 |
| 2 | 0.014111 | 11.6 | 62.1 |
| 3 | 0.01282 | 10.6 | 72.6 |
| 4 | 0.002538 | 2.1 | 74.7 |
| 5 | 0.002285 | 1.9 | 76.6 |
| 6 | 0.001785 | 1.5 | 78.1 |
| 7 | 0.000746 | 0.6 | 78.7 |
| 8 | 0.00067 | 0.6 | 79.3 |
| 9 | 0.000535 | 0.4 | 79.7 |
| 10 | 0.000239 | 0.2 | 79.9 |
| 11 | 0.000166 | 0.1 | 80 |
| 12 | 7.7 × | 0.1 | 80.1 |
| 13 | 2.2 × | 0 | 80.1 |
| 14 | 4.0 × | 0 | 80.1 |
| Sum of eigenvalues | 0.121305 | - | - |
| Total explained deviation | 0.348288 | - | - |
Appendix B
| VARIABLE: Category | Dim1 % | Dim2 % | Dim3 % |
|---|---|---|---|
| RISK TYPE: Ecology | 2.0 | 1.4 | 0.1 |
| RISK TYPE: Economy | 0.1 | 2.1 | 1.1 |
| RISK TYPE: Sociology/Policy | 4.9 | 0 | 0.9 |
| ADAPT STRAT: Planned | 0.6 | 0 | 0.1 |
| ADAPT STRAT: Reactive | 1.3 | 3.6 | 0.9 |
| ADAPT STRAT: BAU/NA | 0 | 3.1 | 0.2 |
| CLIMATIC: Temperature | 0.9 | 0.5 | 3.1 |
| CLIMATIC: Precipitation | 0 | 1.1 | 2.2 |
| CLIMATIC: NA | 0.4 | 0.1 | 2.6 |
| ABIOTIC: Wind/Storm | 0.1 | 0.3 | 0 |
| ABIOTIC: Fire | 0 | 5.7 | 0.1 |
| ABIOTIC: NA | 0.1 | 4.5 | 0 |
| BIOTIC: Fungi/Disease | 1.1 | 0.7 | 1.1 |
| BIOTIC: Invasive/Insects | 0.1 | 2.9 | 0.1 |
| BIOTIC: NA | 0.5 | 1.3 | 0.0 |
| OBJECTIVE: Economic profit | 4.0 | 1.3 | 0.2 |
| OBJECTIVE: Ecological sustainability | 1.5 | 0.1 | 1.5 |
| OBJECTIVE: Socio-political | 3.8 | 0.4 | 0.2 |
| RESULT ECON: Cost-benefit/yield/services | 4.7 | 4.2 | 1.2 |
| RESULT ECON: Management goals and constraints | 0.7 | 0.1 | 3.8 |
| RESULT ECON: NA | 2.6 | 0.7 | 0.6 |
| RESULT PERCEPT: Perception of uncertainty and belief updating | 3.0 | 0.3 | 0.0 |
| RESULT PERCEPT: Perception of Management and research | 1.9 | 0.1 | 0.3 |
| RESULT PERCEPT: NA | 3.9 | 0.3 | 0.0 |
| RESULT IMPACT: ID of impacts | 0.7 | 2.6 | 2.0 |
| RESULT IMPACT: Impact distribution | 2.4 | 1.0 | 1.2 |
| RESULT IMPACT: NA | 1.6 | .3 | 2.0 |
| RESULT ASSESS: Policy implementation | 0.5 | 1.5 | 0.4 |
| RESULT ASSESS: Adaptation measure and barriers | 0 | 2.6 | 5.3 |
| RESULT ASSESS: NA | 0 | 3.1 | 2.2 |
| TYPE: Complex | 6.8 | 3.7 | 0 |
| TYPE: Empirical | 5.0 | 2.5 | 1.2 |
| TYPE: Qualitative and theoretical | 2 | 6.1 | 0.6 |
| METHOD: Economical analysis | 0.9 | 3.5 | 0.1 |
| METHOD: Literature review/Qualitative/Survey | 2.8 | 1.9 | 0 |
| METHOD: Simulation | 6.3 | 3.1 | 0 |
| POPULATION: Forest managers and academics | 2.0 | 0.9 | 0.1 |
| POPULATION: Forest owners | 5.8 | 5.3 | 0 |
| POPULATION: NA | 4.3 | 0.3 | 0.1 |
| CATEGORY: Risk assessment and impacts | 2.0 | 1.8 | 10.5 |
| CATEGORY: Risk management | 0.8 | 0 | 15.7 |
| CATEGORY: Risk perception | 7.8 | 3.2 | 0.8 |
| SUB-CAT IMPACT: On productivity and growth | 0.1 | 2.8 | 4.6 |
| SUB-CAT IMPACT: Damage | 0.3 | 2.4 | 0.1 |
| SUB-CAT IMPACT: NA | 0.1 | 1.1 | 0.8 |
| SUB-CAT RISK ASS: Probability of occurrence | 0.3 | 0.1 | 0.6 |
| SUB-CAT RISK ASS: Distribution of damage | 0.4 | 9.1 | 4.2 |
| SUB-CAT RISK ASS: NA | 0.2 | 2.9 | 1.9 |
| SUB-CAT MANAGE: Prevention/Insurance | 0.7 | 0 | 14.2 |
| SUB-CAT MANAGE: Silvicultural management | 0.1 | 0.1 | 2.9 |
| SUB-CAT MANAGE: NA | 0.4 | 0 | 7.6 |
| SUB-CAT PERCEPT: Climate change and impacts | 2.2 | 1.7 | 0.5 |
| SUB-CAT PERCEPT: Management options | 4.8 | 0.5 | 0.1 |
| SUB-CAT PERCEPT: NA | 2.0 | 0.6 | 0.2 |
| Minimum dimensional contribution | 1.8 | 1.8 | 1.8 |
Appendix C
| Variable | Modality 1 | Modality 2 | Modality 3 | |
|---|---|---|---|---|
| Characteristics of the paper | ||||
| Methodology | Economic analysis (N = 2) | Literature review/Qualitative/Survey (N = 64) | Simulation (N = 23) | |
| Objective | Economic profit (N = 22) | Ecological sustainability (N = 15) | Socio-political (N = 52) | |
| Theoretical/Empirical/Complex | Complex (N = 25) | Empirical (N = 19) | Theoretical (N = 45) | |
| Population | Forest managers/Academics (N = 20) | Forest owners (N = 14) | NA (N = 55) | |
| Description of the risk and adaptation | ||||
| Risk type | Ecological (N = 36) | Economical (N = 31) | Socio-political (N = 22) | |
| Climate Change | Temperature (N = 30) | Precipitation (N = 3) | NA (N = 56) | |
| Abiotic | Wind/Snow/Storm (N = 27) | Fire (N = 20) | NA (N = 42) | |
| Biotic | Fungi/Disease (N = 7) | Invasive/Pest/Insect (N = 35) | NA (N = 47) | |
| Adaptation type | Planned (N = 47) | Reactive (N = 19) | Business-as-usual (N = 23) | |
| Topic | ||||
| Category | Risk assessment and impacts (N = 33) | Risk management (N = 33) | Risk perception (N = 23) | |
| Sub-category (Impact of risk) | Production /Productivity/Growth (N = 14) | Damage (N = 3) | NA (N = 72) | |
| Sub-category (Risk assessment) | Probability of occurrence (N = 3) | Damage/Distribution (N = 22) | NA (N = 64) | |
| Sub-category (Risk management) | Prevention/Insurance (N = 26) | Silvicultural management (N = 2) | NA (N = 61) | |
| Sub-category (Risk perception) | About climate change/Impacts (N = 8) | About management options (N = 12) | NA (N = 68) | |
| Result | ||||
| Result (Economic profit/loss) | Cost-benefit/Yield (N = 13) | Management goal/Impact constraints (N = 23) | NA (N = 53) | |
| Result (Perception/Social attitude) | Attitude/Perception of uncertainty/Updating beliefs (N = 31) | Management/Research (N = 9) | NA (N = 49) | |
| Result (Ecological impacts) | Identification of vulnerabilities, impacts, disturbances, biotic shifts (N = 21) | Distribution/Scale/Assessment (N = 13) | NA (N = 55) | |
| Result (Assessment/Vulnerability) | Political implementation of adaptation (N = 10) | Adaption/Mitigation/Barriers (N = 29) | NA (N = 50) | |
References
- Intergovernmental Panel on Climate Change (IPCC). Climate Change 2001: Impacts, Adaptation and Vulnerability; IPCC Third Assessment Report; Cambridge University Press: Cambridge, UK, 2001. [Google Scholar]
- Tol, R.S.J. Adaptation and mitigation: Trade-offs in substance and methods. Environ. Sci. Policy 2005, 8, 572–578. [Google Scholar] [CrossRef]
- Parry, M.L.; Arnell, N.W.; Hulme, M.; Nicholls, R.J.; Livermore, M. Adaptation to the inevitable. Nature 1998, 395, 741. [Google Scholar] [CrossRef]
- Wigley, T.M.L. Implications of recent CO2 emission-limitation proposals for stabilization of atmospheric concentrations. Nature 1997, 390, 267–270. [Google Scholar] [CrossRef]
- Seppälä, R. A global assessment on adaptation of forests to climate change. Scand. J. For. Res. 2009, 24, 469–472. [Google Scholar] [CrossRef]
- Keenan, R.J. Climate change impacts and adaptation in forest management: A review. Ann. For. Sci. 2015, 72, 145–167. [Google Scholar] [CrossRef]
- Smit, B.; Burton, I.; Klein, R.J.T.; Wandel, J. An Anatomy of Adaptation to Climate Change and Variability. Clim. Chang. 2000, 45, 223–251. [Google Scholar] [CrossRef]
- Yousefpour, R.; Jacobsen, J.B.; Thorsen, B.J.; Meilby, H.; Hanewinkel, M.; Oehler, K. A review of decision-making approaches to handle uncertainty and risk in adaptive forest management under climate change. Ann. For. Sci. 2012, 69, 1–15. [Google Scholar] [CrossRef]
- Spittlehouse, D.L.; Stewart, R.B. Adaptation to climate change in forest management. BC J. Ecosyst. Manag. 2003, 4, 1–11. [Google Scholar]
- Blate, G.; Joyce, L.; Littell, J.; McNulty, S.; Millar, C.; Moser, S.; Neilson, R.; O’Halloran, K.; Peterson, D. Adapting to climate change in United States national forests. Unasylva 2009, 60, 57–62. [Google Scholar]
- Ravindranath, N. Mitigation and adaptation synergy in forest sector. Mitig. Adapt. Strateg. Glob. Chang. 2007, 12, 843–853. [Google Scholar] [CrossRef]
- Ogden, A.E.; Innes, J. Incorporating climate change adaptation considerations into forest management planning in the boreal forest. Int. For. Rev. 2007, 9, 713–733. [Google Scholar] [CrossRef]
- Bolte, A.; Ammer, C.; Löf, M.; Madsen, P.; Nabuurs, G.-J.; Schall, P.; Spathelf, P.; Rock, J. Adaptive forest management in central Europe: Climate change impacts, strategies and integrative concept. Scand. J. For. Res. 2009, 24, 473–482. [Google Scholar] [CrossRef]
- Wagner, S.; Nocentini, S.; Huth, F.; Hoogstra-Klein, M. Forest management approaches for coping with the uncertainty of climate change: Trade-offs in service provisioning and adaptability. Ecol. Soc. 2014, 19, 32. [Google Scholar] [CrossRef]
- Ohlson, D.; McKinnon, G.; Hirsch, K. A structured decision-making approach to climate change adaptation in the forest sector. For. Chron. 2005, 81, 97–103. [Google Scholar] [CrossRef]
- Monirul, M.; Mirza, Q. Climate change and extreme weather events: Can developing countries adapt? Clim. Policy 2003, 3, 233–248. [Google Scholar]
- Boisvenue, C.; Running, S. Impacts of climate change on natural forest productivity—Evidence since the middle of the 20th century. Glob. Chang. Biol. 2006, 12, 862–882. [Google Scholar] [CrossRef]
- Booth, T. Eucalypt plantations and climate change. For. Ecol. Manag. 2013, 301, 28–34. [Google Scholar] [CrossRef]
- Lindner, M.; Fitzgerald, J.B.; Zimmermann, N.E.; Reyer, C.; Delzon, S.; van der Maaten, E.; Schelhaas, M.-J.; Lasch, P.; Eggers, J.; van der Maaten-Theunissen, M.; et al. Climate change and European forests: What do we know, what are the uncertainties, and what are the implications for forest management? J. Environ. Manag. 2014, 146, 69–83. [Google Scholar] [CrossRef] [PubMed]
- Kolström, M.; Lindner, M.; Vilén, T.; Maroschek, M.; Seidl, R.; Lexer, M.; Nether, S.; Kremer, A.; Delzon, S.; Barbati, A.; et al. Reviewing the Science and Implementation of Climate Change Adaptation Measures in European Forestry. Forests 2011, 2, 961–982. [Google Scholar] [CrossRef]
- Rist, L.; Moen, J. Sustainability in forest management and a new role for resilience thinking. For. Ecol. Manag. 2013, 310, 416–427. [Google Scholar] [CrossRef]
- Intergovernmental Panel on Climate Change (IPCC). Energy Supply. Chapter 4. In Assessment Report of Working Group III; Cambridge University Press: New York, NY, USA, 2007. [Google Scholar]
- Schou, E.; Jacobsen, J.B.; Kristensen, K.L. An economic evaluation of strategies for transforming even-aged into near-natural forestry in a conifer-dominated forest in Denmark. For. Policy Econ. 2012, 20, 89–98. [Google Scholar] [CrossRef]
- Yousefpour, R.; Temperli, C.; Bugmann, H.; Elkin, C.; Hanewinkel, M.; Meilby, H.; Jacobsen, J.B.; Thorsen, B.J. Updating beliefs and combining evidence in adaptive forest management under climate change: A case study of Norway spruce (Picea abies L. Karst) in the Black Forest, Germany. J. Environ. Manag. 2013, 122, 56–64. [Google Scholar] [CrossRef] [PubMed]
- Bernier, P.; Schoene, D. Adapting forests and their management to climate change: An overview. Unasylva 2009, 60, 5–11. [Google Scholar]
- Nelson, H.W.; Williamson, T.B.; Macaulay, C.; Mahony, C. Assessing the potential for forest management practitioner participation in climate change adaptation. For. Ecol. Manag. 2016, 360, 388–399. [Google Scholar] [CrossRef]
- Greenacre, M.; Blasius, J. Multiple Correspondence Analysis and Related Methods; Taylor and Francis Group: Boca Raton, FL, USA, 2006; p. 41. [Google Scholar]
- Nenadić, O.; Greenacre, M. Computation of Multiple Correspondence Analysis, with Code in R; UFP Working Paper; Universitat Pompeu Fabra (UFP): Barcelona, Spain, 2005; Volume 887. [Google Scholar]
- Abdi, H.; Valentin, D. Multiple Correspondence Analysis. In Encyclopedia of Measurement and Statistics; Salkind, N., Ed.; Sage: Thousand Oaks, CA, USA, 2007. [Google Scholar]
- Greenacre, M.; Nenadić, O.; Friendly, M. Package ‘CA’. Available online: https://cran.r-project.org/web/packages/ca/ca.pdf (accessed on 1 July 2016).
- Healey, J. The Essentials of Statistics: A Tool for Social Research, 3rd ed.; Wadsworth: Belmont, CA, USA, 2013. [Google Scholar]
- Field, A.; Miles, J.; Field, Z. Discovering Statistics Using R; Sage Publications Ltd.: London, UK; Thousand Oaks, CA, USA; NewDehli, India; Singapore, 2012. [Google Scholar]
- Greenacre, M. Chapter 11: Contributions to Inertia. Correspondence Analysis in Practice, 2nd ed.; Taylor and Francis Group: Boca Raton, FL, USA, 2007. [Google Scholar]
- Mupepele, A.C.; Walsh, J.; Sutherland, W.; Dormann, F. An evidence assessment tool for ecosystem services and conservation studies. Ecol. Appl. 2016, 26, 1295–1301. [Google Scholar] [CrossRef] [PubMed]
- Clarke, H.R.; Reed, W.J. The tree-cutting problem in a stochastic environment: The case of age-dependent growth. J. Econ. Dyn. Control 1989, 13, 569–595. [Google Scholar] [CrossRef]
- Brunette, M.; Cabantous, L.; Couture, S.; Stenger, A. The impact of governmental assistance on insurance demand under ambiguity: A theoretical model and an experimental test. Theory Decis. 2013, 75, 153–174. [Google Scholar] [CrossRef]
- Brunette, M.; Couture, S.; Pannequin, F. Is forest insurance a relevant vector to induce adaptation efforts to climate change? Ann. For. Sci. 2017, 74, 41. [Google Scholar] [CrossRef]
- Lidskog, R.; Sjödin, D. Why do forest owners fail to heed warnings? Conflicting risk evaluations made by the Swedish forest agency and forest owners. Scand. J. For. Res. 2014, 29, 275–282. [Google Scholar] [CrossRef]
- Musshoff, O.; Maart-Noelck, S.C. An experimental analysis of the behavior of forestry decision-makers—The example of timing in sales decisions. For. Policy Econ. 2014, 41, 31–39. [Google Scholar] [CrossRef]
- Sauter, P.A.; Musshoff, O.; Möhring, B.; Wilhelm, S. Faustmann vs. real options theory—An experimental investigation of forester’s harvesting decisions. J. For. Econ. 2016, 24, 1–20. [Google Scholar]
- Brunette, M.; Foncel, J.; Kéré, E.N. Attitude towards Risk and Production decision: An Empirical analysis on French private forest owners. Environ. Model. Assess. 2017, 22, 563–576. [Google Scholar] [CrossRef]
- Pasgaard, M.; Strange, N. A quantitative analysis of the causes of the global climate change research distribution. Glob. Environ. Chang. 2013, 23, 1684–1693. [Google Scholar] [CrossRef]
- Yousefpour, R.; Hanewinkel, M.; Le Moguédec, G. Evaluating the Suitability of Management Strategies of Pure Norway Spruce Forests in the Black Forest Area of Southwest Germany for Adaptation to or Mitigation of Climate Change. Environ. Manag. 2010, 45, 387–402. [Google Scholar] [CrossRef] [PubMed]
- Yousefpour, R.; Hanewinkel, M. Balancing Decisions for Adaptive and Multipurpose Conversion of Norway Spruce (Picea abies L. Karst) Monocultures in the Black Forest Area of Germany. For. Sci. 2014, 60, 73–84. [Google Scholar] [CrossRef]
- Blennow, K.; Sallnäs, O. Risk Perception among Non-industrial Private Forest Owners. Scand. J. For. Res. 2002, 17, 472–479. [Google Scholar] [CrossRef]
- Eriksson, L.O.; Backéus, S.; Garcia, F. Implications of growth uncertainties associated with climate change for stand management. Eur. J. For. Res. 2012, 131, 1199–1209. [Google Scholar] [CrossRef]
- Eriksson, L. Risk Perception and Responses among Private Forest Owners in Sweden. Small Scale For. 2014, 13, 483–500. [Google Scholar] [CrossRef]

© 2018 by the authors. Licensee MDPI, Basel, Switzerland. This article is an open access article distributed under the terms and conditions of the Creative Commons Attribution (CC BY) license (http://creativecommons.org/licenses/by/4.0/).
Share and Cite
Brunette, M.; Bourke, R.; Hanewinkel, M.; Yousefpour, R. Adaptation to Climate Change in Forestry: A Multiple Correspondence Analysis (MCA). Forests 2018, 9, 20. https://doi.org/10.3390/f9010020
Brunette M, Bourke R, Hanewinkel M, Yousefpour R. Adaptation to Climate Change in Forestry: A Multiple Correspondence Analysis (MCA). Forests. 2018; 9(1):20. https://doi.org/10.3390/f9010020
Chicago/Turabian StyleBrunette, Marielle, Robin Bourke, Marc Hanewinkel, and Rasoul Yousefpour. 2018. "Adaptation to Climate Change in Forestry: A Multiple Correspondence Analysis (MCA)" Forests 9, no. 1: 20. https://doi.org/10.3390/f9010020
APA StyleBrunette, M., Bourke, R., Hanewinkel, M., & Yousefpour, R. (2018). Adaptation to Climate Change in Forestry: A Multiple Correspondence Analysis (MCA). Forests, 9(1), 20. https://doi.org/10.3390/f9010020