Article

Forest Floor and Mineral Soil Respiration Rates in a Northern Minnesota Red Pine Chronosequence

1
Department of Forest Engineering Resources and Management, Oregon State University, 280 Peavy Hall, Corvallis, OR 97331, USA
2
USDA Forest Service Northern Research Station, 1831 Hwy 169 E, Grand Rapids, MN 55744, USA
3
US Geological Survey Southwest Biological Science Center, 2255 N. Gemini Dr., Flagstaff, AZ 86001, USA
4
School of Forest Resources and Environmental Science, Michigan Technological University, 1400 Townsend Drive, Houghton, MI 49931, USA
*
Author to whom correspondence should be addressed.
Forests 2018, 9(1), 16; https://doi.org/10.3390/f9010016
Submission received: 31 October 2017 / Revised: 23 December 2017 / Accepted: 25 December 2017 / Published: 29 December 2017
(This article belongs to the Special Issue Carbon and Nitrogen in Forest Ecosystems—Series I)

Abstract

:
We measured total soil CO2 efflux (RS) and efflux from the forest floor layers (RFF) in red pine (Pinus resinosa Ait.) stands of different ages to examine relationships between stand age and belowground C cycling. Soil temperature and RS were often lower in a 31-year-old stand (Y31) than in 9-year-old (Y9), 61-year-old (Y61), or 123-year-old (Y123) stands. This pattern was most apparent during warm summer months, but there were no consistent differences in RFF among different-aged stands. RFF represented an average of 4–13% of total soil respiration, and forest floor removal increased moisture content in the mineral soil. We found no evidence of an age effect on the temperature sensitivity of RS, but respiration rates in Y61 and Y123 were less sensitive to low soil moisture than RS in Y9 and Y31. Our results suggest that soil respiration’s sensitivity to soil moisture may change more over the course of stand development than its sensitivity to soil temperature in red pine, and that management activities that alter landscape-scale age distributions in red pine forests could have significant impacts on rates of soil CO2 efflux from this forest type.

1. Introduction

Soil respiration represents about 70% of ecosystem respiration in temperate forests [1,2], and includes a combination of respiration from plant roots, mycorrhizae, and microorganisms in the leaf litter, humus, and mineral soil. Variables such as soil temperature [3,4], soil moisture [2,5,6,7], litter quality and quantity [4,8], and local stand structure [3,9] exert strong controls over soil respiration in forests. Soil temperature and soil moisture may also covary seasonally, or show varying relationships across sites, leading to confounded effects on soil respiration [10,11]. Changes in these variables that occur over the course of stand development could also lead to changes in soil respiration as forests age. Soil temperatures and moisture availability, for instance, may vary between young, open-canopied regenerating stands and stands with a dense, closed canopy representative of the stem exclusion phase of development. As land management agencies begin to incorporate C storage and sequestration into their management goals there is an increasing need to understand how developmental changes influence belowground C cycling.
Soil C cycling can display a large amount of within-system and among-system variability as forests age and develop. Estimates of soil respiration derived from relationships between net primary production and net ecosystem production suggest a characteristic age-related trend in which the heterotrophic components of soil respiration (micro- and macro-fauna) in temperate forests are expected to decline with age, and the autotrophic portion of soil respiration (plant roots and associated mycorrhizae) are expected to peak in middle-aged stands as net primary production (NPP) and, therefore, substrate supplies peak [12]. Direct measurements of soil respiration in stands of different ages, however, have shown that total soil CO2 efflux (RS) can (1) initially increase with age, peaking in young-intermediate-aged, closed canopy stands before declining with age in mature to older stands [4,13,14]; (2) decrease with age [15]; (3) increase steadily from young to old-growth stands [6,16]; or (4) show opposing age-related trends across the geographic range of the same forest type [17]. This variability in age-related soil respiration trends among different systems underscores the need for ecosystem-specific studies.
While respiration from roots and associated mycorrhizae make up the largest proportion of soil respiration [18], estimates of respiration associated with decomposition of the forest floor layers range from 5–48% of total soil respiration in temperate forests [4,18,19,20,21,22]. There are no clearly established patterns of respiration from the forest floor layers (RFF) across stands of different ages, but RS generally has positive correlations with forest floor mass or thickness [3,15,23]. This suggests that RFF could increase with stand age in forests that are characterized by slow litter decay rates and a resulting increase in forest floor thickness over time. Forests dominated by evergreen conifers, for instance, often accumulate forest floor mass and thickness as they age [24,25], which could lead to increased RFF in older stands. The accumulation of forest floor layers during stand development can also exert a large indirect influence on mineral soil respiration by altering soil temperature and moisture or providing leachate of labile substrate into the mineral soil [26,27].
Understanding how stand age influences C cycling is particularly important because forest management activities have direct impacts on landscape-scale age distributions. Different rotation lengths, for instance, can result in dramatically different abundances of young vs. old stands. This would have significant impacts on soil C losses for systems that show a high degree of variability in soil respiration among age classes. The collection of harvest residues and residual wood as a feedstock for biofuel production can also reduce forest floor and mineral soil C and nutrient stocks [28,29,30], and litter removal clearly impacts both soil respiration and other soil processes [20,31].
We conducted an experiment to characterize age-related differences in total soil respiration (RS) and respiration from the forest floor layers (RFF) in red pine (Pinus resinosa Ait.) stands aged 9–123 years. Productivity in managed red pine systems peaks between 130 and 140 years across a range of basal areas [32], so we expected RS to increase steadily with age across our chronosequence due to increases in autotrophic respiration linked to increasing NPP [33]. We also predicted that RFF would increase with age across the chronosequence because forest floor C (and thus, forest floor mass) increases steadily with age up to at least 150 years in red pine forests [25], and forest floor mass is positively correlated with RS [3,15,23].

2. Materials and Methods

2.1. Study Area

Our study sites included four red pine stands on the Chippewa National Forest in northern Minnesota, USA. The study sites included an open, 9-year-old stand of red pine saplings that were planted following the clearcutting of the previous red pine stand (Y9), a 31-year-old plantation in the early stages of stem exclusion (Y31), a 61-year-old plantation with a well-developed shrub layer and some tree recruitment in the understory (Y61), and a 123 year-old naturally-regenerated stand with a well-develop shrub and understory tree layer (Y123). Three of the stands were located in close proximity (within 1000 m of one another), and the fourth (Y61) was located 5 km to the west.
Forest floor and soil characteristics, live tree density, and basal area varied somewhat by stand age (Table 1). Red pine represented 94–98% of the basal area of stems ≥2.5 cm in diameter in Y31, Y61, and Y123, with eastern white pine (Pinus strobus L.), paper birch (Betula papyrifera Marsh.), balsam fir (Abies balsamea L.), and northern red oak (Quercus rubra L.) each representing anywhere from 0–3.4% of the remaining basal area within these stands. Y9 had very little basal area of stems ≥2.5 cm in diameter. Hardwoods represented < 2% of basal area in any stand. Beaked hazel (Corylus cornuta Marsch.), balsam fir, juneberries (Amelanchier spp.), and blueberries (Vaccinium spp.) were the dominant understory shrubs and saplings, with a much more developed shrub, sapling, and herbaceous layer in the young, open-canopied Y9 than the other stands.
Study sites were selected to minimize variability in edaphic and physiographic characteristics that could contribute to differences in the soil environment or local microclimate. All stands were located on coarse-textured, excessively drained outwash sands classified as Menahga mixed, frigid Typic Udipsamments to minimize variability in physical soil characteristics that could contribute to differences in soil respiration [34]. Topographic variation across the study sites was very limited with less than 10 m variability in elevation among sites, slopes less than 10%, and plots within each site located on predominantly south or southeast facing aspects. The study area has an average annual temperature of 3.9 °C and average annual precipitation of 700 mm.

2.2. Field and Laboratory Methods

We selected a chronosequence of 4 red pine stands at 9, 31, 61, and 123 years of age. We placed 25 cm (inside diameter) PVC (polyvinyl chloride) collars into the soil in November of 2008 after leaf fall of deciduous trees and shrubs (approximately 6 months prior to our first sampling). Nine collars were placed at three randomly located sample plots in each stand, for a total of 27 collars per stand. The nine collars in each plot were placed in groups of three at a distance of four meters from plot center along transects centered at azimuths of 60, 180, and 300 degrees at each plot.
Since the presence of leaf litter can exert a large indirect influence on mineral soil respiration by altering soil temperature and moisture or providing leachate of labile substrate into the mineral soil [26,27], we used forest floor manipulation treatments to examine direct and indirect impacts of forest floor removal on RS and estimates of RFF. In this context, “direct” implies the additive contribution of CO2 efflux from litter decomposition to total RS, while “indirect” implies the effects that modification of the soil environment due to the presence of an intact litter layer could have on both autotrophic and heterotrophic contributions to RS from the mineral soil. In April of 2010, we removed the forest floor (down to mineral soil) from one randomly selected collar at each transect (the “no litter” treatment) to evaluate how complete forest floor removal impacts soil respiration. Since complete forest floor removal could create indirect impacts on soil respiration by altering the soil environment, we also removed the forest floor from a second PVC collar at each transect, and replaced it with a removable, 20-mesh (841 micron) bag (filled with litter collected from an area near each transect of collars equal in size to the cross-sectional area of the collars themselves. In this treatment (the “removable bag” treatment) the mesh bags were removed immediately prior to taking soil respiration measurements, with the intention of maintaining mineral soil conditions similar to those under intact litter while removing the direct contribution of CO2 efflux from the forest floor from estimates of soil respiration. The third collar in each transect was left as an untreated control.
Total soil CO2 efflux (RS) was measured on a monthly basis on all 27 collars in each stand from May through October in 2009 (pre-manipulation; i.e., prior to litter removal and removable bag installation) and from April through October in 2010 (post-manipulation; i.e., after litter removal and removable bag installation) using a custom-built, closed-chamber system with an LI-820 gas analyzer (LI-Cor, Inc., Lincoln, NE, USA) connected to a datalogger programmed to record the CO2 concentrations in the system at 2 s intervals. Equipment malfunctions prevented us from completing the August 2009 measurement.
Since our closed-chamber system calculates CO2 flux rates by first scrubbing CO2 out of the chamber and then measuring the rate of increase as chamber CO2 rises back to a pre-set upper boundary, measurement times on individual collars varied based on instantaneous flux rates. RS measurements were conducted over a 2–3 day period each month, with all collars in each stand being sampled on a single day in each month. Individual stands were sampled at alternating the times of day (0930–1200 or 1200–1500) from one month to the next in an effort to average out variability associated with taking measurements at different locations at different times of day.
Temperature readings from the top 10 cm of soil suggest soils were frozen from mid-late November until mid-April during both years of measurement, so we assume that soil respiration was minimal during the November to April period. All fresh litter inputs were removed from the no litter treatments on a bi-weekly to monthly basis throughout our 2010 measurements, and respiration measurements in the removable bag treatment were made five to ten minutes after removing the bags from the collars to allow the CO2 environment within the collar to equilibrate after removing the bag. We measured mineral soil temperature at a depth of 10 cm next to each collar, and measured volumetric soil moisture content in the top 12 cm of the mineral soilusing a HydroSense Soil Water Measurement System consisting of a CS620 sensor attached to a CD620 display (Campbell Scientific, Inc., Logan, UT, USA). Soil moisture measurements were taken at four points around each collar during each soil respiration measurement. After litter treatment in 2010, temperature and moisture measurements for the no litter and removable bag treatments were made within similar treatment areas next to each treatment collar to capture treatment effects without disturbing the soil environment within the collars used for respiration measurements.
We estimated RFF based on the differences of RS measurements between the control and treatment collars as Equations (1) and (2):
R FF   NO   LITTER = R S   CONTROL R S   NO   LITTER
and
R F F   R E M O V A B L E   B A G = R S   C O N T R O L R S   R E M O V A B L E   B A G
where RFF is respiration from the forest floor layers, R S   CONTROL is the measured respiration from the control collar in a transect, R S   CONTROL is the measured respiration from the “no litter” treatment collar in that transect (i.e., collars that received a complete litter removal treatment), and R S   REMOVABLE   BAG is the measured respiration from the “removable bag” collar in that same transect (i.e., collars in which the litter was removed from the collar and replaced with a mesh bag filled with litter that could be left in place between measurements and removed immediately prior to measurements).

2.3. Analytical Methods
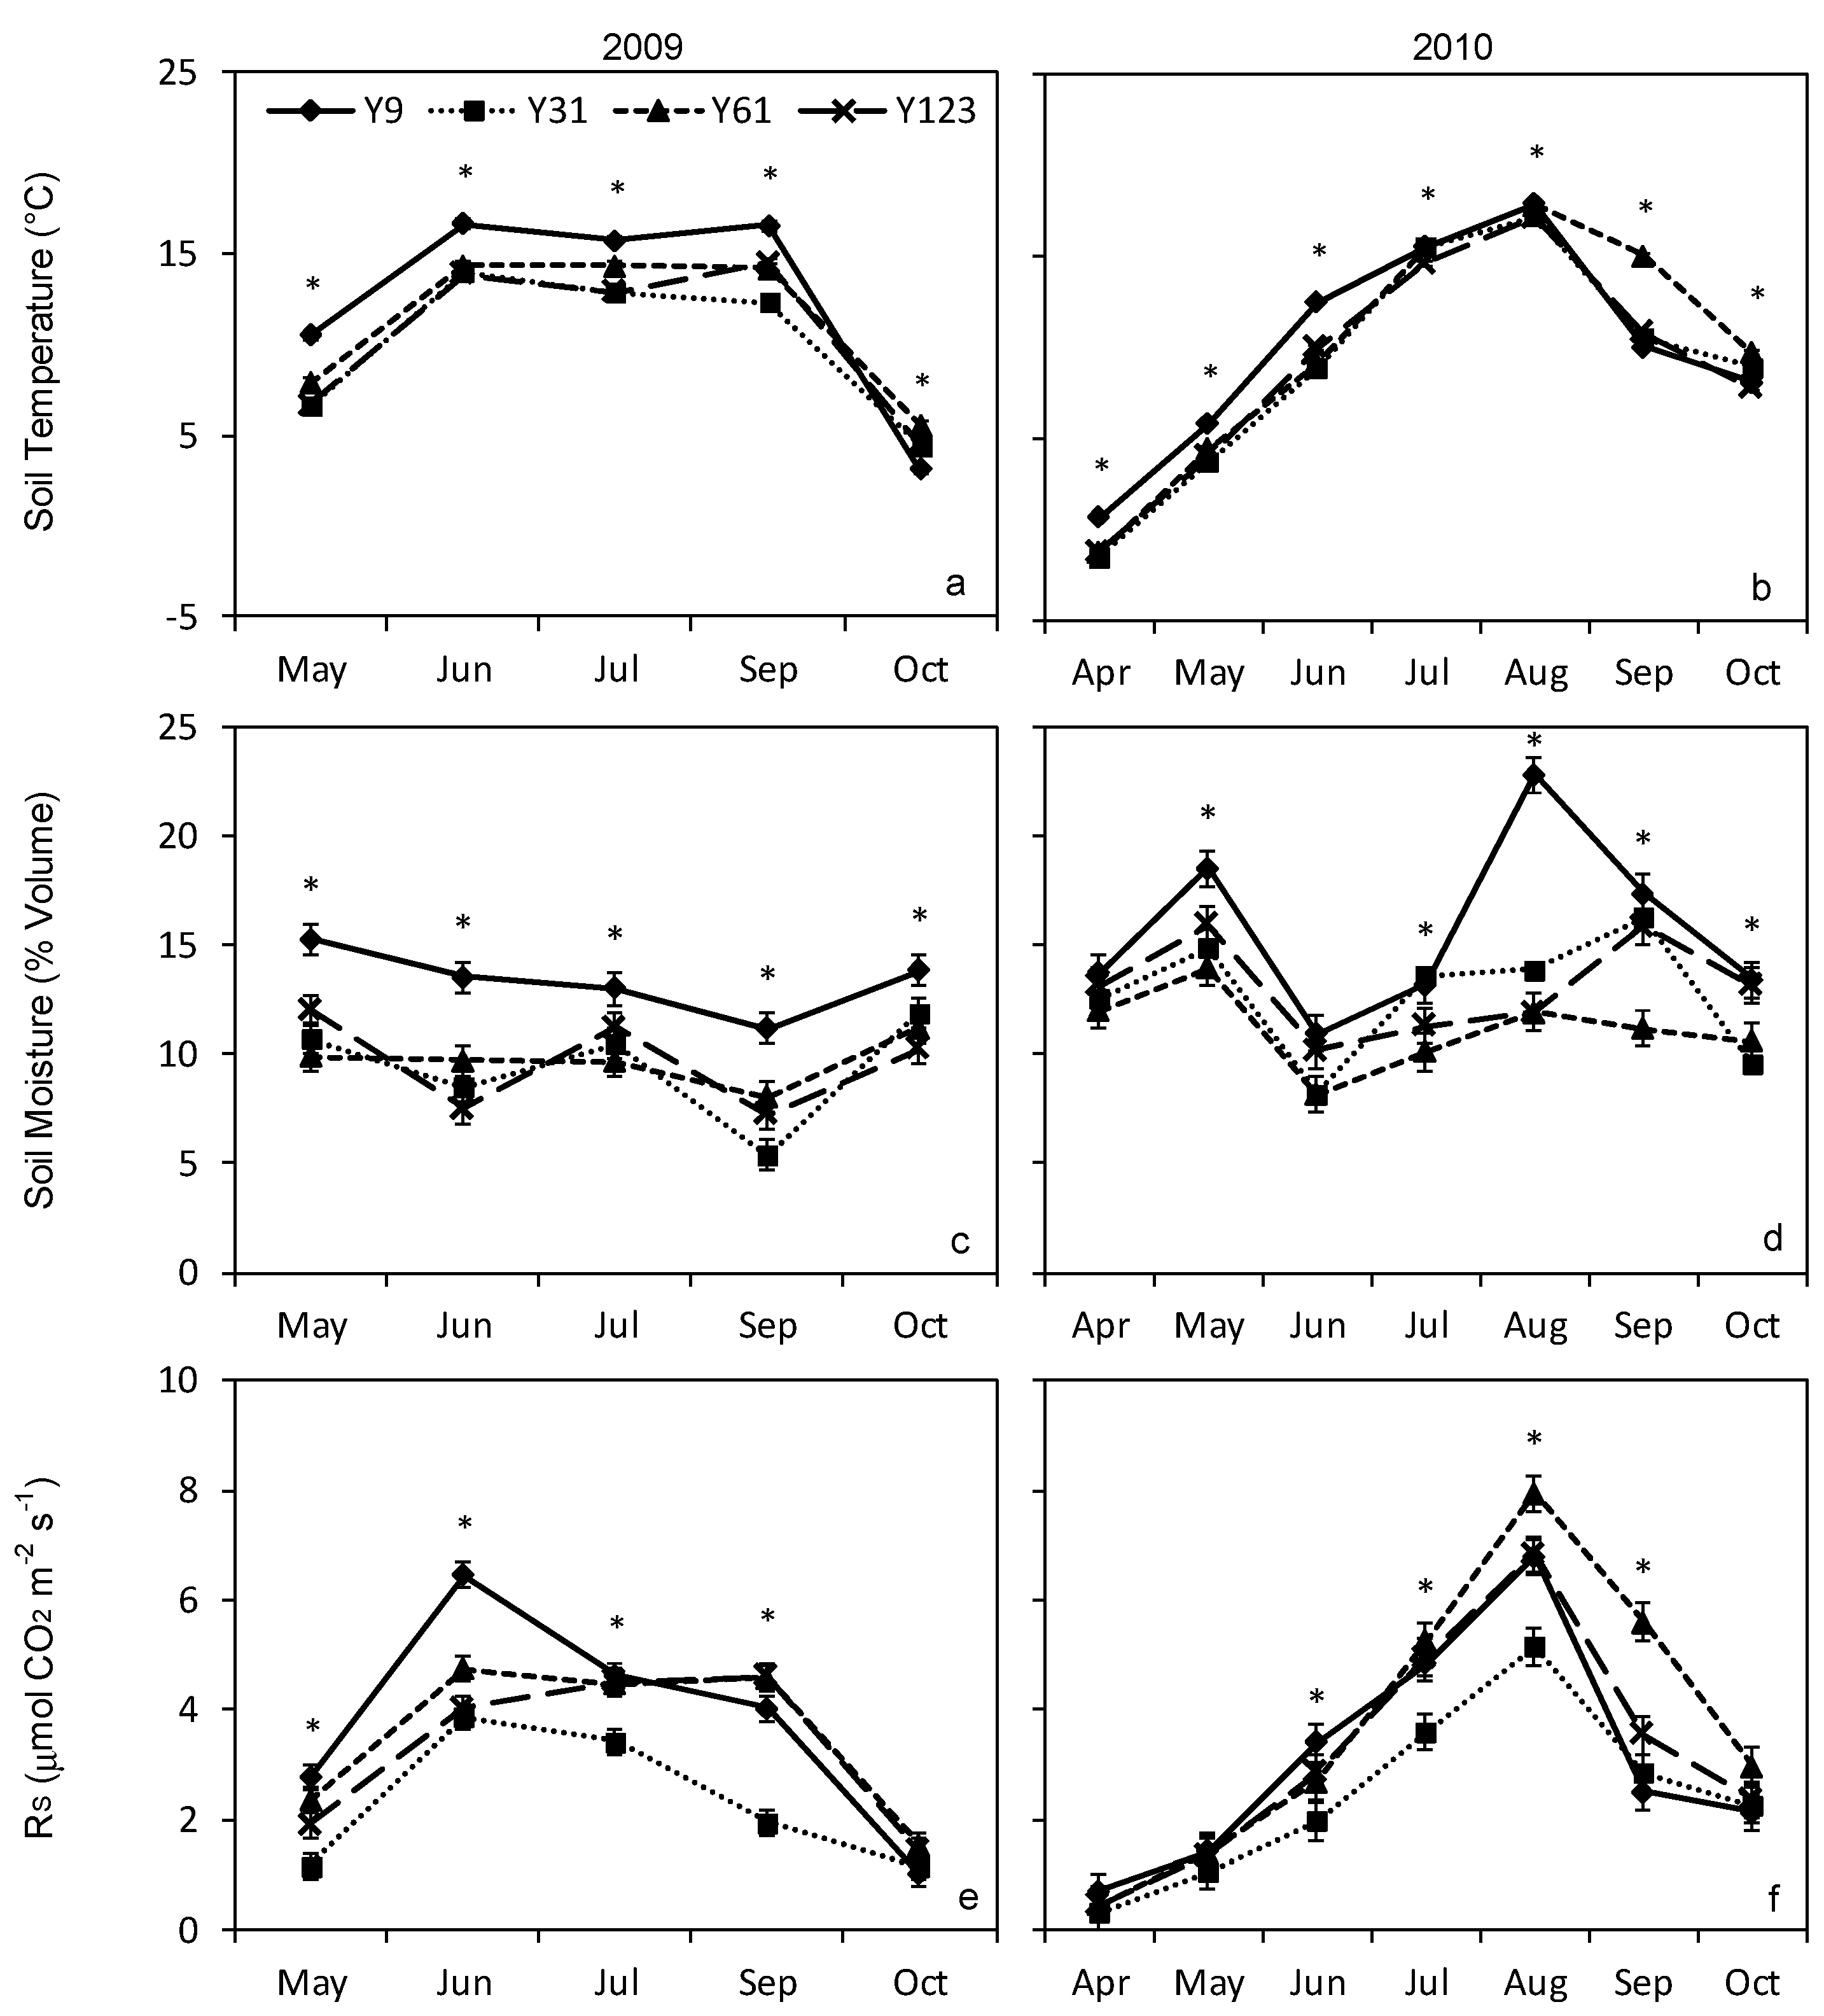
We analyzed litter treatment and stand age effects on RS, RFF, soil temperature, and soil moisture using linear mixed models. Models included litter treatment, stand age, month of measurement, and the interactions among these three factors as fixed effects along with random effects to account for the spatial nesting of litter treatments within plots and the temporal nesting of measurements within plots. We used averages of litter treatments or litter types from the three transects at each plot as the dependent variable in each analysis. Respiration data, temperature data, and moisture data from 2009 and 2010 were analyzed separately because the measurements spanned different months in the two years. Bonferroni-adjusted t-tests were used to evaluate significant differences between treatment levels. Model assumptions were evaluated with residual plots.
We analyzed relationships between RS and soil temperature based on the exponential growth function (Equation (3)):
R S = β 1 exp ( β 2 × T )
where RS is soil respiration and T is temperature. To include nested random effects (which do not have built-in support for mixed-effects nonlinear models in SAS version 9.2 (SAS Institute, Cary, NC, USA)) to account for repeated measurements on collars representing different treatments within plots, we log-transformed the exponential growth function, and analyzed the soil respiration—temperature relationship using linear mixed models of the form (Equation (4)):
LN ( R S ) = LN ( β 1 ) + ( β 2 ) × T
where LN refers to the natural logarithm, RS is soil respiration, and T is soil temperature. To test for potential stand age and litter treatment effects on the relationship between soil respiration and temperature, we fit models that allowed β1 and β2 to vary both individually and in tandem across the levels of both stand age and litter treatment. We used AIC scores to choose the model with the best fit to our data, but also considered the p-values of individual model terms to judge the significance of age and litter treatment effects. All models relating RS to temperature included random effects to account for the use of repeated measurements and the nesting of treatments within plots in each stand. We estimated the sensitivity of soil respiration to temperature using Q10 values. We calculated Q10 as Equation (5):
Q 10 = ( R 2 / R 1 ) ( 10 / ( T 2 T 1 ) )
where R1 and R2 are modeled soil respiration rates at temperatures T1 and T2, respectively.
We also used linear mixed models to analyze relationships between soil respiration and soil moisture. All soil moisture models followed the general form (Equation (6)):
R = β 1 + β 2 × S M
where R is either an absolute, or one of two normalized measure of soil respiration and SM is volumetric soil moisture. Thus, we ran three sets of models relating soil respiration to soil moisture including (1) one set including our direct, field-based RS estimates as the dependent variable; (2) a second set using a normalized expression of soil respiration (we refer to this as RSN) calculated as the ratio of observed RS to the value predicted by our best-fitting temperature model based on soil temperatures at the time of field RS sampling; and (3) a third set expressing soil respiration as the difference between our observed value from field measurements of RS, and the value predicted by our best-fitting temperature model based on soil temperatures at the time of field RS sampling (we refer to this variable as RSDIF).
Like our respiration-temperature models, we fit respiration-moisture models that allowed β1 and β2 to vary by both individually and in combination across the levels of stand age and litter type, then used AIC scores to choose the best model. We used residual plots to analyze model assumptions regarding the normality and homogeneity of error variances for all of our regression models, and applied transformations when necessary. We used Bonferroni-adjusted t-tests for all multiple comparisons. We calculated a conditional R2-type goodness of fit value for the respiration—temperature and respiration—moisture models as Equation (7):
R 2 C = 1 [ Σ ( y ij y ^ ij ) 2 / Σ ( y ij y ¯ ) 2 ]
where yij and y ^ ij are the observed and predicted respiration rates for each individual subject and y ¯ is the overall mean of the observed respiration rates [36]. All statistical analyses were performed using SAS version 9.2 (SAS Institute, Cary, NC, USA) at α = 0.05 significance level.

3. Results

3.1. Total Soil Respiration

Litter treatment had significant impacts on RS (p = 0.010 for post-manipulation measurements), and stand age (p < 0.001 and p = 0.001), month of measurement (p < 0.001 for both years), and the stand age x month of measurement interaction (p < 0.001 for both years) were also significant in the pre-manipulation and post-manipulation measurement years. There were no significant interactions involving litter treatment in either year of measurement. There were no significant differences in RS among collars assigned different litter treatments prior to litter treatment (p = 0.285), but RS was significantly lower for the no litter treatment than for the control treatment after litter treatment (Table 2).
Averaged across months, RS was highest in Y9 and lowest in Y31 in 2009, and generally lowest in Y31, but similar among other stands in 2010 (Table 3). However, the age effect was variable across the individual months of measurement (Figure 1). From May through September of 2009 (Figure 1e) and June through August of 2010 (Figure 1f), RS was generally lowest in Y31. There were no differences in RS among stands in October of 2009, or in April, May, or October of 2010, when soil temperatures were at their lowest for each year. Y61 had higher RS than any other stand in September of 2010, but was generally similar to the Y9 and Y123 stands in other months. Monthly variability in RS generally paralleled soil temperature trends in both years. In 2009, RS monthly patterns of Y61 and Y123 closely followed the temperature trend, although RS in Y9 and Y31 began declining in July while soil temperatures remained high. In 2010, RS patterns closely followed the monthly temperature trends, showing a steady increase through August followed by a decline in September and October.

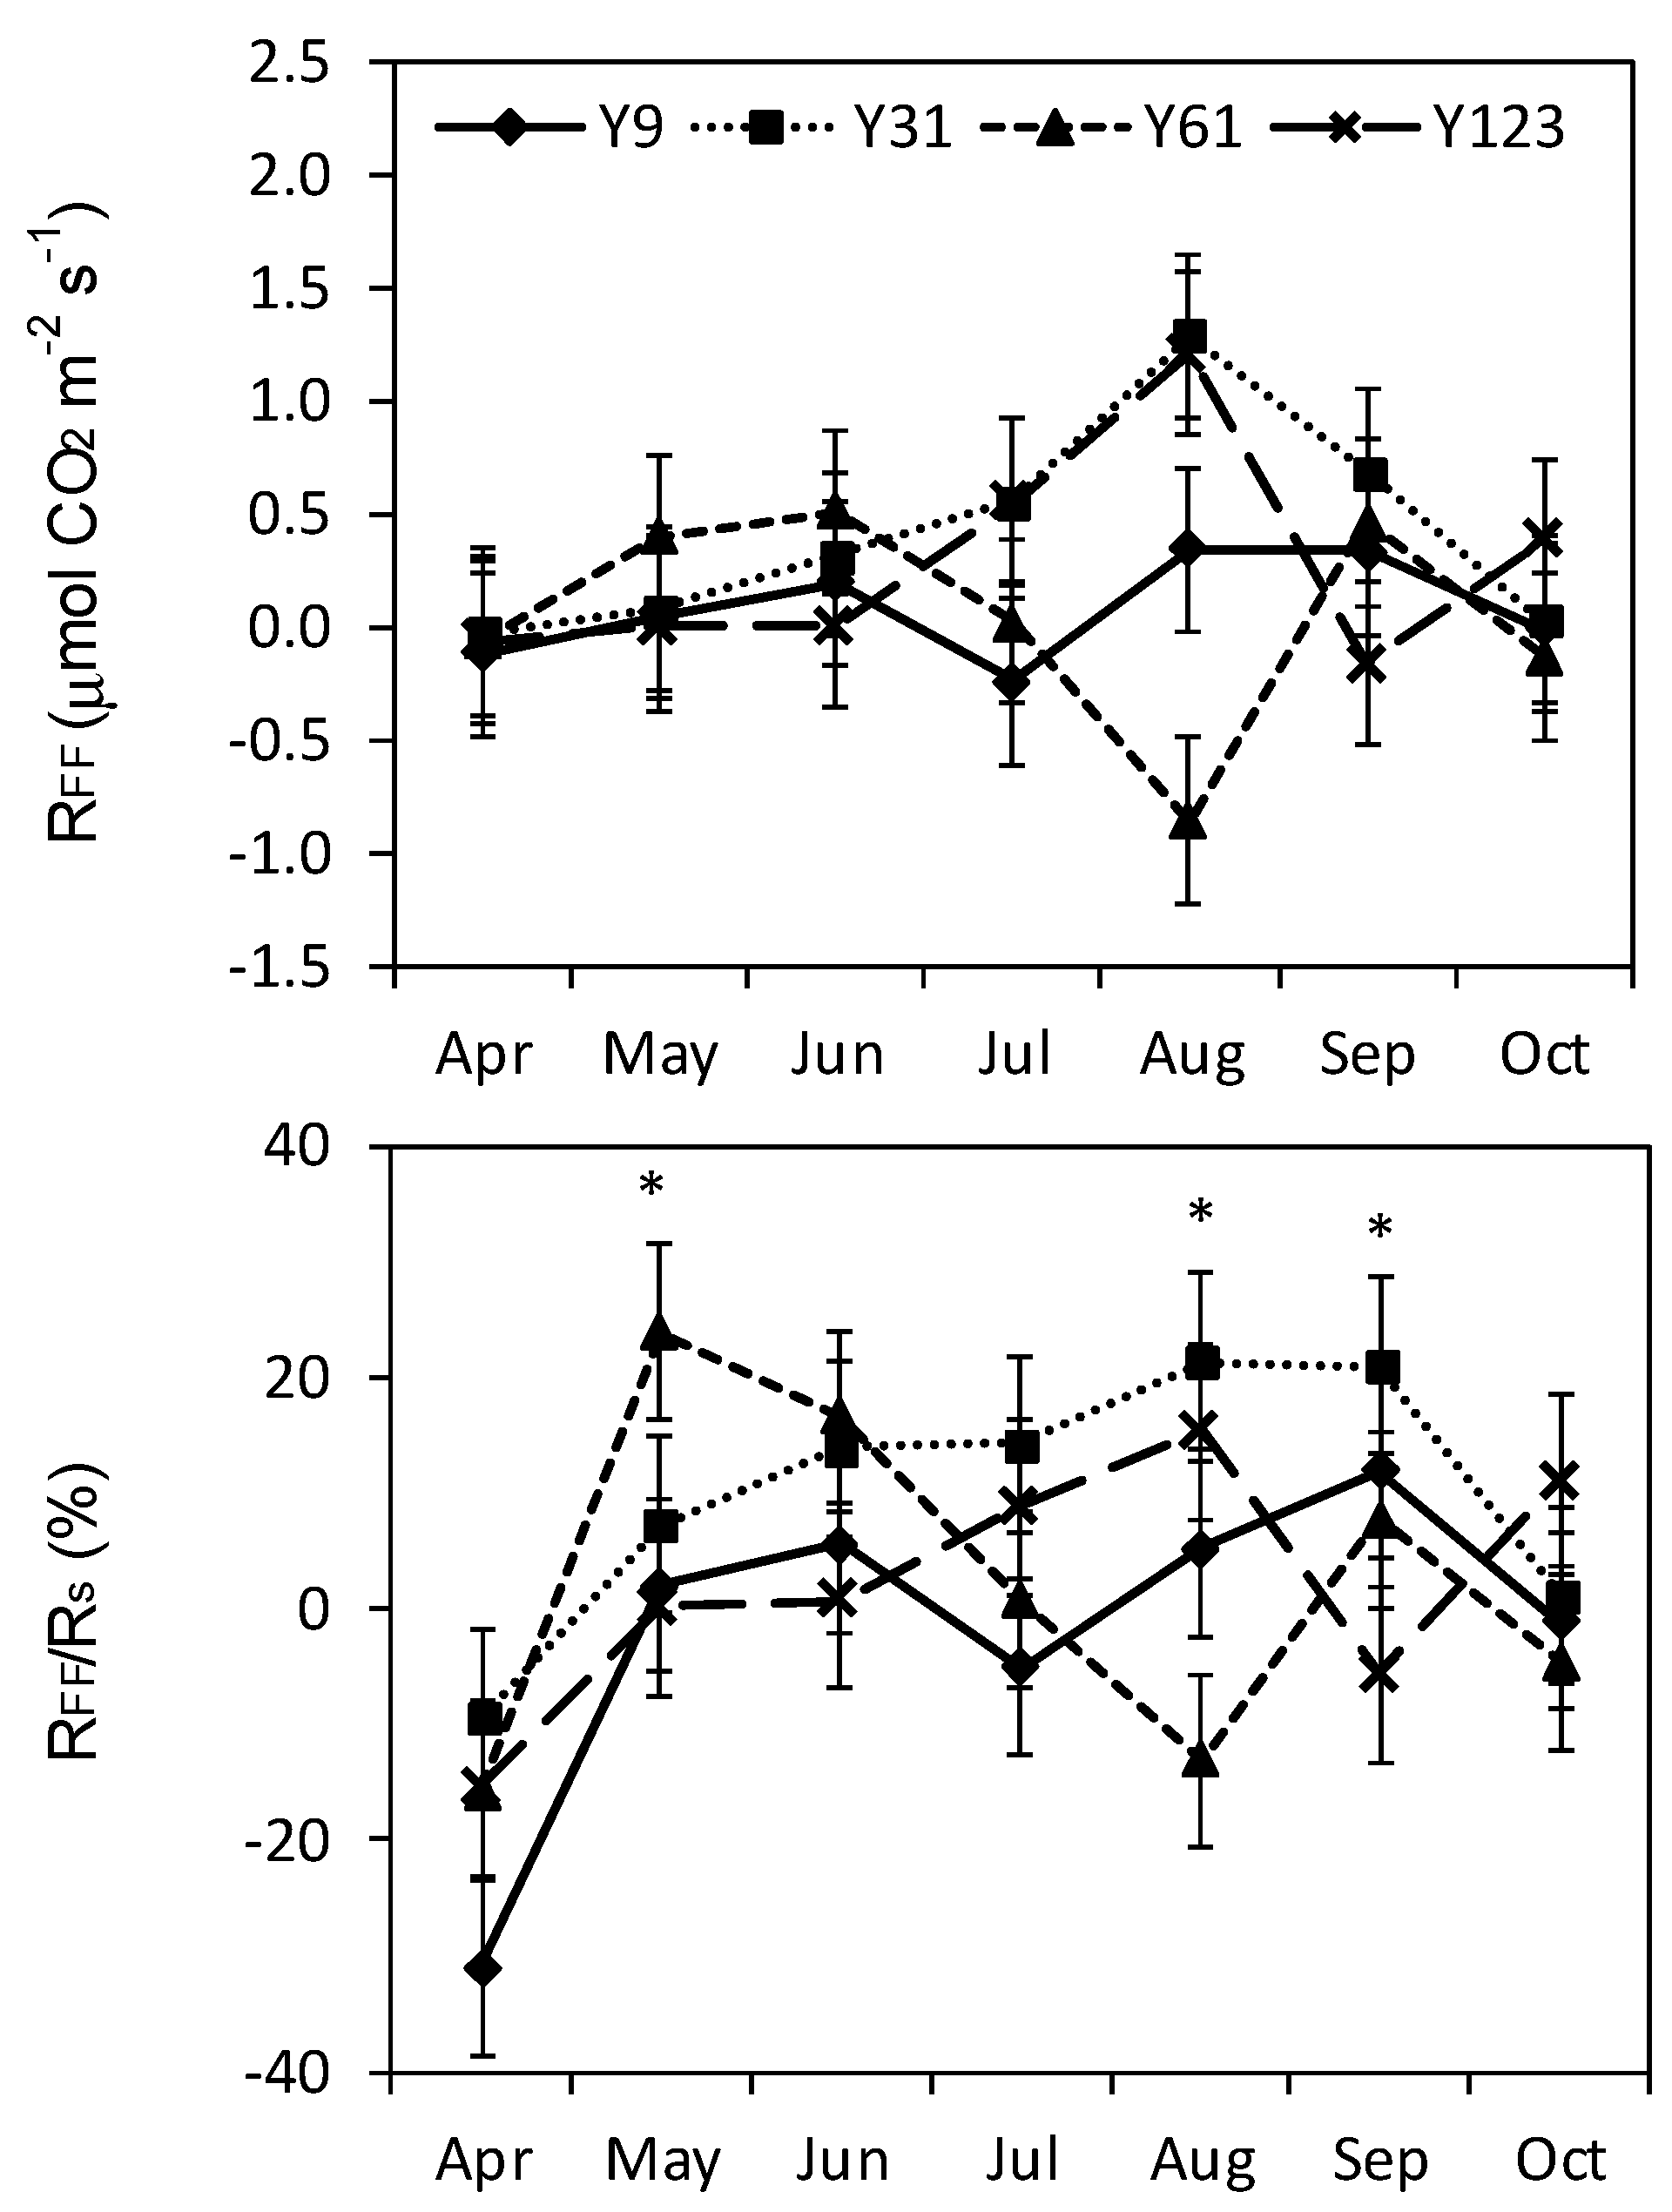
3.2. Forest Floor Respiration

Our estimates of RFF were more than five times higher for the no litter treatment than for the removable bag treatment (p = 0.044, Table 2). RFF was not significantly affected by stand age (Table 3) or month of measurement, and there were no significant interactions between stand age, month of measurement, and litter treatment type (i.e., RFF LITTER vs. RFF REMOVABLE BAG). RFF represented 13.1% of RS in the no litter treatment compared to 3.9% of RS in the removable bag treatment (p = 0.018, Table 2). This percentage varied by month of measurement (p < 0.001), but the month effect was not consistent across stands of different ages (p = 0.027). RFF generally represented the smallest percentage of RS in April when soil temperatures were lowest across all stands, but differences among other months were highly variable across stands (Figure 2). There were no significant interactions involving litter treatment, so monthly values displayed in Figure 2 have been expressed as the mean of RFF estimates calculated using the removable bag treatment and the mineral soil treatment.

3.3. Soil Temperature and Moisture

Litter treatment did not have a significant effect on soil temperature in either pre- or post-treatment measurements (p = 0.999 and 0.372, respectively), but stand age (p < 0.001 for both years) and month of measurement (p < 0.001 for both years) each did, and the stand age effect varied across months (p < 0.001 for both years). There were no significant interactions involving litter treatment in either year of measurement. Averaged across months, soil temperatures were generally highest in Y9, lowest in Y31 and Y123, and intermediate to high in Y61 (Table 3), but these patterns changed in October, when soil temperatures were lowest in Y9 and highest in Y61 (Figure 1). The temporal trends of soil temperature were somewhat different from 2009 to 2010. In 2009, soil temperatures increased from May to June, were similar in June, July, and August, and then declined rapidly (Figure 1a). In 2010, soil temperatures rose steadily from April through August then declined in September and October (Figure 1b). Soil temperatures in the spring of 2009 were somewhat higher than those during the spring of 2010 but the reverse was true during late summer and autumn.
Litter treatment had a significant impact on soil moisture in 2010 (p < 0.001), and stand age, month of measurement, and the stand age x month of measurement interaction were each significant in both the pre-manipulation and post-manipulation years of measurement (p < 0.001 for all). There were no significant interactions involving litter treatment in either year of measurement. Although there were no differences between collars assigned different litter treatments prior to manipulation in 2009 (p = 0.174), soil moisture was higher in the no litter treatment than in the removable bag and control treatments after litter treatment in 2010 (Table 2). In 2009, soil moisture was typically highest in Y9, and similar among other treatments (Table 3, Figure 1c). In 2010, soil moisture was similar among stands during April and October, highest in Y9 during May and August, and generally low in Y61 during July and September (Figure 1d).

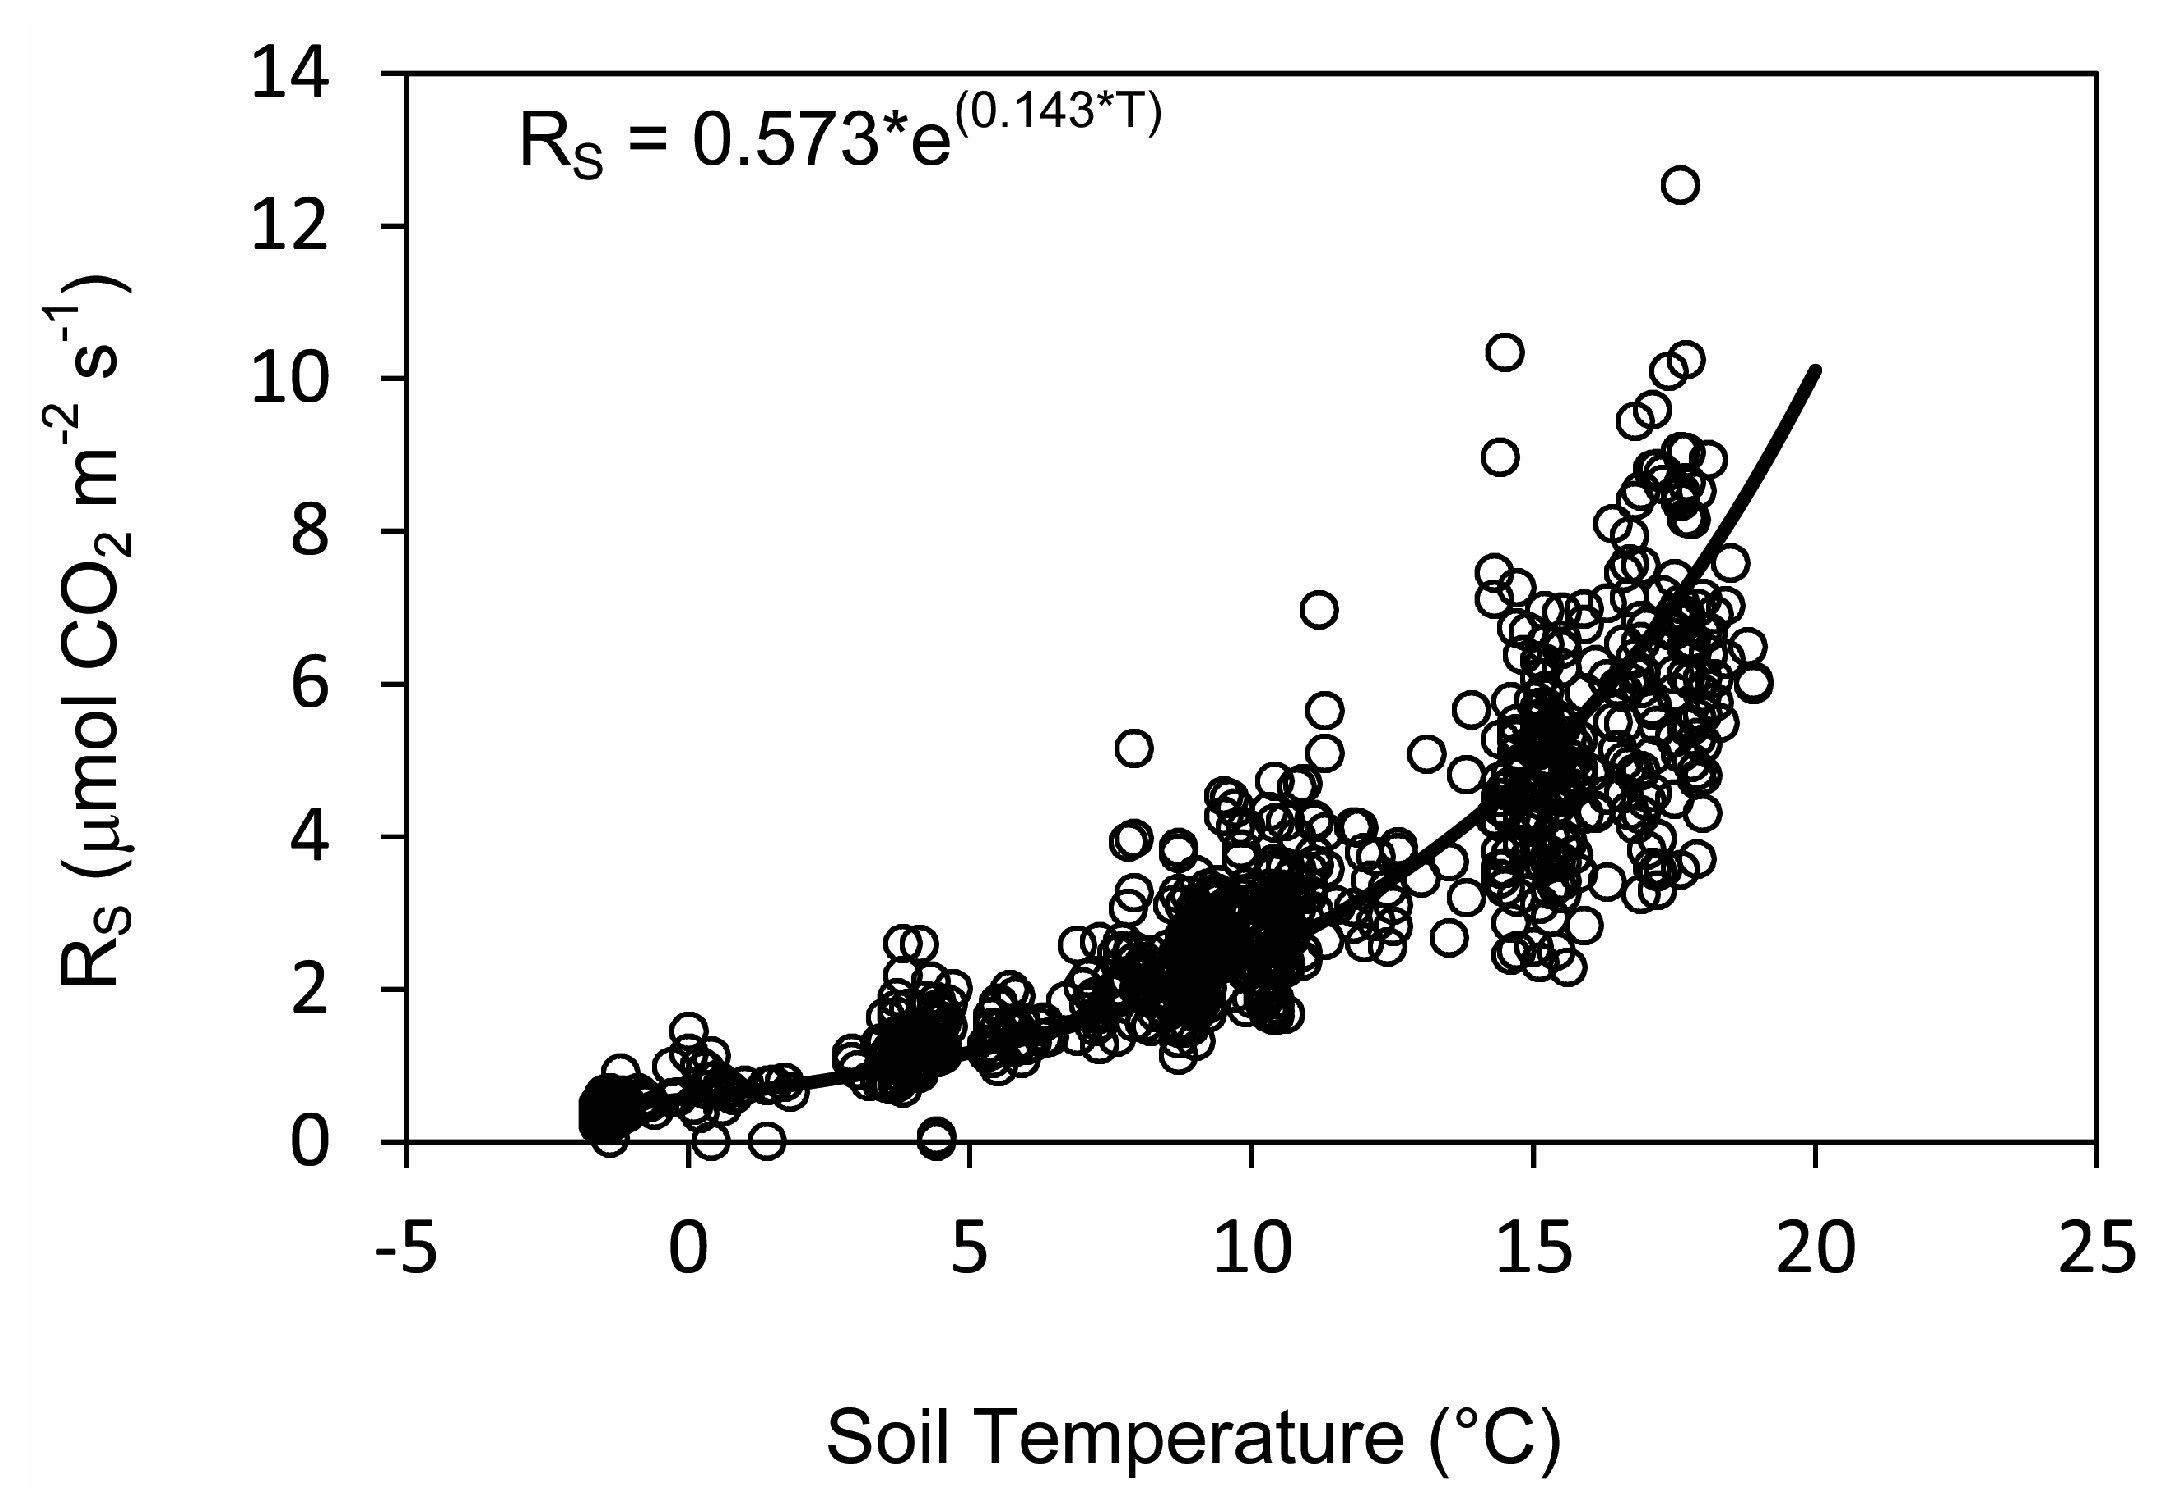
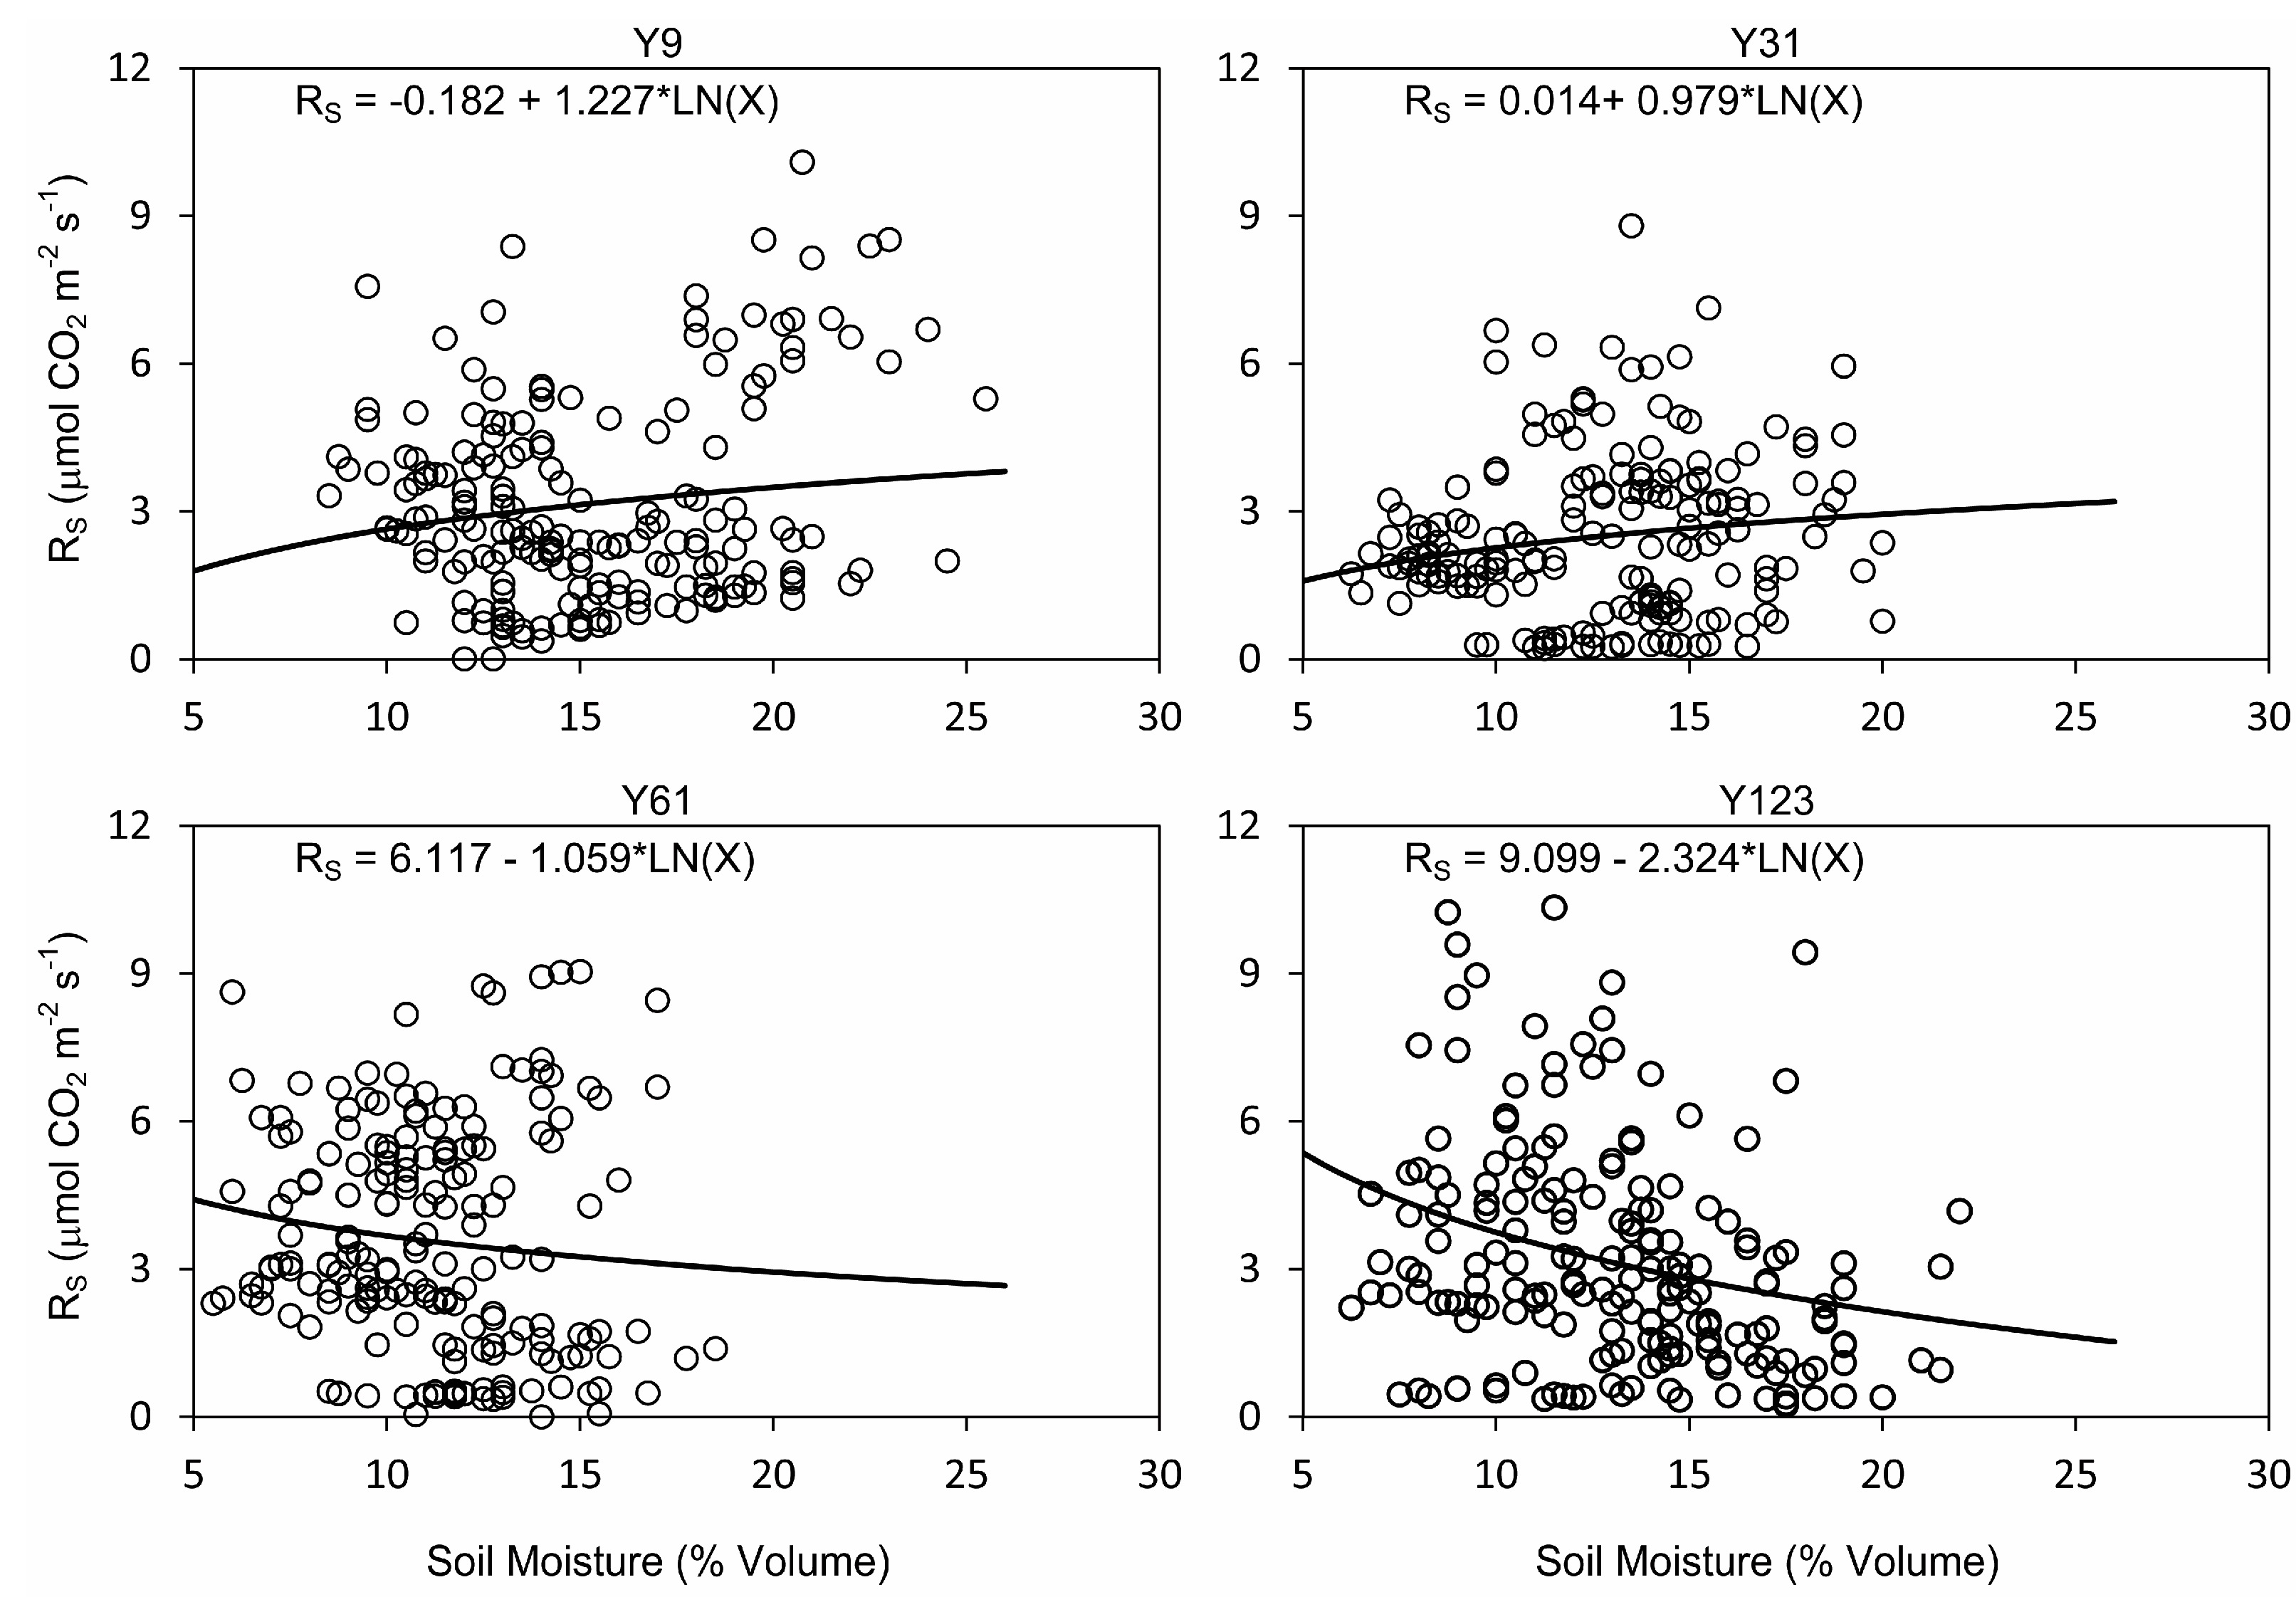
3.4. Relationships between Soil Respiration, Temperature, and Moisture

There was a significant, exponential relationship between RS and temperature (p < 0.001, R2C = 0.787), but stand age and litter treatment did not have significant effects on the RS—temperature relationship (Figure 3). There was also a significant, logarithmic relationship between RS and soil moisture (p < 0.001), but model predictions were not well correlated with field observations (R2C = 0.083). Additionally, the shape of the RS—moisture relationship varied with stand age (p < 0.001 for both soil moisture and the soil moisture x stand age interaction). Our model predicted positive relationships between RS and moisture in Y9 and Y31, but negative relationships between these two variables in Y61 and Y123 stands (Figure 4).
RSN was not significantly correlated with soil moisture (p = 0.407), and age, litter treatment, and the interactions among these three variables did not have significant effects on RSN in any of the models we tested (Figure 5). Further, no RSN models including any combination of soil moisture, age, litter treatment and their interactions performed better than the null model for RSN that included only the intercept and mixed-effects terms accounting for the spatial nesting of collars within plots and the repeated measurements of individual collars and plots over time. RSDIF did have a significant, negative relationship with soil moisture (p = 0.0137), but stand age, litter treatment, and their interactions were never significant, and no models including stand age or litter treatment as fixed effects improved on the fit of the general RSDIF to soil moisture model (Figure 5). Further, the correlation between RSDIF and soil moisture was extremely weak (R2C = 0.009).

4. Discussion

Our results suggest that stand age may have significant impacts on soil carbon cycling in red pine ecosystems, but stand age had different effects on RS and RFF. Our young, closed-canopy stand in the early stages of stem exclusion (Y31) showed a distinct seasonal pattern of RS compared to a young stand regenerating after a clearcut, a mature stand, and an old stand. In contrast, stand age had little impact on RFF or RFF’s contribution to RS. Our results also suggest that the forest floor influences soil respiration both directly, through the contribution of CO2 efflux associated with the decomposition of litter material, and indirectly, by altering the physical environment within the upper mineral soil.

4.1. Stand Age Effects on Soil Respiration

Our results do not support the increasing trend of RS that was predicted based on linkages between productivity and respiration [33]. Although theory predicts a possible decline in RS from middle-aged to older forests [12], several studies have reported positive relationships between stand age and soil respiration rates spanning various stages of forest development [6,13,16,17]. We found no evidence of either of these patterns, but we did find that soil respiration rates were often lower in Y31 than in the other stands during the middle of the growing season, particularly in July and August when soil temperatures were highest. Y31 often had lower soil temperatures than the other stands, particularly Y9 and Y61. As other studies have indicated [10,19,37], we found that RS increased exponentially with increasing soil temperature, so low soil temperatures are a likely cause of the low soil respiration rates in Y31. In our study system, Y31 is representative of plantations in the stem exclusion stage of development. Dense canopies that severely limit understory light availability are common characteristics of this phase [38], which could explain the low soil temperatures we observed in Y31. Although we did not directly measure either understory light availability or overstory leaf area index in these stands, we anecdotally observed that Y31 had very limited understory forb and shrub development in comparison with the other sites, which could be indicative of lower light levels on the forest floor, and thus, lower soil temperatures.
Although the RS-temperature relationship appeared relatively stable across our stands, we did find evidence that the RS-soil moisture relationship varied among different-aged stands. Some studies have reported that soil respiration’s sensitivity to temperature can change with stand age or successional status [13,16,19], but few have reported different age-related trends in the RS-moisture relationship. Like Irvine and Law [6], we found that soil respiration rates were generally higher in our older stands than in our younger stands during periods of low soil moisture. As soil moisture increased, however, soil respiration rates increased in Y9 and Y31 stands, but declined in Y61 and Y123. While the cause of declining RS as soil moisture increased in Y61 and Y123 stands is unclear, the effect (i.e., decreasing differences in RS between young and older stands as soil moisture increases) is consistent with Irvine and Law’s [6] proposal that the larger trees in older stands may avoid drought impacts on metabolic processes by accessing water in deeper soil horizons. The possibility of reduced drought impacts on metabolic processes in older stands is also consistent with findings from foliar gas exchange studies that suggest larger trees in older stands show less physiological response to drought than smaller trees in younger stands [39,40,41]. Thus, the age-related trends we observed for the RS-moisture relationship are likely driven by more pronounced physiological responses (including respiratory functions associated with growth and maintenance) to drought in younger stands. However, we caution that relationships between RS and soil moisture in our dataset were extremely weak, so soil moisture availability was not likely a major driver of RS variability in our system. Soil moisture typically exerts strong controls on RS in forests only when soils are very dry or very wet [10,42], so it is possible that the 5–15% range of volumetric soil moisture content observed in this study simply did not produce conditions that would limit either decomposer activity or root respiration.
Although we found only limited evidence of age-related variability in the RS-moisture relationship, seasonal patterns of RS appeared to closely track soil temperature trends, regardless of stand age. The plateaued pattern of RS characteristic of most stands in 2009 and the late summer peak in RS observed in all stands in 2010 paralleled the monthly soil temperature variability for those two years, and the high RS values observed in Y61 during September 2010 occurred during a period with higher soil temperatures in that stand than in any other stand. In contrast the seasonal dips in soil moisture observed in September of 2009 and June of 2010 did not appear to have a large influence on RS and the correlation coefficient for our RS-moisture relationship was an order of magnitude lower than that of our RS-temperature relationship. Annualized averages of RS across months of measurement in both years also closely tracked stand-level average soil temperatures, and the generally low soil temperatures in the dense-canopied Y31 appear to be a primary driver of this stand’s low RS, particularly when compared with the young, open-canopied Y9, which had considerably higher average soil temperatures.
Additionally, our two normalized estimates of RS (i.e., RSN and RSDIF), which expressed observed RS relative to predictions from our RS-temperature model, showed little to no relationship with soil moisture. This suggests that some of the apparent soil moisture impacts on RS across stand of different ages that we observed were likely driven by covarying temperature trends as was observed in other studies e.g., [10,11]. Collectively, these results underscore the importance of soil temperature as a driver of RS variability e.g., [3,4], and suggest that variations in stand structure that influence soil temperatures (such as the transition from an open-canopy during cohort establishment or stand initiation phase to a dense, closed-canopy during stem exclusion) could potentially exert significant controls on soil carbon cycling.
Although we did not directly test the relationships, variability in soil temperature paralleled differences in temperatures across the two years, while soil moisture generally tracked precipitation levels in the wetter 2010 sampling period, but not as closely in the drier summer of 2009 (Table 4). That both soil temperatures and soil respiration followed the summer plateau pattern of air temperatures in 2009 and the gradual rise in air temperatures through August of 2010, regardless of stand age, speaks to the strong controls that climate exerts on soil processes.

4.2. Forest Floor Contributions to Soil Respiration

Our results indicate that forest floor removal reduced RS by 4–13% over the course of our April through October sampling (when averaged across RFF estimates from the no litter and removable bag treatment), but do not suggest the anticipated age-related effects on either RFF or the forest floor’s contributions to RS. While several studies have found that respiration from organic horizons represents a larger percentage of RS than our estimates [18,19,20,22,44], our results fall within the range reported by others [4,22,24], and support the general consensus across these studies that root respiration and decomposition of organic compounds within the mineral soil represent the largest contributions to RS.
The reasons for the relatively low forest floor contributions to RS found in our study are not clear, although substrate quality could be a factor. Like the mineral soil, respiration rates in the forest floor are negatively correlated with the C:N ratio of the substrate [4], and three of our four stands had relatively high forest floor C:N ratios. Forest floor C:N ratios ranged from 39–45 in our Y31, Y61, and Y123 stands. In contrast, forest floor C:N ratios range from 31–32 in young and old-growth Appalachian hardwood forests [4], 34–35 for Douglas-fir (Pseudotsuga menziesii Franco) stands in the western United States [24], 29–32 in young to middle-aged Chinese hardwood forests [45], and 21–27 for various components of the forest floor in a tropical montane cloud forest [41]. While the forest floor C:N ratio of our youngest stand was somewhat lower than the other three stands, this stand had a much smaller forest floor layer than the older stands. Forest floor thickness is positively correlated with respiration rates [3,15], so the thinner forest floor may have offset the effects of higher quality litter in Y9, which could explain why RFF estimates were similar across stands despite the difference in forest floor C:N ratios.
The result that RS in the removable bag treatment was similar to RS for the control treatments suggests that at least some portion of the difference between control and no litter treatments was due to the influence that forest floor layers exert on the mineral soil environment [31]. Soil temperatures, however, were similar among the three litter treatments. Soil moisture was higher in the no litter treatment, but soil moisture generally has a positive relationship with RS [5,7], and had little to no relationship with temperature-normalized estimates of RS in our study, so increased soil moisture is not a likely explanation for lower respiration rates in the no litter treatment. If anything, increased soil moisture in the no litter treatment may have compensated in part for reductions in RS associated with the absence of a decomposing forest floor. If the difference in soil respiration rates between no litter and control collars was due entirely to the absence of respiration contributions from the forest floor, however, we would expect a similar difference to be apparent in the removable bag treatment. The apparent importance of indirect forest floor impacts on RS could suggest that RFF and mineral soil respiration estimates from studies that do not account for the forest floor’s environmental influences may contain considerable error, at least in systems with relatively thick forest floor layers, such as the red pine forest studied here. The lack of soil temperature differences between the no litter and removable bag treatments, and limited impact of soil moisture on RS observed at our study sites, however suggest that indirect controls of the soil respiration other than soil microclimate drove the differences in RFF estimates between the no litter and removable bag treatments that we observed.
Negative estimates of RFF during some individual measurement periods were an artifact of our RFF estimation technique, which relied on the difference in soil CO2 efflux measurements between control collars and adjacent collars where litter was removed. Although efforts were made to place adjacent collars in similar environments and adjacent collars generally had similar soil environments (as measured by soil temperature and moisture), differences in autotrophic contributions to soil CO2 efflux associated with variable live root biomass beneath collars may have contributed error to our RFF estimates. However estimates of the contribution of RFF to total RS in a study that used similar methods of estimating RFF while also controlling for root respiration via trenching were broadly similar to our estimates [18], Additionally, litter contributions to total RS have been shown to be very low during the pre-growth and pre-dormancy period [22], which suggests that even small differences in autotrophic respiration could have contributed to the generally negative estimates of RFF for our earliest and latest measurement periods.

5. Conclusions

Our results have some important implications about C cycling in red pine ecosystems. First, soil respiration responses to changes in temperature appear to be relatively constant across stand ages in red pine. Differences in soil temperature also appear to contribute to low soil respiration rates in dense, young, closed-canopy red pine plantations when compared to open-canopied regenerating stands and older stands that have transitioned out of the stem exclusion phase of development. This suggests that changes in rotation lengths for red pine management could impact soil C dynamics by modifying the proportional representation of age classes across the landscape and consequently, shifting the relative abundance of stand structures with relatively low soil respiration rates (e.g., our young, closed canopy plantation) vs. those with higher, or more seasonally-variable soil respiration rates (e.g., our young, open-canopied stand and our more mature stands).

Acknowledgments

We would like to thank Doug Kastendick, Nate Aspelin, Eric Doty, and Ryan Kolka for their assistance in locating field sites, installing respiration collars and litter bags, collecting soil respiration data, and processing litter samples in the laboratory. Funding for this project was provided by the United States Department of Agriculture Forest Service Northern Research Station and the Agenda 2020 Program. Any use of trade, product, or firm names is for descriptive purposes only and does not imply endorsement by the United States Government.

Author Contributions

R.K., J.B., B.P. and M.J. conceived and designed the experiments; M.P. performed the experiments and analyzed the data; M.P. wrote the paper with significant feedback from R.K., J.B., B.P. and M.J.

Conflicts of Interest

The authors declare no conflict of interest.

References

  1. Law, B.E.; Ryan, M.G.; Anthoni, P.M. Seasonal and annual respiration of a ponderosa pine ecosystem. Glob. Chang. Biol. 1999, 5, 169–182. [Google Scholar] [CrossRef]
  2. Janssens, I.A.; Lankreijer, H.; Matteucci, G.; Kowalski, A.S.; Buchmann, N.; Epron, D.; Pilegaard, K.; Kutsch, W.; Longdoz, B.; Gruènwald, T.; et al. Productivity overshadows temperature in determining soil and ecosystem respiration across European forests. Glob. Chang. Biol. 2001, 7, 269–278. [Google Scholar] [CrossRef]
  3. Saiz, G.; Green, C.; Butterback-Bahl, K.; Kiese, R.; Avitabile, V.; Farrell, E.P. Seasonal and spatial variability of soil respiration in four Sitka spruce stands. Plant Soil 2006, 287, 161–176. [Google Scholar] [CrossRef]
  4. Vose, J.M.; Bolstad, P.V. Biotic and abiotic factors regulating forest floor CO2 flux across a range of forest age classes in the southern Appalachians. Pedobiologia 2007, 50, 577–587. [Google Scholar] [CrossRef]
  5. Orchard, V.A.; Cook, F.J. Relationship between soil respiration and soil moisture. Soil Biol. Biochem. 1983, 15, 447–453. [Google Scholar] [CrossRef]
  6. Irvine, J.; Law, B.E. Contrasting soil respiration in young and old-growth ponderosa pine forests. Glob. Chang. Biol. 2002, 8, 1183–1194. [Google Scholar] [CrossRef]
  7. Cook, F.J.; Orchard, V.A. Relationships between soil respiration and soil moisture. Soil Biol. Biochem. 2008, 40, 1013–1018. [Google Scholar] [CrossRef]
  8. Raich, J.W.; Nadelhoffer, K.J. Belowground carbon allocation in forest ecosystems: Global trends. Ecology 1989, 70, 1346–1354. [Google Scholar] [CrossRef]
  9. Søe, A.R.B.; Buchmann, N. Spatial and temporal variations in soil respiration in relation to stand structure and soil parameters in an unmanaged beech forest. Tree Physiol. 2005, 25, 1427–1436. [Google Scholar] [CrossRef] [PubMed]
  10. Davidson, E.E.; Belk, E.; Boone, R.D. Soil water content and temperature as independent or confounded factors controlling soil respiration in a temperate mixed hardwood forest. Glob. Chang. Biol. 1998, 4, 217–227. [Google Scholar] [CrossRef]
  11. Wang, B.; Zha, T.S.; Jia, X.; Wu, B.; Zhang, Y.Q.; Qin, S.G. Soil moisture modified the response of soil respiration to temperature in a desert shrub ecosystem. Biogeosciences 2014, 11, 259–268. [Google Scholar] [CrossRef]
  12. Pregitzer, K.S.; Euskirchen, E.S. Carbon cycling and storage in world forests: Biome patterns related to forest age. Glob. Chang. Biol. 2004, 10, 1–26. [Google Scholar] [CrossRef]
  13. Tang, J.; Bolstad, P.V.; Martin, J.G. Soil carbon fluxes and stocks in a Great Lakes forest chronosequence. Glob. Chang. Biol. 2009, 15, 145–155. [Google Scholar] [CrossRef]
  14. Wang, B.; Jiang, Y.; Wei, X.; Zhao, G.; Guo, H.; Bai, X. Effects of forest type, stand age, and altitude on soil respiration in subtropical China. Scand. J. For. Res. 2011, 26, 40–47. [Google Scholar] [CrossRef]
  15. Saiz, G.; Byrne, K.A.; Butterbach-Bahl, K.; Kiese, R.; Blujdea, V.; Farrell, E.P. Stand age-related effects on soil respiration in a first rotation Sitka spruce chronosequence in central Ireland. Glob. Chang. Biol. 2006, 12, 1007–1020. [Google Scholar] [CrossRef]
  16. Martin, D.; Beringer, J.; Hutley, L.B.; McHugh, I. Carbon cycling in a mountain ash forest: Analysis of below ground respiration. Agric. For. Meteorol. 2007, 147, 58–70. [Google Scholar] [CrossRef]
  17. Gough, C.M.; Seiler, J.R.; Wiseman, P.E.; Maier, C.A. Soil CO2 efflux in loblolly pine (Pinus taeda L.) plantations on the Virginia Piedmont and South Carolina Coastal Plain over a rotation-length chronosequence. Biogeochemistry 2005, 73, 127–147. [Google Scholar] [CrossRef]
  18. Bowden, R.D.; Nadelhoffer, K.J.; Boone, R.D.; Melillo, J.M.; Garrison, J.B. Contributions of aboveground litter, belowground litter, and root respiration to total soil respiration in a temperate mixed hardwood forest. Can. J. For. Res. 1993, 23, 1402–1407. [Google Scholar] [CrossRef]
  19. Buchmann, N. Biotic and abiotic factors controlling soil respiration rates in Picea abies stands. Soil Biol. Biochem. 2000, 32, 1625–1635. [Google Scholar] [CrossRef]
  20. Borken, W.; Beese, F. Soil respiration in pure and mixed stands of European beech and Norway spruce following removal of organic horizons. Can. J. For. Res. 2005, 35, 2756–2764. [Google Scholar] [CrossRef]
  21. Ngao, J.; Epron, D.; Brechet, C.; Granier, A. Estimating the contribution of leaf litter decomposition to soil CO2 efflux in a beech forest using 13C-depleted litter. Glob. Chang. Biol. 2005, 11, 1168–1776. [Google Scholar] [CrossRef]
  22. DeForest, J.L.; Chen, J.; McNulty, S.G. Leaf litter is an important mediator of soil respiration in an oak-dominated forest. Int. J. Biometeorol. 2009, 53, 127–134. [Google Scholar] [CrossRef] [PubMed]
  23. Martin, J.G.; Bolstad, P.V. Variation of soil respiration at three spatial scales: Components within measurements, intra-site variation and patterns on the landscape. Soil Biol. Biochem. 2009, 41, 530–543. [Google Scholar] [CrossRef]
  24. Giesen, T.W.; Perakis, S.S.; Cromack, K., Jr. Four centuries of soil carbon and nitrogen change after stand-replacing fire in a forest landscape in the western Cascade Range of Oregon. Can. J. For. Res. 2008, 38, 2455–2464. [Google Scholar] [CrossRef]
  25. Bradford, J.B.; Kastendick, D.N. Age-related patterns of forest complexity and carbon storage in pine and aspen-birch ecosystems of northern Minnesota, USA. Can. J. For. Res. 2010, 40, 401–409. [Google Scholar] [CrossRef]
  26. Borken, W.; Davidson, E.A.; Savage, K.; Gaudinxki, J.; Trumbore, S.E. Drying and wetting effects on CO2 release from organic horizons. Soil Sci. Soc. Am. J. 2003, 67, 1888–1896. [Google Scholar] [CrossRef]
  27. Sulzman, E.W.; Brant, J.B.; Bowden, R.D.; Lajtha, K. Contribution of aboveground litter, belowground litter, and rhizosphere respiration to total soil CO2 efflux in an old growth coniferous forest. Biogeochemistry 2005, 73, 231–256. [Google Scholar] [CrossRef]
  28. Mendham, D.S.; O’Connell, A.M.; Grove, T.S.; Rance, S.J. Residue management effects on soil carbon and nutrient contents and growth of second rotation eucalypts. Forest Ecol. Manag. 2003, 181, 357–372. [Google Scholar] [CrossRef]
  29. Walmsley, J.D.; Godbold, D.L. Stump harvesting for bioenergy—A review of the environmental impacts. Forestry 2010, 83, 17–38. [Google Scholar] [CrossRef]
  30. Peckham, S.D.; Gower, S.T. Simulated long-term effects of harvest and biomass residual removal on soil carbon and nitrogen content and productivity for two Upper Great Lakes forest ecosystems. Glob. Chang. Biol. Bioenergy 2011, 3, 135–147. [Google Scholar] [CrossRef]
  31. Sayer, E.J. Using experimental manipulation to assess the roles of leaf litter in the functioning of forest ecosystems. Biol. Rev. 2006, 81, 1–31. [Google Scholar] [CrossRef] [PubMed]
  32. D’Amato, A.W.; Palik, B.J.; Kern, C.C. Growth, yield, and structure of extended rotation Pinus resinosa stands in Minnesota, USA. Can. J. For. Res. 2010, 40, 1000–1010. [Google Scholar] [CrossRef]
  33. Högberg, P.; Nordgren, A.; Buchmann, N.; Taylor, A.F.S.; Ekblad, A.; Högberg, M.N.; Nyberg, G.; Ottosson-Löfvenius, M.; Read, D.J. Large-scale forest girdling shows that current photosynthesis drives soil respiration. Nature 2001, 411, 789–792. [Google Scholar] [CrossRef] [PubMed]
  34. Nyberg, P.R. Soil survey of Itasca County, Minnesota; USDA Soil Conservation Service Government Printing Office: Washington, DC, USA, 2008.
  35. Powers, M.D.; Kolka, R.K.; Bradford, J.B.; Palik, B.J.; Fraver, S.; Jurgensen, M.F. Carbon storage across a chronosequence of thinned and unmanaged red pine stands. Ecol. Appl. 2012, 22, 1297–1307. [Google Scholar] [CrossRef] [PubMed]
  36. Huang, S.; Meng, S.X.; Yang, Y. Assessing the goodness of fit of forest models estimated by nonlinear mixed-model methods. Can. J. For. Res. 2009, 39, 2418–2436. [Google Scholar] [CrossRef]
  37. Boone, R.D.; Nadelhoffer, K.J.; Canary, J.D.; Kaye, J.P. Roots exert a strong influence on the temperature sensitivity of soil respiration. Nature 1998, 396, 570–572. [Google Scholar] [CrossRef]
  38. Oliver, C.D.; Larson, B. Forest Stand Dynamics; Wiley: New York, NY, USA, 1996. [Google Scholar]
  39. McDowell, N.G.; Licata, J.; Bond, B.J. Environmental sensitivity of gas exchange in different-sized trees. Oecologia 2005, 145, 9–20. [Google Scholar] [CrossRef] [PubMed]
  40. Ryan, M.G.; Phillips, N.; Bond, B.J. The hydraulic limitation hypothesis revisited. Plant Cell Environ. 2006, 29, 367–381. [Google Scholar] [CrossRef] [PubMed]
  41. Wharton, S.; Schroeder, M.; Bible, K.; Falk, M.; Paw U, K.T. Stand-level gas-exchange responses to seasonal drought in very young versus old Douglas-fir forests of the Pacific Northwest, USA. Tree Physiol. 2009, 29, 959–974. [Google Scholar] [CrossRef] [PubMed]
  42. Borken, W.; Xu, Y.; Davidson, E.A.; Beese, F. Site and temporal variation of soil respiration in European beech, Norway spruce, and Scots pine forests. Glob. Chang. Biol. 2002, 8, 1205–1216. [Google Scholar] [CrossRef]
  43. NOAA National Climatic Data Centers Climate Data Online. Available online: https://www.ncdc.noaa.gov/cdo-web/ (accessed on 5 December 2017).
  44. Zimmermann, M.; Meir, P.; Bird, M.; Malhi, Y.; Cahuana, A. Litter contribution to diurnal and annual soil respiration in a tropical montane cloud forest. Soil Biol. Biochem. 2009, 41, 1338–1340. [Google Scholar] [CrossRef]
  45. Yang, X.; Chen, J. Plant litter quality influences the contribution of soil fauna to litter decomposition in humid tropical forests, southwestern China. Soil Biol. Biochem. 2009, 41, 910–918. [Google Scholar] [CrossRef]
Figure 1. Soil temperatures (a, b), soil moisture (c, d), and soil respiration (RS, e, f) from two years of measurement in 9, 31, 61, and 123 year-old red pine stands in northern Minnesota, USA. Error bars indicate standard error. An asterisk indicates a month with significant differences among stand ages.
Forests 09 00016 g001
Figure 2. CO2 efflux from forest floor layers (RFF, top panel) and the percentage of total soil respiration (RS) represented by the forest floor (bottom panel) in 9, 31, 61, and 123 year-old red pine stands in northern Minnesota, USA. Error bars indicate standard error. An asterisk indicates a month with significant differences among stand ages. RFF estimates displayed here reflect the mean of values calculated from two separate treatments (complete litter removal and temporary removal of litter in a mesh bag).
Forests 09 00016 g002
Figure 3. Relationships between soil respiration (RS) and soil temperature in red pine stands in northern Minnesota, USA.
Forests 09 00016 g003
Figure 4. Relationships between soil respiration (RS) and soil moisture in 9 (Y9), 31 (Y31), 61 (Y61), and 123 (Y123) year-old red pine stands in northern Minnesota, USA.
Forests 09 00016 g004
Figure 5. Relationships between two normalized estimates of soil respiration (RS) and soil moisture in red pine stands in northern Minnesota, USA. RS Observed (top panel) indicates direct, field-based measurements of soil CO2 efflux, and RS modeled (bottom panel) indicates estimates of soil CO2 efflux derived from our best-fitting regression model relating RS to temperature. RSDIF was calculated as the differences between RS Observed and RS Modeled.
Forests 09 00016 g005
Table 1. Forest floor, soil (0–30 cm), and overstory structure characteristics of 9, 31, 61, and 123 year-old red pine stands used to study age-related changes in soil respiration, forest floor respiration, and litter decomposition.
StandAge in 2009 (years)FF Thickness (cm)FF Mass (kg/m2)FF %CFF %NFF C:NSoil %CSoil %NSoil C:NpH ApH A-30Overstory Density (TPH)Basal Area (m2 ha−1)
Y991.671.1140.231.3030.762.090.1019.174.034.96670.04
Y31314.042.5936.510.9139.940.690.0419.924.484.38216740.06
Y61614.902.1849.381.1144.870.890.0615.004.514.8063338.18
Y1231234.332.4349.761.2938.810.720.0419.514.404.6065040.63
FF = forest floor; TPH = trees ha−1; pH A = soil pH from the surface to the top of the A horizon; pH A-30 = soil pH from the top of the A horizon to a depth of 30 cm; all pH values measured in a CaCl2 solution. Forest floor and soil %C and %N measured on a LECO Total Elemental Analyzer. Note that %C and %N data were not ash-corrected. Forest floor mass is an estimate based on a companion study in the same stands [35] and mass from the actual collars in this study.
Table 2. Effects of forest floor removal treatments on total soil respiration (RS), forest floor respiration (RFF) (calculated after litter treatment in 2010 only), and soil moisture (SM) before (2009) and after (2010) experimental litter removal treatment in red pine stands. Different letters indicate significant differences among treatments within a column. Respiration rates reported in μmol CO2 m−2 s−1.
TreatmentRS 2009RS 2010RFF 2010SM (%) 2009SM (%) 2010
No Litter3.23 (a)2.93 (b)0.35 (a)10.36 (a)14.02 (b)
Removable Bag3.30 (a)3.21 (ab)0.06 (b)10.62 (a)12.67 (b)
Control3.17 (a)3.27 (a)--10.60 (a)12.79 (a)
Table 3. Mean values of total soil respiration (RS), volumetric soil moisture (SM), soil temperature (T), and forest floor respiration (RFF) before experimental litter removal (2009) and after litter removal (2010) in red pine stands aged 9 (Y9), 31 (Y31), 61 (Y61), and 123 (Y123) years. Values represent annualized averages across multiple months of measurement in each year. RFF was calculated only after litter removal (i.e., only in 2010). Different letters indicate significant differences among treatments within a column. Respiration rates reported in μmol CO2 m−2 s−1.
Stand IDRS 2009RS 2010RFF 2010T (°C) 2009T (°C) 2010SM (%) 2009SM (%) 2010
Y93.78 (a)3.11 (ab)0.08 (a)12.51 (a)10.02 (a)13.36 (a)15.72 (a)
Y312.32 (b)2.46 (b)0.42 (a)10.05 (c)8.98 (b)9.39 (b)12.71 (b)
Y613.54 (c)3.76 (a)0.05 (a)11.26 (b)9.99 (a)9.71 (b)11.14 (b)
Y1233.30 (c)3.20 (ab)0.27 (a)10.49 (c)8.95 (b)9.96 (b)13.07 (b)
Table 4. Mean monthly temperature (T) and precipitation (P) data for our study area during the months of RS measurement in 2009 and 2010 [43].
MonthT (°C) 2009T (°C) 2010P (mm) 2009P (mm) 2010
April4.39.131.528.4
May10.612.641.759.1
June16.016.985.691.1
July17.621.158.4120.4
August17.720.863.7129.7
September17.411.746.7141.5
October3.68.8125.266.5

