Article

Changes in Soil Quality and Hydrological Connectivity Caused by the Abandonment of Terraces in a Mediterranean Burned Catchment

by
Aleix Calsamiglia
1,2,*,
Manuel Esteban Lucas-Borja
3,
Josep Fortesa
1,2,
Julián García-Comendador
1,2 and
Joan Estrany
1,2
1
Department of Geography, University of the Balearic Islands, E-07122 Palma, Mallorca, Balearic Islands, Spain
2
Institute of Agro-Environmental and Water Economy Research—INAGEA, University of the Balearic Islands, E-07122 Palma, Mallorca, Balearic Islands, Spain
3
Departamento de Ciencia y Tecnología Agroforestal y Genética, Universidad de Castilla la Mancha. Campus Universitario s/n, E-02071 Albacete, Spain
*
Author to whom correspondence should be addressed.
Forests 2017, 8(9), 333; https://doi.org/10.3390/f8090333
Submission received: 22 June 2017 / Revised: 24 August 2017 / Accepted: 7 September 2017 / Published: 8 September 2017

Abstract

:
Wildfires and agricultural activities are relevant factors affecting soil quality, hydrological cycle and sedimentary dynamics. Land abandonment leads to afforestation, which increases fire risk and land degradation. However, no studies have yet evaluated the effect of combining the two factors, which occur frequently in Mediterranean ecosystems. This study assessed the changes in soil quality caused by the abandonment of terraces in two microcatchments (<2.5 ha) affected distinctly by wildfires (once and twice burned) and in an unburned control microcatchment by analyzing soil quality parameters, biochemical indices and spatial patterns of hydrological and sediment connectivity. Soil samples were collected in thirty-six plots (25 m2) representing terraced and non-terraced areas within these microcatchments. Unburned non-terraced plots had higher organic matter content and higher microbiological and enzymatic activities than other plots. Plots in abandoned terraces had lower soil quality indices, regardless of the fire effect. Land abandonment induced changes in the spatial patterns of hydrological connectivity, leading to concentrated runoff, enhanced erosion and soil degradation. Fire also negatively affected soil quality in both terraced and non-terraced plots. However, microbiological communities had different positive post-fire recovery strategies (growth and activity), depending on the previous soil conditions and land uses, which is indicative of the resilience of Mediterranean soil ecosystems.

1. Introduction

Wildfires are an important ecogeomorphological agent that is intrinsic to Mediterranean ecosystems [1], as indicated by the fire adaptations of many of their endemic plant species [2]. However, increasing temperatures, along with land use changes and urban expansion over recent decades, have been identified as the most important drivers of increased wildfire occurrence, leading to soil degradation [3]. By reducing or temporarily eliminating vegetation cover, frequent wildfires increase exposure of soils to erosion agents. In addition, fire may induce changes in the water cycle by increasing soil water repellence, reducing infiltration capacity and therefore promoting higher overland flow and enhanced soil losses [4]. Depending on their recurrence, duration and severity, wildfires can also cause direct and significant changes in the chemical, physical and biological properties of soil [5,6].
Identifying the effects of fire on soils in the Mediterranean region is still a challenging issue because the wide heterogeneity of land uses and the long history of human impact add further complexity [7]. Wildfires’ greater frequency in recent decades is largely due to the afforestation of abandoned agricultural areas, involving increased fuel load and greater continuity of forest areas [8]. Therefore, afforestation and preterit agricultural practices in these areas may have been important factors altering soil quality prior to wildfire occurrence. Tillage, fertilization and vegetation management can significantly affect chemical and biological soil properties, entailing negative effects on soil quality [9]. Moreover, in the Mediterranean region, these practices have very often been accompanied by the construction of terraces, which are a very effective measure for soil conservation [10]. The massive presence of these structures, as long as they are well-maintained, decouples hillslopes and the fluvial system significantly [11], decreasing the hydrological response [12] and reducing the sediment transfer at the catchment scale [13]. However, the lack of maintenance after land abandonment leads to the deterioration and subsequent collapse of terraces, reactivating erosion and soil degradation processes [11,12,13,14].
In recent years, sediment connectivity has been consolidated as a useful conceptual framework for understanding sedimentary processes at different spatiotemporal scales [15]. The concept of sediment connectivity indicates the physical linkage of sediment (in terms of transfer) and the potential for a specific particle to move through the system [16]. Closely connected areas within a catchment, with stronger links between different compartments, are related to greater runoff, enhanced erosion and soil losses [17]. However, the presence and configuration of sediment stores such as terraces may create low-connected areas by decoupling water and sediment flows [18]. Thus, spatial patterns of connectivity have been studied recently to detect hotspots of erosion and soil loss. These are attributed to various dynamics of global change related to wildfires [19], land use changes [20], vegetation patterns [21] or abandonment of cultivated terraces [22]. However, these studies, based on sediment connectivity at the catchment scale, are aimed at analyzing the effects of different dynamics on soils in quantitative rather than qualitative terms.
While the importance of the quantity and productive function of soils was recognized long ago, the study of essential soil quality parameters for sustaining many ecosystem services (such as water purification, groundwater recharge, carbon sequestration, control of pathogen populations, biological nitrogen fixation and biodiversity conservation) has been gaining in relevance in recent years [23]. The lateness of this interest is largely due to the complexity of soil processes, which makes it difficult to establish quantitative indices and reference levels for assessing soil quality [24]. According to Doran and Parkin (1996), the minimum dataset for soil quality assessment should include physical, chemical and biological parameters [25]. Nevertheless, in general, physical and physicochemical parameters only show clear alterations when very drastic disturbances occur [26]. In contrast, biological and biochemical parameters are highly suitable indicators due to their sensitivity to any slight change that soil may suffer due to any degradation agent [27].
Enzymatic activities and soil respiration have been used as indicators of soil quality to evaluate degradation of forest [28,29] and agricultural soils [30] in Mediterranean environments. Generally, more intensive agricultural activity is associated with decreasing organic matter [31] due to tillage, biomass removal and increased mineralization and decomposition of the exposed soils [32]. Land abandonment can further aggravate degradation processes by affecting soil microbial activity, biomass C and enzyme activities, although soils may begin to recover after the appearance of spontaneous vegetation [33]. Zonorza et al. (2009) observed increased microbial biomass C, richness and shifts in the microbial community structure of agricultural terraces after 10–15 years of abandonment [34]. Wildfires have also been identified as an important source of variation in soil quality, with negative effects on biochemical and microbiological parameters [35]. However, recent studies reported that microbiological soil properties and enzymatic activities in Mediterranean environments show great resilience, being able to recover pre-fire levels in fewer than 20 years [36]. Wildfire occurrence in abandoned agricultural areas is very common in Mediterranean catchments [8] and the effect of these combined factors on soil quality is still poorly understood. As studies addressing this issue through the analysis of soil microbiological parameters and enzymatic activities are scarce, more research into soil degradation and recovery processes in these environments is required.
This paper is part of a study series investigating the effects of terrace abandonment on soil quality in three Mediterranean microcatchments affected in different ways by wildfires [37]. This recent study evaluated soil degradation by means of physicochemical, biochemical and microbiological soil parameters, highlighting the need to further explore the relationships between biochemical soil properties, which can be used as simple indexes of soil quality. Moreover, changes in hydrological processes introduced by terracing may have a great influence on soil in terms of quantity and quality. The present study based on this previous research by Lucas-Borja et al. (2017) [37] incorporated several soil quality indices into the analysis, as these provide better understanding of the growth and activity of microbiological communities and the morphometric index of connectivity [IC] (17). These serve to evaluate: (1) whether abandoned terraces induce differences in sediment connectivity and in soil quality of three Mediterranean microcatchments under different wildfire regimes and (2) to what extent differences in soil quality can be attributed to the presence of agricultural terraces and their effects on connectivity, to the different wildfire regimes or to the combination of the two factors.

2. Materials and Methods
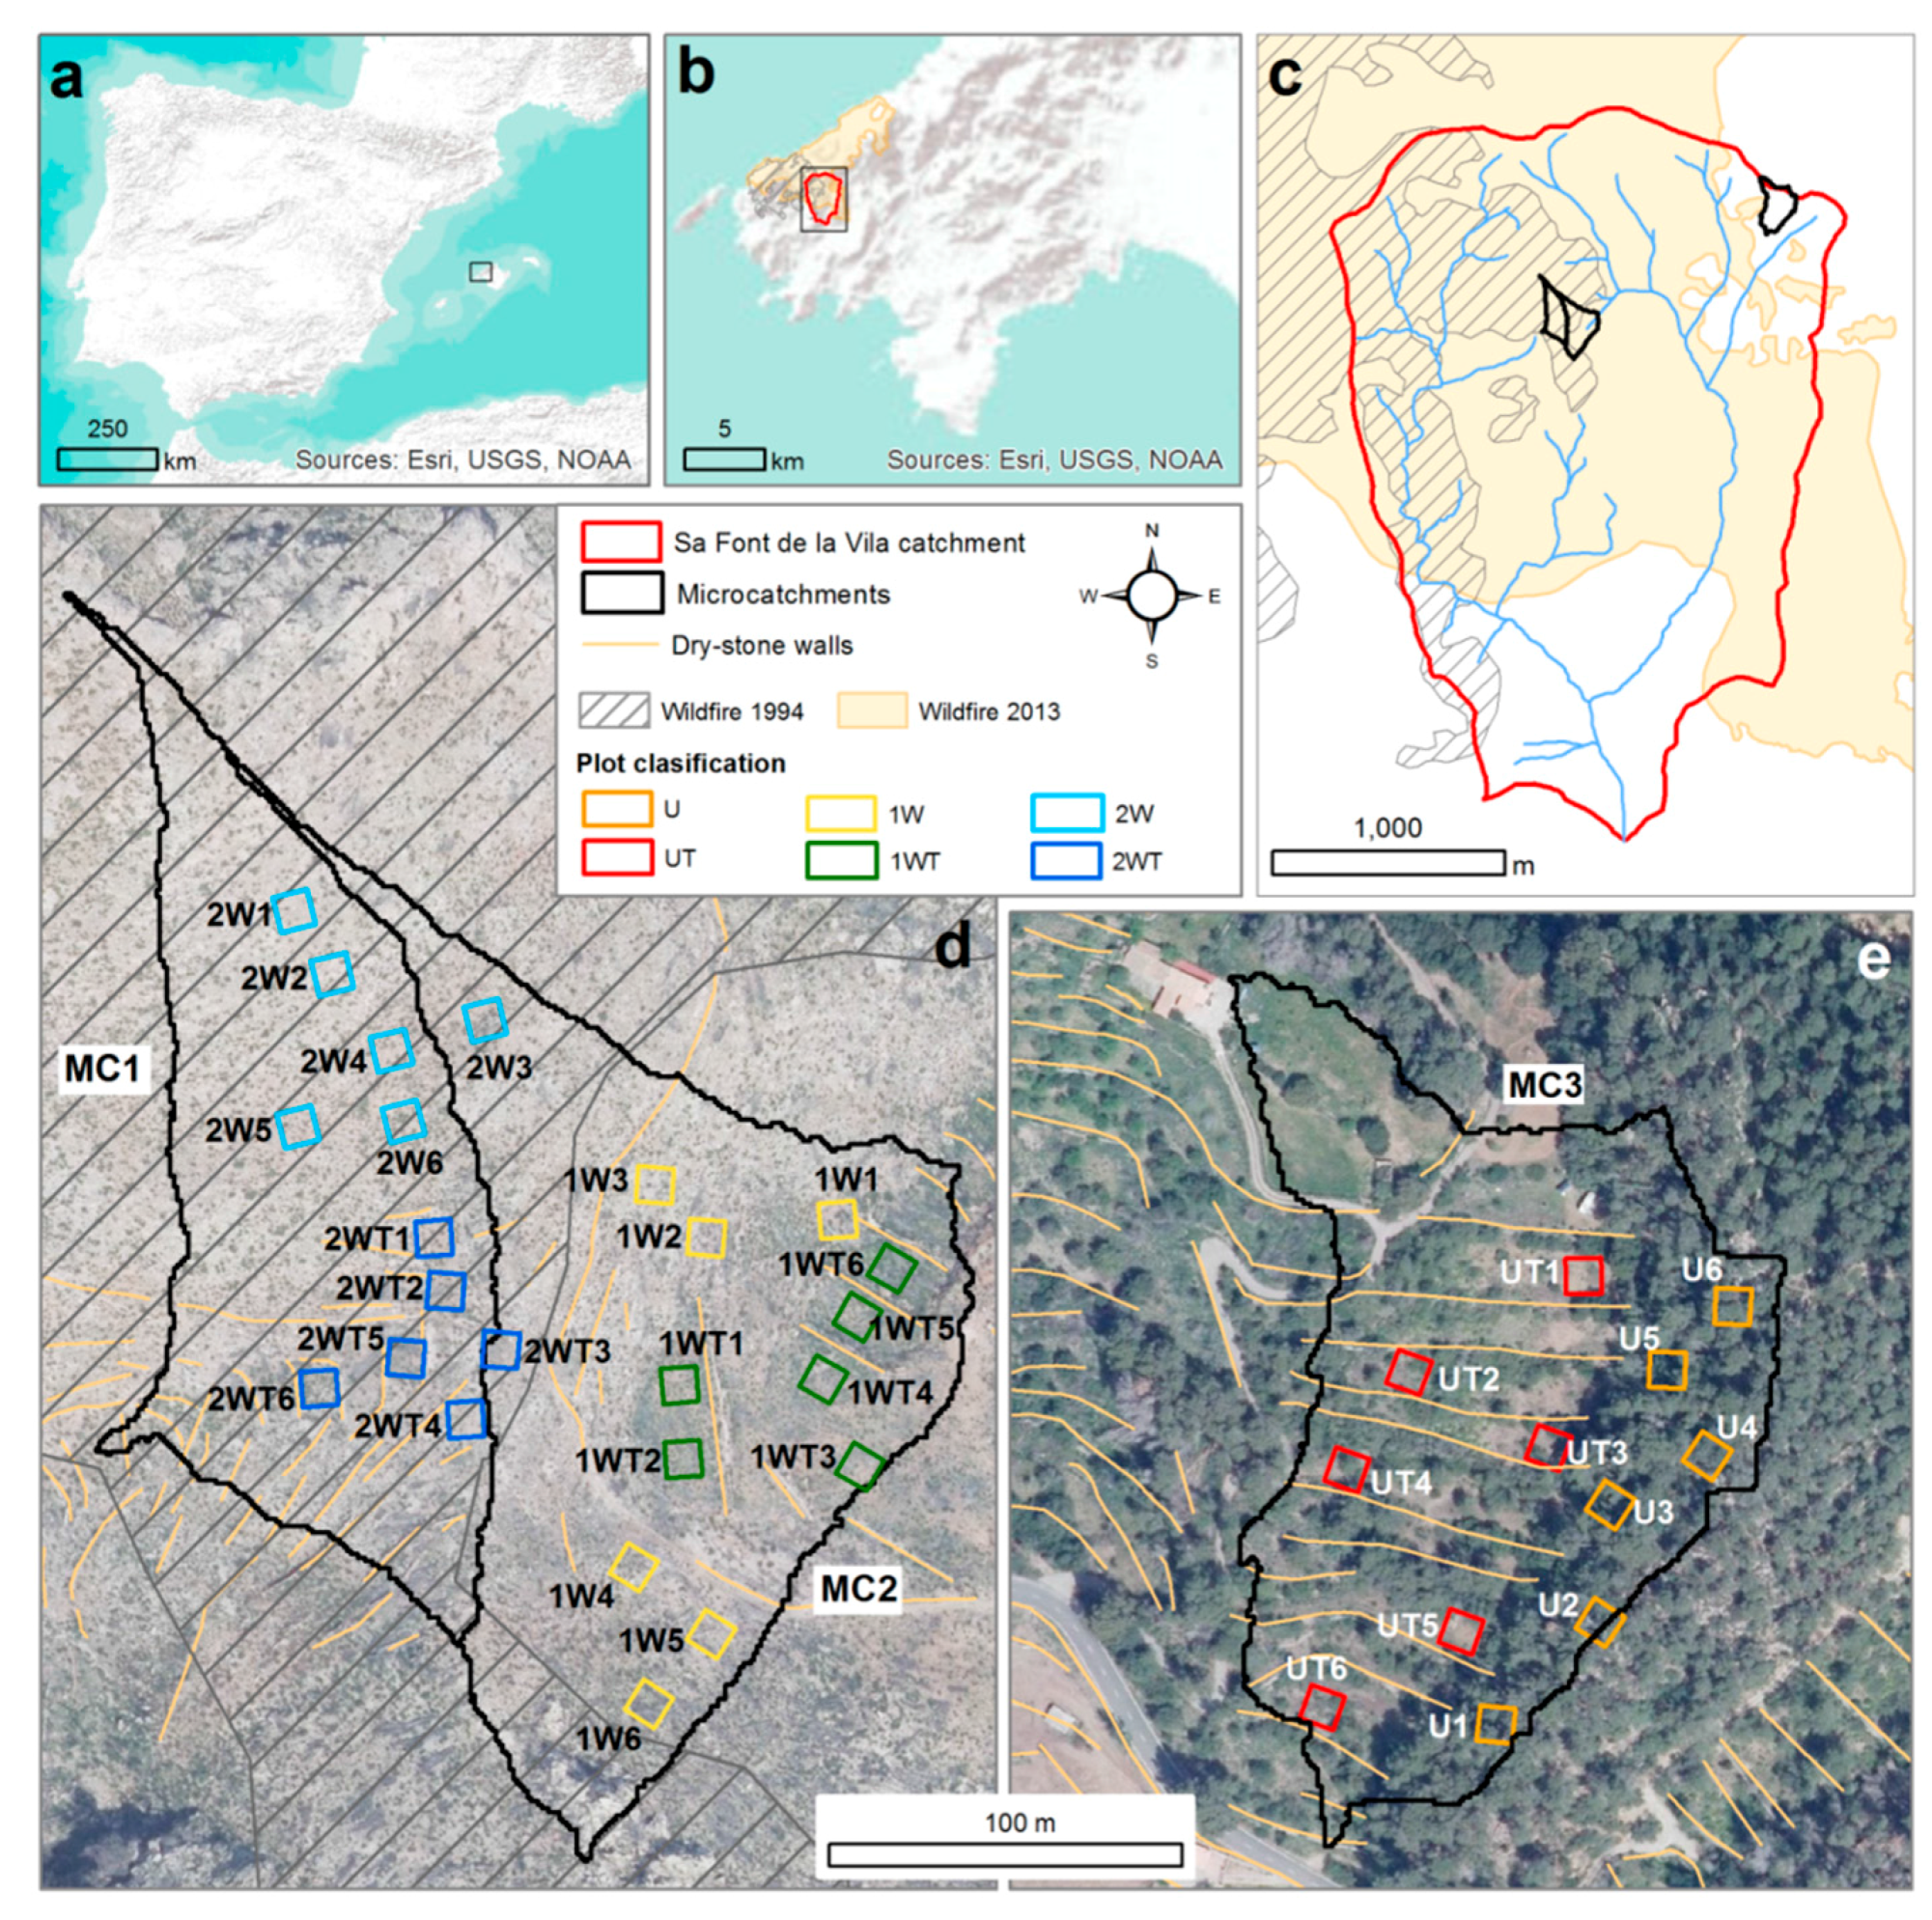
2.1. Study Area

Sa Font de la Vila catchment is a small catchment (4.8 km2) located in the southwestern part of the Tramuntana Range on the island of Mallorca (Figure 1a,b).
This county is a paradigmatic case of cultural Mediterranean landscape with important interactions between natural dynamics and ancient human activities. Over the centuries, its morphology has been shaped by intensive agricultural activity [38], resulting in a massive presence of terraces, i.e., 37% of the catchment surface area. The catchment’s morphology is complex, with height ranging between 63 and 517 m.a.s.l. (above sea level) and a mean gradient slope of 38%. Currently, agricultural activities are restricted to the valley bottoms, where the slope is less pronounced (<10%). Lithology consists mainly of Upper Triassic (Keuper) clays and loams. In the upper parts, where Rhaetian dolomites and Lias limestones predominate, slope gradients are steeper than 30%. Under the Soil Taxonomy System, soils can be classified as Entisols at the catchment headwaters and Alfisols in the lower parts. These underdeveloped soils do not exceed 20 cm and do not show defined horizons, as they consist mainly of slightly altered regolithic parent material. The climate is Mediterranean sub-humid and ranges between temperate and warm on the Emberger climate scale [39]. The mean annual temperature is 16.5 °C and the mean annual precipitation is 532 mm y-1 with an inter-annual coefficient of variation of 23% (1970–2010, data provided by the Spanish Meteorological Agency, AEMET). High-intensity rainstorms with a recurrence period of 10 years may reach 85 mm in 24 h. Since the mid-twentieth century, important socio-economic changes have caused the gradual abandonment of farmland in marginal areas, leading to increased afforestation. In the early 1990s, forest areas reached 77% of the entire catchment, with only 15% remaining as an agricultural area [39]. The increased availability of biomass, together with the lack of management, favored the occurrence of two large wildfires in 1994 and 2013. In 1994, the first wildfire affected 25% of the catchment’s surface area and reduced the forest cover to 52%. In July 2013, the wildfire affected 71%, with 30% of this overlapping with the area burned in 1994 (Figure 1c).
At the headwaters of the Sa Font de la Vila catchment, three afforested microcatchments were selected (Figure 1c) under the following criteria: (1) similar area and comparable characteristics (see Table 1); (2) representative presence of abandoned terraces and (3) distinct fire regimes. Using multitemporal mapping based on aerial photography, terrace abandonment in microcatchments 1 and 2 (MC1 and MC2) was identified in the early 1960s and afforestation processes in 1980s. Terraces in microcatchment 3 (MC3) were progressively abandoned since the 1970s and no clear afforestation processes were observed. In the study area, two types of terraces can be identified, based on the technical and constructive characteristics of terraces and their position relative to the fluvial drainage network [40]: (i) check-dam terraces that cut across first-order thalwegs orthogonally and refilled their original incision in a series of stepped plans retained by walls, (ii) step terraces, mainly built as narrow horizontal surfaces (<5 m wide) on steep hillslopes (>30%) to cultivate marginal areas. MC1 was completely burned in 1994 and 2013. MC2 was also burned in 2013 (100%) and partially affected (40%) by the 1994 fire. MC3 was selected as a control microcatchment since it was not affected by these fires.

2.2. Experimental Design and Sampling

At each microcatchment, 12 plots (5 m × 5 m) were established, in line with both the fire occurrence described and the terracing: six on terraced and six on non-terraced areas (Figure 1d,e). It should be noted that the plots selected in MC2 were only those in areas burned in 2013, avoiding those areas also burned in 1994. Thirty-six samples (one per plot) were collected in January 2016 (i.e., 2.5 year since the last wildfire in 2013), following the same procedure used by Lucas-Borja et al. (2010; 2012) [28,29]. Each sample consisted of six replicates (200 g), randomly distributed in each plot, which were mixed to obtain a composite sample. After manual exclusion of litter, samples were taken from the top 5 cm of soil because the largest portion of microbial biomass and activity fall within this horizon. In addition, differences associated with vegetation cover (through leaf fall) should be at their strongest, as opposed to the deeper horizons. Following the removal of plant remains, the samples were sieved at 2-mm Ø and kept at 3 °C prior to the analyses. Species composition, vegetation cover and the main morphological characteristics of plots are shown in Table 2.

2.3. Soil Quality Parameters

2.3.1. Physical and Chemical Parameters

Soil samples were immediately analyzed for pH and electrical conductivity (EC) in a 1:5 (w/v) aqueous solution. Total organic carbon (TOC) was determined by the potassium dichromate oxidation method [41]. The soil organic matter (SOM) was determined by multiplying soil organic carbon by 1.72. Total nitrogen (N) was determined by the Kjeldahl method [42]. Calcium carbonate content (CaCO3) was measured according to Porta et al. (1986) [43].

2.3.2. Biochemical and Microbiological Parameters

The basal soil respiration (REB) related with microbial activity was measured in a multiple sensor respirometer (Micro-Oxymax, Columbus, OH, USA). The microbial biomass Carbon (MBC), related with the number of soil microorganisms, was determined by the fumigation-extraction methods [44]. Urease activity was measured according to the method of Tabatabai (1994), using urea as substrate [45]. Alkaline phosphatase and β-glucosidase activities were determined using ρ-nitrophenyl phosphate disodium and ρ-nitrophenyl-β-d-glucopyranoside, respectively, as substrates. The assay is based on the release and detection of ρ-nitrophenol (PNP). The metabolic quotient (qCO2) has been used by various authors and expresses the amount of CO2-C produced per unit of biomass and time. Llorente and Turrión (2010) used it as an indicator of the adversity of the environmental conditions [46]. The mineralization coefficient (Qcm) was calculated as the fraction of basal soil respiration (REB) and total organic carbon (TOC), as proposed by Pinzari et al. (1999) [47]. The carbon ratio of microbial biomass with TOC (hereafter, MBC/TOC) is an indicator of the potential mineralization of organic matter [48]. The study of basal respiration, microbial biomass and ratios (metabolic and MBC/TOC) gives a rough idea of the microbiological communities present in soil and their response to distinct ecosystem perturbations. The synthetic enzymatic index (SEI) was calculated following Dumontet et al. (2001) and with the above-mentioned enzyme activities (urease, phosphatase and β-glucosidase) releasing the same reaction products [49]. From the activities of these three enzymes, soil functional diversity was determined by the Shannon Index of diversity (H) (H = p i   l o g 2   p i ), where pi is the ratio of the activity of a particular enzyme to the sum of activities of all enzymes [50].

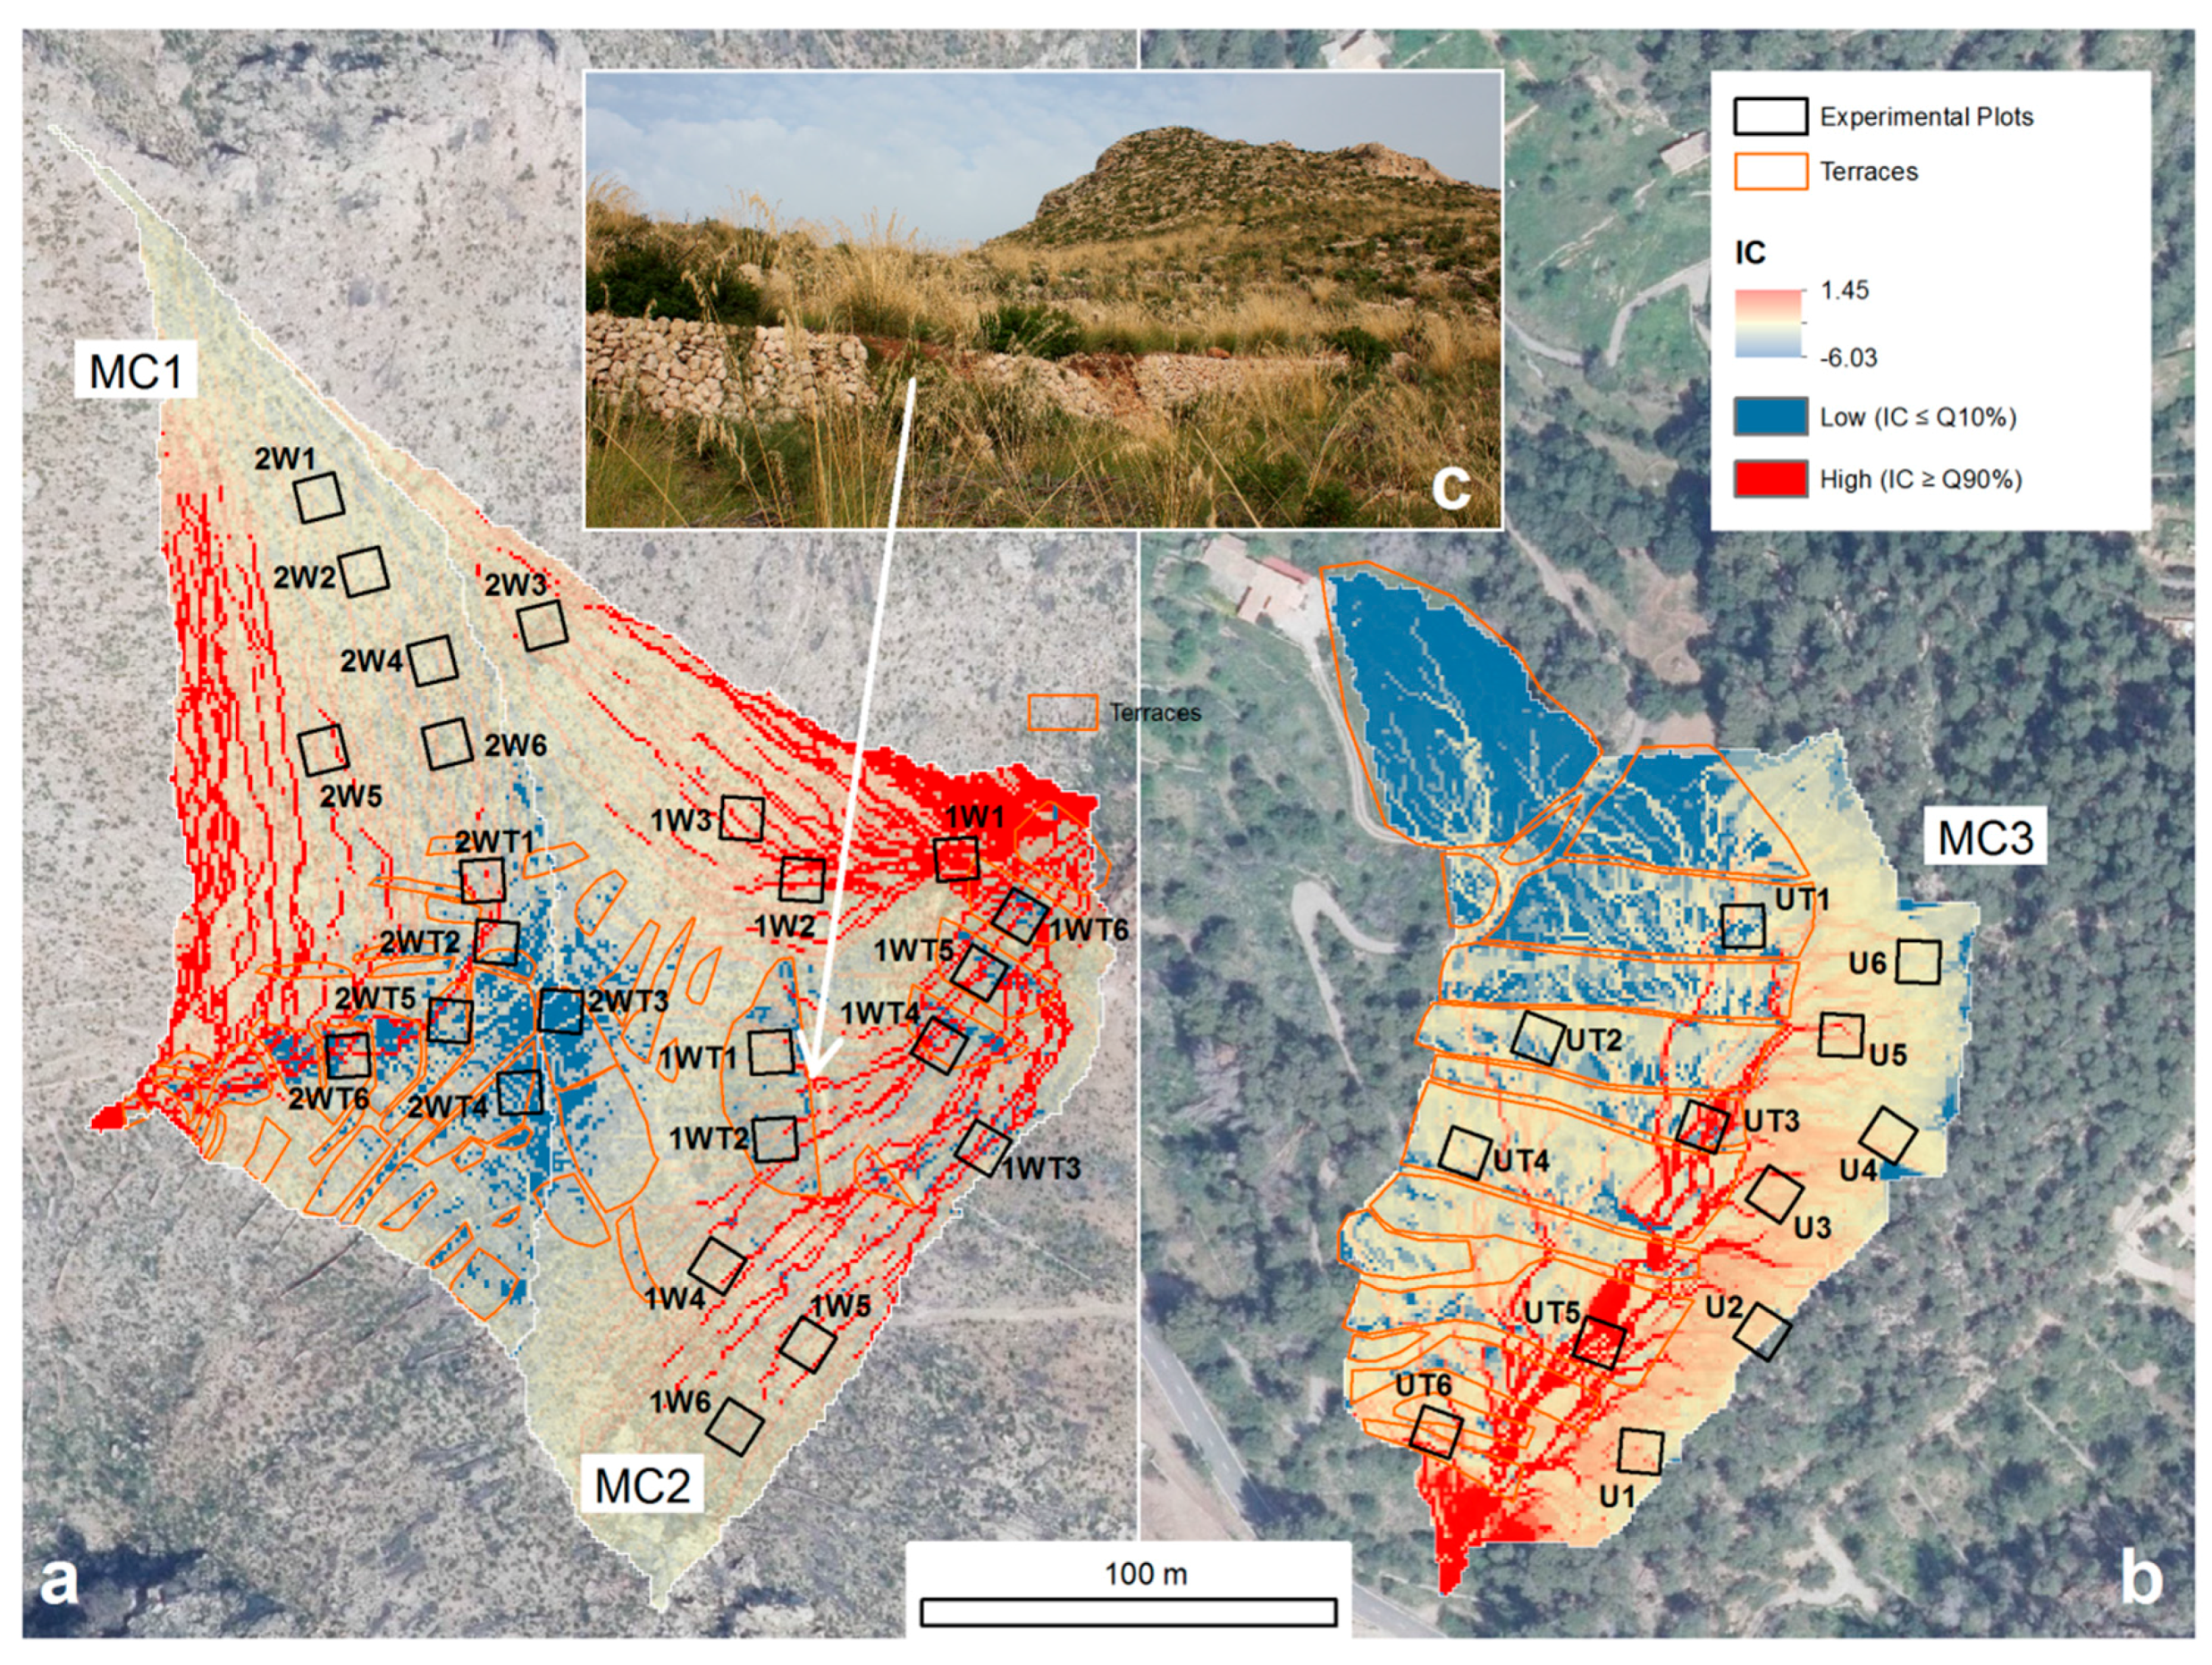
2.4. Morphometric Index of Connectivity

Analysis of connectivity patterns is particularly important in this study because they are closely related to sediment transfer processes (e.g., erosion, transport and deposition) leading to impoverishment of soil quality. The Index of Connectivity (IC), originally defined by Borselli et al. (2008), measures the potential linkage between different compartments of a catchment and indicates the probability of a particle at a certain location reaching a defined target area [17]. In this study, the targets were set at the outlet of each microcatchment. Thus, the most connected areas are those potential sediment sources that may be transferred through the catchment and delivered out of the system. IC was computed from a 1-m LiDAR-based DTM (Instituto Geográfico Nacional, 2014) following the approach of Cavalli et al. (2013), which is especially suitable for assessing the topographic influence of features on hydrological and sediment processes [51]. The enhanced algorithms proposed by Cavalli et al. (2013), incorporating important improvements for their application to mountainous catchments, were implemented by using the stand-alone freely available software SedInConnect 2.3 [52]. For each cell of the catchment, the IC was calculated by the upslope component Dup (i.e., the characteristics of the drainage area) and the downslope component Ddn (i.e., the characteristics of the flow path to the selected target):
IC = log 10 ( D u p D d n ) = log 10 ( W ¯ S ¯ A i d i W i S i )
where W ¯ is the average weighting factor (the impedance to runoff and sediment fluxes, using the roughness index IR [53]) of the contributing area upslope (dimensionless), S ¯ is the average slope gradient of the contributing area upslope (m/m), A is the contributing area upslope (m2) computed with the D-Infinity algorithm [54], di is the length of the flow path along the ith cell according to the steepest downslope direction (m), and Wi and Si are the weighting factor and the slope gradient of the ith cell, respectively.

2.5. Statistical Analysis

A first comparison of all soil quality parameters for each representative condition (different combinations of fire and presence/absence of terraces) was performed by a post-hoc Least Significant Difference (LSD) test using Statgraphics Plus 6.0® software (Statpoint Technologies, Inc.; The Plains, Virginia 20198, USA). For this previous analysis, a significance level of p < 0.05 was adopted. A CLUSTER analysis using Primer v6 (Massey University, Albany, Auckland 0632, New Zealand) [55] was used to identify whether representative plots could be grouped on the basis of their soil quality characteristics as well as their hydrological and sediment connectivity. Additionally, the ANOSIM (ANalysis of SIMilarities) routine, also in Primer v.6 (Massey University, Albany, Auckland 0632, New Zealand), compared within- and between-group similarities [56]. In a robust classification, similarities between plots within the same group should be substantially greater than similarities between those from different groups. A key output from this analysis is the R statistic coefficient, which ranges from −1 to 1. When the R statistic tends to 1, all plots within classification groups are more similar to each other than to any plots from different groups. When R approaches 0, similarity between and within classification groups may be considered statistically irrelevant. R negative values indicate that plots within a classification group are more similar on average to plots in the other groups than those in their own group. Although the R statistic is a useful comparative measure of the differences between plots, a Monte Carlo permutation test with 999 replicates was used to assess the significance (p) of each value. In this study, the established level of significance was p = 0.001. Finally, for the purpose of interpreting differences between the groups, a SIMPER (SIMilarity PERcentage) analysis was performed using Primer v6 (Massey University, Albany, Auckland 0632, New Zealand) [56]. This analysis identifies the most characteristic parameters of each group by calculating their contributions by means of similarity percentages (one-way analysis). Moreover, the SIMPER analysis identifies the most differing parameters between groups. The percentage contribution of each of them to these differences can also be calculated (pairwise tests). Based on the SIMPER analysis, close similarity between plots of the same group or between groups would result in low values of mean square distance (R), over a range of (0, 100). Conversely, important differences would be expressed with high values of mean square distance. The statistical significance in this analysis, also set at p = 0.001, was assessed by the same method as in the ANOSIM analysis.

3. Results

3.1. Soil Quality

3.1.1. Physical and Chemical Parameters

Significant differences (p < 0.05) were observed between physical and chemical parameters of the distinct plots (Table 3). Terraced plots, both unburned ones and those burned once, showed significantly lower soil organic content (5.6 ± 0.4) than non-terraced plots (10.2 ± 0.6). All terraced plots also had lower EC (1548 ± 5.6) than other plots (242 ± 16.9). N content (0.27 ± 0.01) was also significantly lower in terraced and burned plots. However, CaCO3 content was significantly higher in most terraced areas (25.9 ± 1.4 in terraced plots; 15 ± 1 in non-terraced plots). On the other hand, burned plots showed higher C/N ratios (12.9 ± 0.3) and pH (8.3 ± 0.1) than unburned plots (9.7 ± 0.4 and 8.1 ± 0.1, respectively). In non-terraced plots, a steady decrease in organic matter was detected as a result of the successive fires. On the contrary, in terraced plots, the higher occurrence of fires was associated with an increase in organic matter. Fire recurrence also seems to involve a steady decrease in CaCO3 content. However, no significant differences were observed for EC, C/N or pH between once- or twice-burned plots.

3.1.2. Biochemical and Microbiological Parameters

Terracing and fire occurrence influenced greatly the biochemical and microbiological soil parameters, with significant (p < 0.05) differences found between plots with distinct representative conditions (Table 3).
Non-terraced unburned plots, still covered by natural holm oak forest, showed greater soil respiration (REB = 2.4 ± 0.5) and enzymatic activities (UA = 2.7 ± 0.4; UPH = 2.9 ± 0.3; βGLA = 2.9 ± 0.3; SEI = 9.2 ± 0.7) than the rest of the plots (REB = 0.8 ± 0.04; UA = 0.5 ± 0.04; UPH = 1.5 ± 0.07; βGLA = 1 ± 0.1; SEI = 3 ± 0.1). Low soil biomass carbon was associated with terraced plots (MBC = 383 ± 42), while non-terraced plots had much higher values (1197 ± 264). The MBC/TOC ratio was significantly different in terraced and non-terraced plots: it was lower when combined with wildfires. On the other hand, all unburned plots showed higher Qcm (0.3 ± 0.03) and Shannon Index values (1.54 ± 0.01) than burned plots (0.2 ± 0.01 and 1.5 ± 0.01, respectively). However, differences in the Shannon Index values cannot be considered statistically significant. The effects of fire on qCO2 appeared to be different in terraced plots and non-terraced plots. Non-terraced unburned plots had higher metabolic activity (0.027 ± 0.002) than non-terraced burned plots (0.009 ± 0.001). In contrast, terraced unburned plots showed very low qCO2 values (0.014 ± 0.002), which were much higher in terraced burned plots (0.033 ± 0.006).

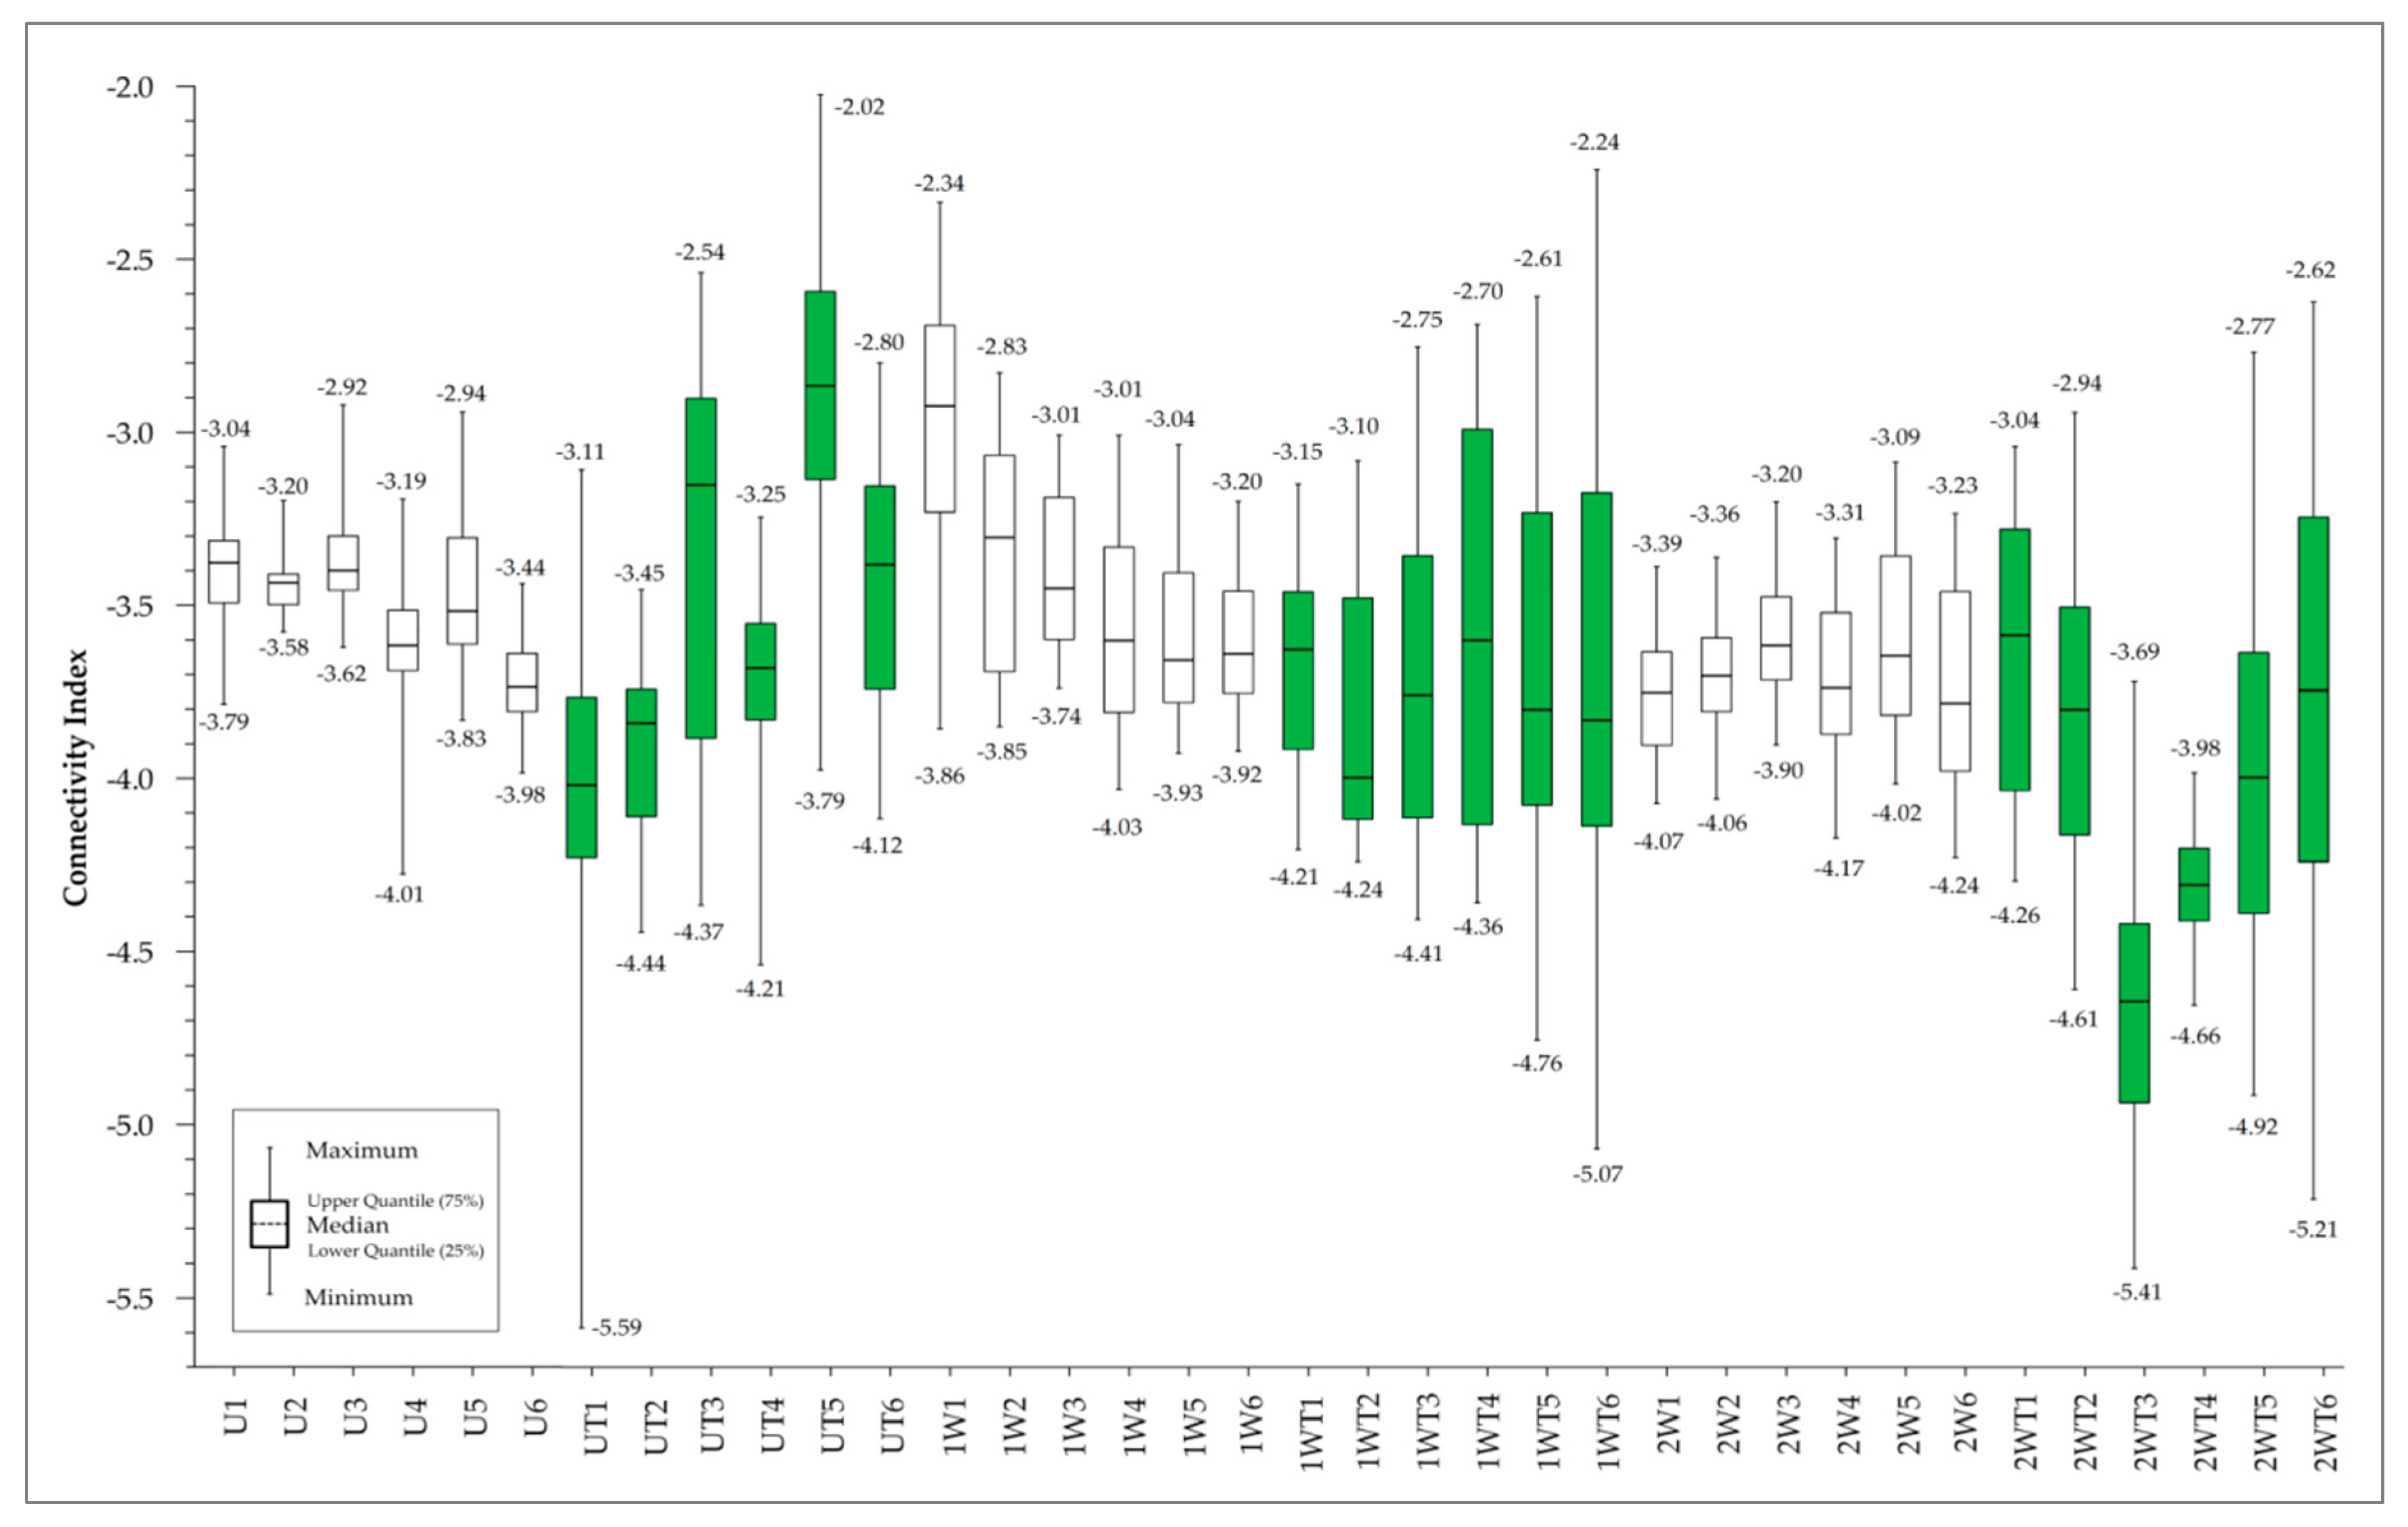
3.2. Spatial Patterns of Connectivity

IC calculations identified the most connected and disconnected areas in the selected microcatchments and also analyzed the effect of terraces on their spatial distribution (Figure 2).
Values lower than 10% IC distribution (≤−4.27) were mainly located within terraces (78%), as well as in some flat areas near the drainage divide. Fieldwork confirmed the high disconnectivity of these areas, in which no evidence of overland flow was observed. Values higher than 90% IC distribution (≥−3.09) formed highly-connected pathways along steep hillslopes and concave areas, especially in those closer to the catchment outlet. In many cases, these preferential lines of flow concentration run along terraced areas (32%), especially along check-dam terraces (e.g., plots 2WT2, 2WT5, 2WT6; 1WT4–1WT6), which were built on the natural thalweg. The failure of the dry-stone walls after the abandonment of crops showed a coupling effect that facilitated runoff concentration and increased erosion (Figure 2c). The greater variability of IC values in terraced areas (STD = 0.50) than in non-terraced areas (STD = 0.41) was fully consistent with the presence of well-connected pathways (i.e., high IC values) within very disconnected areas (low IC values). The main zonal statistics calculated by the selected plots reflected the same patterns (Figure 3). Plots located on non-terraced hillslopes (e.g., U1–U6; 1W1–1W6; 2W1–2W6) showed more homogeneous IC values (−4.24–−2.34), indicating lower concentration of the overland flow. On the contrary, plots on terraced areas showed a wider range of IC values (−5.59–−2.02), with higher maximum and lower minimum values, as well as a greater dispersion of the values included between Q25 and Q75 (in green in Figure 3).

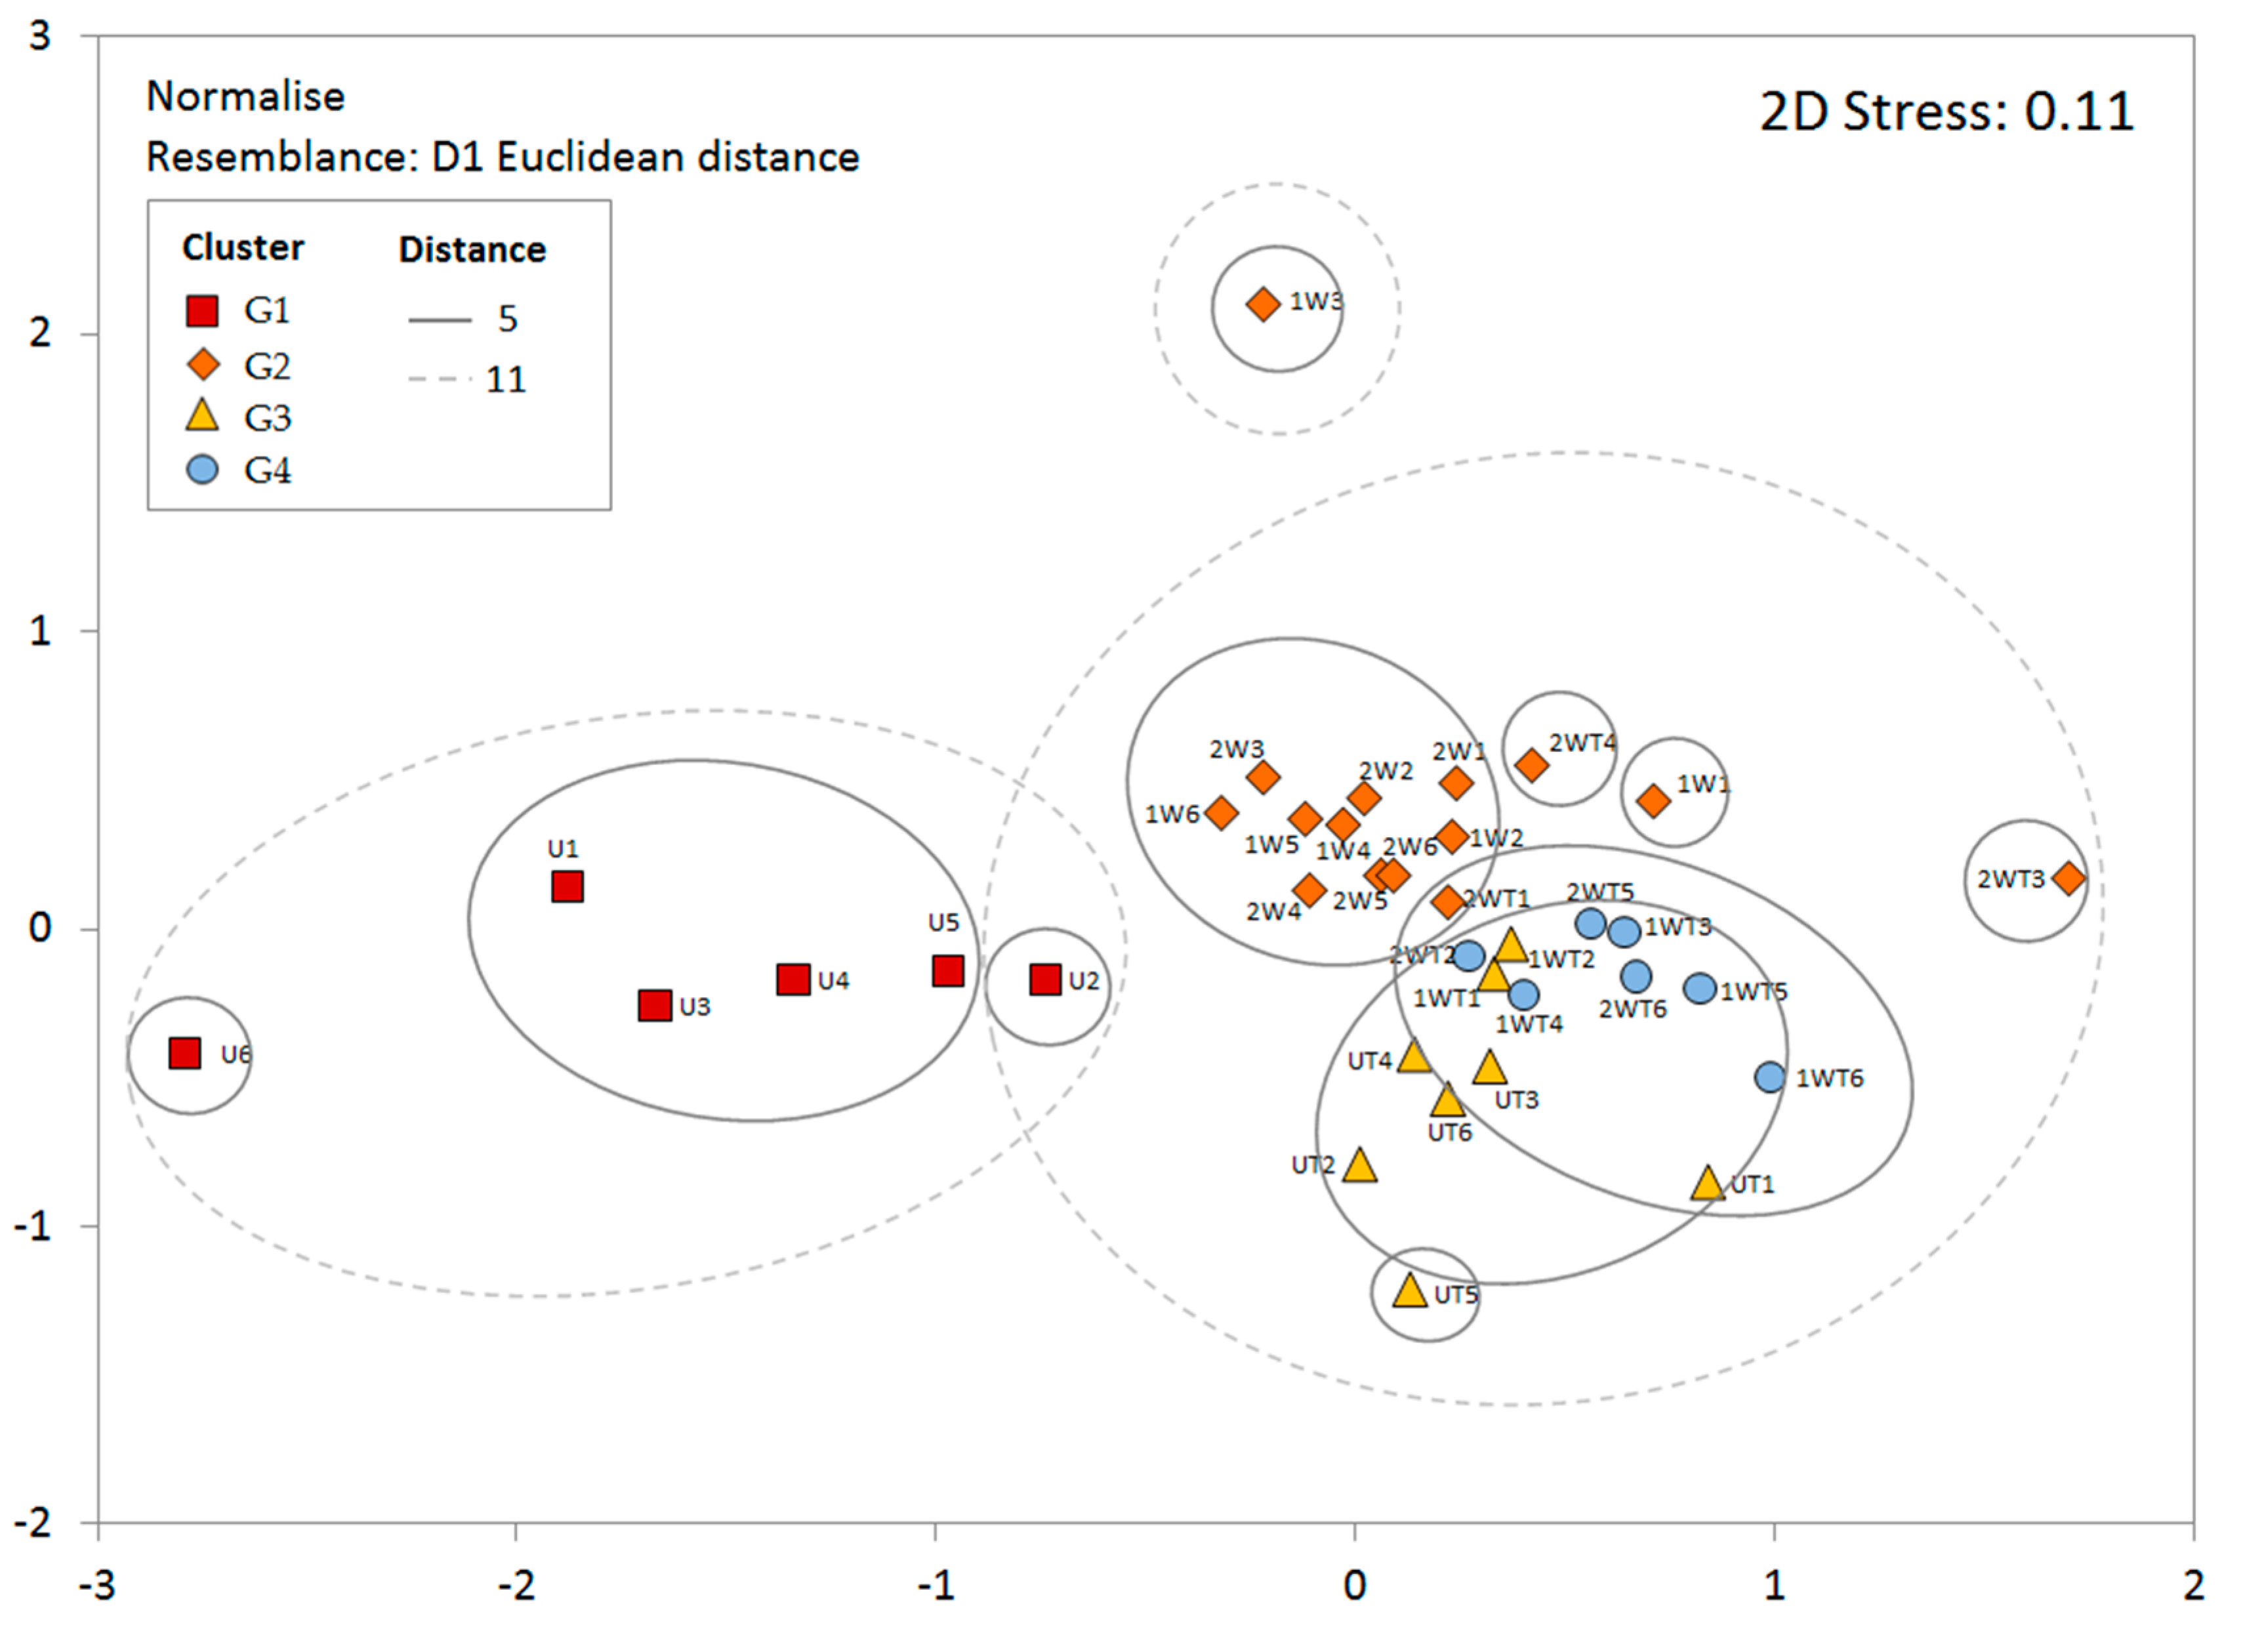
3.3. Clustering and Characterization of Groups

The cluster analysis depicted the degree of statistical similarity of the parameters studied (soil quality and connectivity) in the different plots, which was graphically represented by the Euclidean distance separating them (Figure 4). Plots are classified into different groups on the basis of similarity criteria. If a distance of 11 is applied, plots are classified into three groups, whereas if the degree of similarity is higher (i.e., Euclidean distance = 5), the number of groups increases to 11.
Therefore, the ANOSIM analysis was used iteratively for different plot combinations based on the cluster analysis (applying different Euclidean distances). Groups with no significant differences were pooled to reduce classification into statistically distinct groups. As a result, four groups of plots were established, showing significant differences between all (Overall R = 0.56, p < 0.001) and between pairs of groups (Table 4).
These four groups showed a good relationship with the different combinations of terraced or non-terraced, burned or unburned plots (Figure 4). The first group (G1) included only unburned plots without terraces (i.e., U1–U6) and still covered by holm oak forest (30–90%). The second group (G2) mainly consisted of burned plots located on steep (30–64%) and stony (30–75%) non-terraced hillslopes and with low vegetation cover (i.e., 1W1–1W6; 2W1–2W6; 2WT1; 2WT3; 2WT4). The third group (G3) mostly consisted of unburned plots at abandoned terraces (i.e., UT1–UT6; 1WT1; 1WT2). Finally, the fourth group (G4) included only burned plots located at degraded check-dam terraces (i.e., 1WT3–1WT6; 2WT2; 2WT5; 2WT6). The ANOSIM analysis of the studied parameters did not reveal significant differences between plots differently affected by fire, including once- and twice-burned plots in the same groups.
The SIMPER one-way analysis assessed the similarity between plots belonging to each group, identifying the most characteristic parameters and the contribution in similarity percentages (Table 5).
G1 plots showed great similarity (average square distance = 13.27). Soil mineralization (20%), soil respiration (18.8%) and average N% (12.3%), showing higher values than the average for all plots, represented more than 50% of the similarity. Conductivity (9.8%), urease activity (7.5%) and SOM (7.3%), also showing higher values than the average, were also parameters with significant contributions. The average square distance between G2 plots (12.65) was similar to G1. The characteristic parameters with a greater similarity contribution were microbial biomass (15.8%) and MBC/TOC (15.7%), with values higher than the average of all plots, and qCO2 (11.8%), showing lower average values. Plots in this group, despite being located on very steep hillslopes, did not show high connectivity values: low mean IC (−3.68) and maximum IC values (−3.18) were characteristic parameters, contributing 11.7% and 7.3%, respectively. G3 plots were very similar to each other, with an average square distance of 8.46. The most characteristic parameters were related to connectivity. Mean IC, maximum IC, minimum IC and range IC values together explained more than 50% of group similarity. C/N and Qcm were also characteristic parameters, contributing 10.3% and 7.9%, respectively. G4 plots showed the greatest similarity within a group (average square distance = 4.39). This can be attributed to soil quality parameters such as C/N (23.9%), qCO2 (16.8%) and Shannon Index (7.4%), but also to a wide range of IC values, with very high maximum IC values and very low minimum IC values. These three parameters contributed 13.4%, 9.9% and 7.1% to the similarity percentage of this group, respectively.
The SIMPER pairwise analysis evaluated differences between groups, identifying the most important parameters contributing to their dissimilarity (Table 6). G1 showed significant dissimilarity with the rest of the groups (Table 4). Accordingly, the SIMPER analysis also resulted in high values (G1 and G2 = 68.17; G1 and G3 = 73.59; G1 and G4 = 77.15). Enzymatic activities (i.e., urease, β-glucosidase, and phosphatase) were the most characteristic parameters in G1; they were always among those parameters with a higher dissimilarity percentage. In unburned and non-terraced plots, the Synthetic Enzyme Index, which encompasses all enzymatic activity, showed higher average values (9.2) than G2 (3.15), G3 (3.18) and G4 (2.51). Soil respiration in G1 was also higher than in the rest of groups. These were the most important parameters explaining the differences between G1 and burned areas. However, differences with G3 also included parameters such as N%, conductivity or SOM, contributing 10.1%, 9.7% and 9.2% to the dissimilarity percentage, respectively. Values of these former parameters in G3 were much lower (N = 0.24; EC = 139.6; SOM = 4.1) than in G1 (N = 0.69; EC = 307.8; SOM = 11.6). G2, G3 and G4, despite showing significant differences with each other (R > 0.4; p ≤ 0.003, see Table 4), showed less dissimilarity than with G1 (Table 6). IC values in terraced plots (G3 and G4) had a wider range of values than in non-terraced plots, with higher maximum IC values and lower IC minimum values. Check-dam terraces in group G4, located in thalweg areas, showed especially high maximum and range IC values. Soil organic matter and total nitrogen content in G3 and G4, as well as MBC and soil respiration, were lower than non-terraced groups. On the contrary, high CaCO3 content was a characteristic differential parameter of terraced areas, especially in G3 (31.15%), which was one of the parameters with the greatest contribution. High soil mineralization in G3 (0.3 mg C-CO2 g−1 C h−1) was also one of the most characteristic parameters of the group.

4. Discussion

Significant differences in soil quality parameters and indices (R > 0.73, p = 0.001) were observed between unburned plots without terraces (G1) and the other plots under different representative conditions (G2, G3, G4). Plots belonging to G1, considered as reference plots, were characterized by high organic matter and MBC contents, balanced C/N ratios, greater soil respiration and a higher enzymatic activity than burned and/or terraced plots. The higher soil quality in these plots could be attributed to the presence of greater vegetation cover (60%) than in burned plots. However, unburned terraced plots (UT), with even greater vegetation cover (70%), also showed lower MBC/TOC, lower respiration, and enzymatic activity values closer to burned plots, indicating an important role of different factors such as species composition and agricultural activities during the past.
While reference plots were covered by natural forest mainly consisting of Quercus ilex (60%), vegetation on unburned terraced plots was mostly young Pinus halepensis (<10 year) and shrubs that colonized terraces after their abandonment. Rutigliano et al. (2004) observed that vegetation in more advanced stages of ecological succession leads to a greater contribution of organic matter and better conditions for microbiological and enzymatic activities [57]. Other authors have demonstrated that the accumulation of soil organic compounds in unburned and non-terraced mixed oak and pine forests was directly related to increased enzymatic activities [29]. Therefore, vegetation removal and changes in plant composition deriving from both wildfires and agricultural activities may be considered key factors [35,58] that explain the higher quality of the soil in the undisturbed plots in this study.
The significant differences between reference and terraced plots (R ≥ 0.92, p = 0.001) cannot be attributed solely to vegetation composition, but also to the agricultural activities followed over decades. The conversion of natural ecosystems to agricultural systems drastically reduces the levels of soil organic matter [31,32,33,34], which is essential for the development of soil microbial activities [30,36]. In this study, plots located in terraced areas showed very low organic matter contents, hampering microbial biomass growth, which had much lower values than in non-terraced plots. Terraced plots showed lower nitrogen content, soil respiration and enzymatic activities. Although abandonment of agricultural activities enables the reestablishment of soil over time, the results of this study corroborate that its recovery can be slow, especially in Mediterranean environments suffering erosion processes [33]. IC calculations confirmed that the construction of terraces and their subsequent abandonment induced changes in the spatial patterns of hydrological and sediment connectivity [20], favoring enhanced concentration of surface runoff and, consequently, further development of erosion processes. Previous studies in the Sa Font de la Vila catchment showed that terrace abandonment triggered feedback dynamics in which the collapse of the walls generated increased connectivity, which in turn exacerbated the erosion processes leading to their collapse [11]. The most connected areas within terraces showed clear evidence of erosion along preferential pathways, which may be strongly related to soil and organic matter losses, with negative effects on microbiological communities and enzymatic activities. The high hydrological connectivity within terraces, especially in the check-dam terraces, was also related to increased soil carbonation processes, occurring especially as a result of the tillage and the remobilization of the soil [59]. The high CaCO3 content in terraced plots, which slows down soil development processes [60], was one of the most significant factors of dissimilarity with the other plots.
Lombao et al. (2015) also pointed to vegetation as the key factor controlling soil quality in burned forests in Galicia (Spain) [36]. However, fire was also considered by these authors an important source of transformation with significant impacts on soil quality. The extent of the effects of fire can be highly variable depending on fire regime or local conditions [5,6], but generally fires cause partial or complete destruction of organic matter, deterioration of the soil structure, altered aggregate stability and marked quantitative and qualitative alterations of soil microbial communities [61]. In this study, burned plots without terraces showed slightly lower soil organic matter and nitrogen contents, higher pH and conductivity values, as well as reduced soil respiration and lower enzymatic activities than reference plots. However, burned terraced plots showed much lower contents of soil organic matter, regardless of whether they were burned once or twice. This suggests that wildfires had negative effects on soil quality in all burned areas, but previous soil conditions were more favorable in non-terraced than terraced plots.
Depending on the intensity and severity of fire, soil ecosystems can be transformed into different environments for microorganisms after a wildfire. Fire-induced changes in the quantity and quality of soil organic matter are a determining factor controlling the response of the system [62]. Changes in certain soil parameters (e.g., pH or nutrient availability) will also determine the recovery of microbial biomass, its composition and its activity during post-fire recolonization. Bárcenas-Moreno et al. (2011) showed that, despite the loss of organic matter from the soil after a fire, the increase in pH and the contribution of new nutrients may allow a significant recovery of C of microbial biomass after a few months and provide more favorable conditions for its activity [63]. However, the same authors emphasized that the conservation of a minimum content of SOM and N is essential for the recovery of microbial communities. Accordingly, fire-induced changes (e.g., pH increase) coupled with sufficient organic matter availability could have favored a large growth of microbial communities in burned and non-terraced plots, as indicated by the high values of MBC.
Burned and terraced plots, with significantly lower SOM and N contents, had higher qCO2, which indicates enhanced metabolic activity of the smaller microbial communities. On the contrary, activity in plots with a greater presence of microorganisms could have been limited by the lower proportion of soil organic matter and nitrogen in relation to the microbial biomass. The higher metabolic activity of the smaller microbial communities, as well as their slightly higher mineralization capacity, could favor a faster recovery of the plots with lower soil quality, which is indicative of the great resilience of Mediterranean soil ecosystems [64].

5. Conclusions

This study provided valuable insight into the soil quality and hydrological connectivity of Mediterranean ecosystems by looking at the combined effects of agricultural terracing and wildfires. The following conclusions were reached:
(1)
Non-terraced and unburned plots, with a vegetation cover dominated by natural oak forests, had much higher soil quality than all other plots. They had higher organic matter and nitrogen contents, as well as greater microbiological and enzymatic activity. Changes in vegetation cover and composition induced by both wildfires and terracing were therefore identified as determining differential factors.
(2)
Terraced plots, regardless of fire effects, had much lower soil quality than other plots had. Low organic matter content and low microbial biomass in terraced plots indicated that agricultural activities in the past still had negative effects on soil quality before the occurrence of wildfires.
(3)
Fire was significant, contributing to the worsening of most biochemical and microbiological parameters in both terraced and non-terraced plots. However, while burned non-terraced plots showed higher microbial biomass but lower metabolic ratios, burned terraced plots showed lower microbial biomass but higher metabolic activity, as well as slightly higher mineralization. Thus, microbiological communities in plots with different availability of organic matter and nitrogen due to agricultural activities reacted differently to fires.
(4)
Although the construction of terraces has been recognized as a very effective soil conservation technique, the lack of maintenance caused changes in the spatial patterns of hydrological and sediment connectivity, favoring runoff concentration and enhanced erosion. Soil and organic matter losses in abandoned terraces is an added impact, hindering soil recovery after fires.
The complexity of Mediterranean ecosystems requires the integrated study of many factors interacting at different spatiotemporal scales. More research, from a multidisciplinary perspective, is needed to quantify land degradation processes, which would assist the design, implementation and evaluation of management and restoration plans.

Acknowledgments

This research was supported by the Balearic Forest Service (Department of the Environment, Agriculture and Fisheries of the Balearic Autonomous Government) and by the research project CGL2012-32446, “Assessing hydrological and sediment connectivity in contrasting Mediterranean catchments. Impacts of Global Change-MEDhyCON,” funded by the Ministry of Economy and Competitiveness of the Spanish Government. Aleix Calsamiglia acknowledges support from the Spanish Ministry of Economy and Competitiveness through the pre-doctoral contract EEBB-I-15-10280. Manuel E. Lucas-Borja acknowledges Project Code (01110AB019) and the University of Castilla-La Mancha for the grant received under the Castilla La Mancha University short research visit program. Josep Fortesa has a contract funded by the European Commission—Directorate General for European Civil Protection and Humanitarian Aid Operations. Julián García-Comendador is in receipt of a pre-doctoral contract (FPU15/05239) funded by the Spanish Ministry of Education and Culture. Airborne LiDAR data were provided by the Spanish Geographic Institute (IGN); and meteorological data, by the Spanish Meteorological Agency (AEMET).

Author Contributions

Joan Estrany and Manuel Esteban Lucas-Borja conceived and designed the experiments; Josep Fortesa and Julián García-Comendador performed the experiments; Aleix Calsamiglia and Manuel Esteban Lucas-Borja analyzed the data; Joan Estrany contributed reagents/materials/analysis tools; Aleix Calsamiglia wrote the paper.

Conflicts of Interest

The authors declare no conflicts of interest.

References

  1. Shakesby, R.A.; Doerr, S.H. Wildfire as a hydrological and geomorphological agent. Earth-Sci. Rev. 2006, 74, 269–307. [Google Scholar] [CrossRef]
  2. Folch, R. La Vegetació Dels Països Catalans; Ketres, Ed.; X Memoria de l’Institut Català d’Història Natural: Barcelona, Spain, 1980; 541p. [Google Scholar]
  3. Pausas, J.G.; Llovet, J.; Rodrigo, A.; Vallejo, V.R. Are wildfires a disaster in the Mediterranean basin? A review. Int. J. Wildland Fire 2008, 17, 713–723. [Google Scholar] [CrossRef]
  4. Carreiras, M.; Ferreira, A.J.D.; Valente, S.; Fleskens, L.; Gonzales-Pelayo, O.; Rubio, J.L.; Stoof, C.R.; Coelho, C.O.A.; Ferreira, C.S.S.; Ritsema, C.J. Comparative analysis of policies to deal with the wildfire risk. Land Degrad. Dev. 2014, 25, 92–103. [Google Scholar] [CrossRef]
  5. Shakesby, R.A. Post-wildfire soil erosion in the Mediterranean: Review and future research directions. Earth-Sci. Rev. 2011, 105, 71–100. [Google Scholar] [CrossRef]
  6. Neary, D.G.; Ffolliott, P.F.; Landsberg, J.D. Chapter 5—Fire and streamflow regimes. In Wildland Fire in Ecosystems. Effects of Fire on Soil and Water; Neary, D.G., Ryan, K.C., DeBano, L.F., Eds.; General Technical, Report, RMRS-GTR-42-Volume 4; United States Department of Agriculture Forest Service, Rocky Mountain Research Station: Ogden UT, USA, 2008; pp. 107–118. [Google Scholar]
  7. Hooke, J.M. Human impacts on fluvial systems in the Mediterranean region. Geomorphology 2006, 79, 311–335. [Google Scholar] [CrossRef]
  8. Tomaz, C.; Alegria, C.; Monteiro, J.M.; Teixeira, M.C. Land cover change and afforestation of marginal and abandoned agricultural land: A 10 year analysis in a Mediterranean region. For. Ecol. Manag. 2013, 308, 40–49. [Google Scholar] [CrossRef]
  9. García-Orenes, F.; Guerrero, C.; Roldán, A.; Mataix-Solera, J.; Cerdà, A.; Campoy, M.; Zornoza, R.; Bárcenas, G.; Caravaca, F. Soil microbial biomass and activity under different agricultural management systems in a semiarid Mediterranean agroecosystem. Soil Tillage Res. 2010, 109, 110–115. [Google Scholar] [CrossRef]
  10. Arnáez, J.; Lana-Renault, N.; Lasanta, T.; Ruiz-Flaño, P.; Castroviejo, J. Effects of farming terraces on hydrological and geomorphological processes. A review. Catena 2015, 128, 122–134. [Google Scholar] [CrossRef]
  11. Calsamiglia, A.; Fortesa, J.; García-Comendador, J.; Lucas-Borja, M.E.; Calvo-Cases, A.; Estrany, J. Spatial patterns of sediment connectivity in terraced lands: Anthropogenic controls of catchment sensitivity. Land Degrad. Dev. 2017, in press. [Google Scholar]
  12. Perlotto, C.; D’Agostino, V. Performance assessment of bench terraces through 2-D modelling. Land Degrad. Dev. 2016. [Google Scholar] [CrossRef]
  13. García-Comendador, J.; Fortesa, J.; Calsamiglia, A.; Calvo-Cases, A.; Estrany, J. Post-fire hydrological response and suspended sediment transport of a Mediterranean terraced catchment. Earth Surf. Process. Landf. 2017. [Google Scholar] [CrossRef]
  14. Lesschen, J.P.; Cammeraat, L.H.; Nieman, T. Erosion and terrace failure due to agricultural land abandonment in a semi-arid environment. Earth Surf. Process. Landf. 2008, 33, 1574–1584. [Google Scholar] [CrossRef]
  15. Bracken, L.J.; Turnbull, L.; Wainwright, J.; Bogaart, P. Sediment connectivity: a framework for understanding sediment transfer at multiple scales. Earth Surf. Process. Landf. 2014, 40, 177–188. [Google Scholar] [CrossRef] [Green Version]
  16. Hooke, J. Coarse sediment connectivity in river channel systems; a conceptual framework and methodology. Geomorphology 2003, 56, 79–94. [Google Scholar] [CrossRef]
  17. Borselli, L.; Cassi, P.; Torri, D. Prolegomena to sediment and flow connectivity in the landscape: a GIS and field numerical assessment. Catena 2008, 75, 268–277. [Google Scholar] [CrossRef]
  18. Fryirs, K.; Brierley, G.J.; Preston, N.J.; Kasai, M. Buffers, barriers and blankets: The (dis)connectivity of catchment-scale sediment cascades. Catena 2007, 70, 49–67. [Google Scholar] [CrossRef]
  19. Cawson, J.G.; Sheridan, G.J.; Smith, H.G.; Lane, P.N.J. Effects of fire severity and burn patchiness on hillslope-scale surface runoff, erosion and hydrologic connectivity in a prescribed burn. For. Ecol. Manag. 2013, 310, 219–233. [Google Scholar] [CrossRef]
  20. López-Vicente, M.; Poesen, J.; Navas, A.; Gaspar, L. Predicting runoff and sediment connectivity and soil erosion by water for different land use scenarios in the Spanish Pre-Pyrenees. Catena 2013, 102, 62–73. [Google Scholar] [CrossRef] [Green Version]
  21. Foerster, S.; Wilczok, C.; Brosinsky, A.; Segl, K. Assessment of sediment connectivity from vegetation cover and topography using remotely sensed data in a dryland catchment in the Spanish Pyrenees. J. Soils Sediments 2014, 14, 1982–2000. [Google Scholar] [CrossRef]
  22. Bellin, N.; van Wesemael, B.; Meerkerk, A.; Vanacker, V.; Barbera, G.G. Abandonment of soil and water conservation structures in Mediterranean ecosystems: A case study from south east Spain. Catena 2009, 76, 114–121. [Google Scholar] [CrossRef]
  23. Laishram, J.; Saxena, K.G.; Maikhuri, R.K.; Rao, K.S. Soil Quality and Soil Health: A Review. Int. J. Ecol. Environ. Sci. 2012, 38, 19–37. [Google Scholar]
  24. Nortcliff, S. Standardisation of soil quality attributes. Agric. Ecosyst. Environ. 2002, 88, 161–168. [Google Scholar] [CrossRef]
  25. Doran, J.W.; Parkin, T.B. Quantative indicators of soil quality: A minimum data set. In Methods for Assessing Soil Quality; Doran, J.W., Jones, A.J., Eds.; SSSA Special Publication No. 49; Soil Science Society of America: Madison, WI, USA, 1996; pp. 25–37. [Google Scholar]
  26. Filip, Z. International approach to assessing soil quality by ecologically-related biological parameters. Agric. Ecosyst. Environ. 2002, 88, 164–174. [Google Scholar] [CrossRef]
  27. Gil-Sotres, F.; Trasar-Cepeda, C.; Leiros, M.C.; Seoane, S. Different approaches to evaluating soil quality using biochemical properties. Soil Biol. Biochem. 2005, 37, 877–887. [Google Scholar] [CrossRef]
  28. Lucas-Borja, M.E.; Bastida, F.; Nicolás, C.; Moreno, J.L.; del Cerro, A.; Andrés, M. Influence of forest cover and herbaceous vegetation on the microbiological and biochemical properties of soil under Mediterranean humid climate. Eur. J. Soil Biol. 2010, 46, 273–279. [Google Scholar] [CrossRef]
  29. Lucas-Borja, M.E.; Candel, D.; Jindo, K.; Moreno, J.L.; Andrés, M.; Bastida, F. Soil microbial community structure and activity in monospecific and mixed forest stands, under Mediterranean humid conditions. Plant Soil 2012, 354, 359–370. [Google Scholar] [CrossRef]
  30. Trasar-Cepeda, C.; Leirós, M.C.; Gil-Sotres, F. Hydrolytic enzyme activities in agricultural and forest soils. Some implications for their use as indicators of soil quality. Soil Biol. Biochem. 2008, 40, 2146–2155. [Google Scholar] [CrossRef] [Green Version]
  31. Golchin, A.; Clarke, P.; Oades, J.M.; Skjemstad, J.O. The effects of cultivation on the composition of organic matter and structural stability of soils. Aust. J. Soil Res. 1995, 33, 975–993. [Google Scholar] [CrossRef]
  32. Oldeman, L.; van Engelen, V.; Pulles, J. The Extent of Human-Induced Soil Degradation; International Soil Reference and Information Center: Wageningen, The Netherlands, 1990; 21p. [Google Scholar]
  33. García, C.; Roldán, A.; Hernández, T. Changes in microbial activity after abandonment of cultivation in semiarid Mediterranean environment. Ecosyst. Process. 1997. [Google Scholar] [CrossRef]
  34. Zornoza, R.; Guerrero, C.; Mataix-Solera, J.; Scow, K.M.; Arcenegui, V.; Mataix-Beneyto, J. Changes in soil microbial community structure following the abandonment of agricultural terraces in mountainous areas of Eastern Spain. Appl. Soil Ecol. 2009, 42, 315–323. [Google Scholar] [CrossRef] [PubMed]
  35. Lombao, A.; Barreiro, A.; Carballas, T.; Fontúrbel, M.T.; Martín, A.; Vega, J.A.; Fernández, C.; Díaz-Raviña, M. Changes in soil properties after a wildfire in Fragas do Eume Natural Park (Galicia, NW Spain). Catena 2015, 135, 409–418. [Google Scholar] [CrossRef]
  36. Hedo, J.; Lucas-Borja, M.E.; Wic, C.; Andrés-Abellán, M.; de Las Heras, J. Soil microbiological properties and enzymatic activities of long-term post-fire recovery in dry and semiarid Aleppo pine (Pinus halepensis M.) forest stands. Solid Earth 2015, 6, 243–252. [Google Scholar] [CrossRef]
  37. Lucas-Borja, M.E.; Calsamiglia, A.; Fortesa, J.; García-Comendador, J.; Lozano Guardiola, E.; García-Orenes, F.; Gago, J.; Estrany, J. Effects of abandoned terraces on soil quality in three Mediterranean micro-catchments differently affected by wildfires. Catena 2017, in press. [Google Scholar]
  38. Grimalt, M.; Blázquez, M.; Rodríguez, R. Physical factors, distribution and present land-use of terraces in the Tramuntana Range. Pirineos 1992, 139, 15–25. [Google Scholar] [CrossRef]
  39. Guijarro, J.A. Contribución a la Bioclimatología de Baleares. (Doctoral Thesis Resume Summary); Universitat de les Illes Balears: Palma, Spain, 1986; 36p. [Google Scholar]
  40. Grove, A.T.; Rackham, O. The Nature of Mediterranean Europe—An Ecological History; Yale University Press: New Haven, CT, USA, 2001; p. 384. [Google Scholar]
  41. Ministerio de Agricultura, Alimentación y Medio Ambiente (MAGRAMA). Cuarto Inventario Forestal Nacional; MAGRAMA: Madrid, Spain, 2012; p. 48.
  42. Nelson, D.W.; Sommers, L.E. Total carbon, organic carbon and organic matter. In Methods of Soil Analysis. Part 2 Chemical and Microbiological Properties; Page, A.L., Miller, R.H., Keeney, D.R., Eds.; ASA and SSSA: Madison, WI, USA, 1982; pp. 539–579. [Google Scholar]
  43. Bremmer, J.M.; Mulvaney, C.S. Nitrogen total. In Methods of Soil Analysis. Part 2 Chemical and Microbiological Properties; Page, A.L., Miller, R.H., Keeney, D.R., Eds.; American Society of Agronomy: Madison, WI, USA, 1982; pp. 595–624. [Google Scholar]
  44. Porta Casanellas, J.; López-Acevedo, M.; Rodríguez Ochoa, R. Técnicas y Experimentos en Edafología; Col·legi d’Enginyers Agrònoms de Catalunya: Capellades, Lleida, Spain, 1986; 282p. [Google Scholar]
  45. Vance, E.D.; Brookes, P.C.; Jenkinson, D.S. An extraction method for measuring soil microbial biomass C. Soil Biol. Biochem. 1987, 19, 703–707. [Google Scholar] [CrossRef]
  46. Llorente, M.; Turrión, M.B. Microbiological parameters as indicators of soil organic carbon dynamics in relation to different land use management. Eur. J. For. Res. 2010, 129, 73–81. [Google Scholar] [CrossRef]
  47. Pinzari, F.; Trinchera, A.; Benedetti, A.; Sequi, P. Use of biochemical indices in the Mediterranean environment: comparison among soils under different forest vegetation. J. Microbiol. Methods 1999, 36, 21–28. [Google Scholar] [CrossRef]
  48. García, C.; Hernández, T. Investigación y Perspectivas de la Enzimología de Suelos en España; García, C., Hernández, T., Eds.; CEBAS-CSIC: Murcia, Spain, 2000; 352p. [Google Scholar]
  49. Dumontet, S.; Mazzatura, A.; Casucci, C.; Perucci, P. Effectiveness of microbial indexes in discriminating interactive effects of tillage and crop rotations in a Vertic Ustorthens. Biol. Fertil. Soils 2001, 34, 411–416. [Google Scholar] [CrossRef]
  50. Bending, G.D.; Turner, M.K.; Rayns, F.; Marx, M.C.; Wood, M. Microbial and biochemical soil quality indicators and their potential for differentiating areas under contrasting agricultural management regimes. Soil Biol. Biochem. 2004, 36, 1785–1792. [Google Scholar] [CrossRef]
  51. Cavalli, M.; Trevisani, S.; Comiti, F.; Marchi, L. Geomorphometric assessment of spatial sediment connectivity in small Alpine catchments. Geomorphology 2013, 188, 31–41. [Google Scholar] [CrossRef]
  52. Crema, S.; Schenato, L.; Goldin, B.; Marchi, L.; Cavalli, M. Toward the development of a stand-alone application for the assessment of sediment connectivity. Rendiconti Online Società Geol. Italiana 2015, 34, 58–61. [Google Scholar] [CrossRef]
  53. Cavalli, M.; Marchi, L. Characterisation of the surface morphology of an alpine alluvial fan using airborne LiDAR. Nat. Hazards Earth Syst. Sci. 2008, 8, 323–333. [Google Scholar] [CrossRef]
  54. Tarboton, D.G. A new method for the determination of flow directions and upslope areas in grid digital elevation models. Water Resour. Res. 1997, 33, 309–319. [Google Scholar] [CrossRef]
  55. Clarke, K.R.; Gorley, R.N. PRIMER v6: User Manual/Tutorial; PRIMER-E Ltd.: Plymouth, UK, 2006. [Google Scholar]
  56. Clarke, K.R. Non parametric multivariate analyses of changes in community structure. Aust. J. Ecol. 1993, 18, 117–143. [Google Scholar] [CrossRef]
  57. Rutigliano, F.A.; D’ascoli, R.; Virzo De Santo, A. Soil microbial metabolism and nutrient status in a Mediterranean area as affected by plant cover. Soil Biol. Biochem. 2004, 36, 1719–1729. [Google Scholar] [CrossRef]
  58. Hart, S.C.; DeLuca, T.H.; Newman, G.S.; MacKenzie, M.D.; Boyle, S.I. Post-fire vegetative dynamics as drivers of microbial community structure and function in forest soils. For. Ecol. Manag. 2005, 220, 166–184. [Google Scholar] [CrossRef]
  59. Marques da Silva, J.R.; Alexandre, C. Soil carbonation processes as evidence of tillage-induced erosion. Soil Tillage Res. 2004, 78, 217–224. [Google Scholar] [CrossRef]
  60. Balaguer Siquier, J.; Caravaca, M.T.; Costa, J.H. Suelos de áreas naturales al este de Mallorca; Observatorio Medioambiental: Madrid, Spain, 2001; Volume 4, pp. 93–112. [Google Scholar]
  61. Almendros, G.; González-Vila, F.J. Wildfires, soil carbon balance and resilient organic matter in Mediterranean ecosystems. A review. Span. J. Soil Sci. 2012, 2, 8–33. [Google Scholar] [CrossRef]
  62. Guerrero, C.; Mataix-Solera, J.; Gómez, I.; García-Orenes, F.; Jordán, M.M. Microbial recolonization and chemical changes in soil heated at different temperatures. Int. J. Wildland Fire 2005, 14, 385–400. [Google Scholar] [CrossRef]
  63. Bárcenas-Moreno, G.; García-Orenes, F.; Mataix-Solera, J.; Mataix-Beneyto, J.; Baath, E. Soil microbial recolonization after a fire in a Mediterranean forest. Biol. Fertil. Soils 2011, 47, 261–272. [Google Scholar] [CrossRef]
  64. López-Poma, R.; Bautista, S. Plant regeneration functional groups modulate the response to fire of soil enzyme activities in a Mediterranean shrubland. Soil Biol. Biochem. 2014, 79, 5–13. [Google Scholar] [CrossRef]
Figure 1. (a) Location of Mallorca island; (b) Location of Sa Font de la Vila catchment and wildfires in 1994 and 2013, (c) Burned areas in sa Font de la Vila catchment and location of the microcatchments. (d) Location of the representative plots on the burned microcatchments (i.e., MC1 and MC2). (e) Location of the representative plots in the unburned microcatchment (i.e., MC3). U = Unburned; UT = Unburned with Terraces; 1W = Burned in 2013; 1WT = Burned in 2013 with Terraces; 2W = Burned in 1994 and 2013; 2WT = Burned in 1994 and 2013 with Terraces.
Forests 08 00333 g001
Figure 2. Spatial patterns of connectivity in (a) microcatchments MC1 and MC2 and (b) microcatchment MC3. (c) The collapse of dry-stone walls on abandoned terraces favours increased connectivity along preferential pathways.
Forests 08 00333 g002
Figure 3. Range and mean IC values by plots with different representative condition: U, unburned; UT, unburned and terraced; 1W, non-terraced and burned once; 1WT, Terraced and burned once; 2W, non-terraced and burned twice; 2WT, terraced and burned twice.
Forests 08 00333 g003
Figure 4. Cluster analysis. G1, unburned and non-terraced plots; G2, most of plots, burned and non-terraced; G3, most of plots, unburned and terraced; G4, burned and terraced plots.
Forests 08 00333 g004
Table 1. Main characteristics of the selected microcatchments.
MC1MC2MC3
Area (ha)1.72.22.2
Altitude range (m.a.s.l)306–398283–400281–344
Average slope gradient (%)474432
LithologyRhaetian dolomites and Lias limestones
SoilsAlfisoils
TerracesArea (%)271961
Walls (m/ha)288183407
Vegetation (prior to the wildfires)Western Mediterranean forest and scrubland. Tree strata: Quercus ilex, Pinus halepensis, Olea europaea var. Sylvestris. Scrub strata: Pistacia lentiscus, Ampelodesmus mauritanica, Chamaerops humilis, Erica multiflora, Cistus albidus, Cistus monspeliensis, Calicotome spinosa, Rhamnus alaternus, Rosmarinus officinalis, Cneorum tricoccon, Phillyrea angustifolia.
Occurrence of wildfires1994 (100%); 2013 (100%)1994 (40%); 2013 (100%)Non-affected
a.s.l: above sea level.
Table 2. Species composition, vegetation cover and morphological characteristics of plots under different representative conditions: U = Unburned; UT = Unburned with Terraces; 1W = Burned in 2013; 1WT = Burned in 2013 with Terraces; 2W = Burned in 1994 and 2013; 2WT = Burned in 1994 and 2013 with Terraces.
PLOTS (n)Main Tree SpeciesShrub and Herbaceous VegetationVegetation CoverSlopeStoniness
Composition (%)Ø
(mm, (mean))
Height
(cm, (mean))
Main Species(% (mean))(% (mean))(% (mean))
U (6)Quercus ilex L. (60%),
Pinus halepensis Mill. (25%), Olea europeae (15%)
8–250 (155)80–400 (256)Pistacia lentiscus, Genista sp, Cistus albidus30–90 (60)5–25 (19)5–25 (13)
UT (6)Quercus ilex L. (20%),
Pinus halepensis Mill. (60%), Olea europeae (20%)
8–155 (47)80–300 (216)Pistacia lentiscus, Cistus albidus, Chamaerops humilis, Erica multiflora, Ruscus aculeatus, Juniperus oxycedrus60–80 (70)14–33 (19)3–11 (6)
1W (6)Pinus halepensis Mill. (100%)8–155 (47)47–162 (89)Pistacia lentiscus, Ampelodesmus mauritanica, Chamaerops humilis, Cistus albidus, Erica multiflora, 20–50 (40)38–64 (50)20–40 (25)
1WT (6)Pinus halepensis Mill. (100%)7–23 (15)40–161 (89)Ampelodesmus mauritanica, Pistacia lentiscus, Chamaerops humilis Arisarum vulgare, Brachypodium retusum, Cistus albidus, Erica multiflora, 45–90 (50)12–25 (17)5–20 (9)
2W (6)Pinus halepensis Mill. (100%)4–25 (11)17–159 (64)Ampelodesmus mauritanica, Pistacia lentiscus, Chamaerops humilis, Cistus albidus, Erica multiflora7–35 (22)36–59 (46)40–75 (56)
2WT (6)Pinus halepensis Mill. (100%)4–24 (11)18–150 (64)Ampelodesmus mauritanica, Pistacia lentiscus, Chamaerops humilis, Arisarum vulgare, Brachypodium retusum, Cistus albidus, Erica multiflora10–80 (44)6–30 (18)5–35 (19)
Table 3. Soil quality parameters for each representative condition: U, unburned non-terraced plots; UT, unburned terraced plots; 1W, Non-terraced plots burned once; 1WT, terraced plots burned once; 2W, non-terraced plots burned twice; 2WT, terraced plots burned twice. Physical and chemical parameters: SOM, soil organic matter (%); EC, electrical conductivity (μS/cm); N, % of Nitrogen; C/N ratio; pH, % of CaCO3. Biochemical and microbiological parameters: REB, basal soil respiration (mg CO2 soil kg−1); MBC, microbial biomass C (mg C BM kg−1); UA, urease activity (μmoles PNP g−1 dry soil h−1), PHA, phosphatase activity (μmoles PNP g−1 dry soil hr−1), β-GLA, β-glucosidase activity (μmoles PNP g−1 dry soil h−1); qCO2, metabolic quotient (mg C-CO2 g−1 Cmic h−1); Qcm, mineralization coefficient (mg C-CO2 g−1 C h−1); MBC/TOC (mg Cmic g−1 Corg); SEI, Synthetic Enzyme Index; H, Shannon Index. Data followed by the same small letter are not significantly different according to the Least Significant Difference (LSD) test (p < 0.05).
UUT1W1WT2W2WTALL PLOTS
RangeMeanRangeMeanRangeMeanRangeMeanRangeMeanRangeMeanRangeMean
Physical and chemical parametersSOM6.1–15.811.6a3.3–4.73.9e6.6–12.210.2b3.9–75.6d7.9–10.18.7c5.7–8.47.3c3.3–15.17.9
EC229–435308a118–161138c187–207197b139–165151c177–329221b140–214176c118–435198
N0.3–1.020.69b0.21–0.290.24b0.31–0.610.46a0.19–0.310.24c0.37–0.460.41b0.3–0.360.34c0.19–1.020.4
C/N8.6–11.710.0c7.4–11.79.4c11.63–15.2813.0a11.2–16.613.5a11.54–12.8912.3b11.1–1412.6b7.4–16.611.8
pH7.9–8.18.0c8.1–8.38.2b8.2–8.38.3a8.2–8.38.2a8.1–8.48.3a8.2–8.38.3a7.9–8.48.2
CaCO318.6–18.618.6b33.6–33.633.6a17.1–17.117.1b23.7–23.723.7b9.3–9.39.3c20.3–20.320.3b9.3–33.620.4
Biochemical and microbiological parametersREB1.04–3.882.42a0.47–1.050.71b0.44–1.010.82b0.64–0.870.74b0.6–1.60.99b0.52–1.060.84b0.4–4.61.09
MBC403–1532893b356–707545c351–55161624a145–408247c858–14151074b63–537356c63–5516790
UA1.72–3.882.65a0.51–1.030.77b0.17–0.720.42b0.39–0.610.51b0.35–0.790.62b0.26–0.570.42b0.17–3.880.9
PHA3.05–4.013.61a1.32–1.781.50b0.89–2.731.83b1.03–1.341.16c1.13–1.631.48b1.09–1.821.42b0.89–4.011.83
β-GLA1.58–3.762.93c0.88–1.441.15b0.65–1.71.14b0.66–0.870.74b0.71–1.10.87b0.83–1.311.02b0.65–3.761.31
qCO20.021–0.0330.027a0.008–0.0240.014b0.002–0.0130.009b0.016–0.0610.034a0.007–0.0150.009b0.016–0.0830.032a0.002–0.0830.021
Qcm0.04–0.520.29a21–0.450.31a0.12–0.160.14b0.18–0.280.23b0.13–0.320.2b0.16–0.230.2b0.04–0.520.23
MBC/TOC9.1–17.512.9b14.4–29.824.2a9.1–94.427.2a4.1–17.88.4b18.3–26.921.2a1.9–12.38.2b1.9–94.417
SEI6.46–10.869.2a3.17–3.973.42b1.71–5.013.39b2.09–2.822.41b2.19–3.342.97b2.25–3.72.86b1.7–10.94.04
H1.51–1.581.55a1.47–1.571.52a1.35–1.421.37a1.44–1.541.5a1.43–1.561.48a1.38–1.481.43a1.3–1.61.48
Table 4. ANOSIM (ANalysis of SIMilarities), pairwise tests (Global R: 0.56; p < 0.001). Plot groups: G1—Group 1, unburned and non-terraced plots; G2—Group2, burned and non-terraced terraces (except 2WT2, 2WT3 and 2WT5); G3—Group 3, unburned and terraced plots (except 1WT1, 1WT2); G4—Group 4, burned and terraced plots.
GroupsR StatisticSignificance Level
G1 and G20.730.001
G1 and G30.920.001
G1 and G40.940.001
G2 and G30.440.001
G2 and G40.400.003
G3 and G40.480.001
Table 5. SIMPER (SIMilarity PERcentage) one-way analysis. Average square distances between plots for each group and the most characteristic parameters contributing to their similarity.
AverageContribution %Cum. %
G1: Average Square Distance = 13.27
MBC—Microbial biomass carbon 0.2920.0320.0
REB—Basal soil respiration2.4218.7838.8
N—Total Nitrogen (%)0.6912.2651.1
EC—Electrical conductivity307.89.7960.9
UA—Urease activity2.657.5368.4
SOM—Soil organic matter (%)11.567.2775.7
G2: Average Square Distance = 12.65
MBC—Microbial biomass carbon114715.8415.8
MBC/TOC ratio20.9115.7131.6
qCO2—Metabolic quotient0.01611.8143.4
ICMEAN—Mean IC values−3.6811.6755.0
ICMAX—Maximum IC values−3.187.2662.3
H—Shannon Index1.426.5268.8
G3: Average Square Distance = 8.46
ICMEAN—Mean IC values−3.6017.1617.16
ICMAX—Maximum IC values−2.9316.4433.6
ICMIN—Minimum IC values−4.3713.5547.15
C/N—Carbon-Nitrogen rate10.0910.3257.47
ICRANGE—Range IC values1.448.8466.31
Qcm—Mineralization coefficient 0.307.9274.23
G4: Average Square Distance = 4.39
C/N—Carbon-Nitrogen rate13.4323.9123.91
qCO2—Metabolic quotient0.03416.7840.69
ICRANGE—Range IC values2.1013.3654.05
ICMIN—Minimum IC values−4.769.9163.96
H—Shannon Index1.497.4171.37
ICMAX—Maximum IC values−2.667.0678.43
Table 6. SIMPER pairwise analysis. Average square distances between groups and parameters showing the most significant differences.
G1 and G2: Average Square Distance = 68.17Average G1Average G2Contribution %Cum. %
UA—Urease activity2.650.5010.010.0
SEI—Synthetic Enzyme Index9.203.159.219.2
β-GLA—β-Glucosidase activity2.931.029.128.3
pH8.008.288.837.1
REB—Basal soil respiration2.420.898.745.7
PHA—Phosphatase activity3.611.647.753.5
G1 and G3: Average Square Distance = 73.59Average G1Average G3Contribution %Cum. %
N—Total Nitrogen (%)0.690.2410.110.1
EC—Electrical conductivity307.83139.639.719.7
REB—Basal soil respiration2.420.709.329.0
SOM—Soil organic matter (%)11.564.069.238.2
SEI—Synthetic Enzyme Index9.203.188.446.5
β-GLA—β-Glucosidase activity2.931.048.354.8
G2 and G3: Average Square Distance = 35.44Average G2Average G3Contribution %Cum. %
CaCO3—Calcium carbonate content (%)14.6331.1515.915.9
SOM—Soil organic matter (%)8.974.068.324.2
ICMEAN—Mean IC values−3.68−3.607.731.8
Qcm—Mineralization coefficient0.170.307.539.4
C/N—Carbon-Nitrogen rate12.6710.097.446.8
H—Shannon Index1.421.517.153.9
G1 and G4: Average Square Distance = 77.15Average G1Average G4Contribution %Cum. %
PHA—Phosphatase activity3.611.189.79.7
SEI—Synthetic Enzyme Index9.202.519.719.4
β-GLA—β-Glucosidase activity2.930.869.128.5
UA—Urease activity2.650.479.037.5
REB—Basal soil respiration2.420.828.045.5
N—Total Nitrogen (%)0.690.307.853.2
G2 and G4: Average Square Distance = 29.31Average G2Average G4Contribution %Cum. %
ICRANGE—Range IC values0.962.1014.014.0
REB—Basal soil respiration0.0160.03411.525.5
ICMAX—Maximum IC values−3.18−2.669.935.3
MBC—Microbial biomass carbon1146.79273.199.745.0
MBC/TOC ratio20.916.909.354.4
ICMIN—Minimum IC values−4.14−4.769.063.3
G3 and G4: Average Square Distance = 22.30Average G3Average G4Contribution %Cum. %
C/N—Carbon-Nitrogen rate10.0913.4319.619.6
ICRANGE—Range IC values1.442.1010.229.8
qCO2—Metabolic quotient0.0150.0349.539.4
ICMIN—Minimum IC values−4.37−4.769.048.3
ICMAX—Maximum IC values−2.93−2.668.757.1
CaCO3—Calcium carbonate content (%)31.1522.248.265.2

