Recent Patterns in Climate, Vegetation, and Forest Water Use in California Montane Watersheds


1
Sierra Nevada Research Institute, University of California, Merced, Merced, CA 95343, USA
2
Swenson College of Science and Engineering, University of Minnesota Duluth, Duluth, MN 55812, USA
3
USFS Pacific Southwest Research Station, Davis, CA 95618, USA
*
Author to whom correspondence should be addressed.
Forests 2017, 8(8), 278; https://doi.org/10.3390/f8080278
Submission received: 12 May 2017
/
Revised: 30 June 2017
/
Accepted: 29 July 2017
/
Published: 1 August 2017
(This article belongs to the Special Issue New Insights into Climate Sensitivity of Forest Growth, Health, and Disturbance: Vulnerability, Resilience, and Change)
Abstract
:California has recently experienced one of the worst droughts on record, negatively impacting forest ecosystems across the state. As a major source of the region’s water supply, it is important to evaluate the vegetation and water balance response of these montane forested watersheds to climate variability across the range of rain- to snow-dominated precipitation regimes. The Standardized Precipitation Index (SPI) and the Standardized Runoff Index (SRI) were used to capture the hydrologic drought signal, and MODIS vegetation indices (i.e., the normalized difference vegetation index and the enhanced vegetation index) were used to evaluate the vegetation and evapotranspiration response in three headwater catchments. The study catchments comprised a low elevation rain-dominated site (Caspar Creek) on the northern California coast, a mid-elevation site with a mix of rain and snow (Providence Creek) in the California Sierra Nevada, and a high elevation snow-dominated site (Bull Creek) in the Sierra Nevada. Lowest SPI values occurred in the third drought year of 2014 for all sites. Lowest SRI was in 2014 for Caspar, but in 2015 for Providence and Bull, reflecting differences in snowpack-delayed runoff and subsurface storage capacity between the lower and higher elevation watersheds. The most accurate water balance closure using evapotranspiration estimates from vegetation indices was within 10% of measured precipitation at snow-dominated Bull. The rain-dominated Caspar watershed had the highest vegetation index values and annual evapotranspiration, with the lowest variability over the previous 13 years (2004–2016). Vegetation index values and annual evapotranspiration decreased with increasing elevation and snow contribution to precipitation. Both snow-influenced Sierra Nevada watersheds showed elevated vegetation and evapotranspiration responses to interannual climate variability. There remains a need for institutional support to expand long-term observations in remote forested mountain watersheds to monitor and research these changing and extreme environmental conditions in source watershed regions.
1. Introduction
Forested watersheds in California are facing unprecedented climate extremes, which can increase the risk of invasive pests, tree mortality, and high-severity wildfire. As per the recent estimates, there were 102 million trees that died in the Sierra Nevada during 2010–2016 [1]. These forested regions are a major source of water for ecosystem, hydropower, irrigation, and municipal uses [2]. Changes in the timing and magnitude of runoff under climate change pose significant risks to ecosystems, infrastructure, and the overall availability of water for human use. California has recently been under one of the most severe droughts on record [3], further amplifying the challenge of managing forests for water supply. With source watersheds playing such a critical role in the regulation and supply of water resources, it is important to evaluate the vegetation and water balance response of California forested montane watersheds to the recent climate variability across the transition from rain-dominated to snow-dominated precipitation regimes.
Climate extremes are expected to continue and intensify in the future, with drier conditions than have prevailed in recent history [4]. The combined effects of declining precipitation, increasing temperature, more winter precipitation falling as rain than snow, and a reduced snowpack will alter the historical timing of water availability and storage. It is estimated that increasing temperature alone by the end of 21st century could intensify evapotranspiration rates by 28% and decrease runoff by 26% [5]. It remains uncertain, however, as to how the delicate equilibrium between water yield from forested lands and consumption by forest vegetation will change in response to altered temperature and precipitation variability. Because forests face the widespread threat of drought, including predictions that climate change will lead to chronic drought-related stress, water management on forest lands for ecosystem health and resiliency is needed [6].
Research on forested experimental watersheds has established that reducing forest cover increases water yield and that afforestation decreases water yield [7,8,9]. Despite this, data suggest that relying on forest thinning or harvesting may not be a viable strategy for augmenting runoff and that management strategies might vary depending on the amount and type (e.g., rain vs. snow) of precipitation received [10,11]. Studies on forest vegetation changes due to external influences such as bark beetle infestation [12,13] have shown that tree mortality may (e.g., [14,15]) or may not (e.g., [16,17]) have impacts on evapotranspiration, groundwater, and stream runoff. Discrepancies between experimental results and management strategies imply that there is a need to move beyond measuring the effects of forest treatments on water yield alone, and to instead focus on the feedback between forest vegetation, land management, water partitioning, and climate. By coupling our understanding of how vegetation and climate affect underlying hydrologic processes, we can better predict how different forest management approaches will affect forest evapotranspiration and runoff under a range of climatic conditions.
In the Sierra Nevada, precipitation is generally dominated by rainfall at elevations <500 m, rain transitions to snow as elevation increases from 500 m to 2500 m, and snowfall is dominant at elevations >2500 m [18]. Annual variability in temperature and precipitation affect the size and persistence of the winter snowpack, and ultimately impact the amount of subsurface water storage available for use by vegetation in subsequent years [19]. Fellows and Goulden [20] show that the mid-elevation montane region of California has high subsurface recharge and storage capacity, evidenced by the high volume of evapotranspiration that persists through the dry summer season. Evapotranspiration at higher elevation regions may be limited by colder temperatures and lower subsurface storage, while evapotranspiration at lower elevations may be limited by lower precipitation and a longer dry season [19,20,21]. In the northern California coastal region, summer fog may contribute to montane forest precipitation, but it also limits evapotranspiration [22].
Effects of vegetation disturbances such as forest treatments, water stress, or mortality can be monitored using satellite-based remote sensing vegetation indices. Indices of spectral reflectance, such as the Enhanced Vegetation Index (EVI) and the Normalized Difference Vegetation Index (NDVI), have been developed to monitor vegetation health [23], productivity, and land-use change. EVI has been used to estimate evapotranspiration in western U.S. riparian zones [24], and has been combined with other satellite-based surface characteristics to calculate vegetation rooting depth in California [25]. NDVI has been correlated to snowpack depth in the Sierra Nevada [26], used to evaluate ecosystem functioning [27], and used for monitoring drought effects [28,29,30]. Goulden and Bales [5] used NDVI to extend point scale evapotranspiration measurements using eddy covariance flux towers to the 11 major western Sierra Nevada watersheds, and NDVI has been successfully coupled with estimates of potential evapotranspiration to feed a distributed hydrologic model [31]. Spectral indices for detecting vegetation change can be combined with evapotranspiration estimates for catchment-scale modeling of water balance response in forested watersheds.
The objectives of this study are to use three headwater catchments (a low elevation rain-dominated, a mid elevation mixed rain and snow, and a high elevation snow-dominated watershed) in California to: (i) characterize the coupling between climate, vegetation, and runoff across the rain-snow precipitation gradient; and (ii) quantify the impact of recent changes in vegetation on evapotranspiration and the overall water balance.
2. Methods
2.1. Study Sites
Our research catchments are located in the headwaters of Caspar Creek, Providence Creek, and Bull Creek (Figure 1). Caspar Creek is in the Jackson Demonstration State Forest on the northern coast of California, while Providence and Bull Creeks are in the southern Sierra Nevada as part of the Kings River Experimental Watersheds (KREW). Caspar Creek is dominated by second-growth coniferous forests, predominantly coast redwood (Sequoia sempervirens (D. Don) Endl.) and Douglas-fir (Pseudotsuga menziesii (Mirb.) Franco) [32]. Geologic features underlying Caspar Creek include marine sandstone and shale, with moderately well-drained to well-drained loam to gravelly loam soils. Providence Creek has granitic geologic features with well-drained to excessively drained sandy loam to gravelly coarse sandy loam soils. Sierran mixed-conifer forest dominates these catchments, which include white fir (Abies concolor (Gord. & Glend.) Lindl. ex Hildebr), ponderosa pine (Pinus ponderosa Dougl. ex Laws.), Jeffrey pine (Pinus jeffreyi Grev. & Balf.), black oak (Quercus kelloggii Lam.), sugar pine (Pinus lambertiana Dougl.), and incense cedar (Calocedrus decurrens Torr.) [33]. Bull Creek also has granitic geology, with well drained to somewhat excessively drained coarse sandy loam to gravelly coarse sandy loam soils. Conifer forest in Bull Creek consists of California red fir (Abies magnifica A. Murr.) and Sierran mixed-conifer.
All of the catchments have a Mediterranean climate, with a short precipitation period during the cool winters and a longer dry season lasting through the warm summers. Years in this study refer to water years; for example, water year 2004 covers the period from 1 October 2003 to 30 September 2004. Mean temperatures are similar across the sites, but temperature extremes are more moderate in Caspar because of the coastal influence, where both Providence and Bull are colder in the winter and hotter in the summer (Table 1). Precipitation is exclusively rain in Caspar [32]; it transitions from rain- to snow-dominated precipitation in Providence [19], and is snow-dominated in Bull [19]. Because of the shifting precipitation from rain to snow, peak runoff period ranges from the wet winter months in Caspar to the spring snowmelt period in Bull. Runoff has been measured using in-stream weirs or flumes in the following sub-watersheds: North Fork (NFC, area = 473 ha, mean elevation = 200 m) and South Fork (SFC, 424 ha, 180 m) of Caspar Creek; P301 (99 ha, 1950 m), P303 (132 ha, 1880 m), and P304 (49 ha, 1870 m) in Providence Creek; B201 (53 ha, 2265 m) and B203 (138 ha, 2340 m) in Bull Creek (Figure 1). Additional details and descriptions of individual sub-watersheds have been documented in previous studies of Caspar Creek [22,32] and Providence/Bull Creeks [19,34]. Stream runoff was normalized over the area of each site and combined to provide one measure of runoff for each headwater region.
2.2. Climate Indices
The Standardized Precipitation Index (SPI, [35,36]) is a transformation of the precipitation probability, which improves representation of wet and dry periods over the Palmer Drought Severity Index (PDSI, [37]) and is informative for water supply management when calculated over long time periods [38]. The SPI and Standardized Runoff Index (SRI, [39]), a transform of the runoff probability, were developed for the Caspar Creek, Providence Creek, and Bull Creek sites. The 12-month SPI was calculated using monthly precipitation records from the McGuires meteorological station for Caspar Creek (181 m elevation, 2003–2016; USDA State & Private Forestry), Upper Providence station (1984 m, 2003–2016; [19,34]), and Upper Bull station (2461 m, 2004–2016; [19,34]). A 12-month SPI uses a trailing moving average of precipitation for every month of the preceding 12 months to produce a normalized distribution of all monthly values over the available time series of data. Climate records were extended back to 1980 using a linear correlation of monthly DAYMET [40] precipitation data (R2 = 0.90–0.93), and assessed using the SPI categories defined by McKee et al. [35]; wet periods were classified as mild (SPI = 0.00–0.99), moderate (SPI = 1.00–1.49), severe (SPI = 1.50–1.99), or extreme (SPI ≥ 2.00). Dry periods were classified in the same way using the same ranges with negative SPI values (Table 2). The 12-month SRI was calculated from the mean monthly area-normalized stream runoff measured at the sub-watershed outlets and combined by study site because the individual sub-watershed runoff indices were not discernibly different from one another. The 12-month time scale of SPI and SRI were used because the correlation between the 12-month indices can be compared to the correlation between annual precipitation and runoff [39].
2.3. Vegetation Indices
The MODIS NDVI (Equation (1) and EVI Equation (2)) are spectral reflectance calculations of a difference ratio between absorbed red visible spectrum and reflected near-infrared spectrum:
where NIR is near-infrared, R is the red reflectance value, B is the blue reflectance value, G is a scaling factor, L is the canopy background adjustment, and C1 and C2 are aerosol resistance term coefficients [41]. The additional terms for calculating EVI are incorporated to account for atmospheric aerosol scattering and the influence of soil-brightness. MODIS 16-day vegetation index products (MYD13Q1 v5) at 250 m resolution were acquired from the online Data Pool for water years 2004–2016, courtesy of the NASA Land Processes Distributed Active Archive Center (LPDAAC, http://lpdaac.usgs.gov/), and extracted for each watershed. Vegetation index and evapotranspiration responses were assessed by study site instead of individual sub-watersheds in order to be at a landscape scale most relevant to the resolution of available MODIS data.
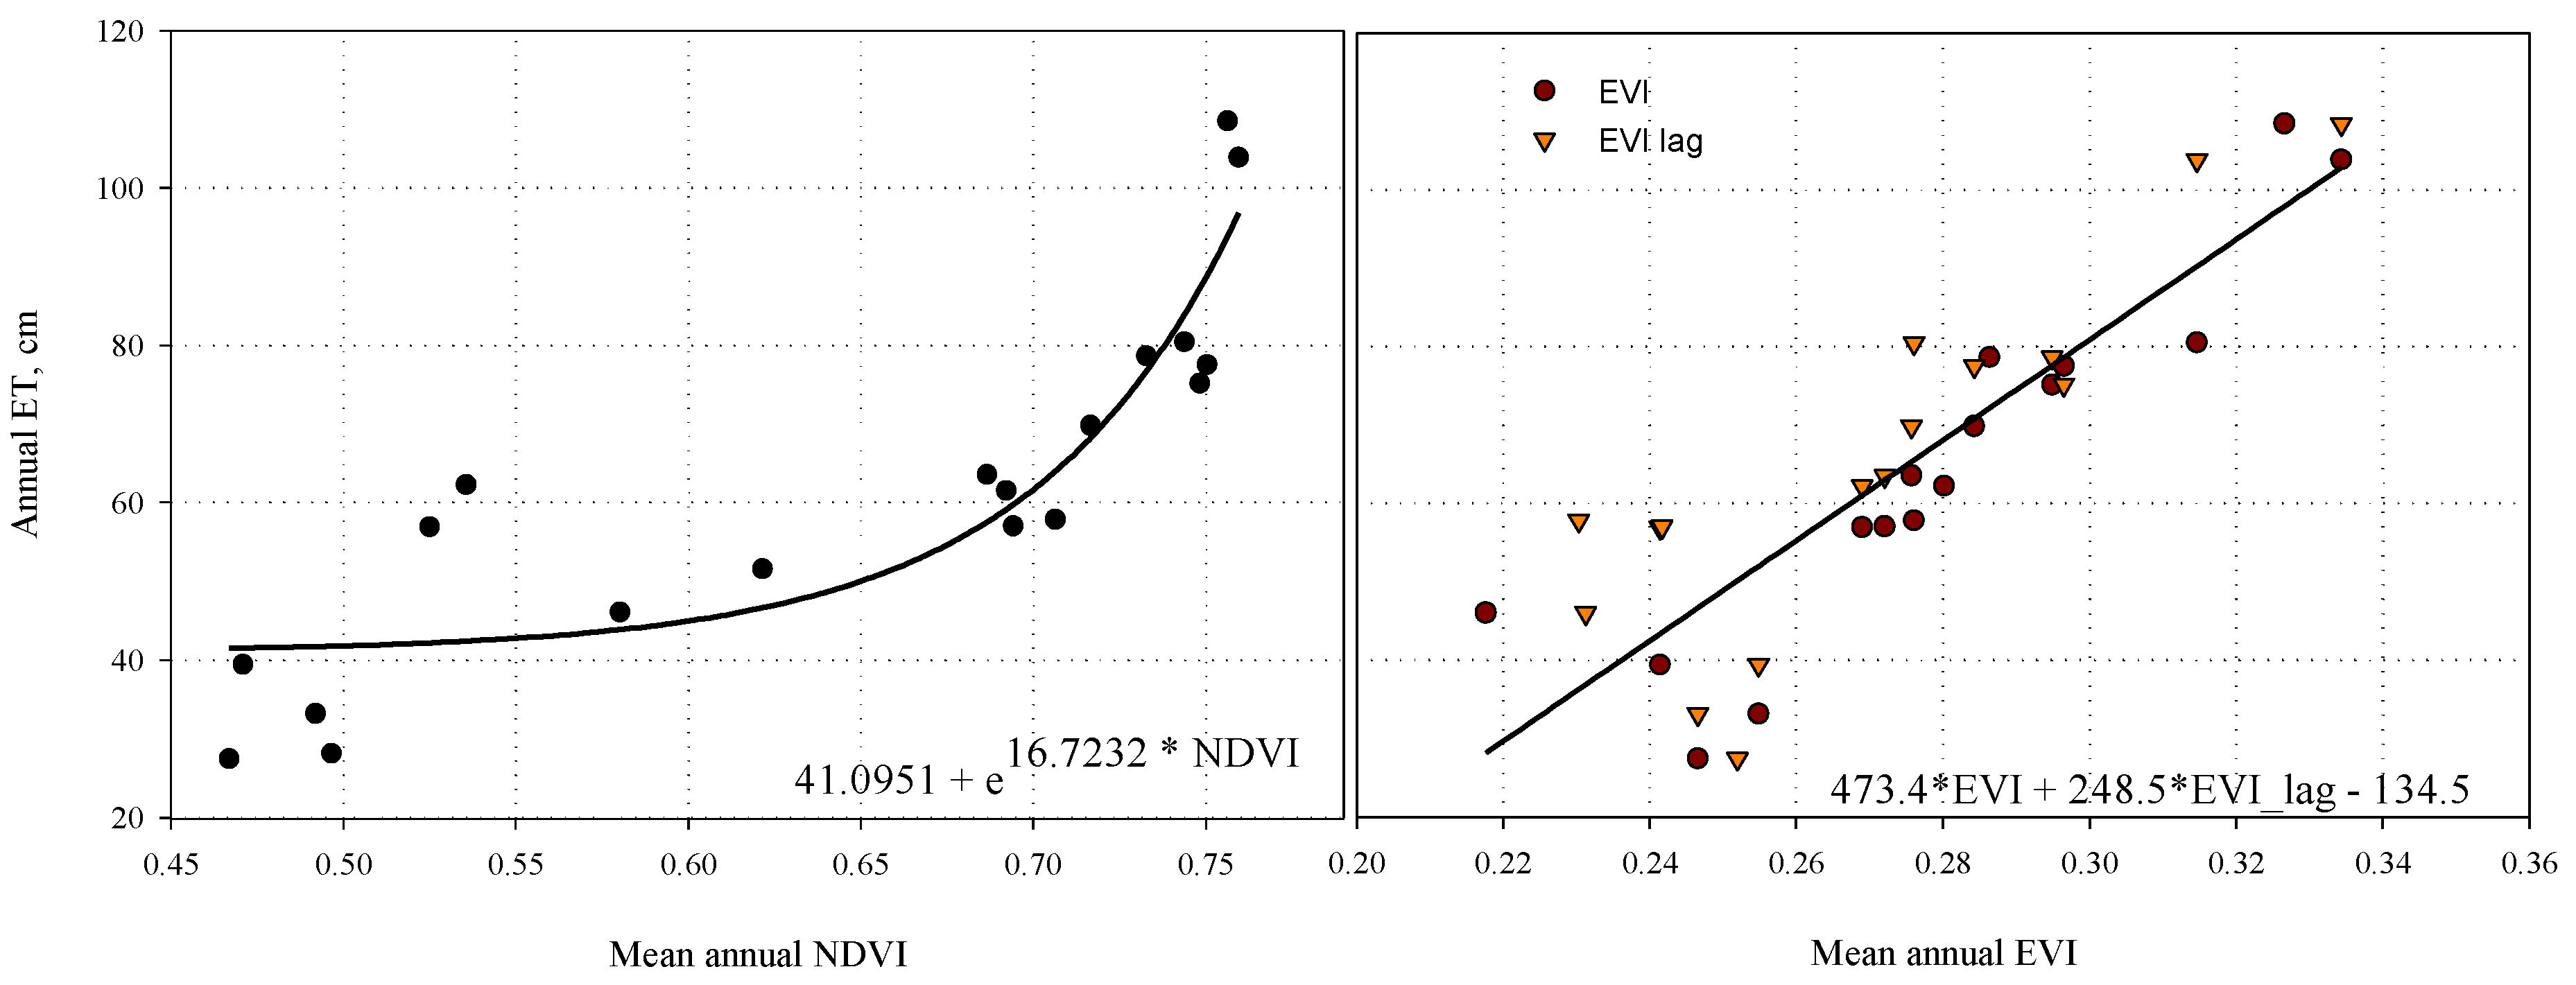
Annual estimates of actual ET were calculated for each location using the relationship between measured ET from four Sierra Nevada-specific eddy covariance flux towers and mean annual NDVI and EVI, following the approach of Goulden et al. [21]. Eddy covariance data are available for 2009–2015, and use the four Sierra Climate Gradient sites of Oak/Pine Woodland (405 m elevation), Ponderosa Pine Forest (1160 m), Sierran Mixed Conifer Forest (2015 m), and Subalpine forest (2700 m). The mean annual value of NDVI and EVI was calculated using the average values of all high-quality MODIS pixels (highest pixel reliability = 0) over each water year at each tower, and used to develop the predictive relationships (Figure 2). Multiple linear regressions were also tested by adding a one-year lag term, which was the mean vegetation index of the following year. Precipitation amount in a given year can influence the subsurface water storage capacity and vegetation water use in the following year, so adding the lag term could account for some of the variability in subsurface water storage. This model was successful in providing a better predictive equation with EVI, as determined by the lowest Akaike Information Criterion (AIC, [42]) value, and resulted in a higher coefficient of determination. A single-term exponential model provided the best fit for NDVI. Using the lag term in the EVI equation restricts the most recent annual evapotranspiration estimate and the evaluation of the water balance closure to water year 2015. The fitted equations were then used to estimate annual ET by using the catchment-scale mean annual vegetation index at each of the study locations. The relative accuracy of using the localized relationships to calculate annual ET was then compared to the equation in Goulden et al. [21], which was developed using flux tower data from many different vegetation communities across southern California.
3. Results
3.1. Climate
The 12-month SPI (1980–2016) resulted in similar patterns of wet and dry periods for the rain-dominated Caspar, mixed rain and snow Providence, and snow-dominated Bull meteorological stations (Figure 3). The 12-month SRI (2004–2016) calculated for the Caspar, Providence, and Bull sites, shows the difference in timing of precipitation and runoff in Caspar compared to KREW. The delay between precipitation and snowmelt in the Sierra results in the offset between SRI and SPI, and a smoothed SRI signal. The standardized precipitation and runoff indices were moderately to highly correlated (R2: Caspar = 0.79, Providence = 0.53, Bull = 0.53). A high correlation occurs when annual precipitation and runoff also have high coefficients of determination (R2: Caspar = 0.87, Providence = 0.95, Bull = 0.97) [39].
Using the SPI categories defined by McKee et al. [35] to characterize wet and dry periods, Caspar was in a wet period 50% of the time, while Providence (46%) and Bull (45%) were in less wet periods over the past 36 years. Mild conditions persisted 69% of the time in Caspar, 67% in Providence, and 65% in Bull. Of the moderate to extreme classifications, Caspar had more dry periods (18%) than wet (13%), where Providence exhibited less dry (14%) than wet periods (19%). Bull also had fewer dry periods (16%) than wet periods (19%). SPI values near positive two, indicating wet periods, occurred in 1983, 1997–1999, 2007, and 2011 (Providence, Bull). SPI values near negative two, indicating dry periods, have occurred in 1982 (Caspar), 1992, 2009 (Caspar), and 2014. The wettest period in the last 35 years was in 1983 for Providence and Bull, with Caspar being wettest in both 1983 and 1998. All sites were the driest in 2014, with index values from −3 to −3.4, exceeding any dry periods in the previous 30 years by a minimum index value of 1.0.
3.2. Vegetation and Evapotranspiration
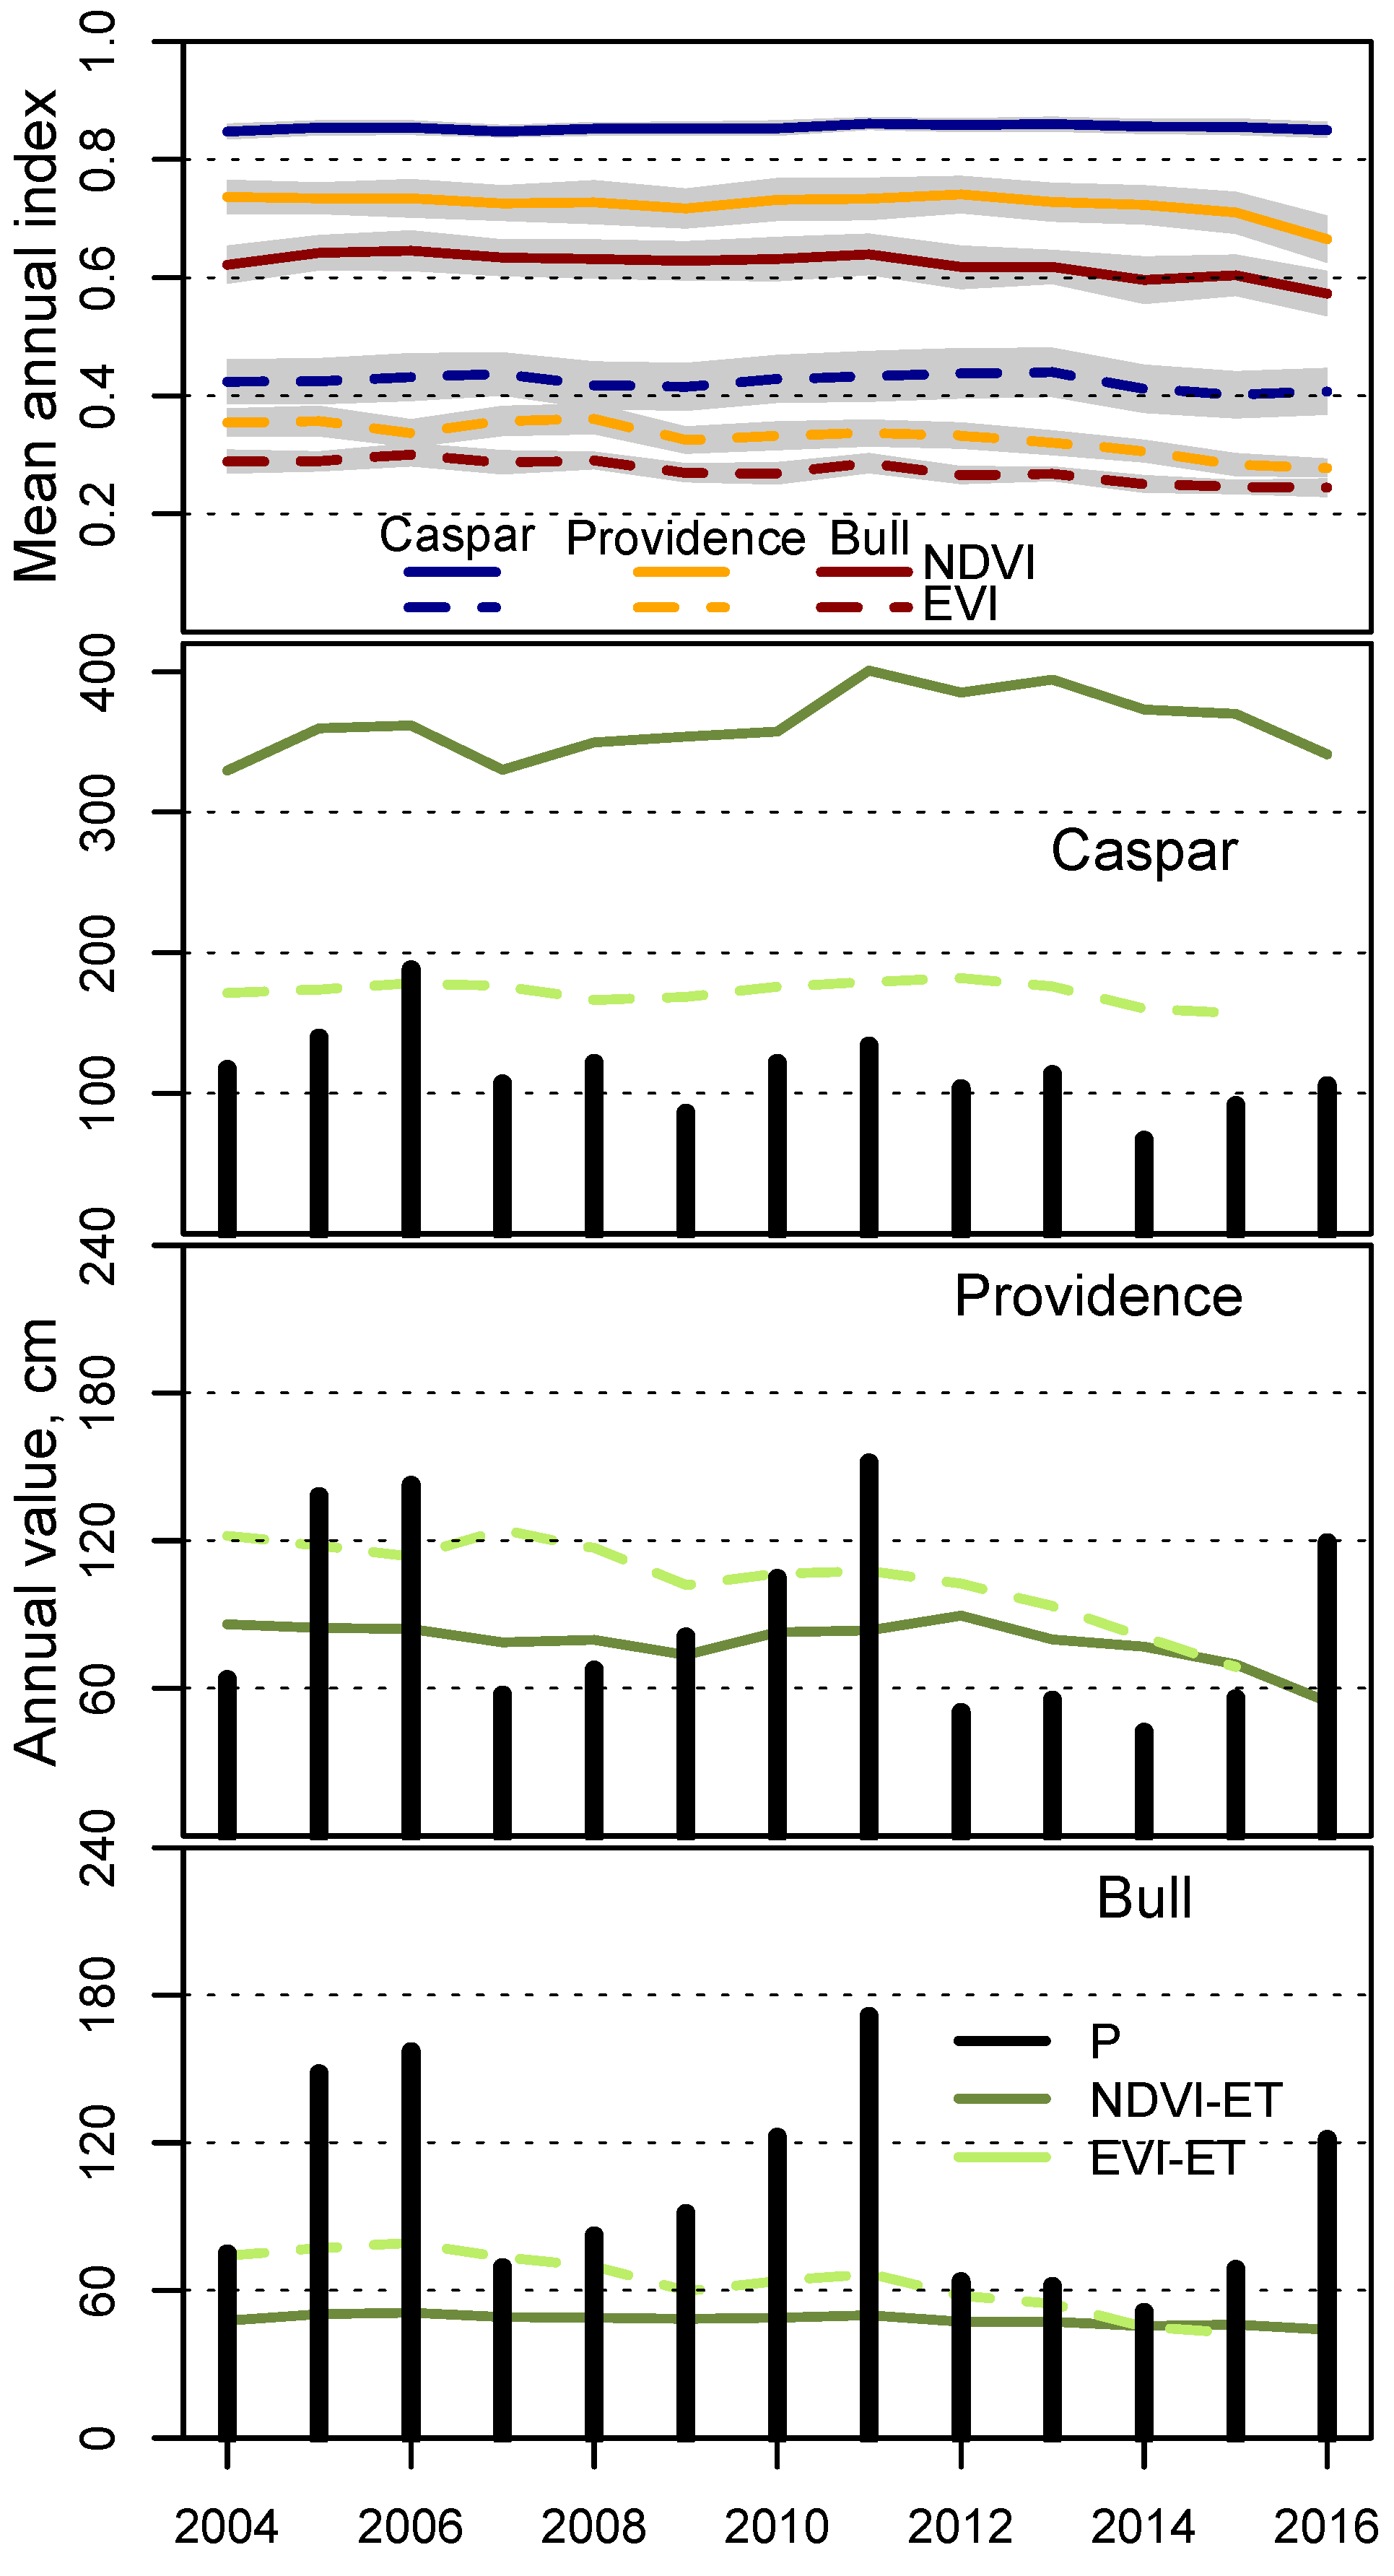
Mean annual NDVI and EVI (2004–2016) were extracted from each study catchment and used with the developed predictive equations to calculate annual estimates of actual ET for each site (Figure 4). NDVI decreased with increasing elevation, having values between 0.84 and 0.87 in Caspar, 0.67 and 0.75 in Providence, and between 0.57 and 0.65 in Bull. EVI values also decreased with increasing elevation, ranging from 0.40 to 0.44 in the coastal rain-dominated Caspar watershed, 0.28 to 0.37 in the mixed rain and snow Providence watershed, and 0.24 to 0.31 in snow-dominated Bull. NDVI significantly decreased over the study period for Providence (p < 0.05) and Bull (p < 0.01), but not for Caspar. Similarly, EVI significantly decreased for only the snow-influenced watersheds of Providence (p < 0.001) and Bull (p < 0.001). Mean NDVI values (±standard deviation) for 2004–2016 increased progressively from Bull (0.623 ± 0.020) to Providence (0.725 ± 0.019) to Caspar (0.854 ± 0.004). Mean EVI values (±standard deviation) also increased from Bull (0.275 ± 0.019) to Providence (0.332 ± 0.028) to Caspar (0.422 ± 0.013). Mean annual NDVI shows the greatest annual decrease in 2016 for Caspar (−1%), Providence (−6%), and Bull (−5%). Mean annual EVI shows the greatest annual decrease in the lowest precipitation year of 2014 for Caspar (−6%) and Bull (−6%), but a year later in 2015 for Providence (−7%).
Differences in the mean annual vegetation index result in a substantial separation in predictive estimates of actual evapotranspiration at each site from over the 2004–2015 period. Annual precipitation in Caspar was 66–188 cm, runoff was 19–148 cm year−1, annual NDVI-ET was 329–401 cm, and annual EVI-ET was 157–182 cm. In Providence, precipitation was 42–152 cm year−1, runoff was 2–91 cm year−1, NDVI-ET was 69–90 cm year−1, and EVI-ET was 68–105 cm year−1. Precipitation in Bull was 51–172 cm year−1, runoff was 7–125 cm year−1, NDVI-ET was 45–51 cm year−1, and EVI-ET was 42–80 cm year−1. Annual variability in precipitation (Coefficient of Variation = 0.26–0.44) and runoff (C.V. = 0.59–1.01) was substantially higher in all of the sites than evapotranspiration (C.V. = 0.03–0.19).
3.3. Water Balance
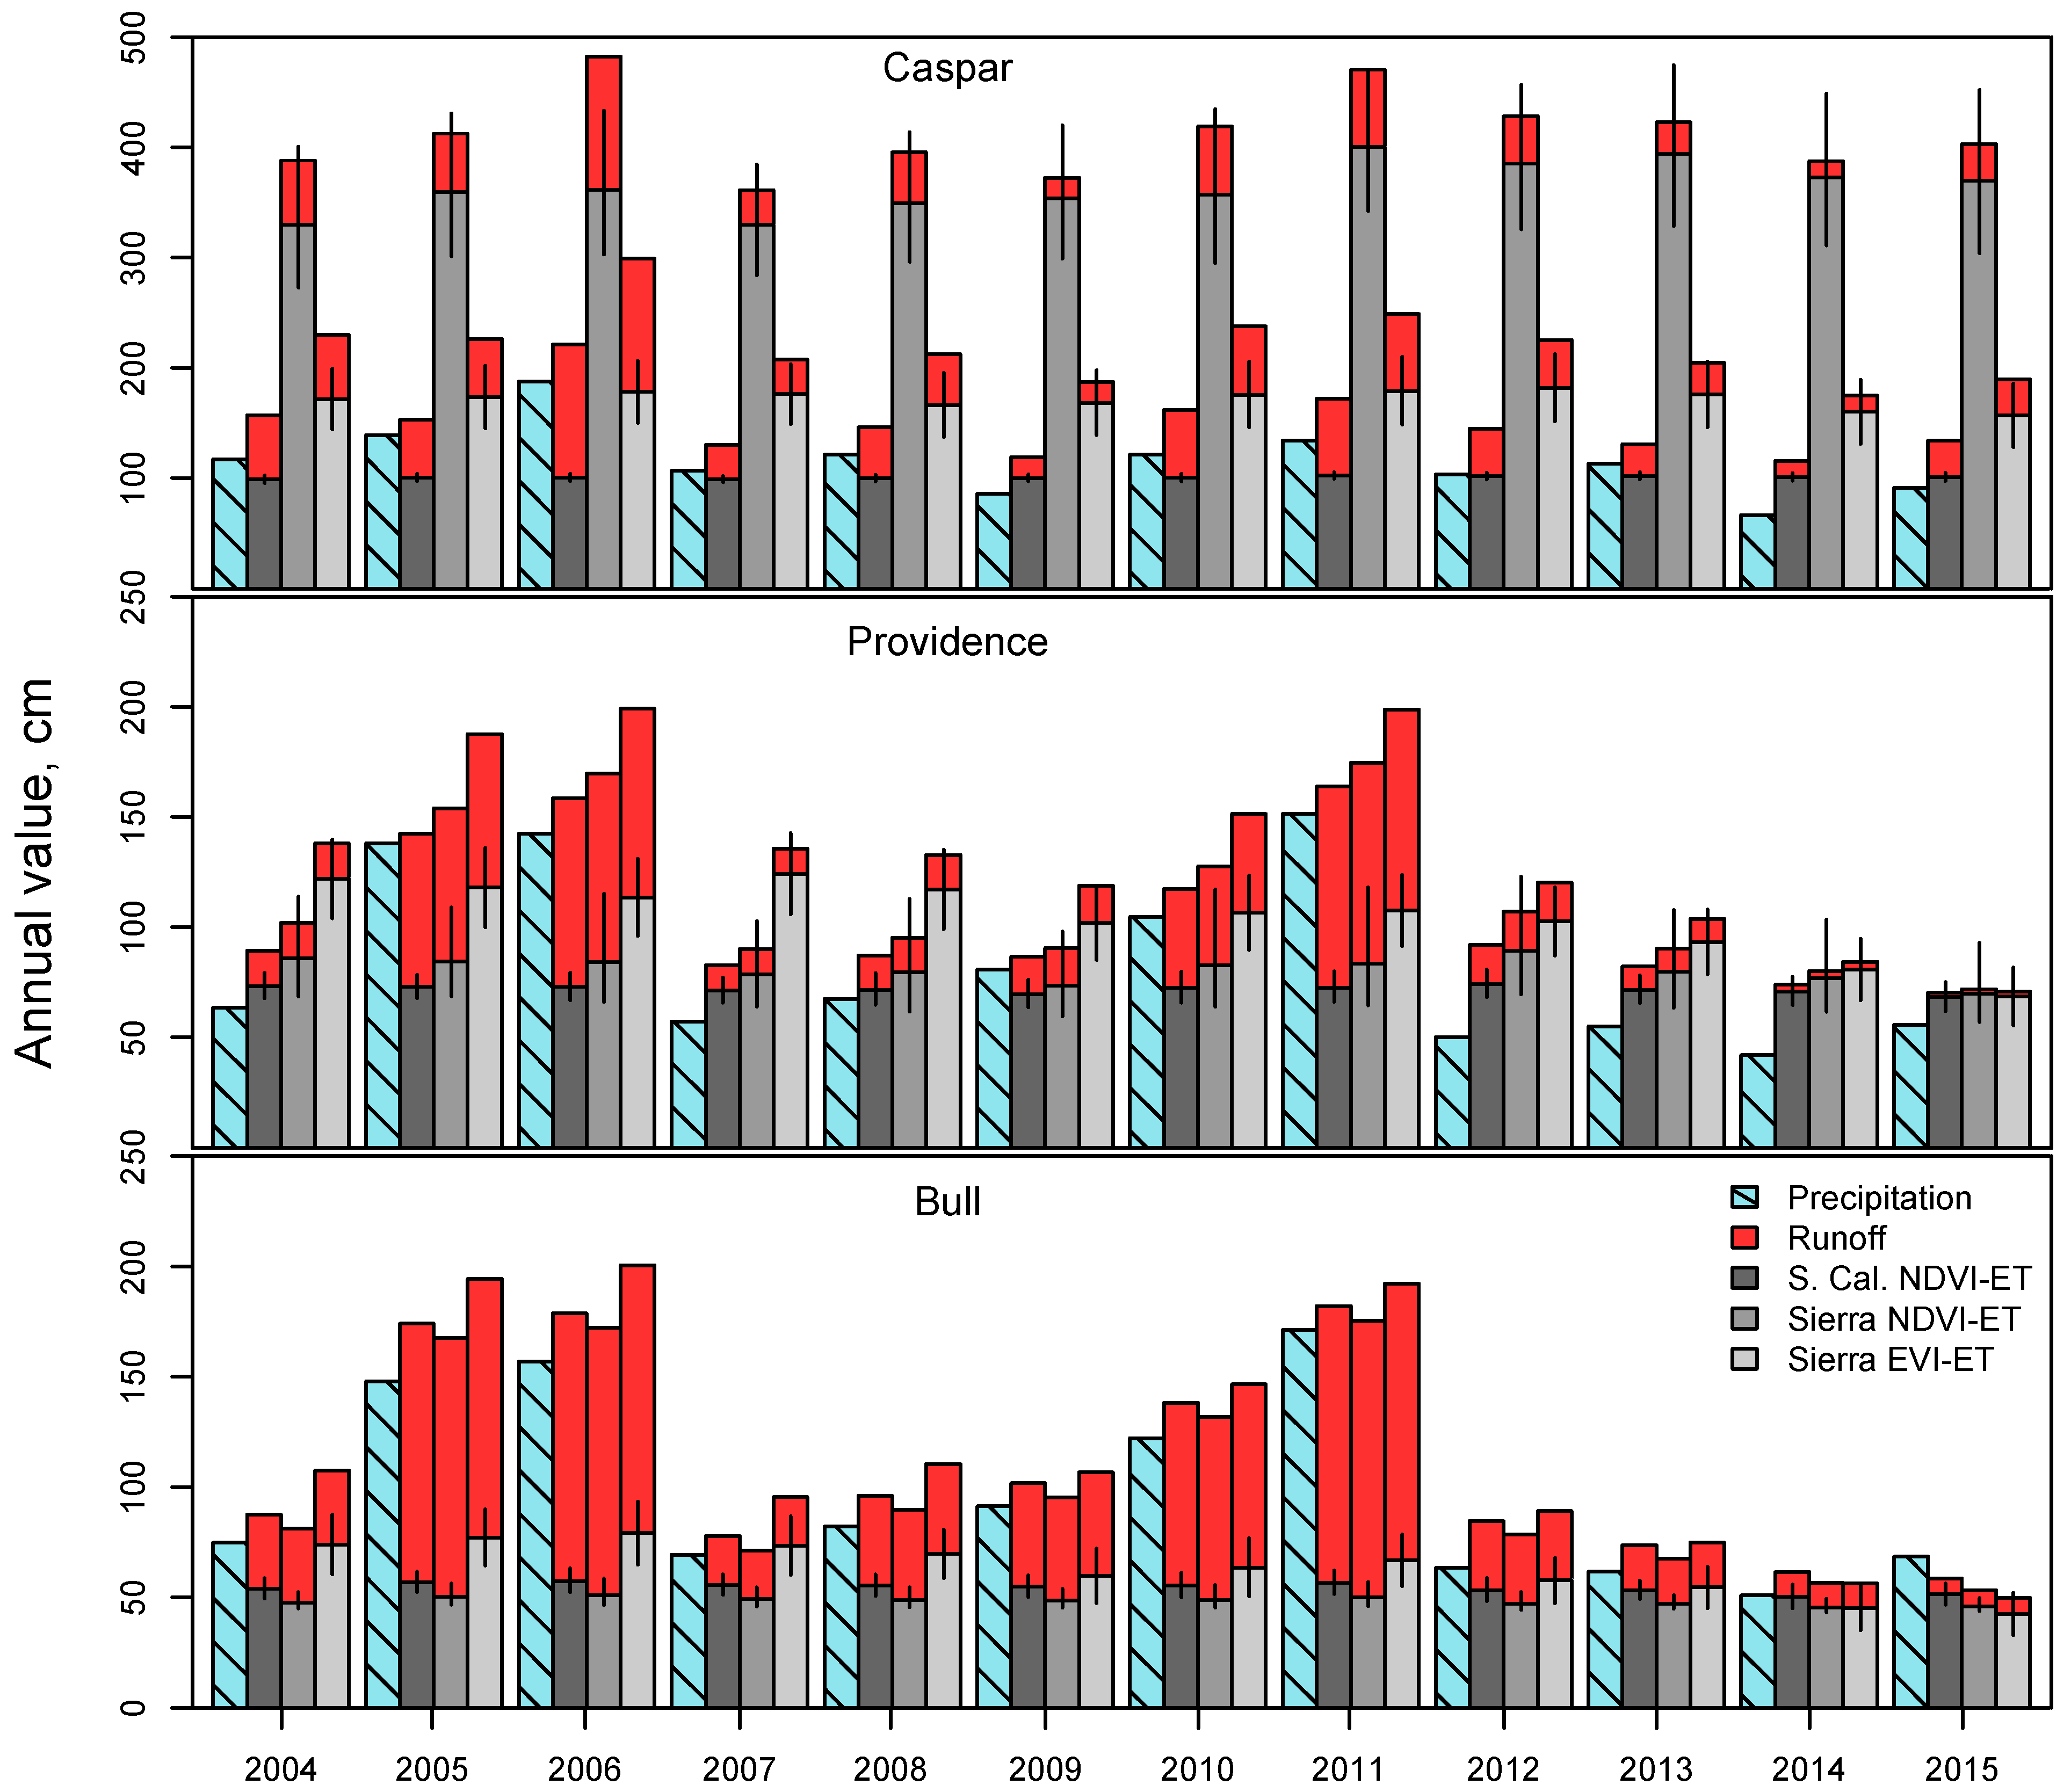
Annual water balance closure at each of the sites was evaluated by comparing measured precipitation (P) to the sum of measured runoff (Q) and ET estimates. Evapotranspiration estimates were from the predictive equations limited to the Sierra Nevada sites (Sierra NDVI-ET, Sierra EVI-ET), and from Goulden et al. [21], which used multiple vegetation community types across southern California (S. Cal. NDVI-ET, Figure 5). The sum of ET + Q was higher than measured precipitation in all years for all sites, except the latest drought year of 2015 in Bull. The southern California NDVI equation produced the best agreement in rain-dominated Caspar (Mean Average Error (MAE) = 33.3 cm) and mixed rain/snow Providence (MAE = 19.8 cm), but ranked second in snow-dominated Bull (MAE = 14.6 cm). The Sierra NDVI equation resulted in the lowest agreement in Caspar (MAE = 296.3 cm), was ranked second in Providence (MAE = 28.7 cm), and produced the best agreement in Bull (MAE = 9.2 cm). The Sierra EVI equation ranked second in Caspar (MAE = 104.7 cm), but ranked last in Providence (MAE = 52.7 cm) and Bull (MAE = 25.1 cm). Overall, the predictive equations had a minimum error in Bull, a marginally higher average error in Providence, and a maximum error in Caspar, and resulted in an overestimation of the water balance.
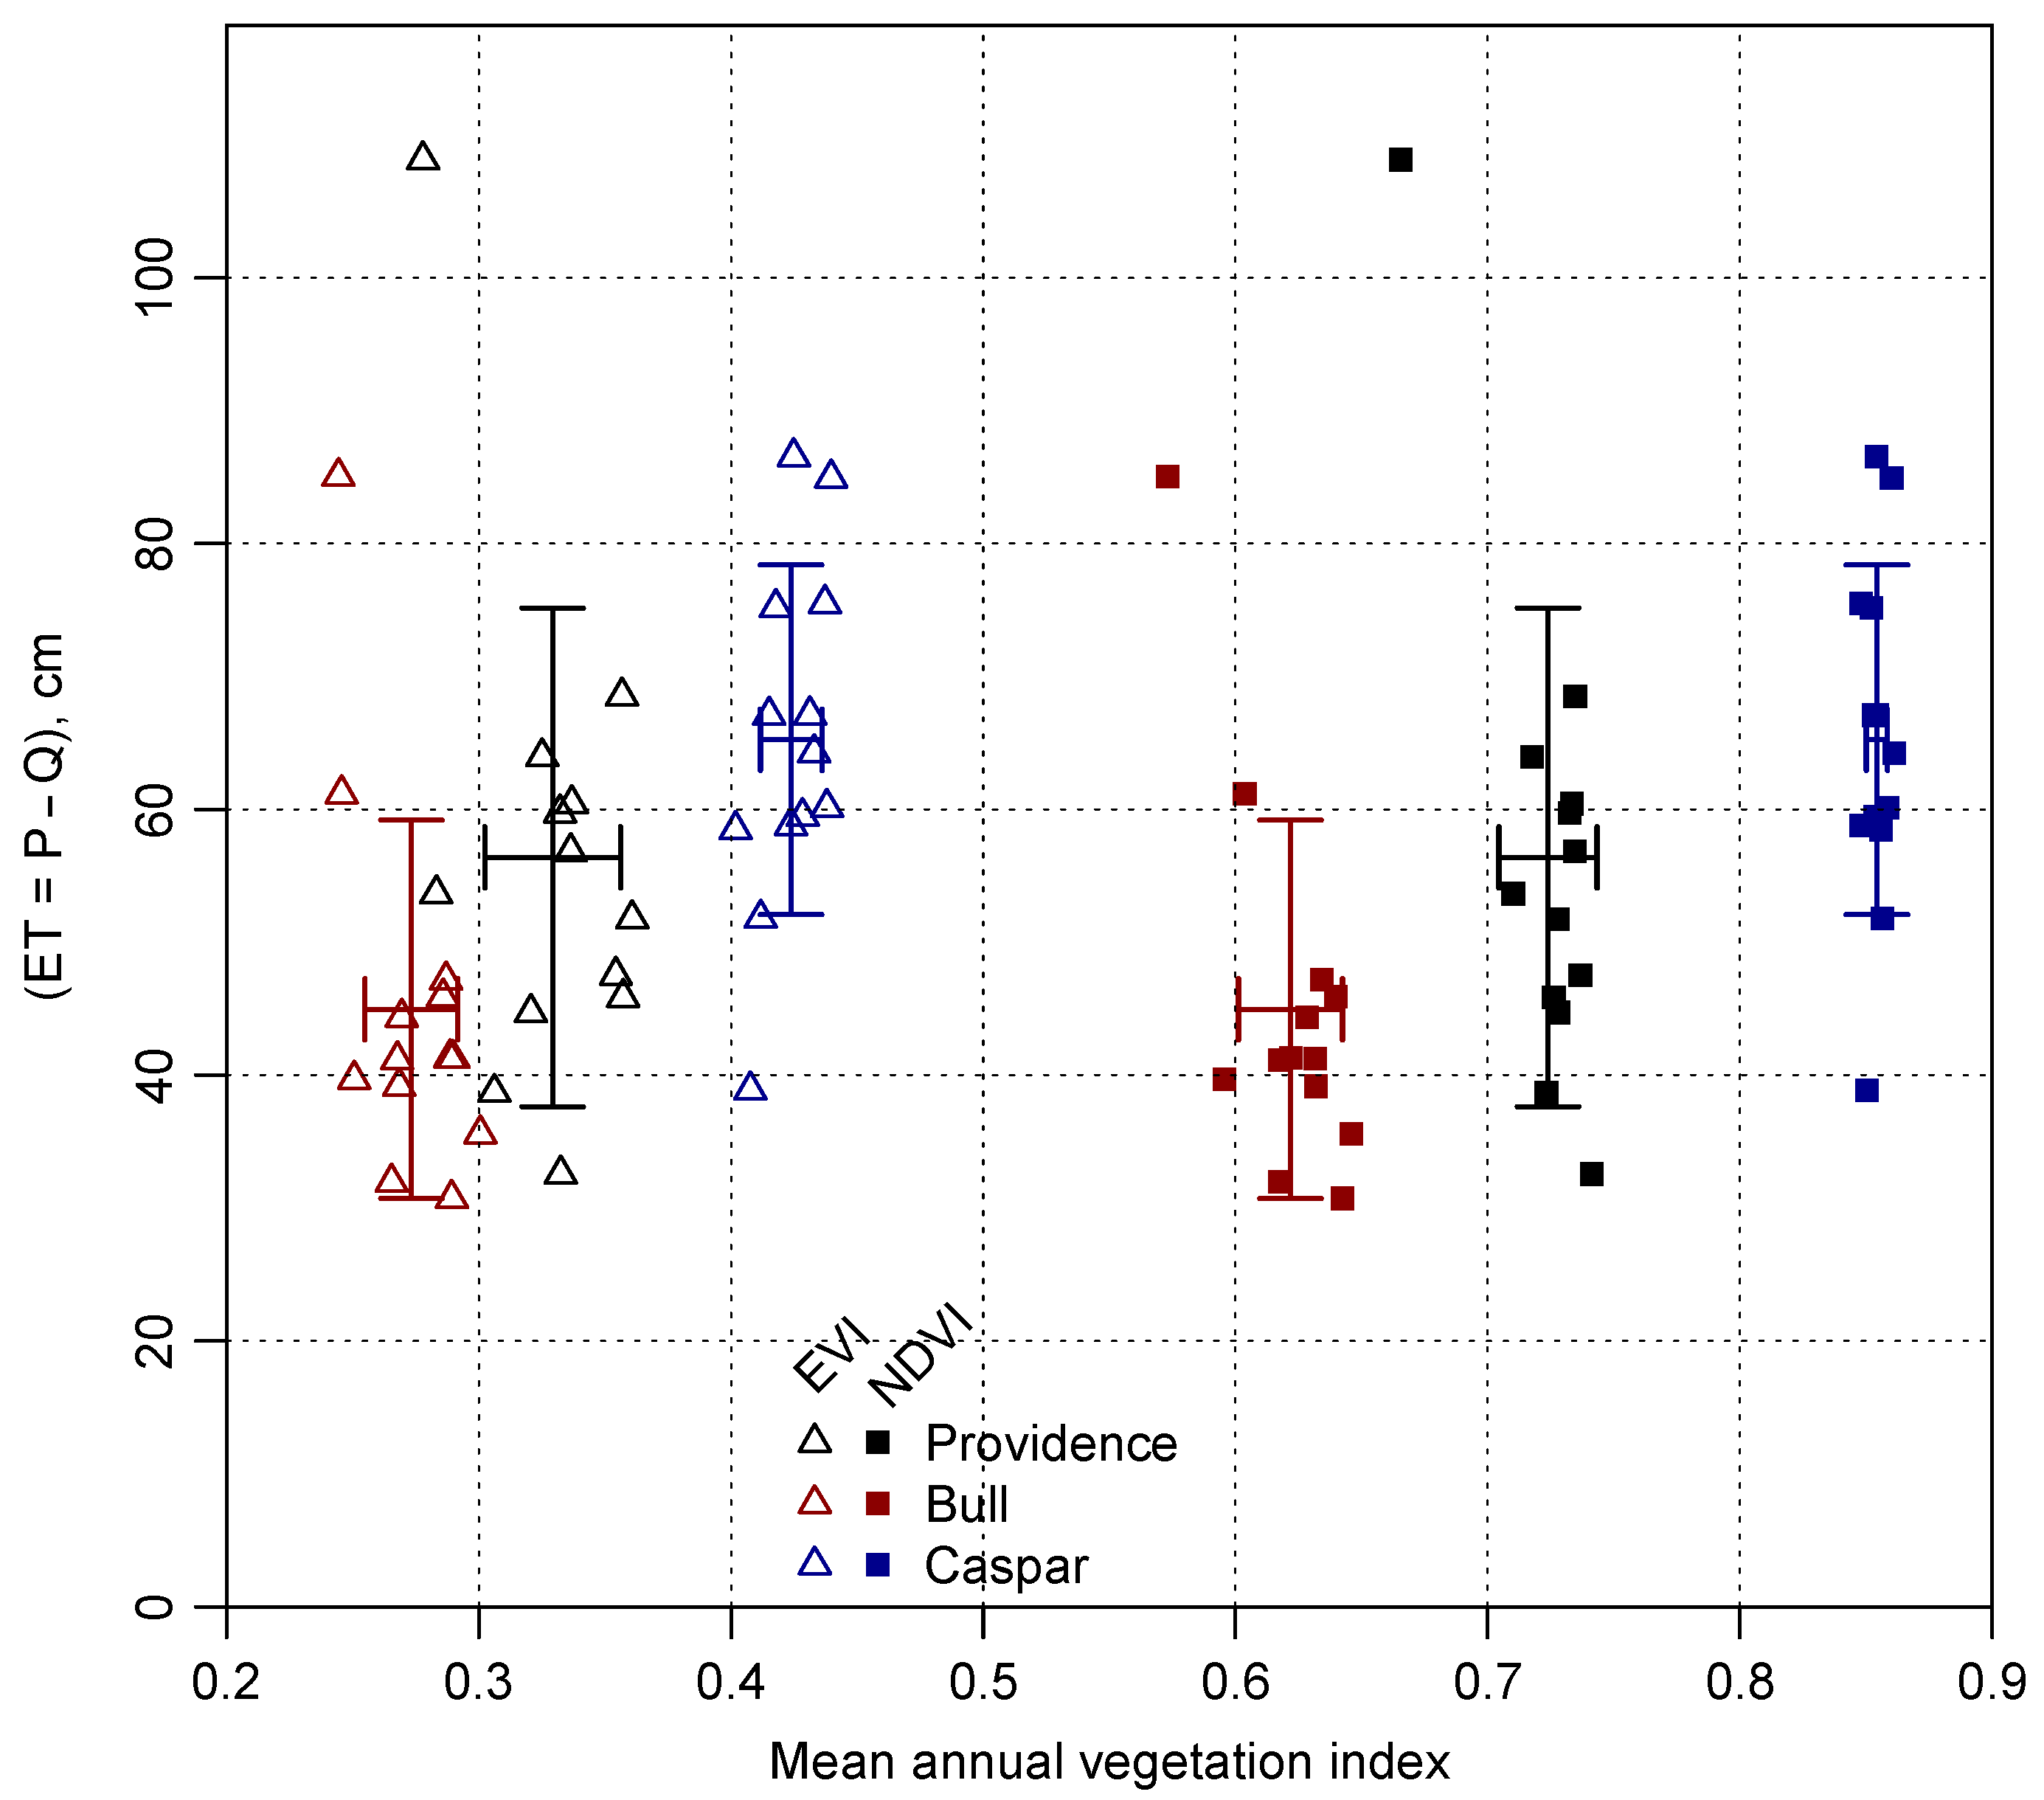
Evapotranspiration is often inferred by using the water balance approach to subtract observed runoff from observed precipitation, and requires the assumption that water has a storage and travel time of ≤1 year. To test this assumption, annual ET calculated from the water balance method was compared to mean annual NDVI and EVI (Figure 6). The variability of NDVI (C.V.: Caspar = 0.01, Providence = 0.01, Bull = 0.02) and EVI (C.V.: Caspar = 0.03, Providence = 0.07, Bull = 0.06) were low compared to the range of evapotranspiration estimates (C.V.: Caspar = 0.16, Providence = 0.20, Bull = 0.19) based on the water balance.
4. Discussion
4.1. Climate Indices
The lower correlation of the 12-month SPI and SRI in the mixed rain/snow Providence and snow-dominated Bull than in rain-dominated Caspar reflects the influence of delayed snowpack, with greater snowpack or later melt-driven runoff resulting in lower correlations. The highest correlations for Providence could be obtained by shifting the SRI either two or three months earlier (R2 = 0.87 for both), and for Bull by shifting the SRI three months earlier (R2 = 0.86). Assuming the highest correlation is between the two and three month offset for Providence, the smaller shift in time period represents the higher fraction of precipitation falling as rain when compared to the three month offset in the more snow-dominated Bull site. Similarly, Joetzjer et al. [43] found a 12-month SPI to be a good indicator of a 12-month SRI in regions where precipitation dominated runoff response, such as the Amazon river basin, but not in regions where changes in temperature and evapotranspiration dominated changes in runoff response, such as the Mississippi river basin. There are also spatial differences in precipitation that separate Caspar Creek in the northern California coastal region and the two southern Sierra Nevada sites of Providence and Bull Creeks. For example, precipitation exceeded 40 cm in consecutive Decembers of 2014 and 2015 at Caspar, but did not exceed 20 cm in Providence or Bull. The additional precipitation in December 2014 on the northern coast resulted in a much shorter period of moderate to extremely dry conditions than occurred in the Sierra Nevada sites.
The severity of the recent drought is clear, and the low SPI values in 2014 are similar to the 1976–1977 drought values in the Feather River from Shukla and Wood [39]. The SRI exceeds −2 only for Caspar, and does not show a strong signal in Providence and Bull due to the offset runoff and more limited data. In a review of drought indices, Keyantash and Dracup [44] found SPI to be a good indicator of meteorological drought based on factors such as robustness and dimensionality, whereas the more traditional Palmer Drought Severity Index (PDSI, [37]) performed relatively poorly. The more gradual response of SRI in the Sierra Nevada sites is also a result of the greater variability in interannual runoff than occurs on the northern California coastal range. Because SPI only relies on precipitation data, it can only reflect the change in hydrologic input to the system. The addition of SRI is a more complete interpretation of the drought signal here since it integrates other effects [45]. SRI is impacted by evapotranspiration that is also modified by changes in temperature and the surface energy balance. The widespread tree mortality that has occurred in the Sierra Nevada with the recent drought [46] would also impact the SRI, but those effects would not be apparent if only using SPI.
Extreme precipitation events and temperatures are expected to increase this century [47,48,49]. The percent of time the SPI was outside of the mild wet or dry meteorological conditions (Table 2) in recent history increases from rain-dominated Caspar (31%) to mixed rain and snow Providence (33%) to snow-dominated Bull (35%), and may also indicate a progressive reduction in individual site resilience to future climates with an even greater number of extreme events. Although SPI will provide a good indication of these meteorological signals, it cannot show expected changes in the precipitation phase from snow to rain, or changes in vegetation structure from stress or species migration. SRI will be needed to show an assessment of the cumulative signals from a systems perspective, which will require continued effort to measure stream runoff at mid- to high-elevation Sierra Nevada catchments. The stream runoff data available to develop the SRI was relatively short (12 years), and institutional support of long-term data collection is needed to quantitatively monitor this changing environment. Tague and Grant [50] also promote an expanded runoff measurement network for this purpose in the Western Cordillera, and Bales et al. [51] detail the need for a broad integration of data from in-situ measurement, remote sensing, and modeling for adaptive multi-scale monitoring and research in the mountain west. Both measurements and remote sensing were used for this analysis, which will then be used to build and constrain eco-hydrologic predictive modeling for continued research on impacts of climate and vegetation perturbation on these hydrologic systems.
4.2. Vegetation Indices
Caspar had the highest mean vegetation indices, but the lowest standard deviation of all the sites for both NDVI and EVI. This indicates a more stable vegetation community, which is supported by having the longest amount of time (69%) in mild dry or wet precipitation conditions. Caspar NDVI values are near the saturation limit of approximately 0.90 [52], which may be limiting the ability to detect vegetation changes and likely contributes to the extremely low standard deviation. The lowest NDVI and EVI values for mixed rain and snow Providence and snow-dominated Bull occur during 2014–2016, coinciding with drought-related canopy water loss [53] and tree mortality [46]. In contrast, the lowest NDVI value for Caspar occurs in 2004, while the lowest EVI value occurs in 2016, which may reflect the lower sensitivity of NDVI and the higher sensitivity of EVI in regions of high biomass [52]. The last wet year prior to the drought was 2011, with the vegetation indices showing overall decreases starting in 2012 through 2015. Despite the first year of the drought occurring in 2012, Providence showed an increase in mean NDVI. This result could have been from greater potential ET from higher energy availability, as suggested with climate warming by Goulden and Bales [5], or from carryover water storage from the wettest year of 2011, as suggested by Safeeq and Hunsaker [19], or a combination of both. Garcia and Tague [54] also showed a high sensitivity of Sierra Nevada annual ET to plant available water capacity in subsurface storage, which would then influence the NDVI value.
4.3. Evapotranspiration Estimates
The predictive equations of actual evapotranspiration developed from the vegetation indices and Sierra Nevada eddy covariance flux towers had coefficients of determination (R2 = 0.81, 0.86) well within the range of reported studies that even incorporated ground-based data [55]. These coefficients were lower than the equation developed by Goulden et al. [21] (R2 = 0.92), however, despite the longer data record and greater range of annual precipitation. This result may indicate that ET data from a greater range of vegetative community types and densities may be more important than focusing on sites specific to one vegetation type. The high overestimate of Caspar ET from both EVI (MAE = 104.7) and NDVI (MAE = 296.3 cm) reinforces the tenet that caution should be used when interpreting actual ET estimates produced using vegetation index values outside of the range used to develop the predictive equation, in applications such as the continuous mapping of ET across large spatial scales [20]. The equation from Goulden et al. [21] proved to be a more robust actual ET estimate in Caspar (MAE = 33.3 cm) because of the lower slope of the fitted exponential equation. This remote sensing vegetation index approach of estimating evapotranspiration is most successful when well-constrained by a broad range of vegetation types and index values.
Improvement in these predictive equations could potentially be accomplished by incorporating a measure of meteorological conditions that influence ET (e.g., net radiation, vapor pressure deficit, temperature), although previous studies have found a wide range of success in this approach (R2 = 0.45–0.96; [55]). Nagler et al. [24] noted improvement in predicting ET from southwestern riparian vegetation by including both variables of EVI and maximum air temperature. Ground-based data may also help limit ET prediction errors when extrapolating relationships beyond the available data, such as the large error from NDVI estimates at Caspar. A number of studies have shown a higher correlation between EVI and eddy covariance ET measurements as compared to NDVI [55]. EVI was also better correlated with measured ET at these sites, but NDVI ET resulted in a better water balance closure with measured precipitation.
Using the ET estimates with the most constrained MAE, mean annual ET was lowest at snow-dominated Bull (48 cm year−1), moderate at mixed rain/snow Providence (72 cm year−1), and highest at rain-dominated Caspar (101 cm year−1). Bull is located at a higher elevation where ET is limited by cold winter temperatures and low vegetation density from a short summer growing season [19]. In contrast, Providence is a mid-elevation site where ET is less impacted by winter temperatures and is also less impacted by the summer dry season than the lower elevation Sierra Nevada [21]. Caspar is located in the northern California coastal range, where winter temperatures are mild, and the hot summer dry season is limited by moderating ocean winds and fog, leading to very productive forest vegetation communities. Previous investigation into fog and coastal redwood forest has determined that fog was 34% of annual moisture input, resulting in 13–45% of annual redwood transpiration [56].
4.4. Water Balance Impacts
The combination of predicted actual ET and observed runoff captured the shift from greater precipitation use by forest vegetation in Caspar and Providence to greater runoff production in the higher elevation Bull site. Annual water balance closure was well overestimated at Caspar (S. Cal. NDVI: +28.8%), moderately overestimated in Providence (S. Cal. NDVI: +23.6%), but only slightly overestimated at Bull (Sierra NDVI: +6.9%). All methods overestimated the water balance closure, suggesting precipitation measurements may be underestimated at these locations or lateral subsurface water movement plays a substantial role in annual ET, as suggested by Garcia and Tague [44]. Annual change in the water balance was better predicted by the S. Cal. NDVI (R2: Caspar = 0.83, Providence = 0.97, Bull = 0.94) and Sierra NDVI (Caspar = 0.89, Providence = 0.89, Bull = 0.89) equations, as opposed to the Sierra-EVI equation (Caspar = 0.48, Providence = 0.07, Bull = 0.83). The addition of the lag term in the Sierra-EVI equation made it less sensitive to annual changes, despite closer correlation with ET and the annual water balance in Caspar than Sierra-NDVI.
Quantifying evapotranspiration as the difference between measured precipitation and runoff, assuming a water storage and travel time of ≤1 year, resulted in substantially greater annual ET variability than in NDVI or EVI. Recent research has suggested high subsurface storage potential in the mid-elevation Sierra Nevada [57], and large summer dry season soil water fluxes because of vegetation use in California mountain regions [20]. Higher elevation catchments such as Bull have a shallow soil layer and lower carryover storage potential with higher risk to subsurface storage losses from climate warming and a smaller winter snowpack [19]. Changes in the storage and flux of water in the subsurface may not be captured in Sierra Nevada forested watersheds by using annual observations of precipitation and runoff. Garcia and Tague [54] also show that subsurface plant available water capacity and lateral redistribution of water can act as a major control of ET response to climate in the Sierra Nevada. Despite the importance of subsurface properties and water storage on vegetation and water balance response to climate variability, few studies have direct measurements (e.g., Holbrook et al. [57]). Future research focused on hydrologic response in this region should focus on quantifying and constraining the subsurface storage potential and contribution to interannual water balance variability.
5. Conclusions
Climate variability and extremes are expected to increase in the coming century, as California is experiencing one of the worst extended droughts in modern history. Both SPI and SRI were able to successfully capture the extreme drought signal in 2014–2015. SRI minimums were offset one year from SPI minimums in the Sierra Nevada watersheds, reflecting differences from the northern coastal range of snowpack-delayed runoff and potential subsurface storage capacity. Although the SPI is a good indicator of meteorological wet and dry periods, the SRI takes into account changes to the watershed, and support for broader long-term stream runoff measurements are needed to better detect this more integrated signal.
The low elevation rain-dominated Caspar watershed had the highest vegetation index values and annual evapotranspiration, with the lowest variability over the past 13 years. Vegetation indices and evapotranspiration decreased from Caspar to the mid elevation Providence watershed with mixed rain and snow and further decreased in the high elevation snow-dominated Bull watershed. Both snow-influenced Sierra Nevada watersheds showed higher vegetation and evapotranspiration response to interannual climate variability. Annual evapotranspiration predictive equations in the Sierra Nevada showed good agreement with both mean annual NDVI and EVI, but were generally out-performed by the previously-developed southern California NDVI equation that used a broader range of vegetation types and NDVI values. The most accurate water balance closure was within 10% of measured precipitation at snow-dominated Bull, which is inside the range of potential measurement errors for precipitation and stream runoff. Further research is needed to better constrain subsurface storage properties in this region and to determine if forest management can improve source watershed resiliency to climate variability.
Acknowledgements
Funding for this project was provided by the U.S. Forest Service (USFS) Pacific Southwest Research Station (PSW). Long-term measurements at the Caspar Creek Watershed are a result of a partnership between the USFS-PSW and the California Department of Forestry and Fire Protection, and measurements at the Kings River Experimental Watersheds are thanks to the USFS-PSW. Additional research support was provided by the U.S. National Science Foundation, through the Southern Sierra Critical Zone Observatory (EAR-0725097). The authors would like to thank support personnel from UC Merced Sierra Nevada Research Institute and the PSW, including Jayme Seehafer, for field data collection and processing. Any use of trade, product, or firm names is for descriptive purposes only and does not imply endorsement by the U.S. Government.
Author Contributions
Philip Saksa completed the analyses, prepared the manuscript, and provided input to the study design. Mohammad Safeeq and Salli Dymond designed the study, provided comments on the results, and edited the manuscript.
Conflicts of Interest
The authors declare no conflicts of interest.
References
- California Tree Mortality. Available online: https://www.fs.usda.gov/CATreeMortality (accessed on 12 May 2017).
- California Department of Water Resources (California DWR). California Water Plan Update 2013: Investing in Innovation & Infrastructure; California Department of Water Resources: Sacramento, CA, USA, 2013.
- Griffin, D.; Anchukaitis, K.J. How unusual is the 2012–2014 California drought? Geophys. Res. Lett. 2014, 41, 9017–9023. [Google Scholar] [CrossRef]
- Cook, B.I.; Ault, T.R.; Smerdon, J.E. Unprecedented 21st century drought risk in the American Southwest and Central Plains. Sci. Adv. 2015, 1, 1–7. [Google Scholar] [CrossRef] [PubMed]
- Goulden, M.L.; Bales, R.C. Mountain runoff vulnerability to increased evapotranspiration with vegetation expansion. Proc. Natl. Acad. Sci. USA 2014, 111, 14071–14075. [Google Scholar] [CrossRef] [PubMed]
- Grant, G.E.; Tague, C.L.; Allen, C.D. Watering the forest for the trees: An emerging priority for managing water in forest landscapes. Front. Ecol. Environ. 2013, 11, 314–321. [Google Scholar] [CrossRef]
- Bosch, J.; Hewlett, J. A review of catchment experiments to determine the effect of vegetation changes on water yield and evapotranspiration. J. Hydrol. 1982, 55, 3–23. [Google Scholar] [CrossRef]
- Stednick, J. Monitoring the effects of timber harvest on annual water yield. J. Hydrol. 1996, 176, 79–95. [Google Scholar] [CrossRef]
- Brown, A.E.; Zhang, L.; McMahon, T.A.; Western, A.W.; Vertessy, R.A. A review of paired catchment studies for determining changes in water yield resulting from alterations in vegetation. J. Hydrol. 2005, 310, 28–61. [Google Scholar] [CrossRef]
- Marvin, S. Possible changes in water yield and peak flows in response to forest management. In Sierra Nevada Ecosystem Project: Final Report to Congress; Center for Water and Wildland Resources, University of California: Davis, CA, USA, 1996; Volume III, pp. 154–199. [Google Scholar]
- Zhang, L.; Dawes, W.R.; Walker, G.R. Response of mean annual evapotranspiration to vegetation changes at catchment scale. Water Resour. Res. 2001, 37, 701–708. [Google Scholar] [CrossRef]
- Adams, H.; Luce, C.; Breshears, D.; Allen, C.; Weiler, M.; Hale, V.C.; Smith, A.; Huxman, T. Ecohydrological consequences of drought-and infestation-triggered tree die-off: Insights and hypotheses. Ecohydrology 2012, 159, 145–159. [Google Scholar] [CrossRef]
- Mikkelson, K.M.; Bearup, L.A.; Maxwell, R.M.; Stednick, J.D.; McCray, J.E.; Sharp, J.O. Bark beetle infestation impacts on nutrient cycling, water quality and interdependent hydrological effects. Biogeochemistry 2013, 115, 1–21. [Google Scholar] [CrossRef]
- Bethlahmy, N. More streamflow after a bark beetle epidemic. J. Hydrol. 1974, 23, 185–189. [Google Scholar] [CrossRef]
- Bearup, L.A.; Maxwell, R.M.; Clow, D.W.; McCray, J.E. Hydrological effects of forest transpiration loss in bark beetle-impacted watersheds. Nat. Clim. Chang. 2014, 4, 481–486. [Google Scholar] [CrossRef]
- Brown, M.G.; Black, T.A.; Nesic, Z.; Foord, V.N.; Spittlehouse, D.L.; Fredeen, A.L.; Bowler, R.; Grant, N.J.; Burton, P.J.; Trofymow, J.A.; et al. Evapotranspiration and canopy characteristics of two lodgepole pine stands following mountain pine beetle attack. Hydrol. Process. 2014, 28, 3326–3340. [Google Scholar] [CrossRef]
- Biederman, J.; Harpold, A.; Gochis, D.; Ewers, B.; Reed, D.; Papuga, S.; Brooks, P. Increased evaporation following widespread tree mortality limits streamflow response. Water Resour. Res. 2014, 50, 5395–5409. [Google Scholar] [CrossRef]
- Safeeq, M.; Shukla, S.; Arismendi, I.; Grant, G.E.; Lewis, S.L.; Nolin, A. Influence of winter season climate variability on snow-precipitation ratio in the western United States. Int. J. Climatol. 2016, 36, 3175–3190. [Google Scholar] [CrossRef]
- Safeeq, M.; Hunsaker, C.T. Characterizing Runoff and Water Yield for Headwater Catchments in the Southern Sierra Nevada. J. Am. Water Resour. Assoc. 2016, 52, 1327–1346. [Google Scholar] [CrossRef]
- Fellows, A.W.; Goulden, M.L. Mapping and understanding dry-season soil water drawdown by California montane vegetation. Ecohydrology 2016, 10, 1–12. [Google Scholar] [CrossRef]
- Goulden, M.L.; Anderson, R.G.; Bales, R.C.; Kelly, A.E.; Meadows, M.; Winston, G.C. Evapotranspiration along an elevation gradient in California’s Sierra Nevada. J. Geophys. Res. 2012, 117, G03028. [Google Scholar] [CrossRef]
- Keppeler, E.T. The Summer Flow and Water Yield Response to Timber Harvest. In Proceedings of the Conference on Coastal Watersheds: The Caspar Creek Story, Ukiah, CA, USA, 6 May 1998; Pacific Southwest Research Station, Forest Service, U.S. Department of Agriculture: Albany, CA, USA, 1998; pp. 35–43. [Google Scholar]
- Vogelmann, J.E.; Tolk, B.; Zhu, Z. Monitoring forest changes in the southwestern United States using multitemporal Landsat data. Remote Sens. Environ. 2009, 113, 1739–1748. [Google Scholar] [CrossRef]
- Nagler, P.L.; Scott, R.L.; Westenburg, C.; Cleverly, J.R.; Glenn, E.P.; Huete, A.R. Evapotranspiration on western U.S. rivers estimated using the Enhanced Vegetation Index from MODIS and data from eddy covariance and Bowen ratio flux towers. Remote Sens. Environ. 2005, 97, 337–351. [Google Scholar] [CrossRef]
- Ichii, K.; Wang, W.; Hashimoto, H.; Yang, F.; Votava, P.; Michaelis, A.R.; Nemani, R.R. Refinement of rooting depths using satellite-based evapotranspiration seasonality for ecosystem modeling in California. Agric. For. Meteorol. 2009, 149, 1907–1918. [Google Scholar] [CrossRef]
- Trujillo, E.; Molotch, N.P.; Goulden, M.L.; Kelly, A.E.; Bales, R.C. Elevation-dependent influence of snow accumulation on forest greening. Nat. Geosci. 2012, 5, 705–709. [Google Scholar] [CrossRef]
- Stoms, D.M.; Hargrove, W.W. Potential NDVI as a baseline for monitoring ecosystem functioning. Int. J. Remote Sens. 2000, 21, 401–407. [Google Scholar] [CrossRef]
- Volcani, A.; Karnieli, A.; Svoray, T. The use of remote sensing and GIS for spatio-temporal analysis of the physiological state of a semi-arid forest with respect to drought years. For. Ecol. Manag. 2005, 215, 239–250. [Google Scholar] [CrossRef]
- Peters, A.J.; Walter-Shea, E.A.; Ji, L.; Vina, A.; Hayes, M.; Svoboda, M.D. Drought monitoring with NDVI-based standardized vegetation index. Am. Soc. Photogramm. Remote Sens. 2002, 68, 71–75. [Google Scholar]
- Breshears, D.D.; Cobb, N.S.; Rich, P.M.; Price, K.P.; Allen, C.D.; Balice, R.G.; Romme, W.H.; Kastens, J.H.; Floyd, M.L.; Belnap, J.; et al. Regional vegetation die-off in response to global-change-type drought. Proc. Natl. Acad. Sci. USA 2005, 102, 15144–15148. [Google Scholar] [CrossRef] [PubMed]
- Zhou, M.C.; Ishidaira, H.; Hapuarachchi, H.P.; Magome, J.; Kiem, A.S.; Takeuchi, K. Estimating potential evapotranspiration using Shuttleworth-Wallace model and NOAA-AVHRR NDVI data to feed a distributed hydrological model over the Mekong River basin. J. Hydrol. 2006, 327, 151–173. [Google Scholar] [CrossRef]
- Cafferata, P.H.; Reid, L.M. Applications of Long-Term Watershed Research to Forest Management in California: 50 Years of Learning from the Caspar Creek Experimental Watersheds; California Forestry Report No. 5; The Natural Resources Agency, Department of Forestry & Fire Protection: Sacramento, CA, USA, 2013; p. 110.
- Bales, R.C.; Hopmans, J.W.; O’Geen, A.T.; Meadows, M.; Hartsough, P.C.; Kirchner, P.; Hunsaker, C.T.; Beaudette, D. Soil Moisture Response to Snowmelt and Rainfall in a Sierra Nevada Mixed-Conifer Forest. Vadose Zone J. 2011, 10, 786–799. [Google Scholar] [CrossRef]
- Hunsaker, C.T.; Whitaker, T.W.; Bales, R.C. Snowmelt Runoff and Water Yield along Elevation and Temperature Gradients in California’s Southern Sierra Nevada. J. Am. Water Resour. Assoc. 2012, 48, 667–678. [Google Scholar] [CrossRef]
- Mckee, T.B.; Doesken, N.J.; Kleist, J. The relationship of drought frequency and duration to time scales. In Proceedings of the 8th Conference Applied Climatology of American Meteorological Society, Anaheim, CA, USA, 17–22 January 1993; pp. 179–184. [Google Scholar]
- McKee, T.B.; Doeskin, N.J.; Kleist, J. Drought Monitoring with Multiple Time Scales. In Proceedings of the 9th Conference Applied Climatology of American Meteorological Society, Dallas, TX, USA, 15–20 January 1995; pp. 233–236. [Google Scholar]
- Palmer, W.C. Meteorological Drought. Office of Climatology; US Weather Bureau Research Paper No. 45; US Government Printing Office: Washington, DC, USA, 1965; p. 58.
- Guttman, N.B. Accepting the Standardized Precipitation Index: A Calculation Algorithm. J. Am. Water Resour. Assoc. 1999, 35, 311–322. [Google Scholar] [CrossRef]
- Shukla, S.; Wood, A.W. Use of a standardized runoff index for characterizing hydrologic drought. Geophys. Res. Lett. 2008, 35, L02405. [Google Scholar] [CrossRef]
- Thornton, P.E.; Thornton, M.M.; Mayer, B.W.; Wilhelmi, N.; Wei, Y.; Devarakonda, R.; Cook, R.B. Daymet: Daily Surface Weather Data on a 1-km Grid for North America, Version 2. Available online: http://dx.doi.org/10.3334/ORNLDAAC/1219 (accessed on 3 March 2015).
- Solano, R.; Didan, K.; Jacobson, A.; Huete, A. MODIS Vegetation Indices (MOD13) C5 User’s Guide; Terrestrial Biophysics Remote Sensing Laboratory, The University of Arizona: Tucson, AZ, USA, 2010. [Google Scholar]
- Akaike, H. Information theory and an extension of the maximum likelihood principle. In Proceedings of the Second International Symposium on Information Theory, Budapest, Hungary, 2–8 September 1971; pp. 267–281. [Google Scholar]
- Joetzjer, E.; Douville, H.; Delire, C.; Ciais, P.; Decharme, B.; Tyteca, S. Hydrologic benchmarking of meteorological drought indices at interannual to climate change timescales: A case study over the Amazon and Mississippi river basins. Hydrol. Earth Syst. Sci. 2013, 17, 4885–4895. [Google Scholar] [CrossRef]
- Keyantash, J.; Dracup, J.A. The quantification of drought: An evaluation of drought indices. Bull. Am. Meteorol. Soc. 2002, 83, 1167–1180. [Google Scholar]
- Taylor, I.H.; Burke, E.; McColl, L.; Falloon, P.D.; Harris, G.R.; McNeall, D. The impact of climate mitigation on projections of future drought. Hydrol. Earth Syst. Sci. 2013, 17, 2339–2358. [Google Scholar] [CrossRef]
- Potter, C.S. Landsat image analysis of tree mortality in the southern Sierra Nevada Region of California during the 2013–2015 drought. J. Earth Sci. Clim. Chang. 2015, 7, 342. [Google Scholar] [CrossRef]
- Das, T.; Dettinger, M.D.; Cayan, D.R.; Hidalgo, H.G. Potential increase in floods in California’s Sierra Nevada under future climate projections. Clim. Chang. 2011, 109, 71–94. [Google Scholar] [CrossRef]
- Bell, J.; Sloan, L.; Snyder, M. Regional changes in extreme climatic events: A future climate scenario. J. Clim. 2004, 17, 81–87. [Google Scholar] [CrossRef]
- Easterling, D.R. Climate Extremes: Observations, Modeling, and Impacts. Science 2000, 289, 2068–2074. [Google Scholar] [CrossRef] [PubMed]
- Tague, C.; Grant, G.E. Groundwater dynamics mediate low-flow response to global warming in snow-dominated alpine regions. Water Resour. Res. 2009, 45, 1–12. [Google Scholar] [CrossRef]
- Bales, R.C.; Molotch, N.P.; Painter, T.H.; Dettinger, M.D.; Rice, R.; Dozier, J. Mountain hydrology of the western United States. Water Resour. Res. 2006, 42, 1–13. [Google Scholar] [CrossRef]
- Huete, A.; Didan, K.; Miura, T.; Rodriguez, E.P.; Gao, X.; Ferreira, L.G. Overview of the radiometric and biophysical performance of the MODIS vegetation Indices. Remote Sens. Environ. 2002, 83, 195–213. [Google Scholar] [CrossRef]
- Asner, G.P.; Brodrick, P.G.; Anderson, C.B.; Vaughn, N.; Knapp, D.E.; Martin, R.E. Progressive forest canopy water loss during the 2012–2015 California drought. Proc. Natl. Acad. Sci. USA 2016, 113, 249–255. [Google Scholar] [CrossRef] [PubMed]
- Garcia, E.S.; Tague, C.L. Subsurface storage capacity influences climate-evapotranspiration interactions in three western United States catchments. Hydrol. Earth Syst. Sci. 2015, 19, 4845–4858. [Google Scholar] [CrossRef]
- Glenn, E.P.; Nagler, P.L.; Huete, A.R. Vegetation Index Methods for Estimating Evapotranspiration by Remote Sensing. Surv. Geophys. 2010, 31, 531–555. [Google Scholar] [CrossRef]
- Dawson, T.E. Fog in the Californian redwood forest: Ecosystem inputs and use by plants. Oecologia 1998, 117, 476–485. [Google Scholar] [CrossRef] [PubMed]
- Holbrook, W.S.; Riebe, C.S.; Elwaseif, M.; Hayes, J.L.; Basler-Reeder, K.; Harry, D.L.; Malazian, A.; Dosseto, A.; Hartsough, P.C.; Hopmans, J.W. Geophysical constraints on deep weathering and water storage potential in the Southern Sierra Critical Zone Observatory. Earth Surf. Process. Landf. 2014, 39, 366–380. [Google Scholar] [CrossRef]
Figure 1.
Research watershed locations, including Caspar Creek (NFC, SFC), Providence Creek (P301, P303, P304), and Bull Creek (B201, B203). The McGuires meteorological station used for Caspar Creek is located off the inset map, 8.5-km to the east of the NFC sub-watershed.
Figure 1.
Research watershed locations, including Caspar Creek (NFC, SFC), Providence Creek (P301, P303, P304), and Bull Creek (B201, B203). The McGuires meteorological station used for Caspar Creek is located off the inset map, 8.5-km to the east of the NFC sub-watershed.
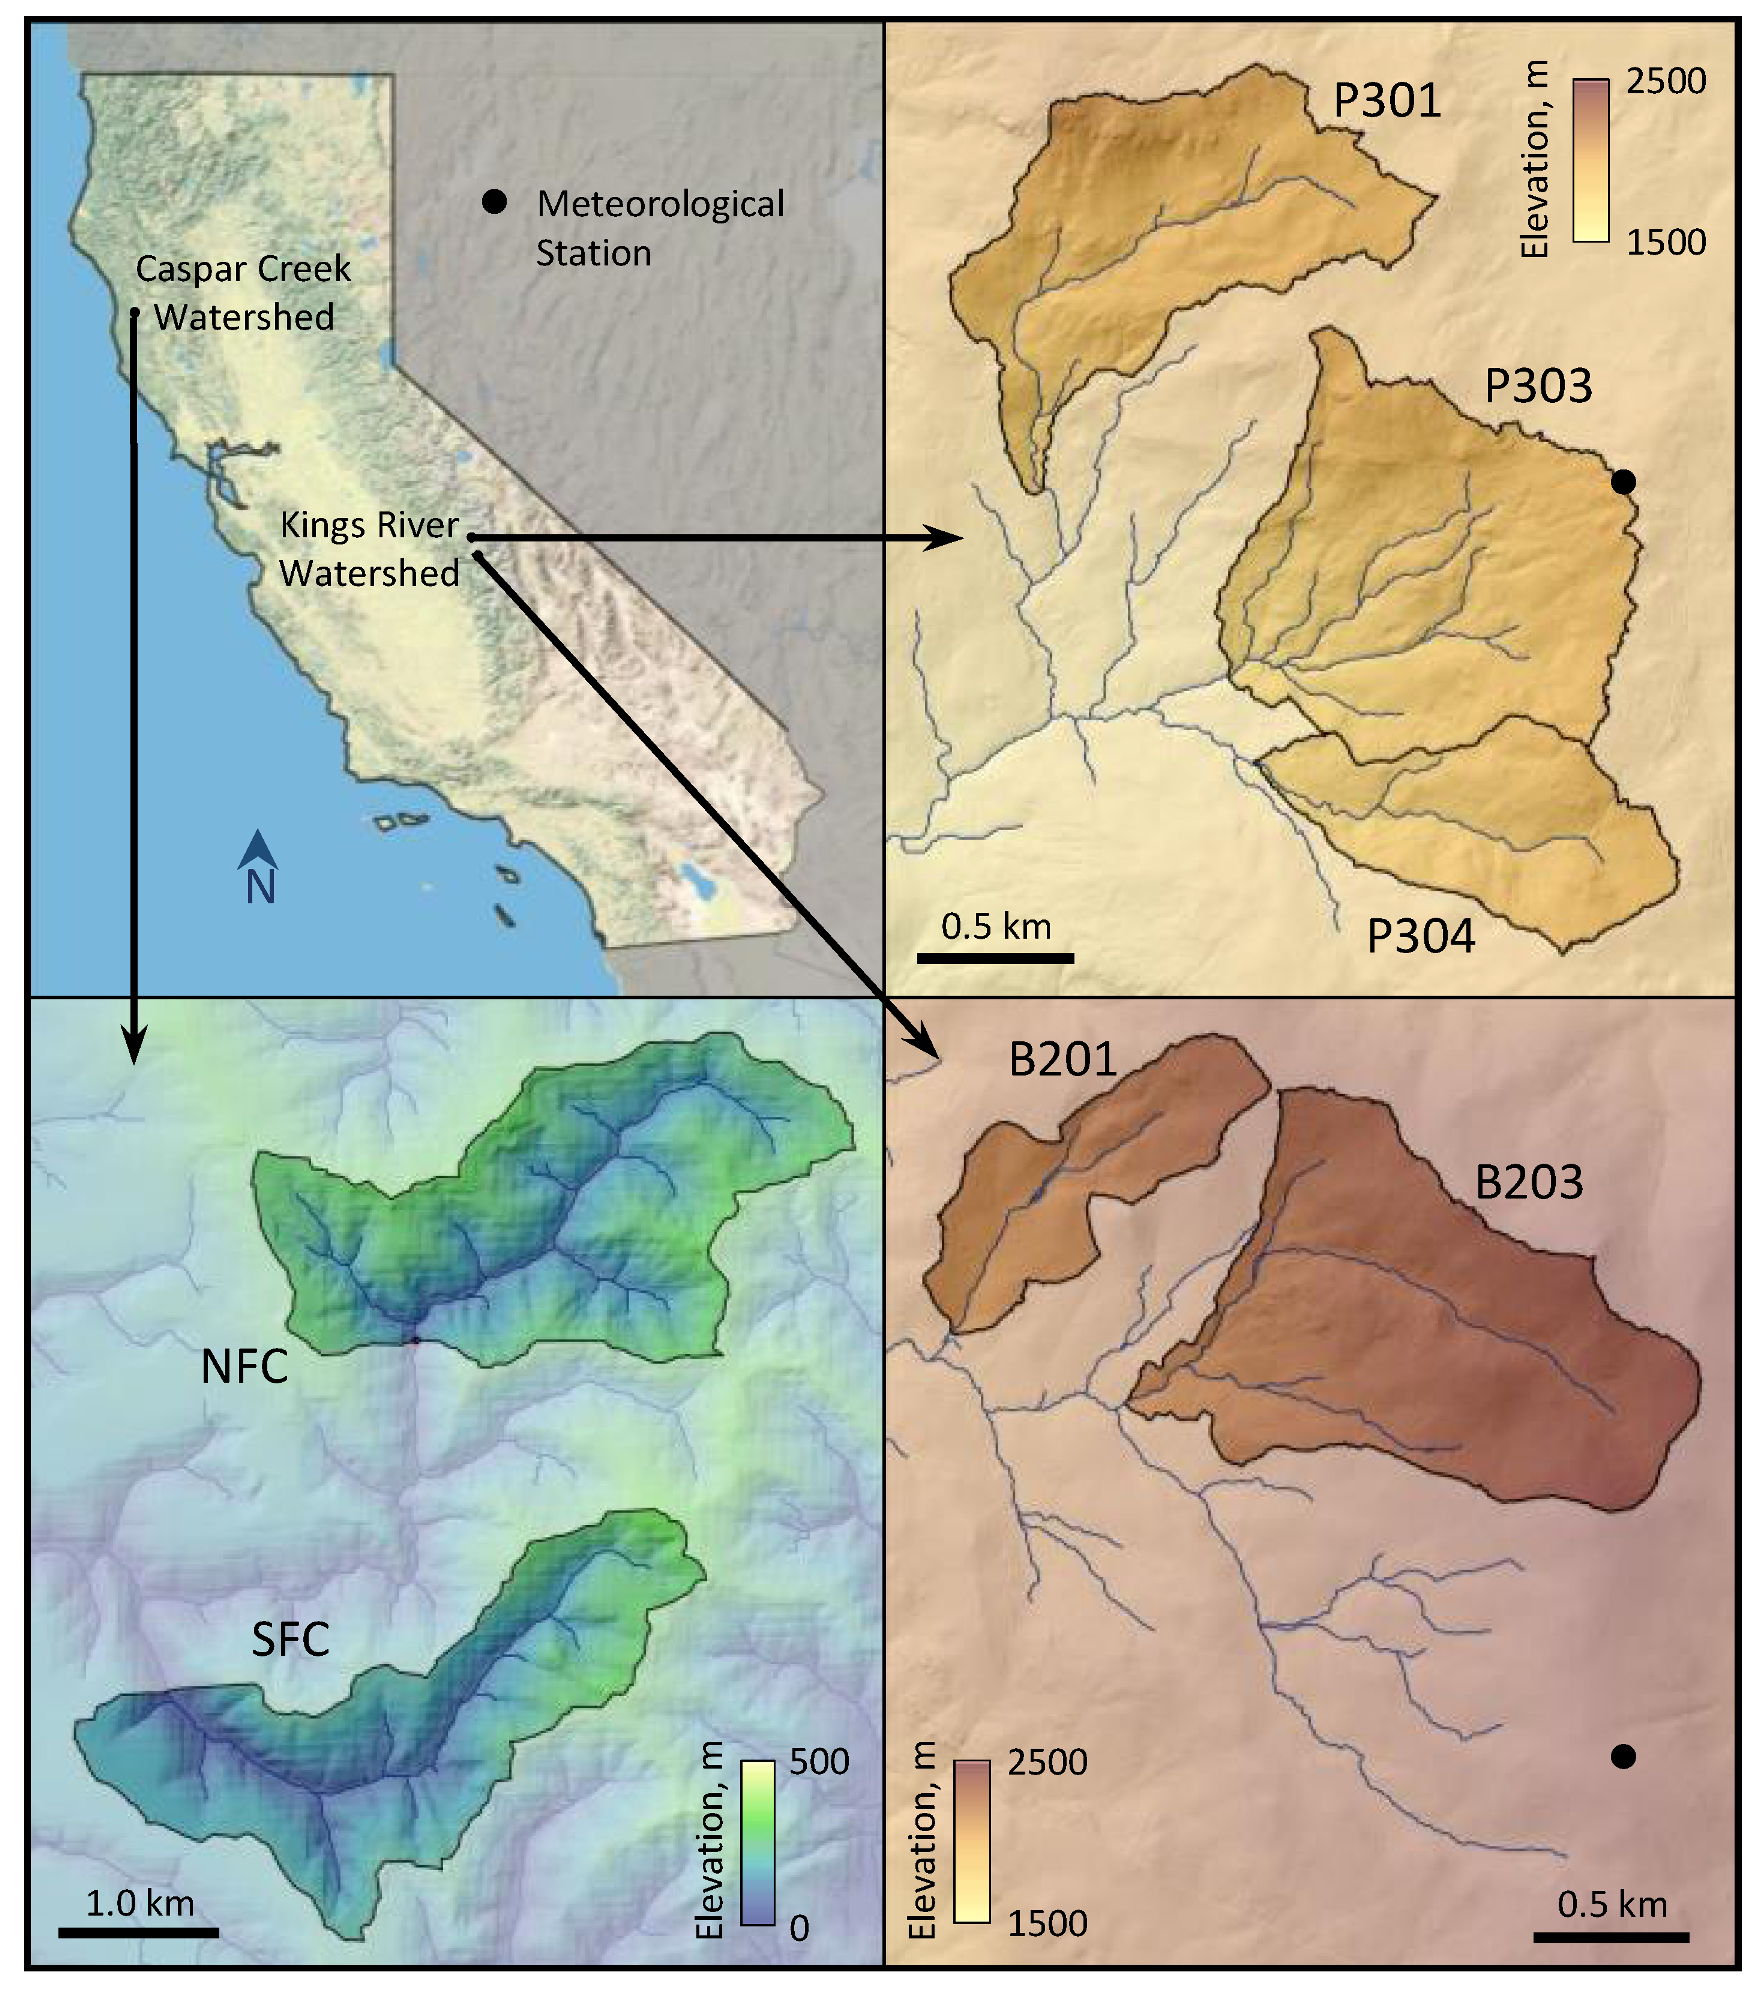
Figure 2.
Mean annual Normalized Difference Vegetation Index (NDVI) (R2 = 0.81, p < 0.0001) and Enhanced Vegetation Index (EVI) (R2 = 0.86, p < 0.001) regressions with mean annual ET. The equation represents the best-fit line. The EVI includes a one year lagged term to account for water storage effects carried over from the current year, which resulted in a better fit than only using same year EVI data. The NDVI had a better relationship without the lagged values.

Figure 3.
Standardized Precipitation Index (SPI, met stations) and Standardized Runoff Index (SRI, catchment outlets) calculated for Providence, Bull, and Caspar. Periods of wet and dry conditions based on the SPI are highlighted using the classification from McKee et al. [35], and indicating values beyond one standard deviation are shaded in gray (SPI between −1.0 and 1.0).
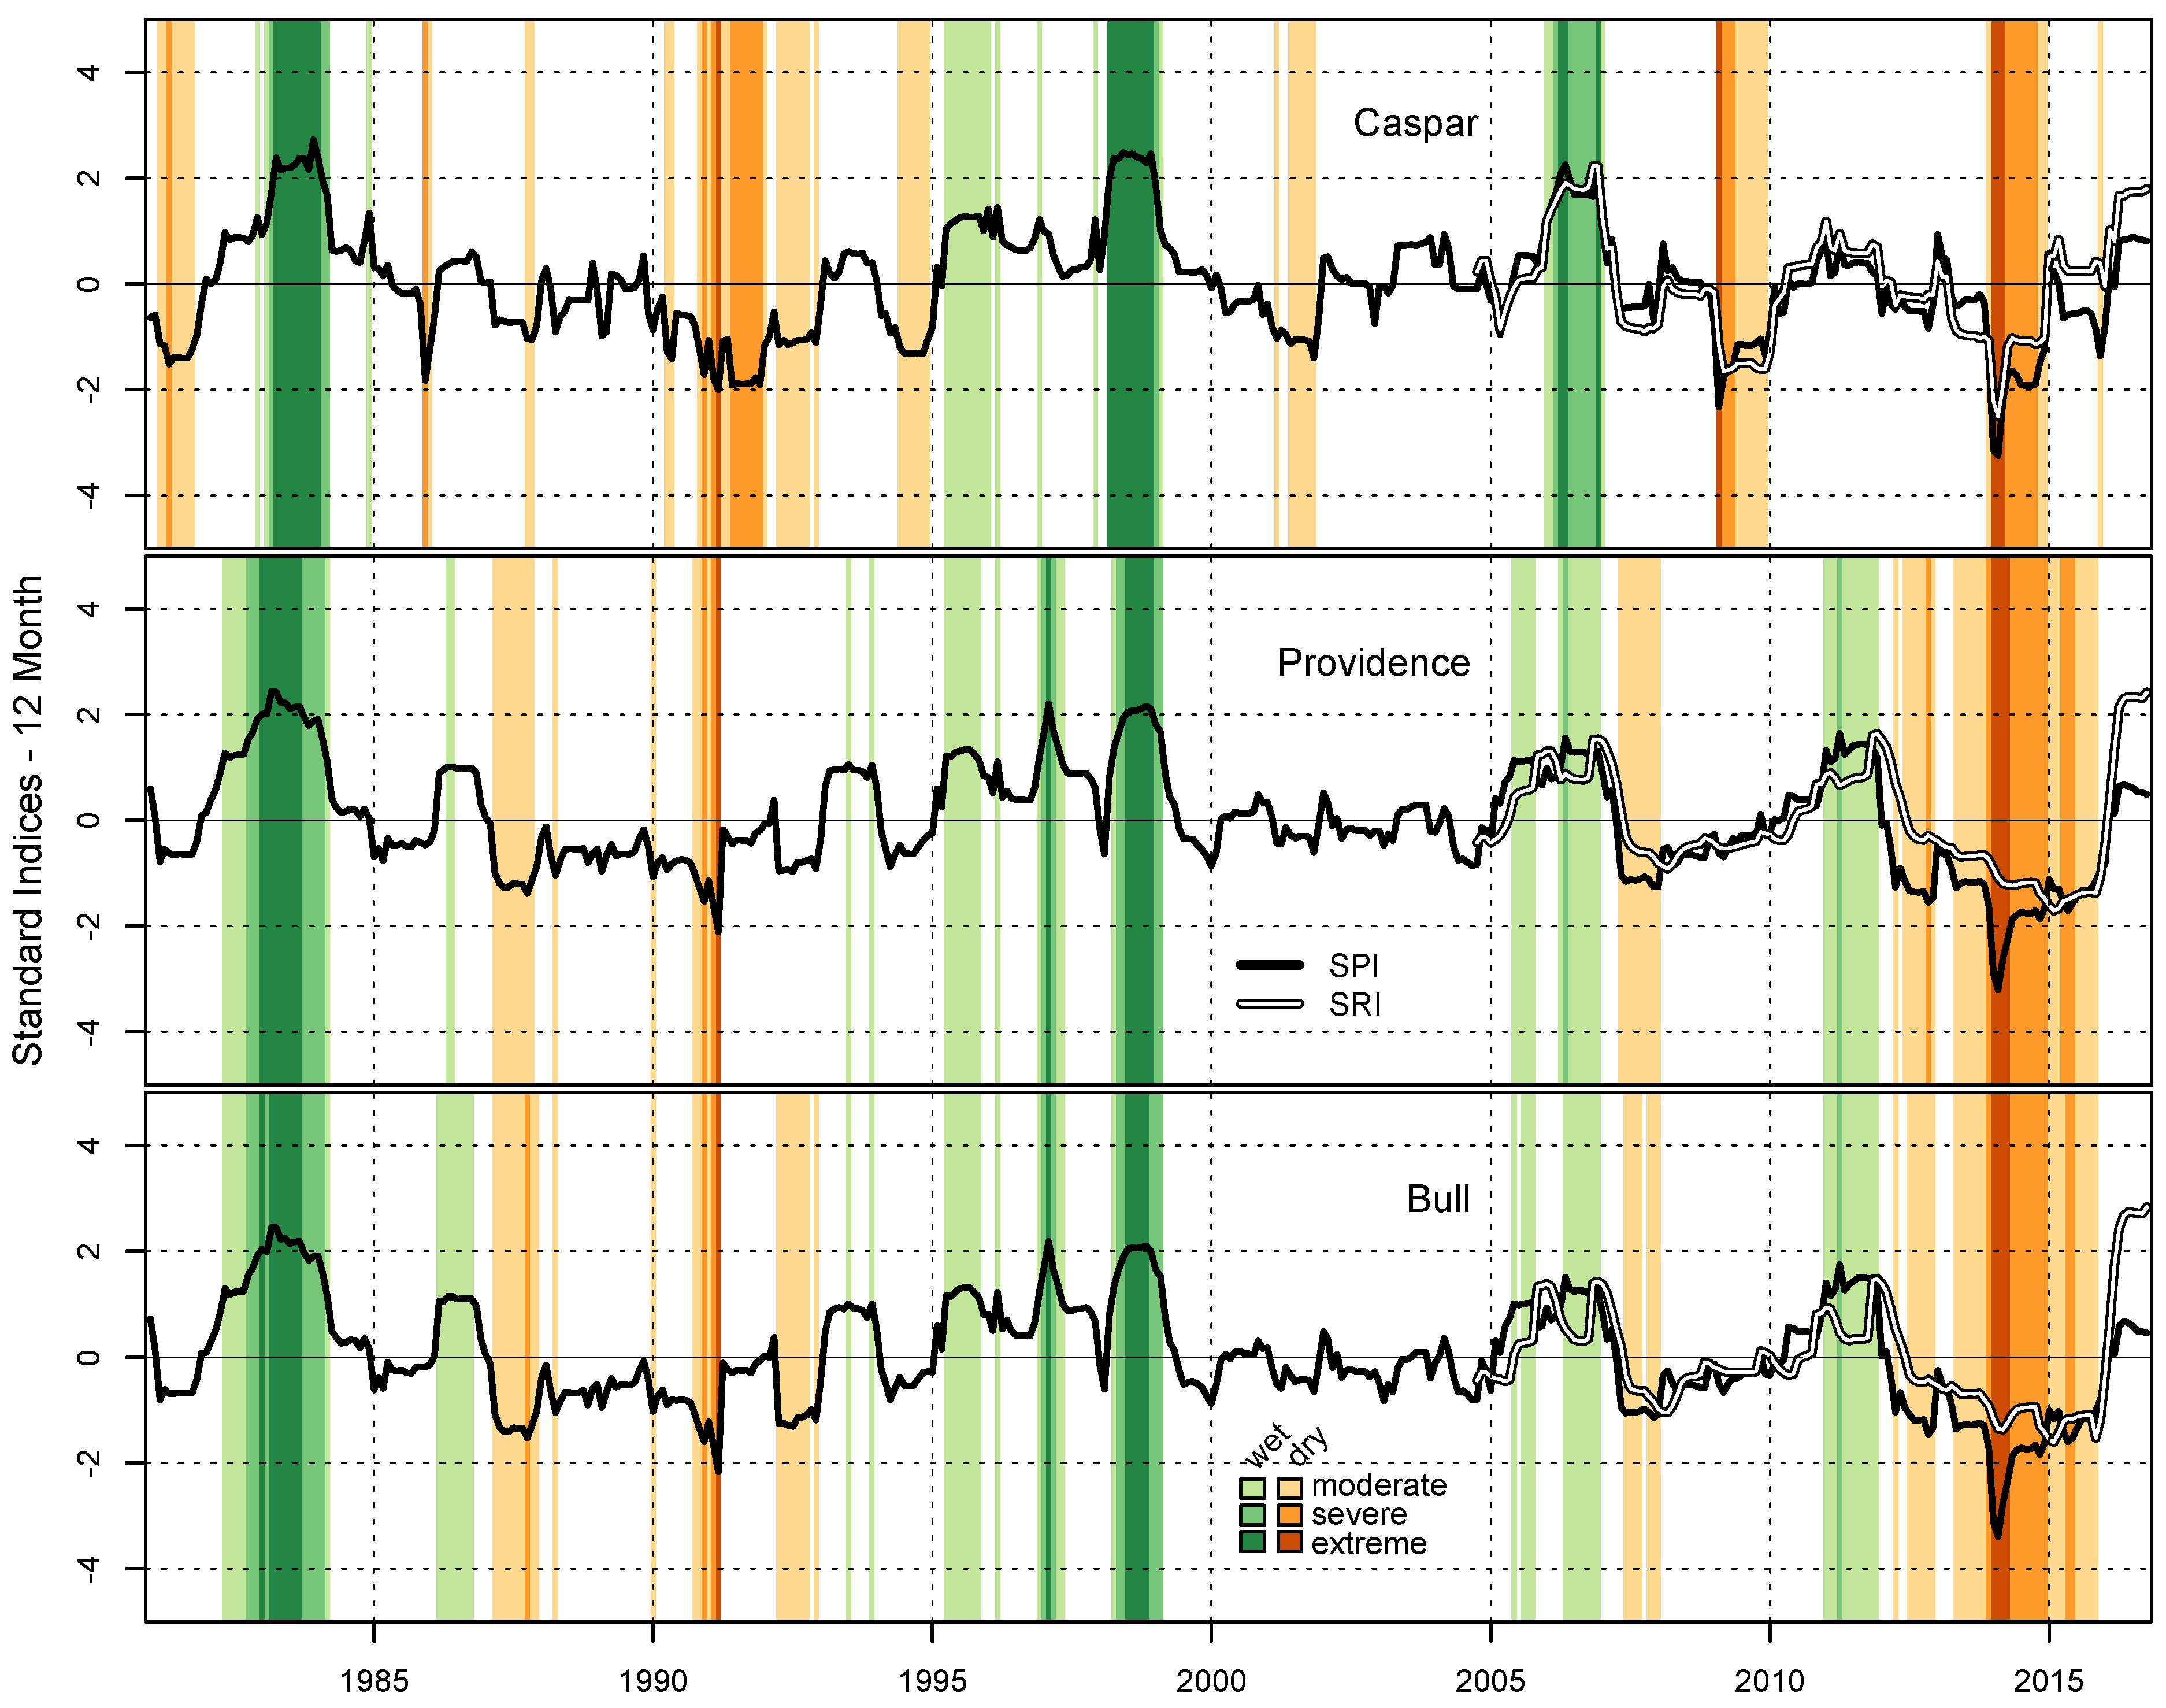
Figure 4.
Mean annual vegetation indices used to calculate annual values of actual ET for the Caspar, Providence, and Bull sites. Vertical bars show observed annual precipitation recorded at the meteorological stations.
Figure 4.
Mean annual vegetation indices used to calculate annual values of actual ET for the Caspar, Providence, and Bull sites. Vertical bars show observed annual precipitation recorded at the meteorological stations.

Figure 5.
Estimates of water balance closure by comparing annual precipitation with the sum of runoff and evapotranspiration. Water balance values are area-normalized over all sub-watersheds at each site. The three evapotranspiration equations are based on NDVI and southern California flux tower ET measurements (S. Cal. NDVI-ET), NDVI and Sierra Nevada flux tower ET (NDVI-ET), and EVI and Sierra Nevada flux tower ET (Sierra EVI-ET). Vertical bars are standard deviations of the individual pixel vegetation index from the watershed annual mean.

Figure 6.
The mean annual vegetation index for each site compared to changes in the water balance estimate of evapotranspiration, calculated by subtracting runoff from precipitation (ET = P – Q). Lines indicate standard deviation of the enhanced vegetation index (EVI) and normalized difference vegetation index (NDVI) that cross at the mean with ET.

Table 1.
Study site characteristics of elevation, mean annual precipitation (Mean P), mean annual temperature (Mean T), and annual temperature range (Min-Max T).
Table 1.
Study site characteristics of elevation, mean annual precipitation (Mean P), mean annual temperature (Mean T), and annual temperature range (Min-Max T).
| Site | Elevation, m | Mean P, cm | Mean T, °C | Min-Max T, °C |
|---|---|---|---|---|
| Caspar | 40–330 | 85 | 12.1 | 1.6–24.1 |
| Providence | 1730–2115 | 97 | 9.9 | −11.6–32.0 |
| Bull | 2145–2490 | 118 | 5.2 | −15.0–28.7 |
Table 2.
Using the Standardized Precipitation Index (SPI) classification from McKee et al. [35], the fraction of time in the past 35 years each site experienced meteorologically wet or dry conditions.
Table 2.
Using the Standardized Precipitation Index (SPI) classification from McKee et al. [35], the fraction of time in the past 35 years each site experienced meteorologically wet or dry conditions.
| Classification | SPI Range | Caspar | Providence | Bull |
|---|---|---|---|---|
| Extreme wet | ≥2.00 | 0.05 | 0.04 | 0.03 |
| Severe wet | 1.50–1.99 | 0.03 | 0.04 | 0.04 |
| Moderate wet | 1.00–1.49 | 0.05 | 0.11 | 0.12 |
| Mild wet | 0.00–0.99 | 0.37 | 0.27 | 0.26 |
| Mild dry | −0.99–0.00 | 0.32 | 0.40 | 0.39 |
| Moderate dry | −1.49–−1.00 | 0.12 | 0.10 | 0.12 |
| Severe dry | −1.99–−1.50 | 0.05 | 0.03 | 0.03 |
| Extreme dry | ≤−2.00 | 0.01 | 0.01 | 0.01 |
© 2017 by the authors. Licensee MDPI, Basel, Switzerland. This article is an open access article distributed under the terms and conditions of the Creative Commons Attribution (CC BY) license (http://creativecommons.org/licenses/by/4.0/).
Share and Cite
MDPI and ACS Style
Saksa, P.; Safeeq, M.; Dymond, S. Recent Patterns in Climate, Vegetation, and Forest Water Use in California Montane Watersheds. Forests 2017, 8, 278. https://doi.org/10.3390/f8080278
AMA Style
Saksa P, Safeeq M, Dymond S. Recent Patterns in Climate, Vegetation, and Forest Water Use in California Montane Watersheds. Forests. 2017; 8(8):278. https://doi.org/10.3390/f8080278
Chicago/Turabian StyleSaksa, Philip, Mohammad Safeeq, and Salli Dymond. 2017. "Recent Patterns in Climate, Vegetation, and Forest Water Use in California Montane Watersheds" Forests 8, no. 8: 278. https://doi.org/10.3390/f8080278
Note that from the first issue of 2016, this journal uses article numbers instead of page numbers. See further details here.