
Prediction of Dominant Forest Tree Species Using QuickBird and Environmental Data


Abstract
:1. Introduction
1.1. k-Nearest Neighbor
1.2. Support Vector Machine Classification
1.3. Random Forest
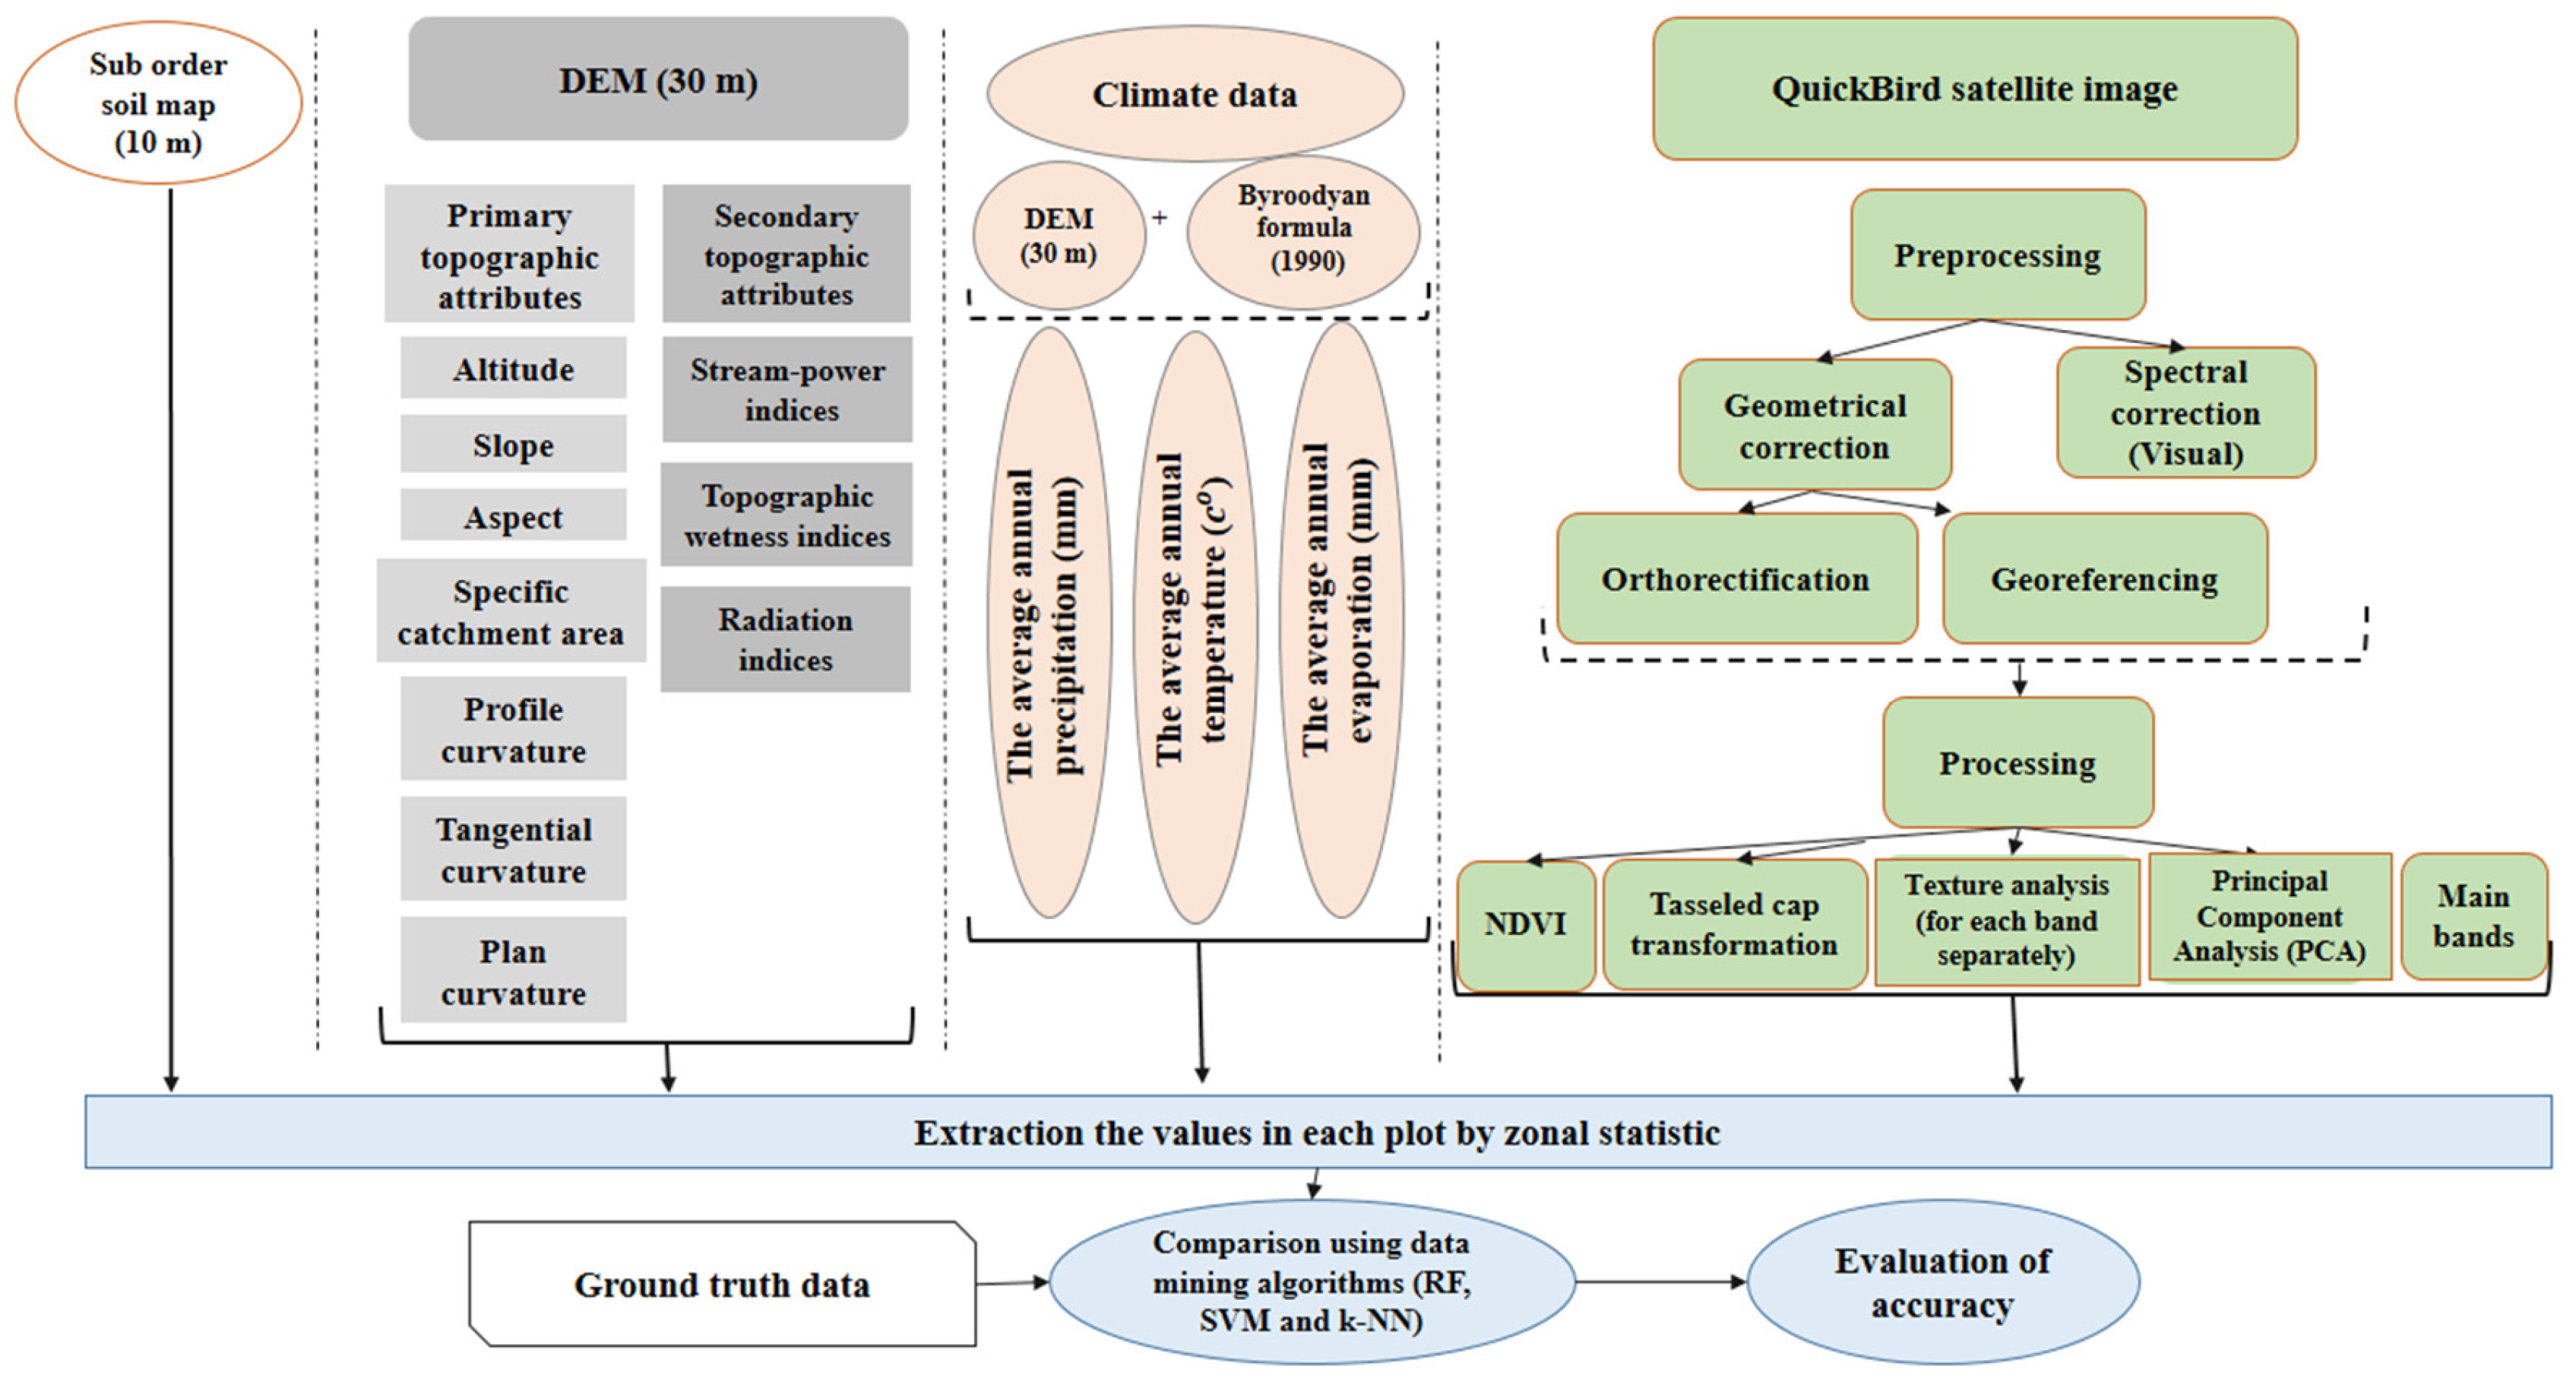
2. Materials and Methods
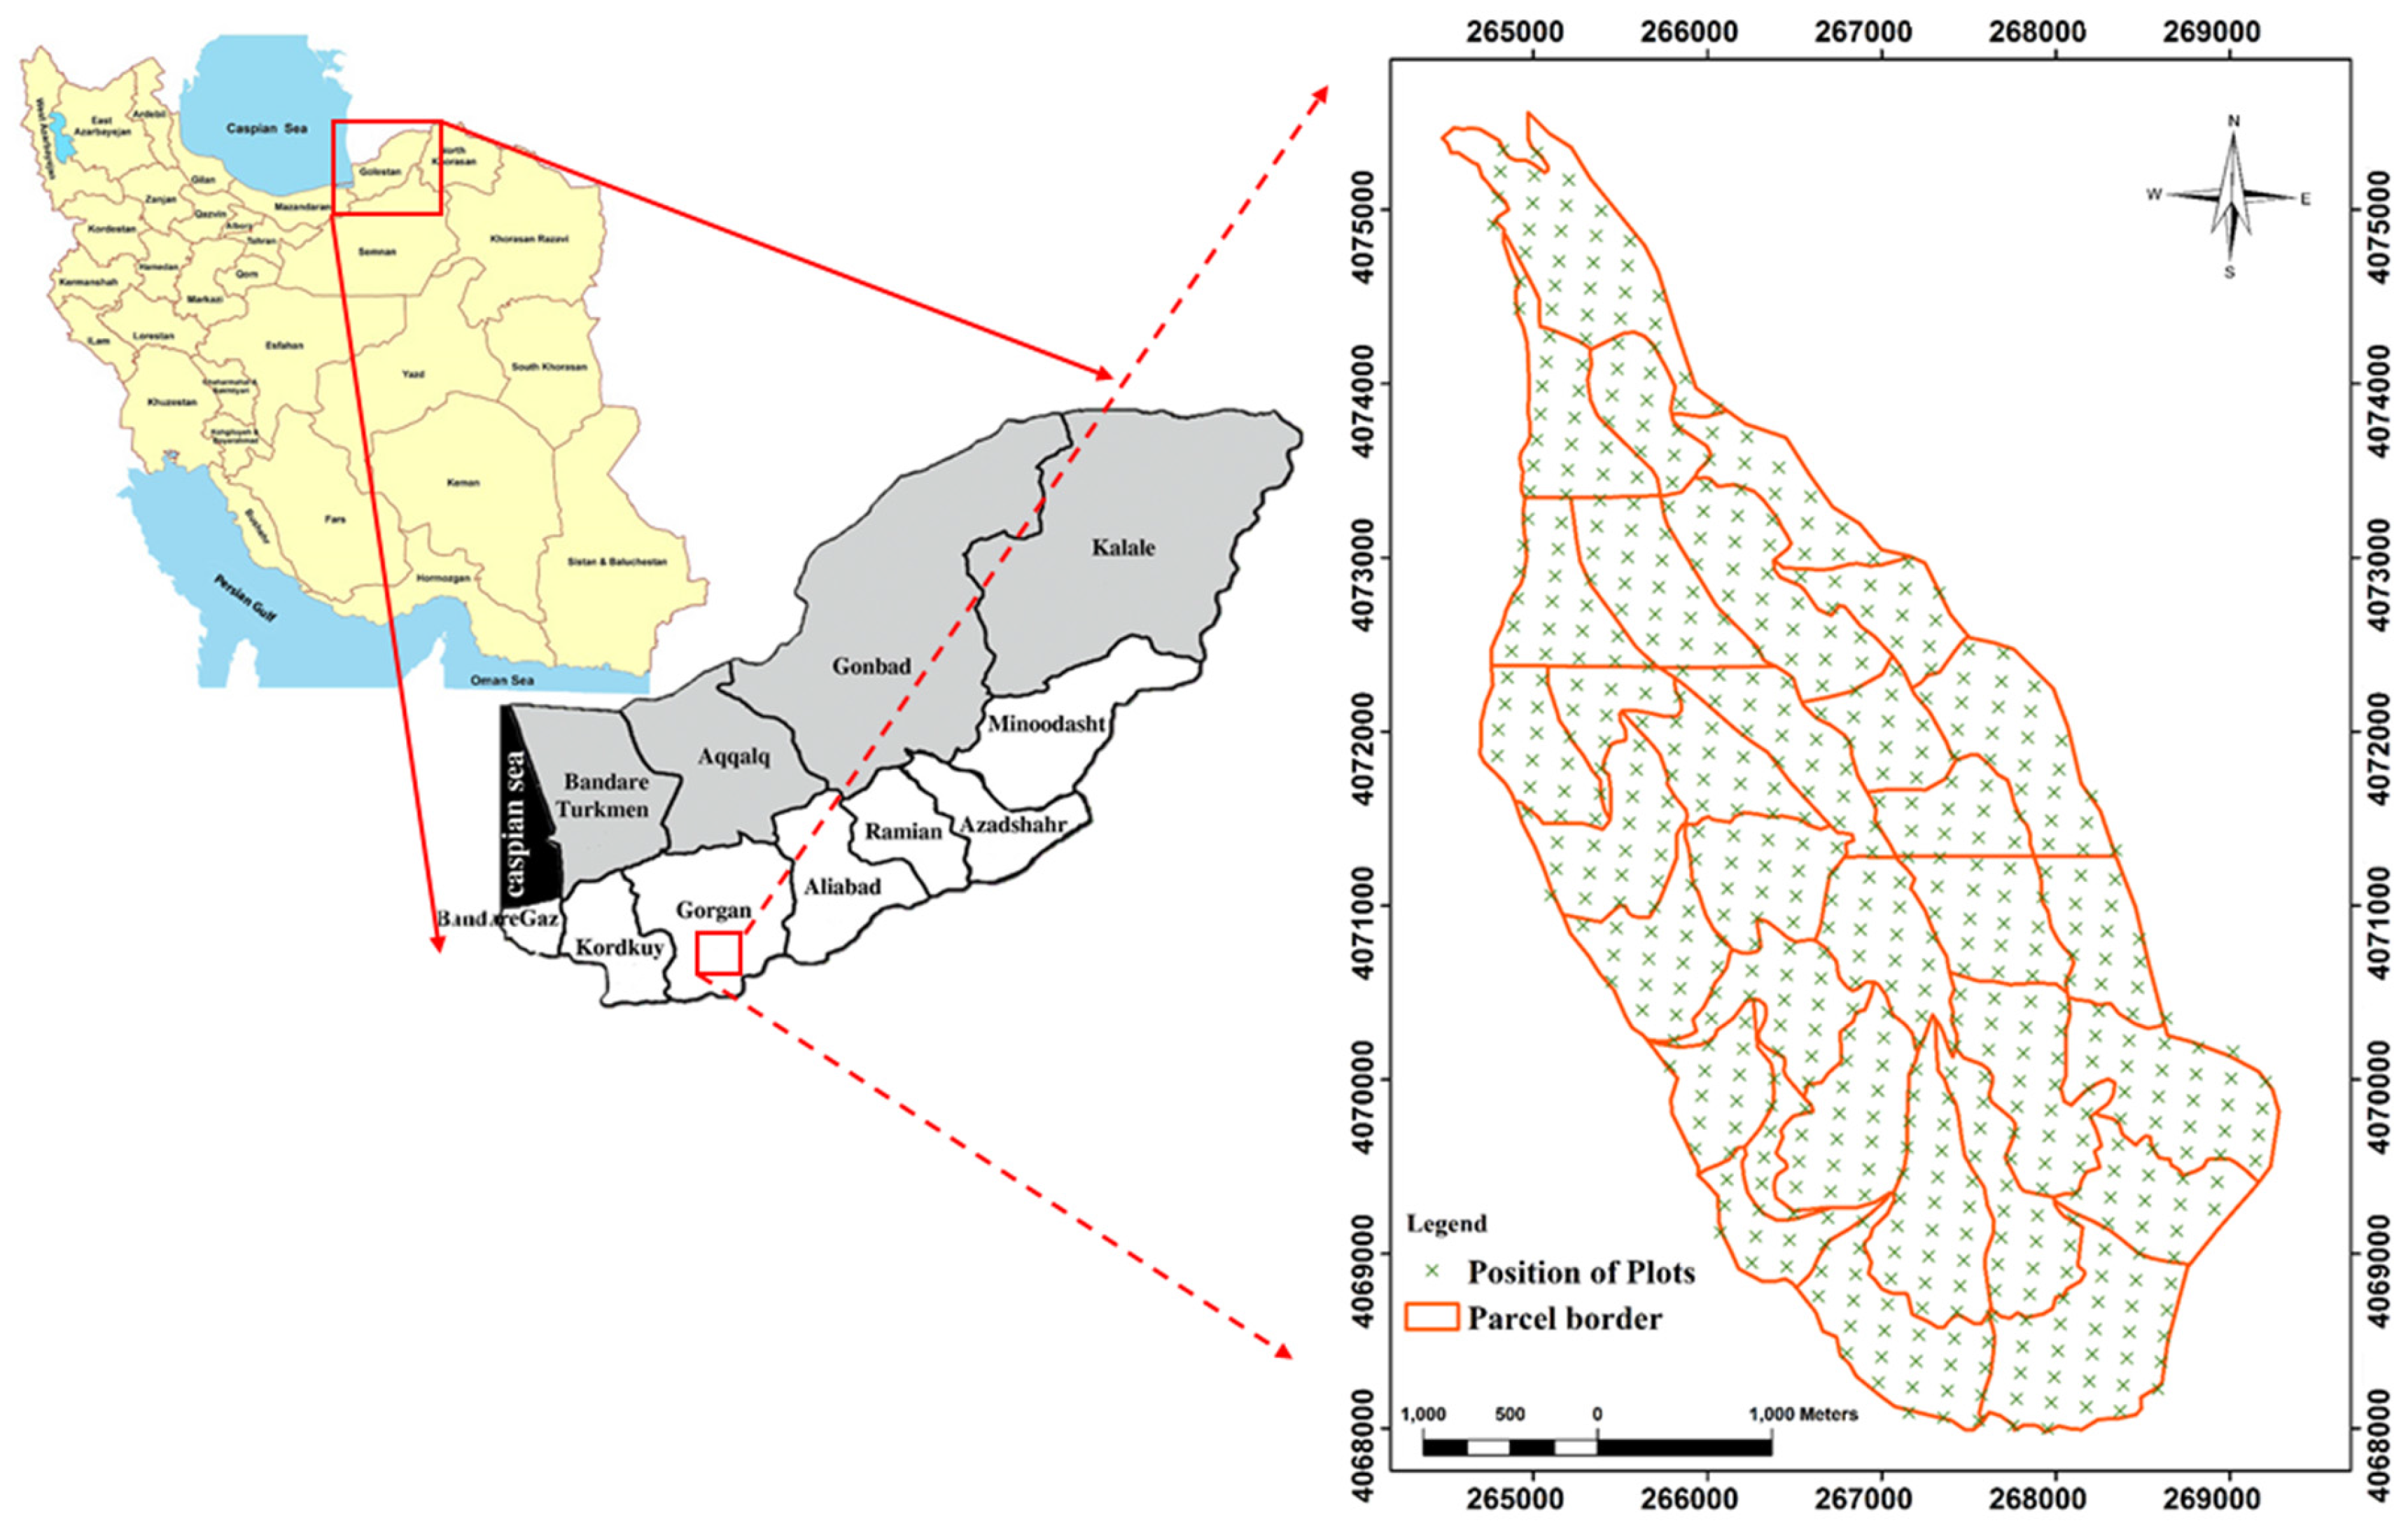
2.1. Study Area
2.2. Field Survey
2.3. Environmental Data
2.4. QuickBird Data
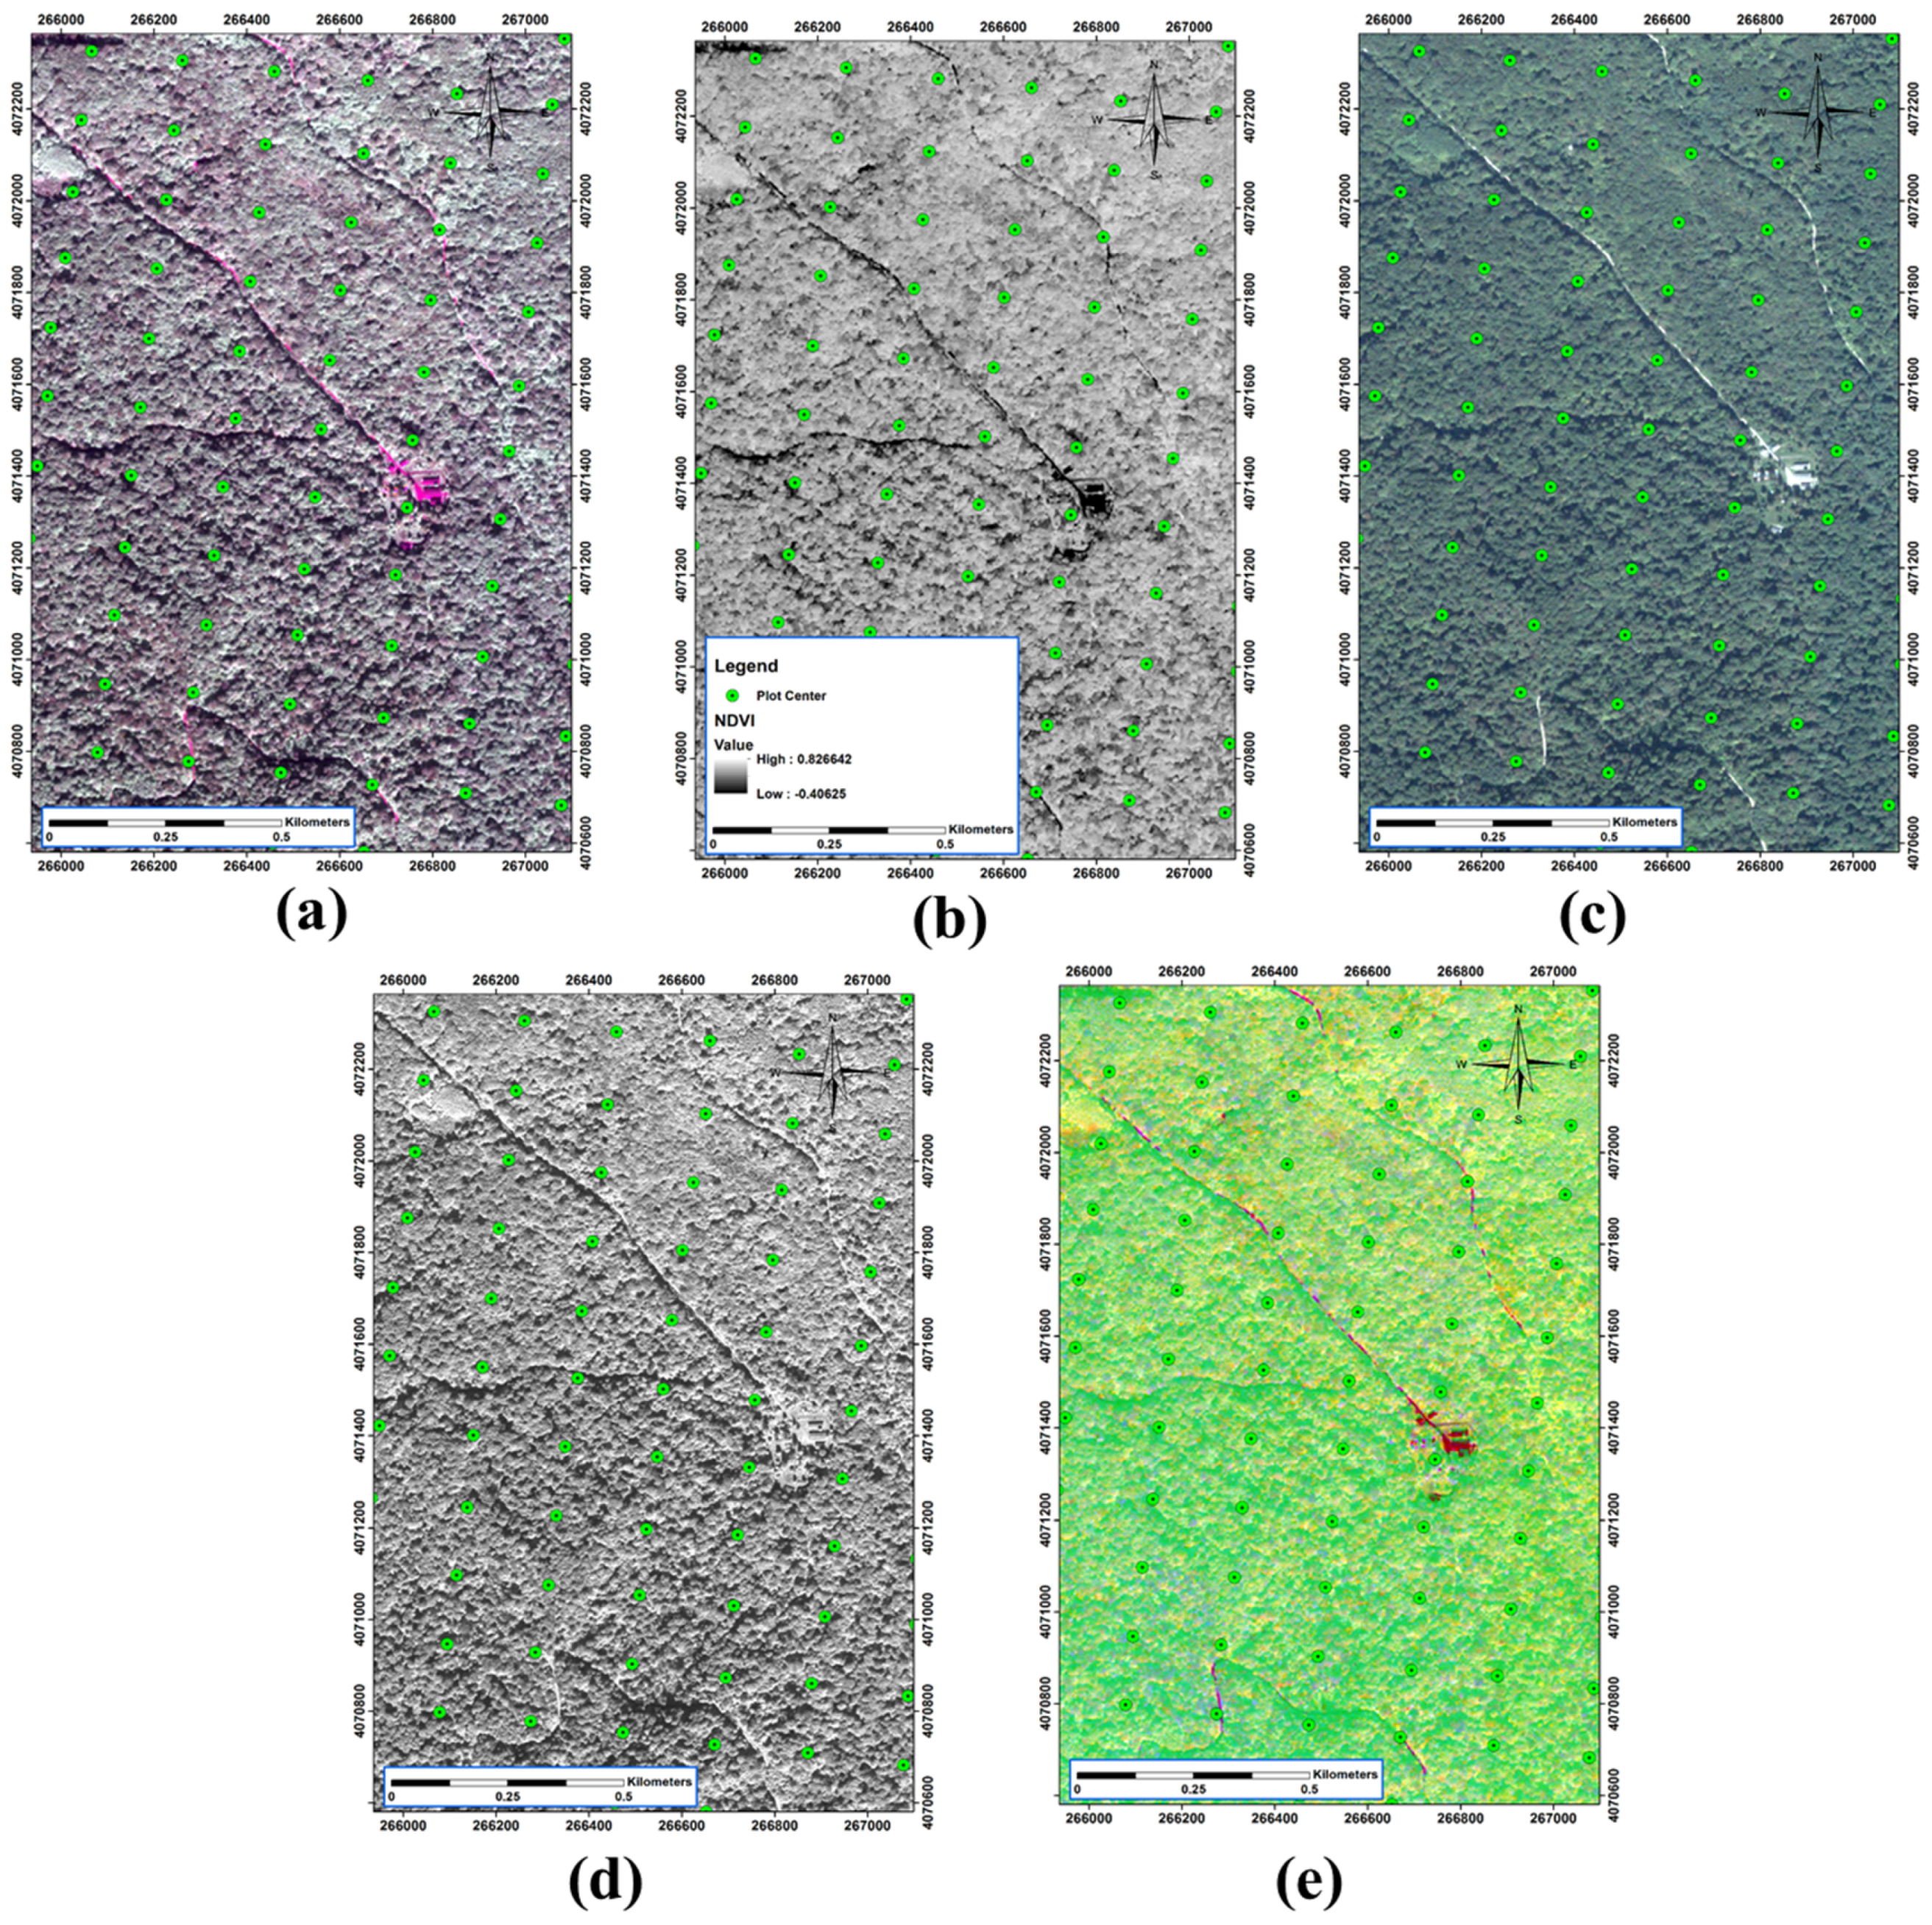
2.5. Pre-Processing and Processing of Spectral Data
2.6. Extracting Data
2.7. Randomly Stratified Sample Splitting Method
2.8. Implementation of Machine Learning Methods
3. Results and Discussion
3.1. Topographic Variables
3.2. Climate
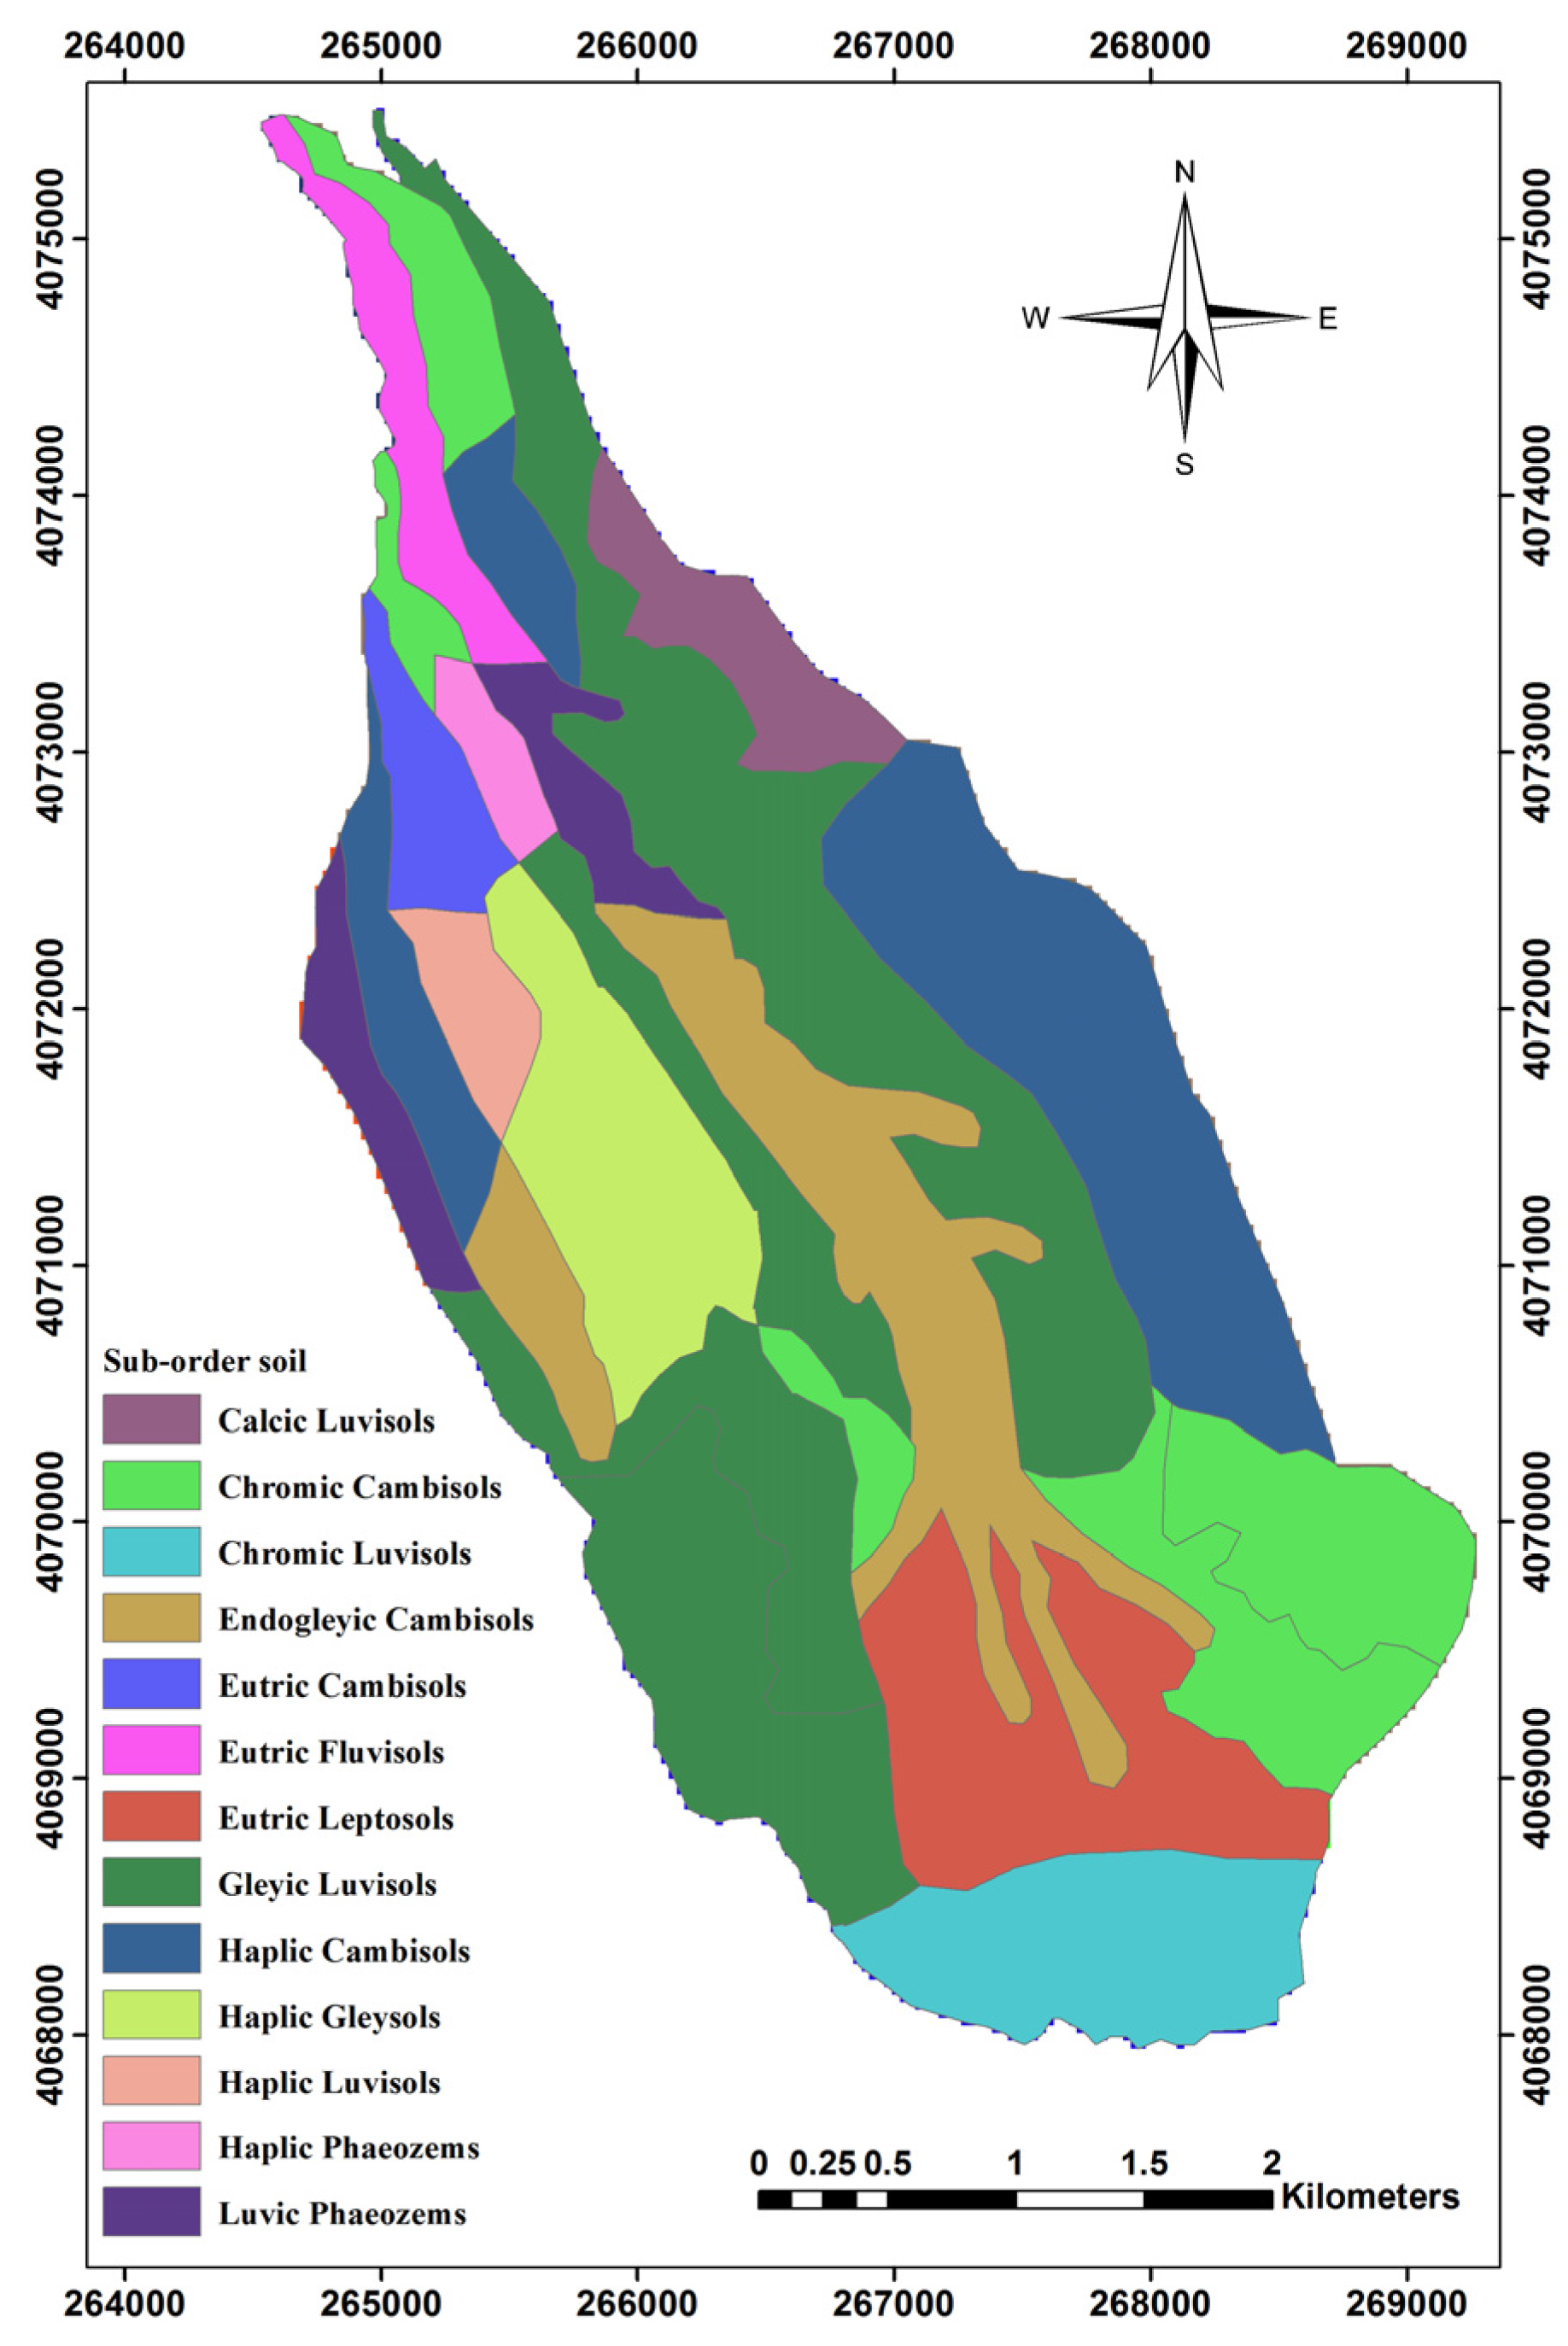
3.3. Sub-Order Soil
3.4. Spectral Data
4. Conclusions
Acknowledgments
Author Contributions
Conflicts of Interest
References
- Food and Agriculture Organization. Forests and the Forestry Sector. Available online: http://www.fao.org/forestry/site/23747/en/Iran (accessed on 21 December 2009).
- Shataee, S.; Kalbi, S.; Fallah, A.; Pelz, D. Forest attribute imputation using machine-learning methods and ASTER data: Comparison of k-NN, SVR and RF regression algorithms. Int. J. Remote Sens. 2012, 19, 6254–6280. [Google Scholar] [CrossRef]
- Guyot, V.; Castagneyrol, B.; Vialatte, A.; Deconchat, M.; Selvi, F.; Bussotti, F.; Jactel, H. Tree diversity limits the impact of an invasive forest pest. PLoS ONE 2015, 10, e0136469. [Google Scholar] [CrossRef] [PubMed]
- Austin, M.P. Spatial prediction of species distribution: On interface between ecological theory and statistical modelling. Ecol. Model. 2002, 157, 101–118. [Google Scholar] [CrossRef]
- Ferrier, S.; Watson, G.; Pearce, J.; Drielsma, M. Extended statistical approaches to modelling spatial pattern in biodiversity in northeast New South Wales. I. Species-level modelling. Biodiv. Conserv. 2002, 11, 2275–2307. [Google Scholar] [CrossRef]
- Boyd, D.S.; Danson, F.M. Satellite remote sensing of forest resources: Three decades of research development. Prog. Phys. Geogr. 2005, 29, 1–26. [Google Scholar] [CrossRef]
- Salajanu, D.M.; Jacobs, D. Predicting Spatial Distribution of Privet (ligustrum spp.) In South Carolina from MODIS and forest Inventory Plot data. In Proceedings of the 17th Willam T. Memorial Remote Sensing Symposium, Denver, CO, USA, 1–20 November 2008.
- Shataee, S.H. Course Seeks Maps of Forest Types Using Satellite Data (Case Study Kheyroud Kenar Noushahr). Ph.D. Thesis, Faculty of Forestry, Tehran, Iran, 2003. [Google Scholar]
- Mohammadi, J.; Shataee, S.H.; Babanezhad, M. Estimation of forest stand volume, tree density and biodiversity using Landsat ETM + Data, comparison of linear and regression tree analyses. Procedia Environ. Sci. 2011, 7, 299–304. [Google Scholar] [CrossRef]
- Sheeren, D.; Fauvel, M.; Josipovic, V.; Lopes, M.; Planque, C.; Willm, J.; Dejoux, J.F. Tree species classification in temperate forests using Formosat-2 satellite image time series. Remote Sens. 2016, 8, 734. [Google Scholar] [CrossRef]
- Féret, J.B.; Asner, G.P. Tree species discrimination in tropical forests using airborne imaging spectroscopy. IEEE Trans. Geosci. Remote Sens. 2012, 51, 73–84. [Google Scholar] [CrossRef]
- Ghiyamat, A.; Shafri, H.Z.; Mahdiraji, G.A.; Shariff, A.R.M.; Mansor, S. Hyperspectral discrimination of tree species with different classifications using single- and multiple-endmember. Int. J. Appl. Earth Obs. Geoinf. 2013, 23, 177–191. [Google Scholar] [CrossRef]
- George, R.; Padaliab, H.; Kushwahab, S.P. Forest tree species discrimination in western Himalaya using EO-1 Hyperion. Int. J. Appl. Earth Obs. Geoinf. 2014, 28, 140–149. [Google Scholar] [CrossRef]
- Dalponte, M.; Bruzzone, L.; Gianelle, D. Tree species classification in the Southern Alps based on the fusion of very high geometrical resolution multispectral/hyperspectral images and LiDAR data. Remote Sens. Environ 2012, 123, 258–270. [Google Scholar] [CrossRef]
- Engler, R.; Waser, L.T.; Zimmermann, N.E.; Schaub, M.; Berdos, S.; Ginzler, C.; Psomas, A. Combining ensemble modeling and remote sensing for mapping individual tree species at high spatial resolution. For. Ecol. Manag. 2013, 310, 64–73. [Google Scholar] [CrossRef]
- Ghosh, A.; Fassnacht, F.E.; Joshia, P.K.; Koch, B. A framework for mapping tree species combining hyperspectral and LiDAR data: Role of selected classifiers and sensor across three spatial scales. Int. J. Appl. Earth Obs. Geoinf. 2014, 26, 49–63. [Google Scholar] [CrossRef]
- Holmgren, J.; Persson, A.; Soderman, U. Species identification of individual trees by combining high resolution LiDAR data with multi-spectral images. Int. J. Remote Sens. 2008, 29, 1537–1552. [Google Scholar] [CrossRef]
- Guisan, A.; Zimmermann, N.E. Predictive habitat distribution models in ecology. Ecol. Model. 2000, 135, 147–186. [Google Scholar] [CrossRef]
- Kint, V.; Van Meirvence, M.; Nachtergale, L.; Gendens, G.; Lust, N. Spatial methods for quantifying forest stand structures development. A comparison between nearest neighbor indices and variogram analysis. For. Sci. 2003, 49, 36–49. [Google Scholar]
- Hunter, J.T. Factors affecting range size differences for plant species on rock outcrops in eastern Australia. Divers. Distrib. 2003, 9, 211–220. [Google Scholar] [CrossRef]
- Wilson, M.F.G.; O’Connell, B.; Brown Connell, B.; Brown, C.; Guinan, J.C.; Grehan, A.G. Multiscale terrain analysis of multibeam bathymetry data for habitat mapping on the continental slope. Mar. Geod. 2007, 30, 3–35. [Google Scholar] [CrossRef]
- Ejtehadi, H.; Sepehry, A.; Horvath, F. Separability of forest vegetation type using environmental variables including elevation, slop, aspect and direct incoming solar radiation: A GIS application. In Proceedings of the 5th Conference on Geographic Information System, National Cartographic Center (NCC), Tehran, Iran, 10 May 1998.
- Garzona, M.; Blazekb, B.; Netelerb, M.; Sanchez de Diosa, R.; Sainz Olleroa, H.; Furlanellob, C. Predicting habitat suitability with machine learning models: The potential area of Pinus sylvestris L. in the Iberian Peninsula. Ecol. Model. 2006, 197, 383–393. [Google Scholar] [CrossRef]
- Ghanbari, F.; Shataee, S.H.; Mohseni, A.; Habashi, H. Using a logistic regression model to predict the spatial characteristics of topography and forest type (case study of a forest series Shastklath Gorgan). J. Res. For. Poplar Res. 2011, 19, 27–41. [Google Scholar]
- Mellert, K.H.; Fensterer, V.; Küchenhoff, H.; Reger, B.; Kölling, C.; Klemmt, H.J.; Ewald, J. Hypothesis-driven species distribution models for tree species in the Bavarian Alps. J. Veg. Sci. 2011, 22, 635–646. [Google Scholar] [CrossRef]
- Peffer, K.; Pebesma, E.J.; Burrough, P.A. Mapping alpine vegetation using vegetation observation and topographic Attributes. Lands. Ecol. 2003, 18, 759–776. [Google Scholar] [CrossRef]
- Navroudi, B.H.; Namiranian, M.; Mohanjer, M.M.; Azizi, P. Effect of aspect and altitude above sea level on the amount of volume of natural Rashstanhay. Iran. J. Nat. Resour. 2000, 53, 201–215. (In Persian) [Google Scholar]
- Mehdinya, T.; Ejtehadi, H.; Sepehri, A. Physiographic variables and the correlation between rainfall and vegetation communities present in the watershed of the Babol, Mazandaran province using geographic information systems. J. Agric. Sci. Nat. Resour. 2006, 13, 107–199. (In Persian) [Google Scholar]
- Wong, C.S.C.; Li, X.; Thornton, I. Urban environmental geochemistry of trace metals. Environ. Pollut. 2006, 142, 1–16. [Google Scholar] [CrossRef] [PubMed]
- Shataee, S.H. Improved classification of forest types by combining spectral data and help establish a method to determine the probability of occurrence of classes of models. Nat. Mapp. Agency 2004, 83, 1–6. [Google Scholar]
- Mohammadi, J.; Shataee, S.H.; Yaghmaee, F.; Mahiney, A. Modelling forest stand volume and tree density using Landsat ETM+ data. Int. J. Remote Sens. 2010, 7, 2959–2975. [Google Scholar] [CrossRef]
- Wheatley, J.M.; Wilson, J.P.; Redmond, R.L.; Ma, Z.; Dibenedetto, J. Automated land cover mapping using Landsat thematic mapper images and topographic attributes. In Terrain Analysis, Principles and Applications; Wilson, J.P., Gallant, J.C., Eds.; John Wiley and Sons: Hoboken, NJ, USA, 2000. [Google Scholar]
- Saatchi, S.; Buermann, W.; Steege, H.; Mori, S.; Smith, B. Modelling distribution of Amazonian tree species and diversity using remote sensing measurements. Remote Sens. Environ. 2008, 112, 2000–2017. [Google Scholar] [CrossRef]
- Wang, X.P.; Tan, Z.Y.; Fang, J.Y. Climatic Control on Forests and Tree Species Distribution in the Forest Region of Northeast China. J. Integrative Plant Biol. 2006, 48, 778–789. [Google Scholar] [CrossRef]
- Hernández-Stefanoni, J.L.; Gallardo-Cruz, J.A.; Meave, J.A.; Dupuy, J.M. Combining geostatistical models and remotely sensed data to improve tropical tree richness mapping. Ecol. Indic. 2011, 11, 1046–1056. [Google Scholar] [CrossRef]
- Adhikari, D.; Barik, S.K.; Upadhaya, K. Habitat distribution modelling for reintroduction of Ilex khasiana Purk, a critically endangered tree species of northeastern India. Ecol. Eng. 2012, 40, 37–43. [Google Scholar] [CrossRef]
- Riemer-Sørensen, S.; Parkinson, D.; Davis, T.M. Simultaneous constraints on the number and mass of rekativistic species. Astrophys. J. 2013, 30, 763. [Google Scholar]
- Hall, R.J.; Skakun, R.S.; Arsenault, E.J.; Case, B.S. Modelling forest stand structure attributes using Landsat ETM+ data: Application to mapping of aboveground biomass and stand volume. For. Ecol. Manag. 2006, 225, 378–390. [Google Scholar] [CrossRef]
- Gebreslasie, M.T.; Ahmed, F.B.; Aardt, J. Estimating plot-level forest structural attributes using high spectral resolution ASTER satellite data in even-aged Eucalyptus plantations in southern KwaZulu-Natal, South Africa. South. For. 2008, 70, 1–10. [Google Scholar]
- Hyvonen, P. The Updating of Forest Resource Data for Management Planning for Privately Owned Forests in Finland. Ph.D. Thesis, Faculty of Forestry, Joensuu, FL, USA, 2007. [Google Scholar]
- McRobert, R.; Tomppo, E.; Finley, A.; Heillinen, J. Estimating aerial means and variances of forest attributes using the k-nearest neighbor’s technique and satellite imagery. Remote Sens. Environ. 2007, 111, 466–480. [Google Scholar] [CrossRef]
- Sironen, S.; Kangas, A.; Maltamo, M. Comparison of different non-parametric growth imputation methods in the presence of correlated observations. Forestry 2010, 83, 39–51. [Google Scholar] [CrossRef]
- Franklin, J.; Mc Cullough, P.; Gray, C. Terrain variables used for predictive mapping of vegetation communities in southern California. In Terrain Analysis, Principles and Applications; Wilson, J.P.L., Gallent, J.C., Eds.; John Wiley & Sons: Hoboken, NJ, USA, 2000. [Google Scholar]
- Franco-Lopez, H.; Ek, A.R.; Bauer, M.E. Estimation and mapping of forest stand density, volume, and cover type using the k-nearest neighbor’s method. Remote Sens. Environ. 2001, 77, 251–274. [Google Scholar]
- Katila, M.; Tomppo, E. Selecting estimation parameters for the Finnish multisource national forest inventory. Remote Sens. Environ. 2001, 76, 16–32. [Google Scholar] [CrossRef]
- Ohmann, J.L.; Gregory, M.J. Predictive mapping of forest composition and structure with direct gradient analysis and nearest neighbor imputation in coastal Oregon, U.S.A. Can. J. For. Res. 2002, 32, 725–741. [Google Scholar] [CrossRef]
- Makela, H.; Pekkarinen, A. Estimation of forest stands volumes by Landsat TM imagery and stand-level field-inventory data. For. Ecol. Manag. 2004, 196, 245–255. [Google Scholar] [CrossRef]
- Finley, A.O.; McRobert, R.E.; Ek, A.R. Applying an efficient k-nearest neighbor search to forest attribute imputation. For. Sci. 2006, 52, 130–135. [Google Scholar]
- Tatjana, K.; Suppan, F.; Schneider, W. The impact of relative radiometric calibration on the accuracy of k-NN predictions of forest attributes. Remote Sens. Environ. 2007, 110, 431–437. [Google Scholar]
- Walton, J.T. Sub pixel urban land cover estimation: Comparing cubist, random forests, and support vector regression. Photogramm. Eng. Remote Sens. 2008, 74, 1213–1222. [Google Scholar] [CrossRef]
- Cortez, P.; Morais, A. A data mining approach to predict forest fires using meteorological data. In Proceedings of the EPIA 2007—Portuguese Conference on Artificial Intelligence, Guimarães, Portugal, 3–7 December 2007.
- Durbha, S.S.; King, R.L.; Younan, N.H. Support vector machines regression for retrieval of leaf area index from multiangle imaging spectroradiometer. Remote Sens. Environ. 2007, 107, 348–361. [Google Scholar] [CrossRef]
- Zhang, R.; Ma, J. An improved SVM method P-SVM for classification of remotely sensed data. Int. J. Remote Sens. 2008, 29, 6029–6036. [Google Scholar] [CrossRef]
- Shafri, H.Z.M.; Ramle, F.S.H. A comparison of support vector machine and decision tree classifications using satellite data of Langkawi islands. Inf. Technol. J. 2009, 8, 64–70. [Google Scholar] [CrossRef]
- Ostapowicz, K.; Lakes, T.; Kozak, J. Modelling of land cover change using support vector machine. In Proceedings of the 13th AGILE International Conference on Geographic Information Science, Guimarães, Portugal, 10–14 May 2010.
- Breiman, L. Random Forests. Mach. Learn 2001, 45, 5–32. [Google Scholar] [CrossRef]
- Breiman, L. Using Models to Infer Mechanisms. IMS Wald Lecture 2. Available online: http://www.stat.berkeley.edu/~breiman/wald2002–2.pdf (accessed on 19 September 2002).
- Statistica. Electronic Text Book, Stat Soft Inc. Available online: http://www.Statsoft.com (accessed on 20 November 2010).
- Garzón, M.B.; Dios, R.S.; Ollero, H.S. Effects of climate change on the distribution of Iberian tree species. Appl. Veg. Sci. 2008, 11, 169–178. [Google Scholar] [CrossRef]
- Byroodyan, M. Weather and Climatology (Ghare Sou River watershed studies). Agric. Publ. 1990, 13, 300. (In Persian) [Google Scholar]
- Beven, K.J.; Kirkby, M.J. A physically based, variable contributing area model of basin hydrology. Hydrol. Sci. Bull. 1979, 24, 43–69. [Google Scholar] [CrossRef]
- Moore, I.D.; Gessler, P.E.; Nielsen, G.A.; Petersen, G.A. Terrain attributes: Estimation methods and scale effects. In Modelling Change in Environmental Systems; Jakeman, A.J., Beck, M.B., McAleer, M., Eds.; Wiley: London, UK, 1993; pp. 189–214. [Google Scholar]
- Wilson, J.P.; Gallant, J.C. Terrain Analysis: Principles and Applications; John Wiley and Sons: Hoboken, NJ, USA, 2000. [Google Scholar]
- Kardgar, N. Accuracy Assessment of Soil Maps in Dr. Bahramnia Forestry Plan Bahramnia (Section A). Master’s Thesis, Faculty of Forestry, Tehran, Iran, 2012. [Google Scholar]
- DigitalGlobe. QuickBird Satellite Imagery Products. Product Guide. Available online: http://www.glcf.umd.edu/library/guide/QuickBird_Product_Guide.pdf (accessed on 1 May 2006).
- Keller, F. Evaluation, Connectionist and Statistical Language Processing. Lecture. Available online: http://www.coli.unisaarland.de/~crocker/Teaching/Connectionist/lecture114up.pdf (accessed on 7 July 2010).
- McRobert, R.E. Diagnostic tools for nearest neighbor techniques when used with satellite imagery. Remote Sens. Environ. 2009, 113, 489–499. [Google Scholar] [CrossRef]
- Nilsson, M. Estimation of Forest Variables Using Satellite Image Data and Airborne LiDAR. Ph.D. Thesis, Faculty of Forest Science, Umeå, Sweden, 1997. [Google Scholar]
- Reese, H.; Nilsson, M.; Sandstrom, P.; Olsson, H. Applications using estimates of forest parameters derived from satellite and forest inventory data. Comput. Electr. Agric. 2002, 37, 37–55. [Google Scholar] [CrossRef]
- Gu, H.Y.; Dai, L.M.; WU, G.; Xu, D.; Wang, S.Z.; Wang, H. Estimation of forest volumes by integrating Landsat TM imagery and forest inventory data. Sci. Chin. Ser. E Technol. Sci. 2006, 49, 54–62. [Google Scholar] [CrossRef]
- Kutzer, C. Potential of the k-NN Method for Estimation and Monitoring Off-Reserve Forest Resources in Ghana. Ph.D. Thesis, Faculty of Forest and Environmental Sciences, Albert-Ludwigs Universität, Freiburg im Breisgau, Germany, 2008. [Google Scholar]
- Kozma, L. k-Nearest Neighbor Algorithm (k-NN). Helsinki University of Technology Special Course in Computer and Information Science. Available online: http://www.lkozma.net/knn2.pdf (accessed on 20 February 2008).
- Larose, D.T.; Larose, C.D. k-Nearest neighbor algorithm. In Discovering Knowledge in Data: An Introduction to Data Mining, 2nd ed.; John Wiley & Sons, Inc.: Hoboken, NJ, USA, 2014; pp. 1–316. [Google Scholar]
- Wang, Y.; Wang, J.X.; Du, W.; Wang, C.C.; Liang, Y.C.; Zhou, C.G.; Huang, L. Immune particle swarm optimization for support vector regression on forest fire prediction. Int. Symp. Neural Netw. Adv. Neural Netw. 2009, 5552, 382–390. [Google Scholar]
- Chang, C.C.; Lin, C.J. LIBSVM: A library for support vector machines (Taipei: Department of Computer Science, National Taiwan University). Available online: http://www.csie.ntu.edu.tw/~cjlin/papers/libsvm.pdf (accessed on 4 March 2013).
- Schölkopf, B.; Smola, A.; Muller, K.R. Nonlinear component analysis as a kernel eigen value problem. Neural Comput. 1998, 10, 1299–1319. [Google Scholar] [CrossRef]
- Mattera, D.; Haykin, S. Support vector machines for dynamic reconstruction of a chaotic system. In Workshop in Advances in Kernel Methods: Support Vector Learning; Schölkopf, B., Burges, C.J.C., Smola, A.J., Eds.; MIT Press: Cambridge, MA, USA, 1999. [Google Scholar]
- Zimmermann, N.E.; Kienast, F. Predictive mapping of alpine grassland in Switzerland: Species versus community approach. J. Veg. Sci. 1999, 10, 469–482. [Google Scholar] [CrossRef]
- Mohammadi, J. Pedometery (Geographic Information Systems), 1st ed.; Pelk Publication: Tehran, Iran, 2006; pp. 1–637. [Google Scholar]
- Guoyu, L. Topography related spatial distribution of dominant tree species in a tropical seasonal rain forest in China. For. Ecol. Manag. 2011, 262, 1507–1513. [Google Scholar]
- Urli, M.; Delzon, S.; Eyermann, A.; Couallier, V.; García-Valdés, R.; Zavala, M.A.; Porté, A.J. Inferring shifts in tree species distribution using asymmetric distribution curves: A case study in the Iberian mountains. INRA Sci. Impact 2013, 25, 147–159. [Google Scholar] [CrossRef]
- Chahouki, M.A.Z.; Ahvazi, L.K.; Azarnivand, H. Comparison of three modelling approaches for predicting plant species distribution in mountainous scrub vegetation (Semnan rangelands, Iran). Pol. J. Ecol. 2012, 60, 277–289. [Google Scholar]
- McKenney, D.W.; Pedlar, J.H. Spatial models of site index based on climate and soil properties for two boreal tree species in Ontario, Canada. For. Ecol. Manag. 2003, 175, 497–507. [Google Scholar] [CrossRef]
- Stephenson, C.M.; Mackenzie, M.L.; Edwards, C.; Travis, J.M.J. Modelling establishment probabilities of an exotic plant, Rhododendron ponticum, invading a heterogeneous woodland landscape using logistic regression with spatial autocorrelation. Ecol. Model. 2006, 193, 747–758. [Google Scholar] [CrossRef]
- Shataee, S.H. Course Booklet Remote Sensing; Faculty of Forestry, Gorgan University of Agricultural Sciences and Natural Resources: Gorgan, Iran, 2005. [Google Scholar]
- Hernández, P.A.; Franke, I.; Herzog, S.K.; Pacheco, V.; Paniagua, L.; Quintana, H.L.; Soto, A.; Swenson, J.J.; Tovar, C.; Valqui, T.H.; et al. Predicting species distributions in poorly-studied landscapes. Biodivers. Conserv. 2008, 17, 1353–1366. [Google Scholar] [CrossRef]
- Yanoviak, S.P.; Gora, E.M.; Fredley, J.; Bitzer, P.M.; Muzika, R.M.; Carson, W.P. Direct effects of lightning in temperate forests: A review and preliminary survey in a hemlock–hardwood forest of the northern United States. Can. J. For. Res. 2015, 45, 1258–1268. [Google Scholar] [CrossRef]
- Kernes, B.K.; Ohmann, J.L. Evaluation and prediction of shrub cover in coastal Oregen forests (USA). Catena 2004, 55, 341–365. [Google Scholar]
- Freeman, E.A.; Moisen, G.G.; Frescino, T.S. Evaluating effectiveness of down-sampling for stratified designs and unbalanced prevalence in Random Forest models of tree species distributions in Nevada. Ecol. Model. 2012, 233, 1–10. [Google Scholar] [CrossRef]
- Naidoo, L.; Mathieu, R.; Main, R.; Kleynhans, W.; Wessels, K.; Asner, P.G.; Leblon, B. The assessment of data mining algorithms for modelling Savannah Woody cover using multi-frequency (X-, C- and L-band) synthetic aperture radar (SAR) datasets. In Proceedings of the 2014 IEEE Geoscience and Remote Sensing Symposium, Quebec City, QC, Canada, 14 July 2014.


| Species Name | Minimum of Cross Section Area (cm2) | Maximum of Cross Section Area (cm2) | Average of Cross Section Area (cm2) | Basal Area (cm2) |
|---|---|---|---|---|
| Fagus orientalis L. | 78.50 | 18,859.62 | 2514.16 | 3,539,937.87 |
| Carpinus betulus L. | 78.50 | 20,096 | 1568.18 | 5,087,192.50 |
| Quercus castanaefolia L. | 78.50 | 9498.5 | 689.99 | 234,597.25 |
| Alnus miller L. | 78.50 | 18,859.62 | 795.95 | 506,226.87 |
| Acer velutinum L. | 176.60 | 1256 | 330.35 | 11,892.75 |
| Zelkova carpinifolia Pall. | 78.50 | 5671.62 | 330.20 | 200,430.12 |
| Diospyros lotus L. | 78.50 | 5671.62 | 330.20 | 200,430.12 |
| Parrotia persica D.C. | 78.50 | 13,266.50 | 703.41 | 3,014,812.12 |
| Other species | 176.62 | 3316.62 | 488.11 | 83,955.75 |
| Characteristic | Definition | Importance |
|---|---|---|
| Altitude | elevation | vegetation, climate conditions, solar energy |
| Slope | gradient | flow rate, precipitation, vegetation, flow velocity, soil conditions |
| Aspect | slope azimuth | evapotranspiration, species distribution (fauna and flora), solar energy |
| Specific catchment area | used to estimate saturation excess overland flow | runoff volume and rate, soil characteristics, water viscosity, geomorphological conditions |
| Profile curvature | slope profile curvature | runoff acceleration, erosion/deposition percentage, geomorphological conditions |
| Tangential curvature | plan curvature multiplied by slope | an alternative measure of local flow conditions and divergence |
| Plan curvature | contour curvature | soil and water content, soil characteristics |
| Characteristics | Definition | Importance |
|---|---|---|
| Stream power indices (SPI) | SPI = AstanβR where: As—specific catchment area, βR—local slope angle. | It is a measure of erosive power of flowing water, predicts tangential concavity and net deposition in areas of profile concavity and net erosion in areas of profile convexity. |
where: LS—length-slope factor, M = 0, As—specific catchment area (m2·m–1), m = 0.4, β (°)—slope gradient, n = 1.3. | It is the Revised Universal Soil Loss Equation in certain circumstances, predicts locations of net erosion and net deposition areas. | |
| Topographic wetness index | where: a—local upslope area draining through a certain point per unit contour length, b—local slope in radians. | For steady-state flow conditions, it describes the spatial distribution of the saturation zone for runoff generation, soil transition, slope gradient. |
| Radiation indices | where: Rne—estimated net radiation (W·m−2), α—albedo (dimensionless), —incoming short wave solar radiation (W·m–2), σ—Stefan-Boltzmann constant (5.67 × 10⁻⁸ W·m−2·0K−4), εa—atmospheric emissivity (dimensionless), determined according to equation εa = φ(ea /Ta)1/7 φ—empirical coefficient, ea—air vapor pressure (kPa), Ta—air temperature (°K), εs—surface emissivity (dimensionless), Ts—surface temperature (°K). | The three main terms account for direct-beam, diffuse, and reflected irradiance. A variety of methods are used by different authors to calculate these individual components. The methods vary tremendously in terms of sophistication, input data, and accuracy. |
| Sub-Order Soil | Area (ha) | Area (%) |
|---|---|---|
| Calcic Luvisols | 48.07 | 2.82 |
| Chromic Cambisols | 206.93 | 12.12 |
| Chromic Luvisols | 106.32 | 6.23 |
| Endogleyic Cambisols | 188.35 | 11.03 |
| Eutric Cambisols | 34.18 | 2 |
| Eutric Fluvisols | 43.99 | 2.58 |
| Eutric Leptosols | 137.37 | 8.05 |
| Gleyic Luvisols | 476.32 | 27.90 |
| Haplic Cambisols | 252.54 | 14.79 |
| Haplic Gleysols | 108.50 | 6.35 |
| Haplic Luvisols | 26.48 | 1.55 |
| Haplic Phaeozems | 17.20 | 1.01 |
| Luvic Phaeozems | 61.10 | 3.58 |
| Component | ||||
|---|---|---|---|---|
| Coefficient | A1 | A2 | A3 | A4 |
| Brightness | 0.319 | 0.542 | 0.490 | 0.604 |
| Greenness | −0.121 | −0.331 | −0.517 | −0.780 |
| Moisture(wetness) | 0.652 | 0.375 | −0.639 | 0.163 |
| Species groups | Training Plots (80%) | Test Plots (20%) | Total |
|---|---|---|---|
| Fagus orientalis L. | 91 | 24 | 115 |
| Carpinus betulus L. | 130 | 34 | 164 |
| Quercus castanaefolia L. | 7 | 2 | 9 |
| Alnus miller L. | 15 | 4 | 19 |
| Acer veutinum L. | 18 | 4 | 22 |
| Zelkova carpinifolia Pall | 1 | 0 | 1 |
| Parrotia persica D.C. | 59 | 15 | 74 |
| Total | 321 | 83 | 404 |
| Variables | Algorithm | Overall Accuracy (%) | Producer Accuracy (%) | User Accuracy (%) | ||||||
|---|---|---|---|---|---|---|---|---|---|---|
| Fagus Orientalis | Carpinus Betulus | Parrotia Persica | Other Species | Fagus Orientalis | Carpinus Betulus | Parrotia Persica | Other Species | |||
| Topography | RF | 62.67 | 91.67 | 88.24 | 0 | 0 | 75 | 52.94 | 0 | 0 |
| SVM | 61.44 | 79.16 | 91.17 | 0 | 0 | 79.16 | 54.38 | 0 | 0 | |
| k-NN | 61.44 | 79.16 | 91.17 | 0 | 0 | 79.16 | 54.38 | 0 | 0 | |
| soil | RF | 53.01 | 58.33 | 88.24 | 0 | 0 | 66.67 | 48.38 | 0 | 0 |
| SVM | 53.01 | 58.33 | 88.24 | 0 | 0 | 66.67 | 48.38 | 0 | 0 | |
| k-NN | 50.6 | 58.34 | 82.35 | 0 | 0 | 66.67 | 57.14 | 0 | 0 | |
| climate | RF | 50.6 | 75 | 67.65 | 13.34 | 0 | 64.51 | 54 | 100 | 0 |
| SVM | 56.62 | 79.17 | 82.35 | 0 | 0 | 65.51 | 50.9 | 0 | 0 | |
| k-NN | 54.42 | 79.16 | 79.41 | 0 | 0 | 67.85 | 55.1 | 0 | 0 | |
| Topography and climate | RF | 62.65 | 87.5 | 91.18 | 0 | 0 | 80.76 | 54.38 | 0 | 0 |
| SVM | 57.831 | 79.16 | 88.23 | 0 | 0 | 73.07 | 51.72 | 0 | 0 | |
| k-NN | 60.24 | 87.5 | 85.29 | 0 | 0 | 75 | 52.73 | 0 | 0 | |
| Topography and soil | RF | 63.85 | 91.67 | 91.18 | 0 | 0 | 80 | 54.38 | 0 | 0 |
| SVM | 61.44 | 87.5 | 88.23 | 0 | 0 | 77.78 | 51.72 | 0 | 0 | |
| k-NN | 61.44 | 79.16 | 91.76 | 6.67 | 0 | 79.16 | 54.38 | 50 | 0 | |
| Climate and soil | RF | 53.01 | 75 | 82.35 | 0 | 0 | 69.23 | 52.73 | 0 | 0 |
| SVM | 56.62 | 75 | 73.75 | 0 | 0 | 58.62 | 48.14 | 0 | 0 | |
| k-NN | 55.42 | 75 | 82.35 | 0 | 0 | 69.23 | 49.12 | 0 | 0 | |
| Topography, soil and climate | RF | 63.85 | 87.5 | 75 | 0 | 0 | 85.29 | 52.73 | 0 | 0 |
| SVM | 61.44 | 91.67 | 91.18 | 0 | 0 | 64.51 | 54 | 0 | 0 | |
| k-NN | 60.24 | 75 | 82.35 | 0 | 0 | 69.23 | 49.12 | 0 | 0 | |
| Spectral data | RF | 54.21 | 87.5 | 70.58 | 0 | 0 | 60 | 50 | 0 | 0 |
| SVM | 54.21 | 87.5 | 70.58 | 0 | 0 | 60 | 50 | 0 | 0 | |
| k-NN | 54.21 | 83.33 | 64.7 | 25 | 0 | 69.23 | 49.12 | 25 | 0 | |
| Topography and spectral | RF | 60.24 | 87.5 | 85.3 | 0 | 0 | 75 | 52.72 | 0 | 0 |
| SVM | 60.24 | 87.5 | 85.29 | 0 | 0 | 72.41 | 53.7 | 0 | 0 | |
| k-NN | 60.24 | 87.5 | 85.29 | 0 | 0 | 72.41 | 53.7 | 0 | 0 | |
| Topography, climate and spectral | RF | 63.85 | 91.67 | 85.3 | 0 | 0 | 75.86 | 53.7 | 0 | 0 |
| SVM | 59.03 | 87.5 | 82.35 | 0 | 0 | 72.41 | 51.85 | 0 | 0 | |
| k-NN | 59.03 | 87.5 | 82.35 | 0 | 0 | 72.41 | 51.85 | 0 | 0 | |
| Spectral and non-spectral data | RF | 57.83 | 95.83 | 79.41 | 0 | 0 | 69.69 | 54 | 0 | 0 |
| SVM | 61.44 | 87.5 | 76.47 | 6.67 | 0 | 63.63 | 53.06 | 100 | 0 | |
| k-NN | 60.24 | 95.83 | 79.41 | 0 | 0 | 69.69 | 54 | 0 | 0 | |
© 2017 by the authors. Licensee MDPI, Basel, Switzerland. This article is an open access article distributed under the terms and conditions of the Creative Commons Attribution (CC BY) license ( http://creativecommons.org/licenses/by/4.0/).
Share and Cite
Abdollahnejad, A.; Panagiotidis, D.; Shataee Joybari, S.; Surový, P. Prediction of Dominant Forest Tree Species Using QuickBird and Environmental Data. Forests 2017, 8, 42. https://doi.org/10.3390/f8020042
Abdollahnejad A, Panagiotidis D, Shataee Joybari S, Surový P. Prediction of Dominant Forest Tree Species Using QuickBird and Environmental Data. Forests. 2017; 8(2):42. https://doi.org/10.3390/f8020042
Chicago/Turabian StyleAbdollahnejad, Azadeh, Dimitrios Panagiotidis, Shaban Shataee Joybari, and Peter Surový. 2017. "Prediction of Dominant Forest Tree Species Using QuickBird and Environmental Data" Forests 8, no. 2: 42. https://doi.org/10.3390/f8020042
APA StyleAbdollahnejad, A., Panagiotidis, D., Shataee Joybari, S., & Surový, P. (2017). Prediction of Dominant Forest Tree Species Using QuickBird and Environmental Data. Forests, 8(2), 42. https://doi.org/10.3390/f8020042