Communication

Adaptive Variation and Introgression of a CONSTANS-Like Gene in North American Red Oaks

by
Jennifer F. Lind-Riehl
1 and
Oliver Gailing
2,*
1
Department of Entomology, University of Wisconsin-Madison, Madison, WI 53706-1598, USA
2
School of Forest Resources and Environmental Science, Michigan Technological University, Houghton, MI 49931-1295, USA
*
Author to whom correspondence should be addressed.
Forests 2017, 8(1), 3; https://doi.org/10.3390/f8010003
Submission received: 21 September 2016 / Revised: 9 December 2016 / Accepted: 13 December 2016 / Published: 22 December 2016

Abstract

:
Oaks provide a model system to study maintenance of species identity by divergent selection since they maintain morphological differences and ecological adaptations despite interspecific hybridization. The genome of closely related interfertile oak species was shown to be largely homogeneous, with a few genomic areas exhibiting high interspecific differentiation possibly as result of strong divergent selection. Previously, a genic microsatellite was identified as under strong divergent selection, being nearly fixed on alternative alleles in the two interfertile North American red oak species: Quercus rubra L. and Quercus ellipsoidalis E.J. Hill. Further genotyping in two other red oak species—Quercus velutina Lam. and Quercus coccinea Münchh.—revealed a similar bias for the Q. ellipsoidalis-specific allele. To further elucidate the basis of this differentiation, we sequenced the microsatellite in individuals from all four red oak species. Sequence variability was observed in the microsatellite motif which encodes a poly-Q repeat in a COL gene involved in phenology and growth. Furthermore, in neighboring (parapatric) Q. rubra/Q. ellipsoidalis populations, introgression of the Q. ellipsoidalis-specific allele into Q. rubra occurred at a lower rate than introgression of the Q. rubra-specific allele into Q. ellipsoidalis despite symmetric interspecific gene flow, indicating potential adaptive introgression. Introgression of adaptive alleles can be an important mechanism for rapid adaptation to new environmental conditions (e.g., climate change).

1. Introduction

The transfer of adaptive alleles and traits by hybridization might be an important mechanism of rapid evolution and adaptation to changing environments, e.g., in the face of climate change, and evidence for adaptive trait transfer has been reported in both plant and animal species (reviewed in [1,2]). The availability of genomic resources and analytical methods for the identification of loci under strong divergent selection (outlier loci) [3] allows us to trace the introgression of potentially adaptive alleles in interspecific hybrid zones. Oaks generally reveal porous species boundaries, but morphological species’ identity and ecological adaptations (e.g., soil moisture) are generally maintained despite recurrent interspecific gene flow [4,5,6]. Thus, oaks provide a model for the identification of outlier loci under divergent selection with annotated functions and potential roles in stress tolerance and reproductive isolation between species (e.g., [7]).
The four interfertile North American red oak species—Quercus rubra L., Quercus velutina Lam., Quercus coccinea Münchh., and Quercus ellipsoidalis E.J. Hill—exhibit porous species boundaries and recent studies found strong evidence for contemporary interspecific gene flow in sympatric and parapatric stands based on genetic assignment and parentage analyses [5,8,9,10]. Most recently, Owusu et al. used both genic and nuclear microsatellite markers to better resolve the taxonomic relationships between these four species [10]. The genetic assignment analysis showed a clear separation of all four species, with Q. rubra being the most differentiated. After excluding genetically intermediate individuals identified in the genetic assignment analysis, a phylogenetic tree based on population distances at nuclear microsatellite markers revealed Q. ellipsoidalis and Q. coccinea as most closely related and a clear separation of Q. rubra from the Q. velutina/Q. ellipsoidalis/Q. coccinea clade [10]. This result is also supported by previous studies and a recent restriction site associated sequencing (RAD-seq) phylogeny of the genus ([9,11,12], [13]). Genetically intermediate forms were found in contact zones between Q. ellipsoidalis, Q. rubra and Q. velutina, in sympatric stands indicating gene flow among these three species [8,10,14]. High levels of interspecific gene flow were detected especially between Q. ellipsoidalis and Q. velutina. Thus about 20% of Q. velutina individuals had a recent Q. ellipsoidalis ancestor and about 30% of Q. ellipsoidalis individuals had a recent Q. velutina ancestor [8]. This supports previous indications of recent and ongoing hybridization between Q. ellipsoidalis and Q. velutina [9,11]. Recent studies have shown gene flow between Q. rubra and the other three species to be more restricted, yet generally symmetric [9,10,15]. These four species also represent a drought tolerance gradient, with Q. rubra as the least drought tolerant followed by Q. velutina, Q. coccinea and lastly, Q. ellipsoidalis as the most drought tolerant [16,17].
Previously, we discovered among 36 genic and eight non-genic microsatellites one genic microsatellite (FIR013), located in the coding region of a CONSTANS-like (COL) gene, which was nearly fixed on alternative alleles in multiple population pairs of two of these species (Q. rubra and Q. ellipsoidalis; [7]). This genic microsatellite was originally developed for Quercus robur L. and the trinucleotide microsatellite encodes a poly-Q-repeat (poly-glutamine repeat) [18]. Quercus ellipsoidalis is characterized by the lack of one repeat unit (138 base pair (bp) allele) as compared to Q. rubra (141 bp allele, [7]). The locus has a putative function as a COL gene, which is thought to be involved in flowering time and growth [7], both of which can be impacted by water availability [19]. In the European white oak species Quercus petraea (Matt.) Liebl., a single nucleotide polymorphism (SNP) located in the same COL gene, was identified as significantly associated with bud burst along an altitudinal gradient [20]. Latitudinal and altitudinal gradients, as well as local environmental conditions such as water availability, have been shown to impact bud burst timing in other oak species [21,22]. Quercus rubra and Q. ellipsoidalis seedlings grown in a common garden exhibited differences in bud burst timing and leaf fall over two consecutive years [23] although this did not hold in natural populations of the same provenance [24]. Thus, differences in flowering time could still contribute to limit gene flow between these two species [24,25] and highly divergent markers, such as FIR013, located in the first exon of a COL gene, might be involved in their adaptive divergence and/or partial reproductive isolation. COL genes have been linked to adaptive divergence in other species, including the European white oak Q. petraea and Populus tremula L. [20,26,27]. For example, in P. tremula, an allele of the coding poly-E repeat (poly-glutamic acid) microsatellite in COL2B, was associated with growth cessation across a latitudinal gradient [26]. Interestingly, Q. ellipsoidalis exhibited later leaf fall than Q. rubra in a common garden, indicating genetic differences between species in leaf fall [22], a trait which is positively associated with growth cessation [28]. The biological function of single amino acid repeats (e.g., poly-E and poly-Q) has been studied mostly in animal species, with variation in these repeats often associated with genetic disorders [29,30]. However, variation in poly-glutamine repeats, such as the poly-Q repeat found in the COL gene, have been shown to be under selection in various species including fish, birds, plants and fungi, making this particular marker an excellent candidate gene, potentially contributing to reproductive isolation and adaptive divergence between the two oak species [31].
In this study, we asked two questions: (1) is the microsatellite size variation due to poly-Q repeat variation in these four red oak species; and (2) is there introgression of potentially adaptive alleles between drought averse Q. rubra and drought tolerant Q. ellipsoidalis, Q. velutina and Q. coccinea? To answer the first question, we have sequenced part of the COL gene including the poly-Q repeat in a total of 46 samples representing each species and allele at FIR013. In reference to the second question, we assessed genetic variation in 16 populations (Table S1, Figure 1) at 12 microsatellite markers (including FIR013) and examined relative allelic and genotypic frequencies in each genetically assigned species at FIR013.

2. Materials and Methods

DNA samples were obtained from 16 populations of four red oak species (Q. rubra, Q. ellipsoidalis, Q. velutina, and Q. coccinea) from the Great Lakes region (Wisconsin, Michigan, Illinois and Indiana; see Table S1 and Figure 1) [8,10,25]. The samples consisted of eight population pairs of Q. rubra and Q. ellipsoidalis (parapatric populations), six mixed stands of Q. ellipsoidalis and Q. velutina in proximity to unsampled Q. rubra populations (parapatric populations) and one mixed stand of Q. ellipsoidalis, Q. velutina, and Q. rubra (sympatric population). Finally, one Q. coccinea population within the distribution range of Q. rubra and Q. velutina was also included. Leaf material was stored at −20 °C until DNA extraction using the DNeasy96 Plant Kit (Qiagen, Valencia, CA, USA) following the manufacturer’s instructions.
Using the primer pair for microsatellite FIR013 (Table S2), we sequenced the microsatellite and flanking regions in 46 samples (all homozygous for either the 138 bp, 141 bp or 144 bp allele at FIR013) from sampled populations of the four red oak species: Q. ellipsoidalis (11), Q. rubra (9), Q. velutina (18), and Q. coccinea (8) (see Table S3). Sequencing reactions were run on an ABI3730 DNA Analyzer using the ABI BigDye Terminator Cycle Sequencing Ready Reaction Kit v.3.1 (Applied Biosystems, Foster City, CA, USA) at the Nevada Genomics Center at the University of Nevada in Reno. Sequence data were aligned using the BioEdit Sequence Alignment Editor [32]. Alignment of forward and reverse sequences was completed by using pairwise alignment with the option to allow the two ends to slide. Multiple fragment alignments were completed using the Muscle algorithm (with default settings) in MEGA (Molecular Evolutionary Genetics Analysis) 6.06 [33] and final alignments were generated after careful visual inspection and manual re-editing. Sequence data were translated into amino acid sequences in MEGA using the standard genetic code option.
All individuals from the 16 sampled populations were previously genotyped at 11 microsatellite markers (six expressed sequence tag-simple sequence repeats (EST-SSRs) and five nuclear simple sequence repeats (nSSRs); Table S2). Genotypic data on EST-SSR FIR013 were available for the eight Q. rubra and Q. ellipsoidalis populations, and we genotyped the remaining seven populations (six sympatric Q. ellipsoidalis/Q. velutina populations and the sympatric Q. rubra/Q. ellipsoidalis/Q. velutina population; Table S2) at FIR013 [8,10,25]. A single population of Q. coccinea was included for the sequencing effort and for the amplification of FIR013, where eight samples were sequenced and all 20 samples were genotyped at FIR013.
All genetic variation analyses were conducted both with and without the outlier FIR013. Genetic variation parameters were calculated in GeneAlEx 6.41 [34] including the number of alleles per locus (Na), Nei’s unbiased gene diversity (He), observed heterozygosity (Ho) and Wright’s inbreeding coefficient (F) by population and species. Using only pure individuals from each species (based on previous genetic assignment analyses exluding outlier loci [8,10,25]), FST and pairwise FST between species with corresponding significances were calculated in GenePop 4.1 [35]. FST-based outlier screens were conducted in the program LOSITAN [36] between Q. rubra and Q. ellipsoidalis, Q. rubra and Q. velutina, and Q. velutina and Q. ellipsoidalis using the same settings as detailed in [7]. Specifically, we applied the stepwise mutation model with 50,000 simulations at the 99% confidence level and false discovery rate of 0.10.
Relative frequencies of introgressive forms and hybrids between drought averse Q. rubra and the more drought tolerant Q. ellipsoidalis, Q. velutina, and Q. coccinea were calculated based on results from two previous genetic assignment analyses [10,25]. Although slightly different marker sets were used in the genetic assignments, we have shown previously that very similar results are obtained using marker sets of 10, 16 or 44 markers [7,24]. The same method and criteria for genetic assignment analysis in the program STRUCTURE [37] were used as described in [25] and did not include the marker FIR013 or any other outlier marker. Pure species, introgressive forms and hybrids were classified as having >0.90, 0.61–0.89, and 0.4–0.6 proportion of their ancestry in one genetic cluster, respectively. Introgression of the species characteristic FIR013 alleles 138 bp (Q. ellipsoidalis) and 141 bp (Q. rubra) [7] between species with different drought tolerance was determined by relative frequencies of the 141 bp allele in genetically assigned Q. ellipsoidalis, Q. velutina and Q. coccinea individuals and as the relative frequency of the 138 bp allele in genetically assigned Q. rubra individuals.

3. Results

3.1. Nucleotide Sequence Analysis

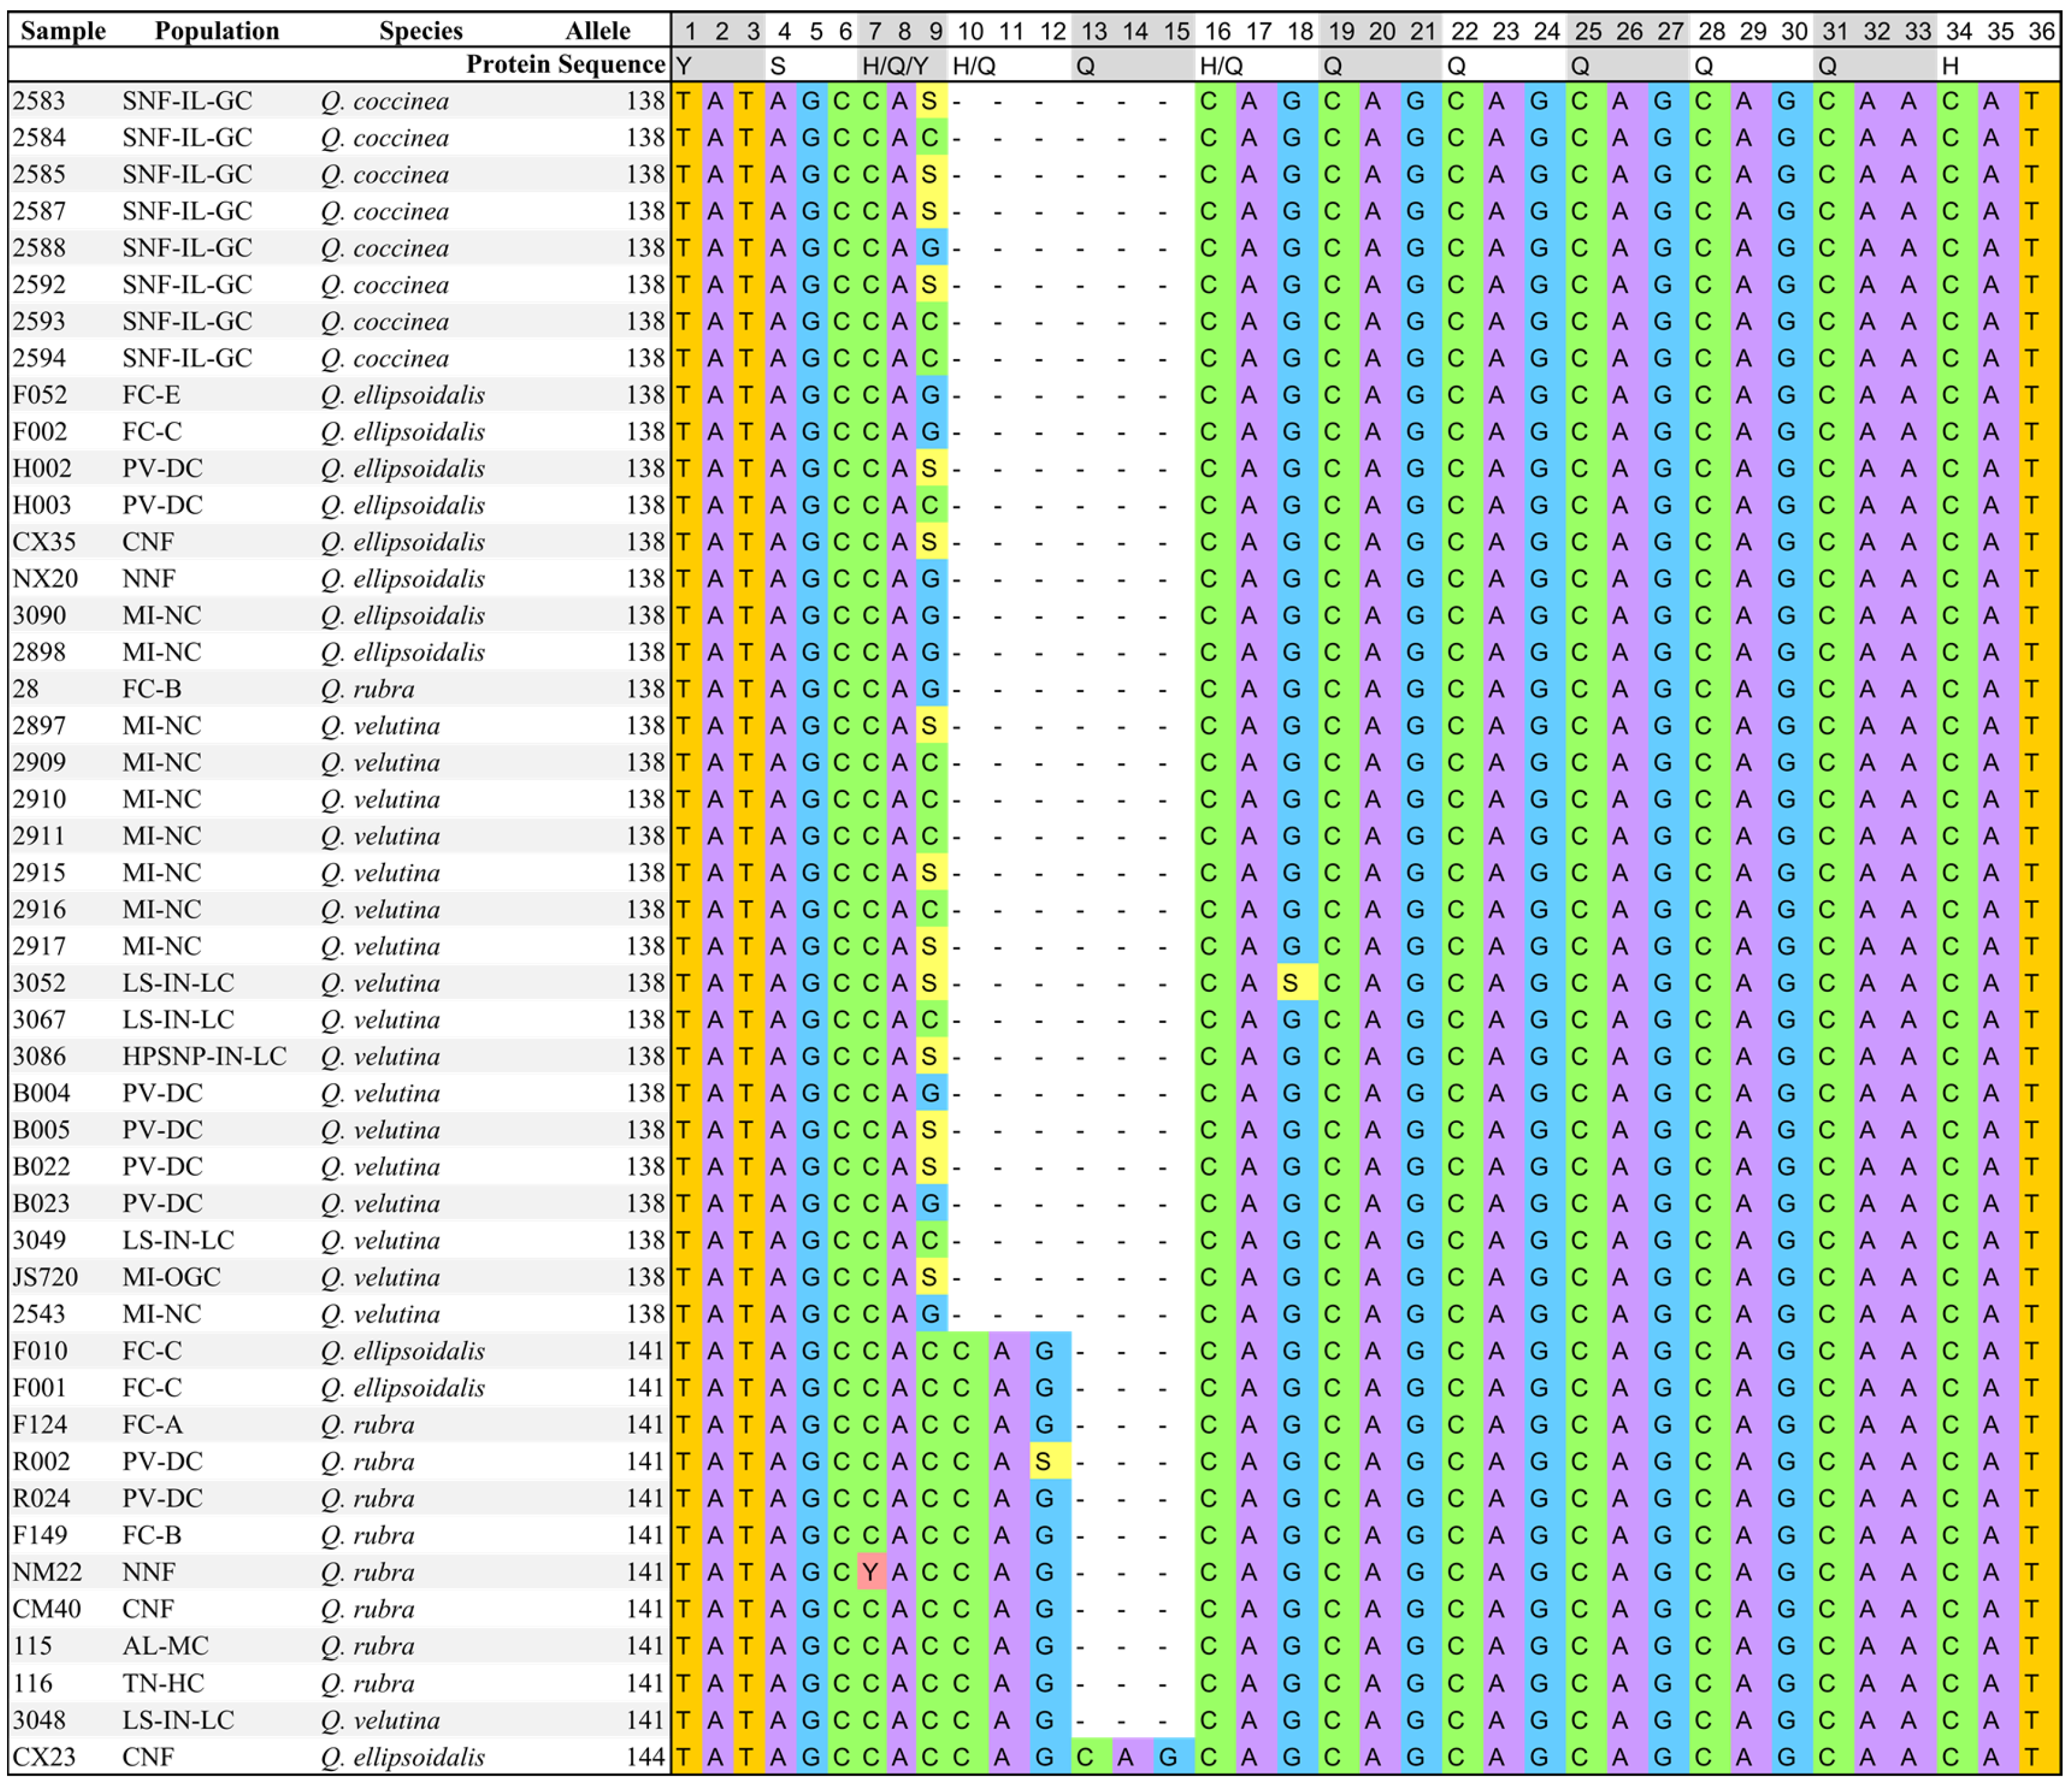
Sequence variation confirmed that allele size differences were due to variation in a poly-Q repeat (Figure 2). Quercus velutina and Q. coccinea share the same common allele (138 bp) with Q. ellipsoidalis (Figure 3) which is reflected in the sequence variation between these three species and Q. rubra (Figure 2). In addition, there was a non-synonymous single nucleotide polymorphism (SNP) within the nucleotide repeat region present in all four species at position 9 (Figure 2). This SNP displayed different allelic patterns in Q. rubra as compared to the other three more drought tolerant species, with almost all Q. rubra individuals homozygous for the nucleotide “C” (88.9%), while heterozygotes (C/G) are only present in Q. velutina (44.4%), Q. ellipsoidalis (18.2%) and Q. coccinea (50.0%). The frequency of homozygotes (G/G) was similar (between 10%–20%) for all but Q. ellipsoidalis (45.5%) (Table S4). Sample sizes were small for all four species and may bias these results.

3.2. Genetic Diversity and Differentiation Analysis

Levels of genetic diversity were similar across populations and species (Table S6). Quercus rubra showed significant, but low differentiation from the other three species at the 11 non-outlier microsatellites (3% to 4.3%) (Table 1), and very high and significant differentiation at the FIR013 locus (62.5% to 67.2%, Table 1). Genetic diversity and differentiation at all 12 microsatellite markers showed similar patterns (Tables S5 and S7). Differentiation at FIR013 between the drought tolerant species was low at 0.9% (Table 1). All outlier screens between Q. rubra and other more drought tolerant species identified FIR013 as an outlier, consistent with the allelic patterns observed for all four species (Table S8, Figures S2–S4).
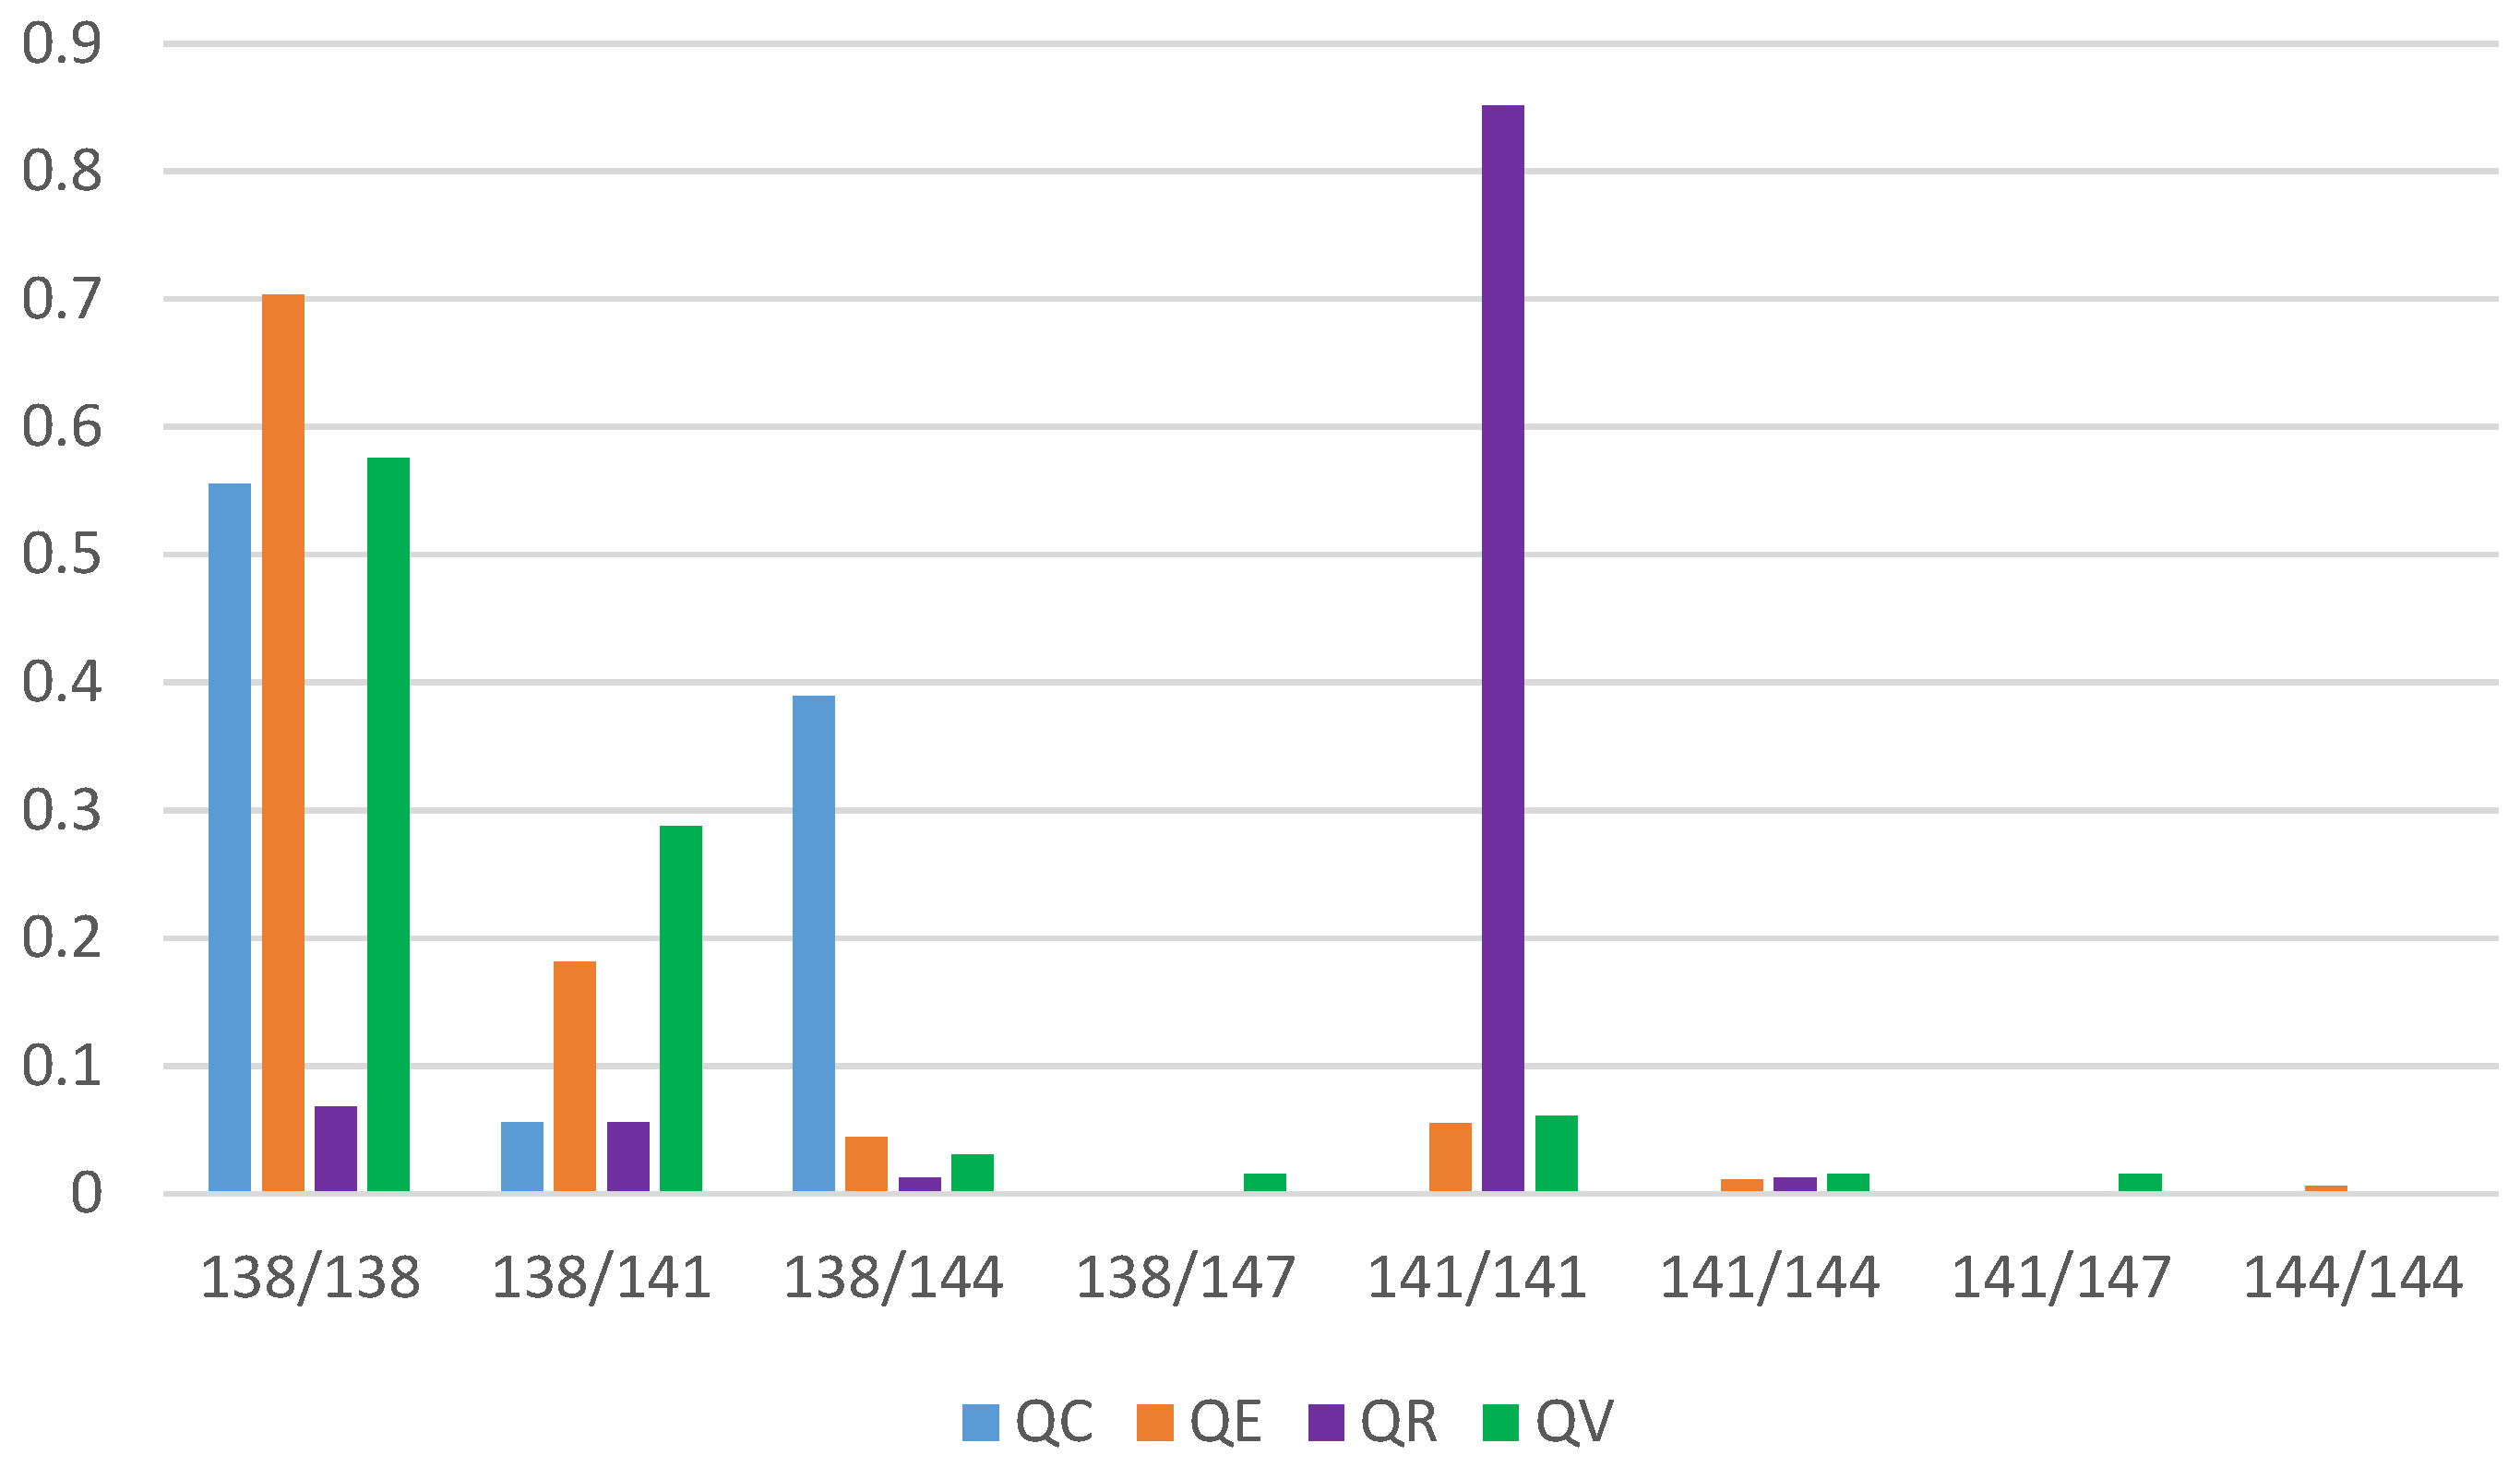
In the only Q. coccinea population, the 141 bp (Q. rubra) allele was rare (3%) and no homozygotes for this allele were found (Table 2; Figure 3). The frequency of the 141 bp allele in Q. velutina and Q. ellipsoidalis was higher (22% and 15%, respectively) and homozygotes for the 141 bp allele were observed in both species (6% in Q. velutina, 5% in Q. ellipsoidalis) (Figure 3).
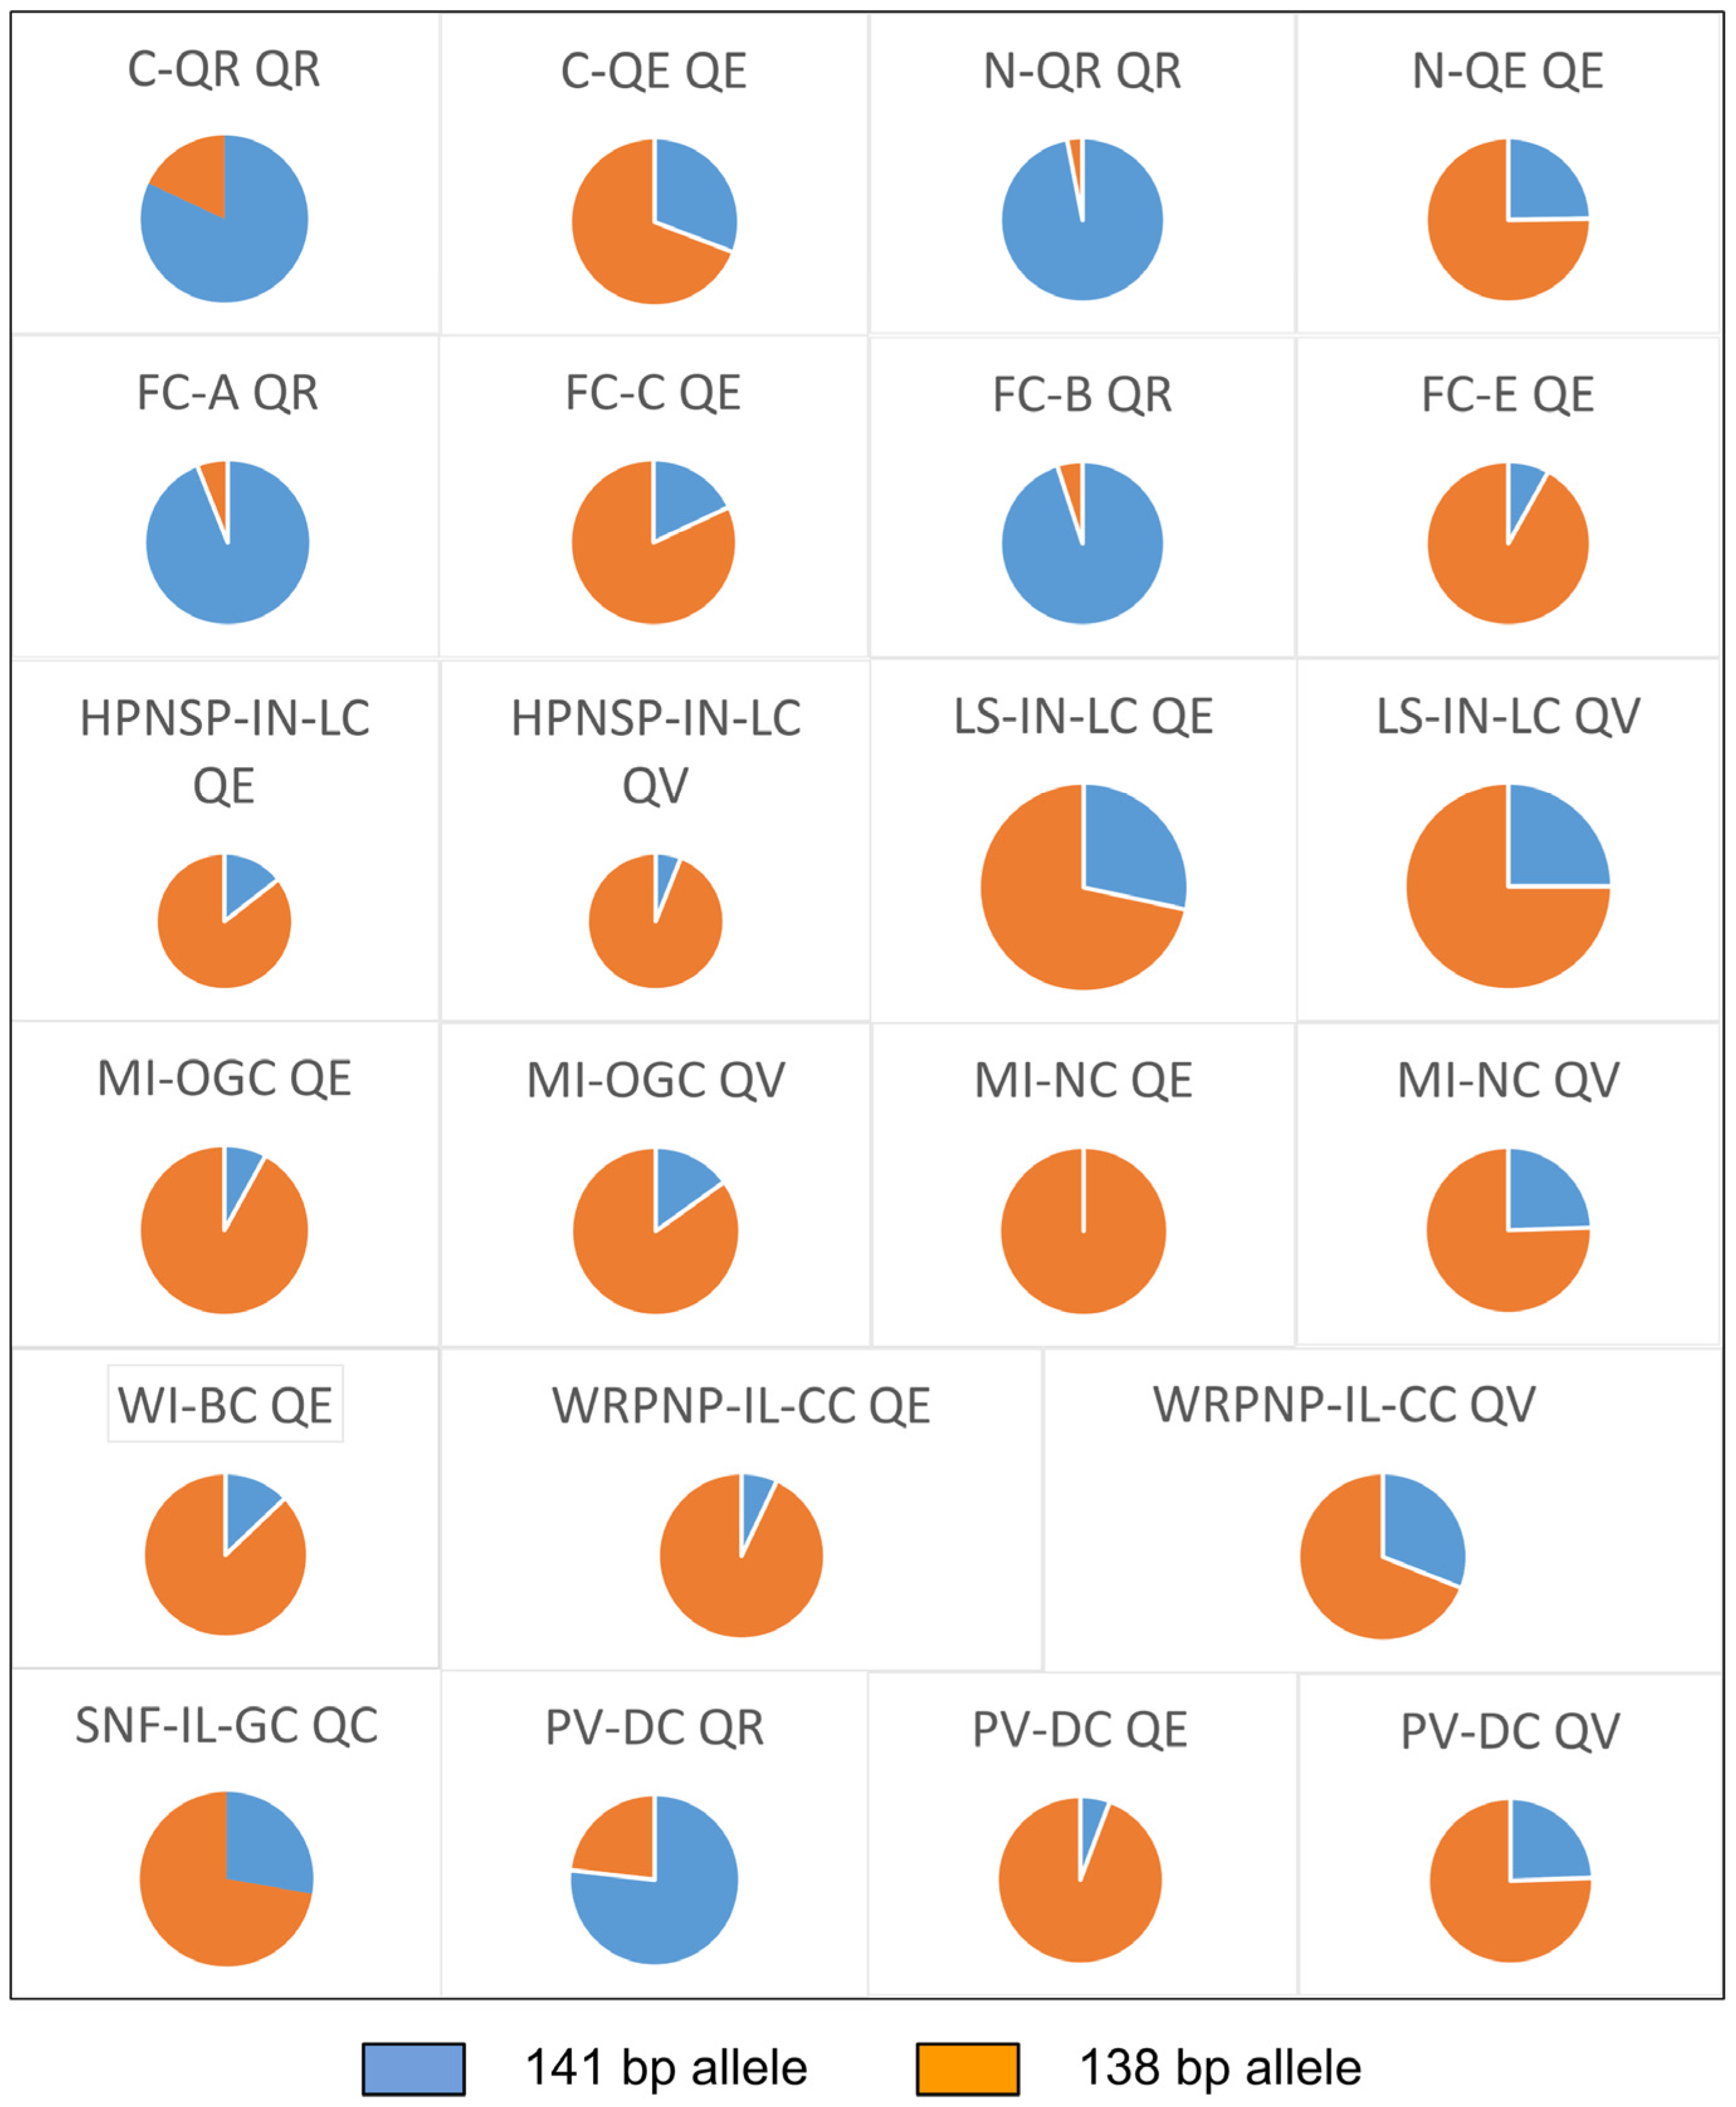
For sympatric Q. velutina/Q. ellipsoidalis populations that were in close proximity to Q. rubra populations, introgression of the 141 bp (Q. rubra) allele was considerably higher into Q. velutina than into Q. ellipsoidalis for three out of the five populations (Figure 4; Table 2: populations MI-NC, MI-OGC, WRPNP-IL-CC). The level of introgression of the 141 bp allele was similar for Q. velutina and Q. ellipsoidalis in population LS-IN-LC and higher in Q. ellipsoidalis than in Q. velutina in population HPNSP-IN-LC (Figure 4; Table 2).
Previous genetic assignment analyses [10,25] displayed similar levels of hybrids and introgressive forms between parapatric Q. rubra and Q. ellipsoidalis populations (p-value = 0.84), with Q. rubra populations exhibiting introgression rates (percentage of hybrids and introgressive forms) of 0%–23% ( x ¯ = 14 % ;   M = 17 % ) and Q. ellipsoidalis populations exhibiting introgression rates of 8%–23% ( x ¯ = 16 % ;   M = 16 % ) (Table 3). While the percentage of hybrids and introgressive forms was very similar in neighboring (parapatric) Q. rubra and Q. ellipsoidalis populations (last column, Table 3), introgression of the 141 bp allele into Q. ellipsoidalis was consistently higher than introgression of the 138 bp allele into Q. rubra (populations C-QE/C-QR: 29%/18%, populations N-QE/NQR: 24%/2%, populations FC-QE/FC-QR: 8%–18%/5%–6%) (Table 2). By contrast, in the sympatric population, the introgression of the 141 bp allele into Q. ellipsoidalis was lower (5%) than introgression of the 138 bp into Q. rubra (19%). Overall, the highest level of introgression of outlier alleles between species was found in C-QR (18%) and C-QE (29%) (Table 2).

4. Discussion

Quercus rubra is the only species nearly fixed on the 141 bp allele at outlier locus FIR013. The other three species are largely fixed on the 138 bp allele, and this difference is reflected in the sequence variation of the microsatellite itself. Previous work on these four species has also indicated that Q. rubra is the most diverged of the four species and that there is contemporary gene flow occurring between all four of these species [8,10]. The lack of one glutamine residue in the poly-Q repeat is a shared character for the three more drought tolerant species, with interspecific gene flow likely responsible for incomplete differentiation. The phylogeny of section Lobatae is in progress [13] and can be used to evaluate whether the character is a synapomorphy for the three more drought tolerant species. The four species represent a drought tolerance gradient with Q. ellipsoidalis being the most drought tolerant, followed by Q. coccinea and then Q. velutina, while Q. rubra is considered the most mesophilic red oak species [16,38]. Despite morphological and ecophysiological differences [8,16,38,39] between the four oak species, genetic differentiation between them is low at most nuclear genetic markers [7,8,10,25] as well as at chloroplast markers [14]. This is consistent with the tendency for closely related oak species to frequently hybridize with one other [40]. Thus, genomic regions that display high levels of genetic differentiation are of great interest to elucidate how oaks maintain their species identity despite interspecific gene flow.
Poly-Q repeat function and variation have been studied extensively in regards to human disease, but there is scant information about their function in plant and animal species [29,30,31]. Thus, further investigation of their functional role and variation is warranted. In addition to the repeat number variation, a non-synonymous SNP within the poly-Q repeat (Figure 2) was found in all four species (C/G) and there was a bias towards both the heterozygotes (C/G) and homozygotes (G/G) in the three more drought tolerant species. The observed SNP change from C to G results in a change of the protein sequence from a glutamine (uncharged polar) to a histidine (positive polar). These sequence differences between species with different drought tolerance might be related to functional differences. Association studies in full-sib families derived from controlled intra- and interspecific crosses, and gene expression analyses could be used to associate sequence variation in the COL gene with phenotypic variation.
Genetic markers that exhibit extreme differentiation between species as signatures of divergent selection can be used as diagnostic markers to assess introgression of potentially adaptive alleles between interfertile species in parapatric and sympatric populations. FIR013 provides such a marker and our examination of the relative allelic frequencies at the FIR013 locus in parapatric Q. rubra/Q. ellipsoidalis populations has shown that introgression of the 141 bp allele is consistently higher into the drought tolerant Q. ellipsoidalis than introgression of the 138 bp allele into the mesophilic species, Q. rubra (Table 2, Figure 4; [7]). This pattern of asymmetric introgression of outlier alleles suggests different strength of selection against the 138 bp and 141 bp alleles in non-parental environments if interspecific gene flow is symmetric [41,42,43] as observed in the present study between Q. rubra and Q. ellipsoidalis. In contrast, in the only sympatric population, introgression of the 141 bp into Q. ellipsoidalis is much lower (5%) than introgression of the 138 bp into Q. rubra (19%), suggesting that competition between species might affect introgression at FIR013 outlier alleles. Also, the extent of interspecific gene flow between Q. rubra/Q. ellipsoidalis population pairs was not related to the introgression of alleles 138 bp and 141 bp, again suggesting that introgression of these alleles was also affected by environment-dependent selection. For example, the introgression of allele 138 bp into Q. rubra was 2% for N-QR and 18% for C-QR, while interspecific gene flow was very similar (Table 3). In future studies, a systematic assessment of introgression rates and soil and climate variables is needed in both sympatric and parapatric Q. rubra/Q. ellipsoidalis populations to analyze the effect of interspecific competition on introgression rates at outlier alleles and to test for an association between introgression rates at outlier alleles and environmental variables (e.g., climate, soil, habitat characteristics).
In a seedling common garden experiment, Q. ellipsoidalis had a later bud burst and leaf fall, a much slower growth rate and higher mortality than Q. rubra over two growing seasons [23]. A slower growth strategy may be an adaptation to a xeric environment [44] and Q. ellipsoidalis is generally restricted to dry, sandy pine barrens [7,25] and is considered to be the most drought tolerant red oak species [16,45]. In most mixed Q. ellipsoidalis/Q. velutina populations and the sympatric population (PV-DC), introgression of the 141 bp allele was higher into Q. velutina than into Q. ellipsoidalis. Quercus velutina is less water efficient than Q. ellipsoidalis and generally found in savannas [16,46,47], while Q. ellipsoidalis is generally found on very dry sandy sites, possibly creating differences in introgression patterns between the three species in their sympatric range.
Introgression of adaptive alleles results in adaptive trait transfer between species and may be crucial for the adaptation to rapidly changing environmental conditions (e.g., [2]). In addition to heterozygous genotypes (138 bp/141 bp) at outlier locus FIR013, we found rare homozygotes for the 141 bp (Q. rubra) allele in both Q. velutina and Q. ellipsoidalis as well as homozygotes for the 138 bp allele in Q. rubra (see Figure 3). Common garden studies with different drought treatments could reveal whether introgression of outlier alleles is associated with differences in drought tolerance. For example, assessments of phenotypic traits, such as growth and water use efficiency for different genotypes at FIR013 (138 bp/138 bp, 138 bp/141 bp, 141 bp/141 bp) in each species, could allow quantification of relative fitness related to variation in the poly-Q repeat of COL.
In conclusion, we have identified a genic microsatellite marker with repeat number variation resulting in two major alleles differentiating between the drought averse Q. rubra and the drought tolerant oak species Q. ellipsoidalis, Q. velutina and Q. coccinea. This candidate gene may be involved in adaptive differences between the species. Common garden experiments of seedlings with all possible genotype combinations at FIR013 in each species can elucidate the allelic and genotypic effects at FIR013 on survival and other fitness related traits and thus the relation between introgression of FIR013 alleles between species and adaptive trait introgression.

Supplementary Materials

The following are available online at www.mdpi.com/1999-4907/8/1/3/s1, Figure S1: Relative genotypic frequencies in pure species of Q. rubra, Q. ellipsoidalis and Q. velutina in parapatric populations and one sympatric population of Q. rubra, Q. ellipsoidalis and Q. velutina (starred) at the FIR013 locus, Figure S2: Outlier loci analysis of 12 markers between Q. rubra and Q. ellipsoidalis as calculated in the program LOSITAN [7] with a 99% confidence interval; FIR013 was found to be an outlier even after the application of 10% false discovery rate (FDR), Figure S3: Outlier loci analysis of 12 markers between Q. rubra and Q. velutina as calculated in LOSITAN [7] with a 99% confidence interval; 3A05 was found not to be an outlier after the application of 10% FDR, Figure S4: Outlier loci analysis of 12 markers between Q. velutina and Q. ellipsoidalis as calculated in LOSITAN [7] with a 99% confidence interval; 3A05 was found not to be an outlier after the application of 10% FDR, Table S1: Location of collection sites for the 16 Quercus spp. populations, Table S2: Microsatellite marker characteristics, Table S3: Characteristics of samples used in the sequencing effort, Table S4: Relative frequency of a single nucleotide polymorphism in the coding region of a COL gene (Position 9, see Figure 2), Table S5: Genetic variation parameters by population and species across the 12 microsatellite markers, Table S6: Genetic variation parameters by population and species across 11 non-outlier microsatellite markers, Table S7: Pairwise FST value by species across all 12 microsatellite markers using GeneAlEx [6], Table S8: FST-based outlier screening results across the 12 microsatellite markers using LOSITAN [7].

Acknowledgments

This work was made possible through funding from the Hanes Trust and the McIntire Stennis fund (USDA-NIFA # 1001471). Additional funding was provided by the Life Science and Technology Institute (LSTI) and Ecosystem Science Center (ESC) at Michigan Technological University. Samples from certain populations were provided by Andrew Hipp (PV-DC, WI-BC, MI-NC, MI-OGC, WRPNP-IL-CC, HPNSP-IN-LC, LS-IN-LC) and Alexis Sullivan (N-QE, N-QR, C-QE, C-QR). Published data from Sullivan et al. (2016) and Owusu et al. (2015) were utilized for genetic variation assessment and genetic assignment information.

Author Contributions

O.G. and J.F.L.-R. conceived and designed the experiments; J.F.L.-R. performed the experiments; O.G. and J.F.L.-R. analyzed the data and wrote the paper.

Conflicts of Interest

The authors declare no conflict of interest.

References

  1. Arnold, M.L. Evolution through Genetic Exchange; Oxford University Press: Oxford, UK, 2006. [Google Scholar]
  2. Arnold, M.L. Divergence with Genetic Exchange; Oxford University Press: Oxford, UK, 2016. [Google Scholar]
  3. Scotti-Saintagne, C.; Mariette, S.; Porth, I.; Goicoechea, P.G.; Barreneche, T.; Bodénès, C.; Burg, K.; Kremer, A. Genome scanning for interspecific differentiation between two closely related oak species (Quercus robur L. and Q. petraea (Matt.) Liebl.). Genetics 2004, 168, 1615–1626. [Google Scholar] [CrossRef] [PubMed]
  4. Gailing, O.; Curtu, A.L. Interspecific gene flow and maintenance of species integrity in oaks. Ann. For. Res. 2014, 57, 5–18. [Google Scholar] [CrossRef]
  5. Moran, E.V.; Willis, J.; Clark, J.S. Genetic evidence for hybridization in red oaks (Quercus sect. Lobatae, Fagaceae). Am. J. Bot. 2012, 99, 92–100. [Google Scholar] [CrossRef] [PubMed]
  6. Lepais, O.; Gerber, S. Reproductive patterns shape introgression dynamics and species sucession within the European white oak species complex. Evolution 2011, 65, 156–170. [Google Scholar] [CrossRef] [PubMed]
  7. Lind-Riehl, J.F.; Sullivan, A.R.; Gailing, O. Evidence for selection on a CONSTANS-like gene between two red oak species. Ann. Bot. Lond. 2014, 113, 967–975. [Google Scholar] [CrossRef] [PubMed]
  8. Sullivan, A.R.; Owusu, S.A.; Weber, J.A.; Hipp, A.L.; Gailing, O. Hybridization and divergence in multi-species oak (Quercus) communities. Bot. J. Linn. Soc. 2016, 181, 99–114. [Google Scholar] [CrossRef]
  9. Hipp, A.L.; Weber, J.A. Taxonomy of Hill’s oak (Quercus ellipsoidalis: Fagaceae): Evidence from AFLP data. Syst. Bot. 2008, 33, 148–158. [Google Scholar] [CrossRef]
  10. Owusu, S.A.; Sullivan, A.R.; Weber, J.A.; Hipp, A.L.; Gailing, O. Taxonomic Relationships and Gene Flow in Four North American Quercus Species (Quercus section Lobatae). Syst. Bot. 2015, 40, 510–521. [Google Scholar] [CrossRef]
  11. Hipp, A.L.; Weber, J.A.; Srivastava, A. Who am I this time? The affinities and misbehaviors of Hill’s oak (Quercus ellipsoidalis). Int. Oak J. 2010, 21, 27–36. [Google Scholar]
  12. Hipp, A.L. Hill’s oak: The taxonomy and dynamics of a Western Great Lake endemic. Arnoldia 2010, 67, 2–14. [Google Scholar]
  13. Hipp, A.L. What do we mean by oak species and the oak phylogeny? Oak species coherence and parallel ecological diversification in the red and white oaks. In Presented at the IUFRO Genomics and forest tree genetics, Arcachon, France, 30 May–3 June 2016.
  14. Zhang, R.; Hipp, A.L.; Gailing, O. Sharing of chloroplast haplotypes among red oak species suggests interspecific gene flow between neighboring populations. Botany 2015, 93, 691–700. [Google Scholar] [CrossRef]
  15. Sullivan, A.R. Speciation with Gene-Flow in eastern North American Red Oaks (Quercus section Lobatae). Master’s Thesis, School of Forest Resources and Environmental Science, Houghton, MI, USA, 2013. [Google Scholar]
  16. Abrams, M.D. Adaptations and responses to drought in Quercus species of North America. Tree Physiol. 1990, 7, 227–238. [Google Scholar] [CrossRef] [PubMed]
  17. Thompson, R.S.; Anderson, K.H.; Bartlein, P.J. Atlas of Relations between Climatic Parameters and Distributions of Important Trees and Shrubs in North America-Hardwoods; U.S.G. Survey: Denver, CO, USA, 1999.
  18. Durand, J.; Bodenes, C.; Chancerel, E.; Frigerio, J.-M.; Vendramin, G.; Sebastiani, F.; Buonamici, A.; Gailing, O.; Koelewijn, H.-P.; Villani, F.; et al. A fast and cost-effective approach to develop and map EST-SSR markers: Oak as a case study. BMC Genom. 2010, 11, 570. [Google Scholar] [CrossRef] [PubMed]
  19. Schmalenbach, I.; Zhang, L.; Reymond, M.; Jimenez-Gomez, J.M. The relationship between flowering time and growth responses to drought in the Arabidopsis Landsberg erecta x Antwerp-1 population. Front. Plant Sci. 2014, 5, 609. [Google Scholar] [CrossRef] [PubMed]
  20. Alberto, F.J.; Derory, J.; Boury, C.; Frigerio, J.M.; Zimmerman, N.E.; Kremer, A. Imprints of natural selection along environmental gradients in phenology-related genes of Quercus petraea. Genetics 2013, 195, 495–512. [Google Scholar] [CrossRef] [PubMed]
  21. Cavender-Bares, J.; Pahlich, A. Molecular, morphological, and ecological niche differentiation of sympatric sister oak species, Quercus virginiana and Q. geminata (Fagaceae). Am. J. Bot. 2009, 96, 1690–1702. [Google Scholar] [CrossRef] [PubMed]
  22. Ducousso, A.; Guyon, J.; Kremer, A. Latitudinal and altitudinal variation of bud burst in western populations of sessile oak (Quercus petraea (Matt) Liebl). Ann. Sci. For. 1996, 53, 775–782. [Google Scholar] [CrossRef]
  23. Gailing, O. Difference in growth, survival and phenology in Quercus rubra and Q. ellipsoidalis seedlings. Dendrobiology 2013, 70, 71–79. [Google Scholar] [CrossRef]
  24. Collins, E.; Sullivan, A.R.; Gailing, O. Limited effective gene flow between two interfertile red oak species. Trees 2015, 29, 1135–1148. [Google Scholar] [CrossRef]
  25. Lind, J.F.; Gailing, O. Genetic structure of Quercus rubra L. and Quercus ellipsoidalis E.J. Hill populations at gene-based EST-SSR and nuclear SSR markers. Tree Genet. Genomes 2013, 9, 707–722. [Google Scholar] [CrossRef]
  26. Ma, X.-F.; Hall, D.; Onge, K.R.S.; Jansson, S.; Ingvarsson, P.K. Genetic differentiation, clinal variation and phenotypic associations with growth cessation across the Populus tremula photoperiodic pathway. Genetics 2010, 186, 1033–1044. [Google Scholar] [CrossRef] [PubMed]
  27. O’Malley, K.G.; Banks, M.A. A latitudinal cline in the Chinook salmon (Oncorhynchus tshawytscha) Clock gene: Evidence for selection on PolyQ length variants. Proc. R. Soc. B Biol. Sci. 2008, 275, 2813–2821. [Google Scholar] [CrossRef] [PubMed]
  28. Weih, M. Genetic and environmental variation in spring and autumn phenology of biomass willows (Salix spp.): Effects on shoot growth and nitrogen economy. Tree Physiol. 2009, 29, 1479–1490. [Google Scholar] [CrossRef] [PubMed]
  29. Faux, N.G.; Bottomley, S.P.; Lesk, A.M.; Irving, J.A.; Morrison, J.R.; Garcia de la Banda, M.; Whisstock, J.C. Functional insights from the distribution and role of homopeptide repeat-containing proteins. Genome Res. 2005, 15, 537–551. [Google Scholar] [CrossRef] [PubMed]
  30. Lobanov, M.Y.; Klus, P.; Sokolovsky, I.V.; Tartaglia, G.G.; Galzitskaya, O.V. Non-random distribution of homo-repeats: Links with biological functions and human disease. Sci. Rep. 2016, 6, 26941. [Google Scholar] [CrossRef] [PubMed]
  31. Haerty, W.; Golding, G.B. Low-complexity sequences and single amino acid repeats: Not just “junk” peptide sequences. Genome 2010, 53, 753–762. [Google Scholar] [PubMed]
  32. Hall, T.A. Bioedit: A user-friendly biological sequence alignment editor and analysis program for Windows 95/98/NT. Nucleic Acids Symp. Ser. 1999, 41, 95–98. [Google Scholar]
  33. Tamura, K.; Stecher, G.; Peterson, D.; Filipski, A.; Kumar, S. MEGA6: Molecular Evolutionary Genetics Analysis Version 6.0. Mol. Biol. Evol. 2013, 30, 2725–2729. [Google Scholar] [CrossRef] [PubMed]
  34. Peakall, R.O.D.; Smouse, P.E. GeneAlEx 6: Genetic analysis in Excel. Population genetic software for teaching and research. Mol. Ecol. Notes 2006, 6, 288–295. [Google Scholar] [CrossRef]
  35. Raymond, M.; Rousset, F. GenePop (Version-1.2)—Population genetics software for exact tests and ecumenicism. J. Hered. 1995, 86, 248–249. [Google Scholar]
  36. Antao, T.; Lopes, A.; Lopes, R.; Beja-Pereira, A.; Luikart, G. LOSITAN: A workbench to detect molecular adaptation based on a Fst-outlier method. BMC Bioinform. 2008, 9, 323. [Google Scholar] [CrossRef] [PubMed]
  37. Pritchard, J.K.; Stephens, M.; Donnelly, P. Inference of population structure using multilocus genotype data. Genetics 2000, 155, 945–959. [Google Scholar] [PubMed]
  38. Barton, A.M.; Gleeson, S.K. Ecophysiology of seedlings of oaks and red maple across a topographic gradient in eastern Kentucky. For. Sci. 1996, 42, 335–342. [Google Scholar]
  39. Gailing, O.; Lind, J.F.; Lilleskov, E. Leaf morphological and genetic differentiation between Quercus rubra L. and Q. ellipsoidalis E.J. Hill populations in contrasting environments. Plant Syst. Evol. 2012, 298, 1533–1545. [Google Scholar] [CrossRef]
  40. Van Valen, L. Ecological species, multispecies, and oaks. Taxon 1976, 25, 233–239. [Google Scholar]
  41. Minder, A.M.; Widmer, A. A population genomic analysis of species boundaries: Neutral processes, adaptive divergence and introgression between two hybridizing plant species. Mol. Ecol. 2008, 17, 1552–1563. [Google Scholar] [CrossRef] [PubMed]
  42. Evans, P.D.; Mekel-Bobrov, N.; Vallender, E.J.; Hudson, R.R.; Lahn, B.T. Evidence that the adaptive allele of the brain size gene microcephalin introgressed into Homo sapiens from an archaic Homo lineage. Proc. Natl. Acad. Sci. USA 2006, 103, 18178–18183. [Google Scholar] [CrossRef] [PubMed]
  43. Whitney, K.; Randell, R.A.; Rieseberg, L.H. Adaptive introgression of herbivore resistance traits in the weedy sunflower Helianthus annuus. Am. Nat. 2006, 167, 794–807. [Google Scholar] [CrossRef] [PubMed]
  44. Motzkin, G.; Ciccarello, S.C.; Foster, D.R. Frost pockets on a level sand plain: Does variation in microclimate help maintain persistent vegetation patterns? J. Torrey Bot. Soc. 2002, 129, 154–163. [Google Scholar] [CrossRef]
  45. Abrams, M.D. Comparative water relations of three successional hardwood species in central Wisconsin. Tree Physiol. 1988, 4, 263–273. [Google Scholar] [CrossRef] [PubMed]
  46. Abrams, M. Distribution, historical development and ecophysiological attributes of oak species in the eastern United States. Ann. Sci. For. 1996, 53, 487–512. [Google Scholar] [CrossRef]
  47. Jensen, R.J. Quercus Linnaeus sect. Lobatae Loudon, the red or black oaks. In Flora of North America North of Mexico; Flora of North America Editoral Committee; Oxford University Press on Demand: Oxford, UK, 1997; Volume 3, pp. 447–468. [Google Scholar]
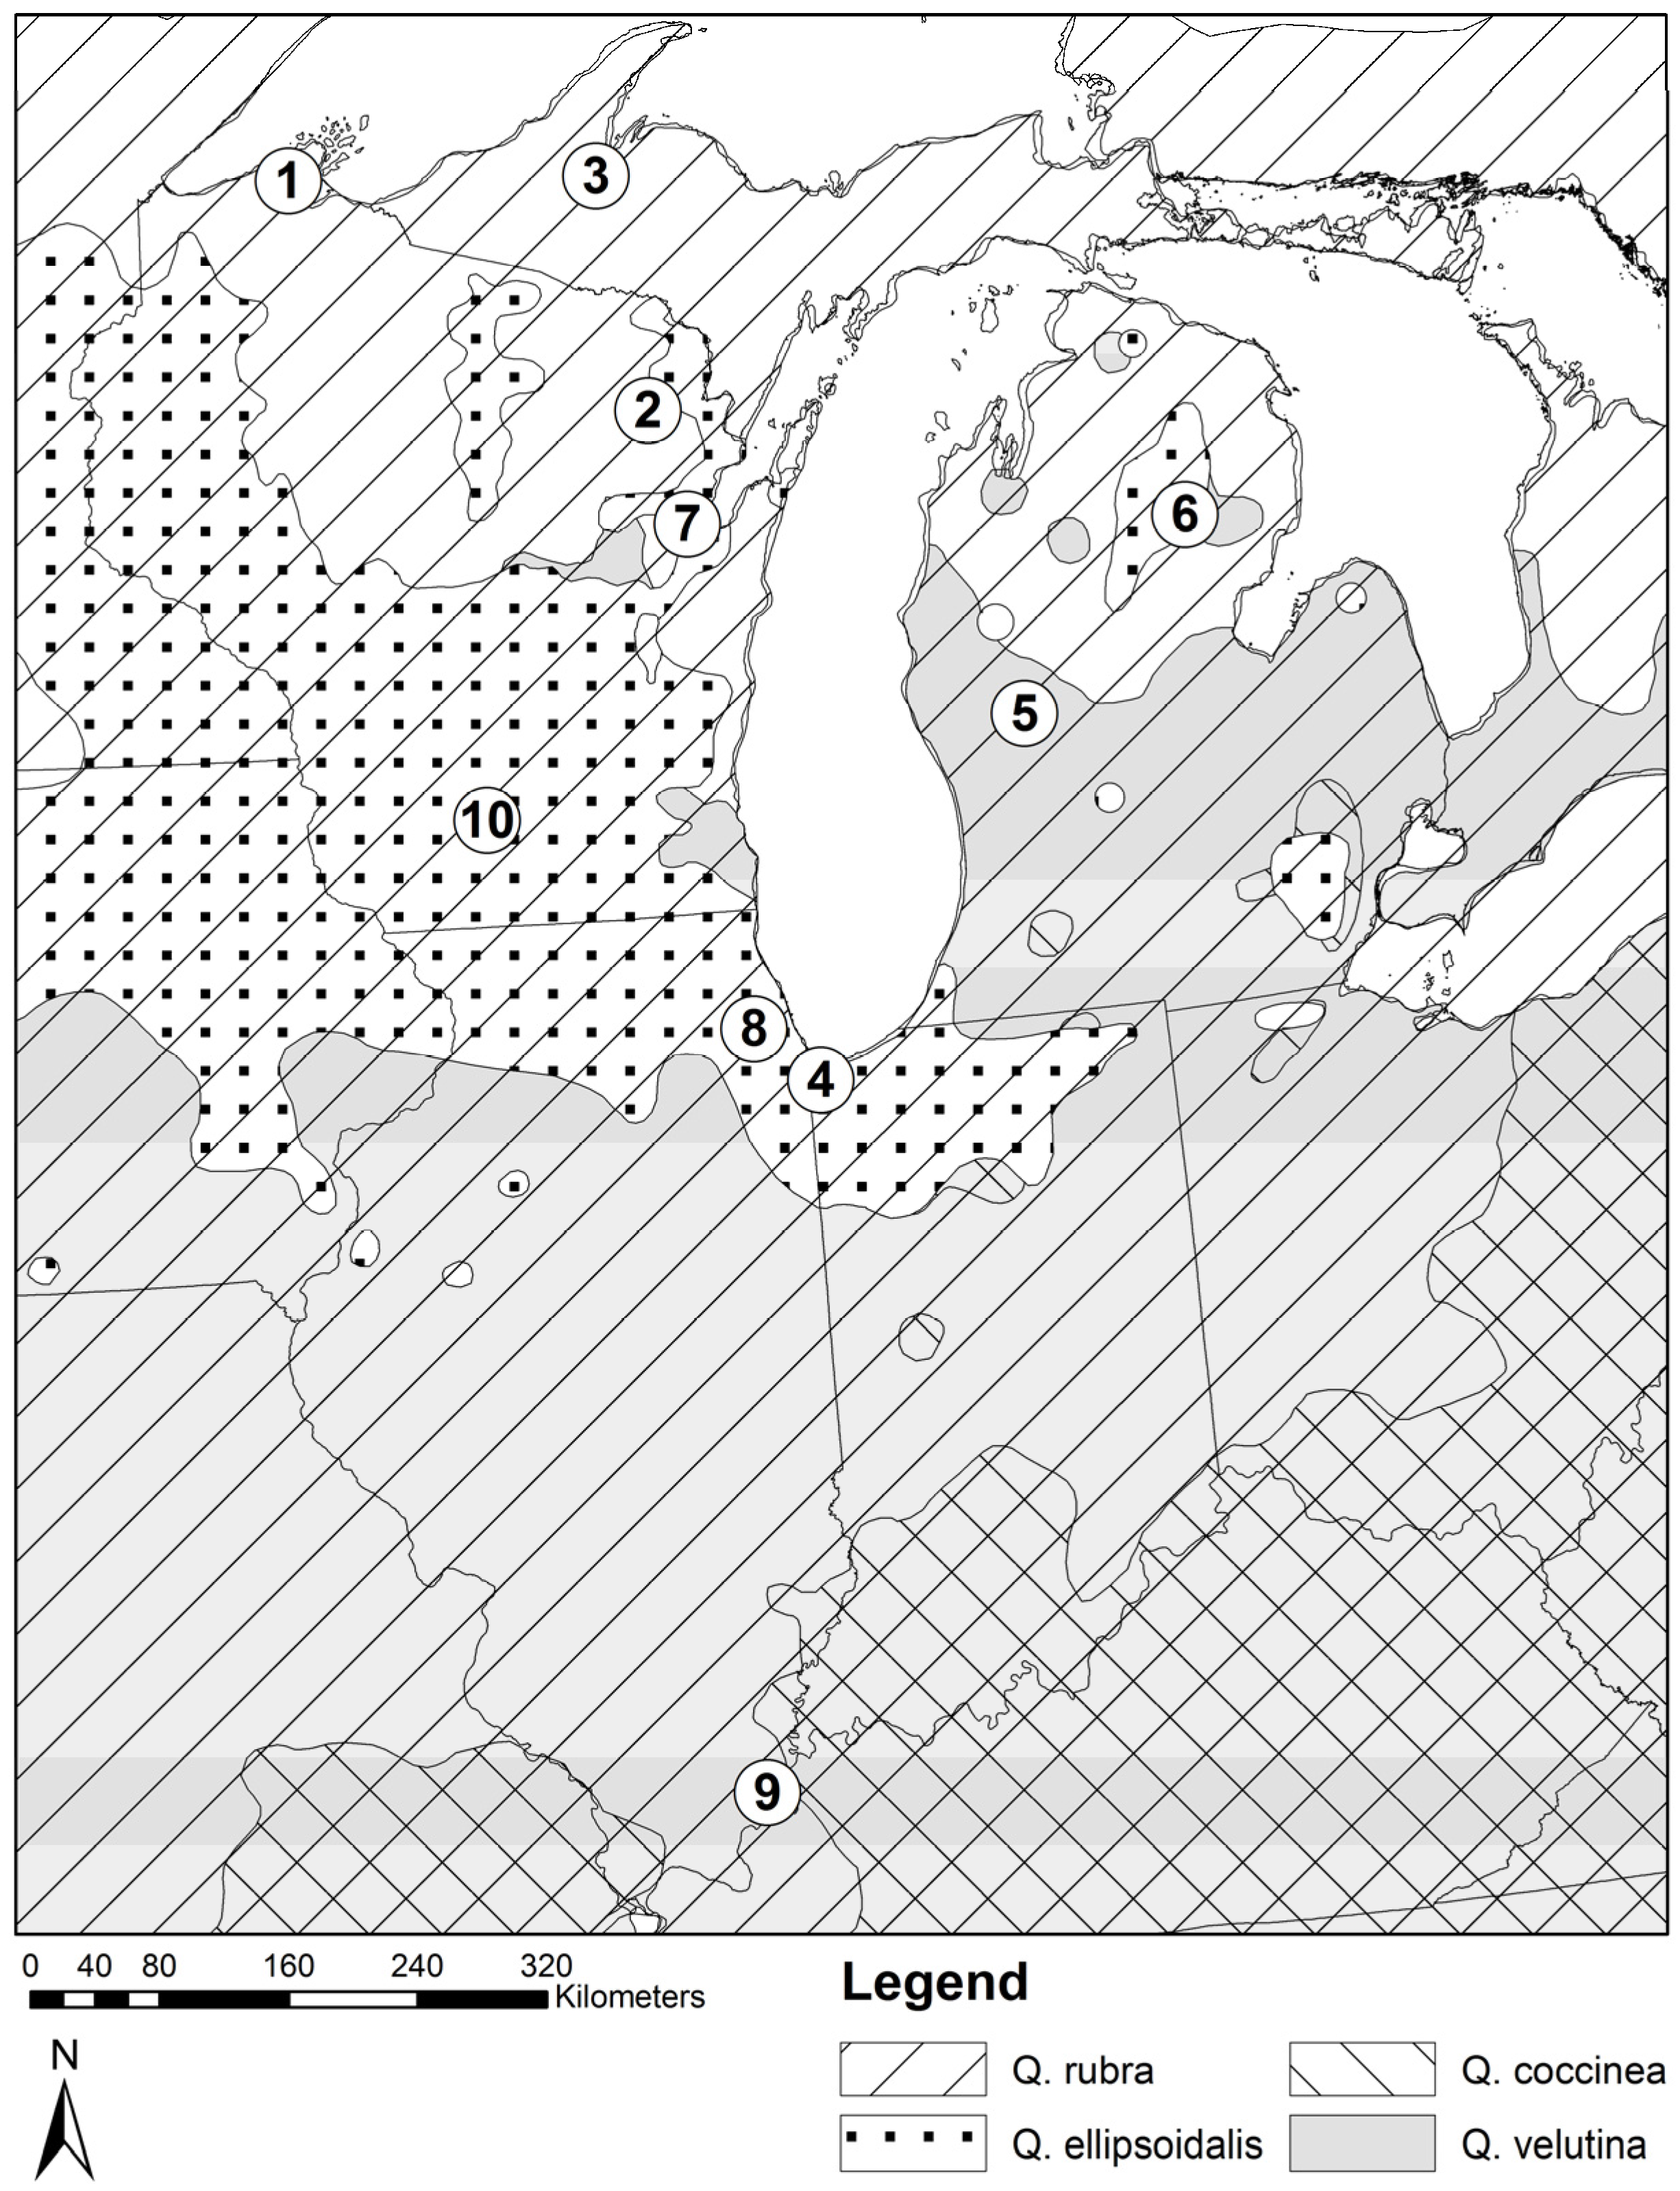
Figure 1. Map of sampled locations; areas 1–2 each include one population pair of Q. ellipsoidalis and Q. rubra, area 3 includes two population pairs of Q. ellipsoidalis and Q. rubra, area 4 includes two mixed Q. ellipsoidalis and Q. velutina populations, areas 5–8 each include one mixed Q. ellipsoidalis and Q. velutina population each, area 9 includes the single Q. coccinea population, and area 10 includes the single sympatric population of Q. rubra/Q. ellipsoidalis/Q. velutina; area number associated with individual populations is shown in Table S1; approximate species ranges are from Little (1971).
Forests 08 00003 g001
Figure 2. Sequence variation at the poly-Q repeat in the COL gene in four red oak species (S = G or C; Y = C or T); codons alternately highlighted in medium grey and white.
Forests 08 00003 g002
Figure 3. Relative genotypic frequencies in four oak species at the FIR013 locus.
Forests 08 00003 g003
Figure 4. FIR013 allele frequencies in each population separated by species. Orange represents the 138 bp allele and blue represents the 141 bp allele. Full names of populations listed in Table S1.
Forests 08 00003 g004
Table 1. Pairwise FST values by species across 11 non-outlier microsatellite markers (upper triangle) and at FIR013 (lower triangle) using GeneAlEx [34].
Q. ellipsoidalisQ. rubraQ. velutina
Q. ellipsoidalis-0.043 ***0.030 ***
Q. rubra0.672 ***-0.032 ***
Q. velutina0.009 *0.625 ***-
* significant at α = 0.05; ** significant at α = 0.01; *** significant at α = 0.001.
Table 2. Relative frequency of FIR013 species-specific alleles in pure Q. ellipsoidalis (QE), Q. rubra (QR), Q. velutina (QV) and Q. coccinea (QC) individuals from 15 parapatric populations and one sympatric population.
Population***SpeciesPopulation TypeSample Size (N)Allele 141 *Allele 138 *
C-QEQEparapatric310.290.65
C-QRQRparapatric310.820.18
N-QEQEparapatric310.240.73
N-QRQRparapatric320.980.02
FC-AQRparapatric360.940.06
FC-CQEparapatric400.180.82
FC-BQRparapatric360.950.05
FC-EQEparapatric370.080.91
HPNSP-IN-LCQEparapatric150.130.77
QV 80.060.94
LS-IN-LCQEparapatric40.250.63
QV 40.250.75
MI-NCQEparapatric800.93
QV 170.240.74
MI-OGCQEparapatric60.080.92
QV 70.140.79
WI-BCQEparapatric80.130.88
WRPNP-IL-CC **QEparapatric70.070.93
QV 80.310.69
QR 101.00
SNF-IL-GCQCparapatric200.030.78
PV-DCQEsympatric110.050.82
QV 170.210.65
QR 160.630.19
* Other minor alleles are not considered here; see Figure 3 and Figure S3; ** All trees in this population were morphologically identified as QE or QV. Genetic assignment analysis identified one individual as QR, ***Full names of populations listed in Table S1.
Table 3. Relative frequency of hybrids and introgressive forms *.
Q. rubra with Introgression from Q. ellipsoidalis or Q. velutinaQ. ellipsoidalis/Q. velutina with Introgression from Q. rubraF1 Hybrids of Q. rubra with Q. ellipsoidalis or Q. velutinaTotal Introgressive Forms and F1 Hybrids between Q. rubra and Q. ellipsoidalis or Q. velutina
Parapatric populations of Q. ellipsoidalis and Q. rubra**
C-QE-0.200.030.23
C-QR0.23--0.23
N-QE-0.180.030.21
N-QR0.20--0.20
FC-A0.13--0.13
FC-C-0.1000.10
FC-B0.00--0.00
FC-E-0.0800.08
Sympatric populations of Q. ellipsoidalis and Q. velutina in parapatry with Q. rubra**
HPNSP-IN-LC-0.040.000.04
LS-IN-LC-0.000.000
MI-NC-0.030.000.03
MI-OGC-0.180.030.21
WI-BC-0.040.040.08
WRPNP-IL-CC-0.000.000.00
Sympatric populations of Q. ellipsoidalis, Q. velutina and Q. rubra**
PV-DC0.240.110.100.45
Q. coccinea population**
SNF-IL-GC-0.000.000.00
* Based on previously published assignment analyses [10,25]. ** Full names of populations listed in Table S1.