Article

Sampling Method and Tree-Age Affect Soil Organic C and N Contents in Larch Plantations

1
Key Laboratory of Forest Plant Ecology, Northeast Forestry University, Harbin 150040, China
2
Northeast Institute of Geography and Agricultural Ecology, Chinese Academy of Sciences, Changchun 130102, China
3
Department of Renewable Resources, University of Alberta, 442 Earth Science Building, Edmonton, AB T6G 2E3, Canada
*
Author to whom correspondence should be addressed.
Forests 2017, 8(1), 28; https://doi.org/10.3390/f8010028
Submission received: 18 November 2016 / Revised: 3 January 2017 / Accepted: 11 January 2017 / Published: 17 January 2017
(This article belongs to the Special Issue Nutrient Cycling and Plant Nutrition in Forest Ecosystems)

Abstract

:
We currently have a poor understanding of how different soil sampling methods (pedogenetic horizon versus fixed-depth) influence the evaluation of soil properties. Here, 159 soil profiles were sampled from larch (Larix gmelinii) plantations in northeast China using both the pedogenetic horizon and fixed-depth sampling methods. Analysis of variance was used to determine how sampling method influences the assessment of the spatial variation in the concentration and storage of soil organic C (SOC) and N (SON), as well as how these properties are affected by tree age-group (<20, 20–40, and >40 years). In both the 20 cm (surface) and 80 cm (whole profile) sampling depths, pedogenetic sampling resulted in 1.2- to 1.4-fold higher SOC and SON concentrations than fixed-depth sampling. Surface soil nutrient storage between the two sampling methods was not significantly different, but was it was 1.2-fold higher (p < 0.05) with pedogenetic sampling than with fixed-depth sampling in the whole soil profile. For a given error limit in SOC and SON assessments, fixed-depth sampling had a 60%~90% minimum sampling intensity requirement compared with pedogenetic horizon sampling. Additionally, SOC was 1.1- to 1.3-fold greater in the >40 years age-group than in the <20 years age-group (p < 0.05), while SON was the highest in the 20–40 years age-group (p < 0.05). The total amount of SOC and nutrients in soil is fixed regardless how you sample, it is the different assumptions and different ways of extrapolation from samples to the population that cause sampling by horizon versus fixed depth to lead to different conclusions. Our findings highlight that soil sampling method and tree age-group affect the determination of the spatial variation of SOC and SON and future soil assessments should control for methodological differences.

1. Introduction

Accurate evaluation of soil properties is important for species-to-location matching during afforestation, precision agroforestry [1,2,3], and the investigation of forest ecological functions such as carbon (C) sequestration and nutrient dynamics [4]. Soil heterogeneity occurs horizontally and vertically [5]; thus, the lack of a standardized sampling procedure to assess soil fertility and C inventory could affect conclusions drawn from different studies. Therefore, research is needed to understand how sampling method influences the evaluation of the inter-site variations (i.e., interaction between sampling method and site variation) of soil nutrients. Accounting for the effect of sampling method could improve comparability among studies [6,7], particularly in terms of between-site soil fertility assessments [8].
Forest development with age can increase C storage and recover nutrient levels in soils degraded by long-term agricultural cultivation [9,10,11,12]. Soils can range from being a C sink (11 to 238 g·C·m−2·year−1) [4,13,14,15] to a source of atmospheric CO2 (0.1 to 14.1 g·C·m−2·year−1) [11,16]. Additionally, studies examining post-afforestation conditions have reported both the depletion of soil nutrients [4,10,17,18,19] and the accumulation of soil organic N (SON) with increasing soil organic C (SOC) [9,12,20] over time (e.g., tree age effect). Previous land use, the tree species planted, and soil nutrient supply are thought to explain the contradictions in tree age effects on soil properties after afforestation [9,10,11,12,17,18,19,20]. Furthermore, forest age itself [21], soil depth, and other site-related variations [22,23,24,25] have been used to describe the spatial and temporal changes in nutrient accumulation. However, differences in sampling methods (fixed-depth [4,11,13] versus pedogenetic horizon [26,27,28] sampling) are a potentially powerful explanation for between-study differences in soil properties [29,30] that has not been fully studied. Indeed, comprehensive research including soil sampling method, sampling site, sampling depth, and tree age would provide a more holistic view of how different sampling methods alter evaluations of SOC and SON.
The objective of this study was to determine how soil sampling method, sampling site, sampling depth, and tree age independently and interactively influence SOC and SON, particularly variation across the soil profile in different soil depths and the effect of tree age. The investigation took advantage of widespread larch plantations (4.5 million hectares, or 70% of the total plantation area) available in northeastern China [11,31]. We hypothesized that soil sampling methods could greatly affect the evaluations of spatial changes of and tree-age effects on SOC and N, independent of soil depth inclusion and unit expression of storage or concentration. Our results may contribute to improving inter-study comparisons of SOC and SON measurements, leading to a broader study applicability and improved interpretation of conclusions drawn across disparate reports.

2. Materials and Methods

2.1. Study Site and Soil Sampling

All sampling was conducted in Larix gmelinii plantations located in northeast China. This region (45°20′–47°14′ N, 127°30′–128°55′ E) has a continental monsoon climate with mean annual temperatures ranging from −0.3 to 2.6 °C and mean annual precipitation ranging from 676 to 724 mm. The soil is generally a typical Dark-Brown Forest Soil, with occasional eluviation features. The soil in Chinese Soil Taxonomy is Mollic Bori-udic Cambosols or Albic Bori-udic Cambosols [32]; it is a Eutroboralf in the US Soil Taxonomy and a Halic Luvisol in the FAO (Food and Agriculture Organization) system [33]. Soil pH ranges from 4.9 to 6.5. The details of the study sites have been previously described [11].
A total of 159 plots were sampled from four sites: the Laoshan experimental station (LS; 57 plots), the Maoershan experimental farm (MES; 37 plots), the Dongshan forest farm (DS; 30 plots), and the Daqingchuan forest farm (DQC; 35 plots).
Fixed-depth and pedogenetic horizon sampling were employed for soil sampling. Soil cutting rings with a 100 cm3 volume were used for sampling soil from a soil pit. A soil pit was excavated in each of four subplots established in each of the 159 20 m× 20 m plots (for a total of 636 soil pits), and the samples from the four pits from the same horizon/layer of the same sampling method were mixed to form a composite sample for that layer and plot. Soil samples were collected from one or two sides of the pit for sampling the same layer or depth. Those composite samples from a plot make up the samples for a soil profile for each plot. Such composite samples better represent the soil from a plot. Under fixed-depth sampling, the soil was collected from four depths: 0–20, 20–40, 40–60, and 60–80 cm. Under pedogenetic horizon sampling, soil samples were collected from the A, B, and C horizons. The first horizon contains partially humified organic matter, giving the soil a darker color than soils from lower horizons. The second horizon has undergone sufficient changes during soil genesis, with maximum accumulation of materials such as silicate clay, metal (e.g., Fe and Al) oxides, and organic material. The third horizon comprises unconsolidated material below the solum (A and B horizons) that is little affected by soil-forming processes and lacks pedogenic development.
A total of 1067 composite soil samples were collected (pedogenetic: 113 plots × 3 samples with one each from horizons A, B, and C, plus 46 plots with only A and B horizons, for a total of 431 samples; fixed-depth: 159 plots × 4 samples from the four depths = 636 samples). At the time of sampling, the soil samples were placed in cloth soil-sampling bags for transportation back to the laboratory. To compare the effect of sampling method, the surface soil layer (0–20 cm) and the whole profile soil (0–80 cm) as two sampling depths were examined in this study. In other words, within the 0–20 cm and 0–80 cm sampling depths, we assessed the impact of sampling method on the assessment of SOC and SON.
Tree age was determined using an increment borer (Zhonglinweiye, Beijing, China) on at least five trees in each plantation plot. Fifty-six plots contained trees younger than 20 years (<20 years age-group), with an average tree age of 8.1 ± 7.1 years (SD, standard deviation). The second age-group (20–40 years) had 73 plots, with an average tree age of 25.5 ± 5.3 years. The third age-group (>40 years) had 30 plots and an average tree age of 44.8 ± 2.3 years.

2.2. Bulk Density, SOC, and SON Measurements

Once the soil samples were brought back to the laboratory, they were air-dried in a ventilated room until they reached a constant weight. Cutting rings with a 100 cm3 volume were used for intact bulk density measurement, and bulk density was determined based on the oven-dried mass and volume (400 cm3 of soil from four cutting rings as a composite sample) of each site. In the fixed-depth sampling, we measured one soil bulk density at each soil depth (0–20, 20–40, 40–60, and 60–80 cm) of each site. In the pedogenetic sampling, we measured one soil bulk density in each horizon (A, B, and C) of each site, and in some places, the soil bulk density at some transitional horizons (e.g., AB horizon) was also measured. Soil was ground to <0.25 mm for measuring SOC and SON concentrations with a heated dichromate/titration and the semimicro-Kjeldahl method, respectively. Details about those methods are available in a previous publication of our group [11].

2.3. Storage Calculation

The storage of SOC and SON was calculated with the following equation:
Storage (g·m−2) = a × ρb × depth × (1− Vgravel),
where a is SOC or SON concentration (g·kg−1), ρb is soil bulk density (g·cm−3 = Mg·m−3, Mg: million gram), and Vgravel is the fraction of gravel volume (determined via water displacement) in the soil.

2.4. Assessing the Effect of Sampling Method on Tree Age Effect and Spatial Variation in SOC and SON

Analysis of variance (ANOVA) was used to determine whether soil sampling method affected the spatial variation (among study sites) of SOC and SON and differences among tree age-groups. Specifically, we examined whether study site and age-group interacted with sampling method (all were included in the model as fixed factors). The concentration and storage of SOC and SON at 0–20 and 0–80 cm soil were analyzed. Duncan post-hoc tests were then conducted to identify the specific parameter (SOC concentration, SOC storage, SON concentration, and SON storage) that was affected by site, age-group, and sampling method. Marginal means were estimated and pairwise comparisons (LSD test) were used to separate the means across predictor variables, and their interactions with sampling method (site × method and age-group × method). All of these analyses were performed in SPSS 17.0 (SPSS Inc., Armonk, NY, USA).

2.5. Number of Samples Required for Estimating SOC and SON at Specific Error Limits

As a way of quantifying differences between the two soil sampling methods, statistical analyses [34,35] were conducted to compare the number of sampling points (n) required for estimating mean SOC and SON at a site within 5%, 10%, 20%, and 30% of its actual value, at the 95% probability level for both datasets (pedogenetic and fixed-depth). The following equation was used:
n = t α 2 s 2 D 2 ,
where tα is the Student’s t statistic with degrees of freedom at the α probability level, s is standard deviation, and D is the specified error limit. Only the SOC and SON concentration data were used as patterns in the storage data were similar.

3. Results

3.1. Differences between Sites, Sampling Methods, and Age-Groups

The SOC and SON concentrations in both the surface and whole profile soil differed significantly among sites (p < 0.001) and age-groups (p < 0.05), and between sampling methods (p < 0.001). However, SOC and SON storage did not follow the same pattern. For example, no difference between sampling methods was observed in surface soil SOC storage (p > 0.05; Table 1).
The highest SOC and SON concentrations were usually observed at DQC or DS, while the lowest values were found in LS (Table 2). Inter-site variation (the highest/lowest ratio) was 2.8 and 3.5 for surface soil SOC and SON, respectively, whereas inter-site variation was 2.9 and 3.2 for SOC and SON, respectively, in the whole profile soil. The highest SOC and SON storage in surface and whole profile soils were found at DS and DQC, respectively, with the lowest values at LS. The ratios of the highest to the lowest values for SOC and SON storage in the surface soil were 2.3 and 2.6, respectively, while those for the whole profile soil were 2.5 and 2.7, respectively (Table 2).
Pedogenetic sampling generally yielded higher SOC and SON concentrations (Table 2). Surface and whole profile soil SOC and SON concentrations were 1.2- to 1.4-fold higher in pedogenetic than in fixed-depth sampling (Table 2). Different patterns were found in their storage. Whole profile soil storage of both SOC and SON was 1.2-fold higher under pedogenetic than under fixed-depth sampling (p < 0.05), but the difference was only 1.05- to 1.07-fold (p > 0.05) for the surface soil (Table 2).
Age-group differences increased linearly from <20, to 20–40, and >40 years groups in SOC concentration and storage in the surface soil, SON concentration in the surface soil, and SOC storage in the whole profile soil (Table 2). Forests in the 20–40 years age-group exhibited peak whole profile soil.
SOC and SON concentrations, as well as whole profile soil and surface soil SON storage (Table 2). In general, the >40 years group had 1.1- to 1.3-fold higher SOC than the <20 years age-group, while the 20–40 years group tended to have higher SON (Table 2).

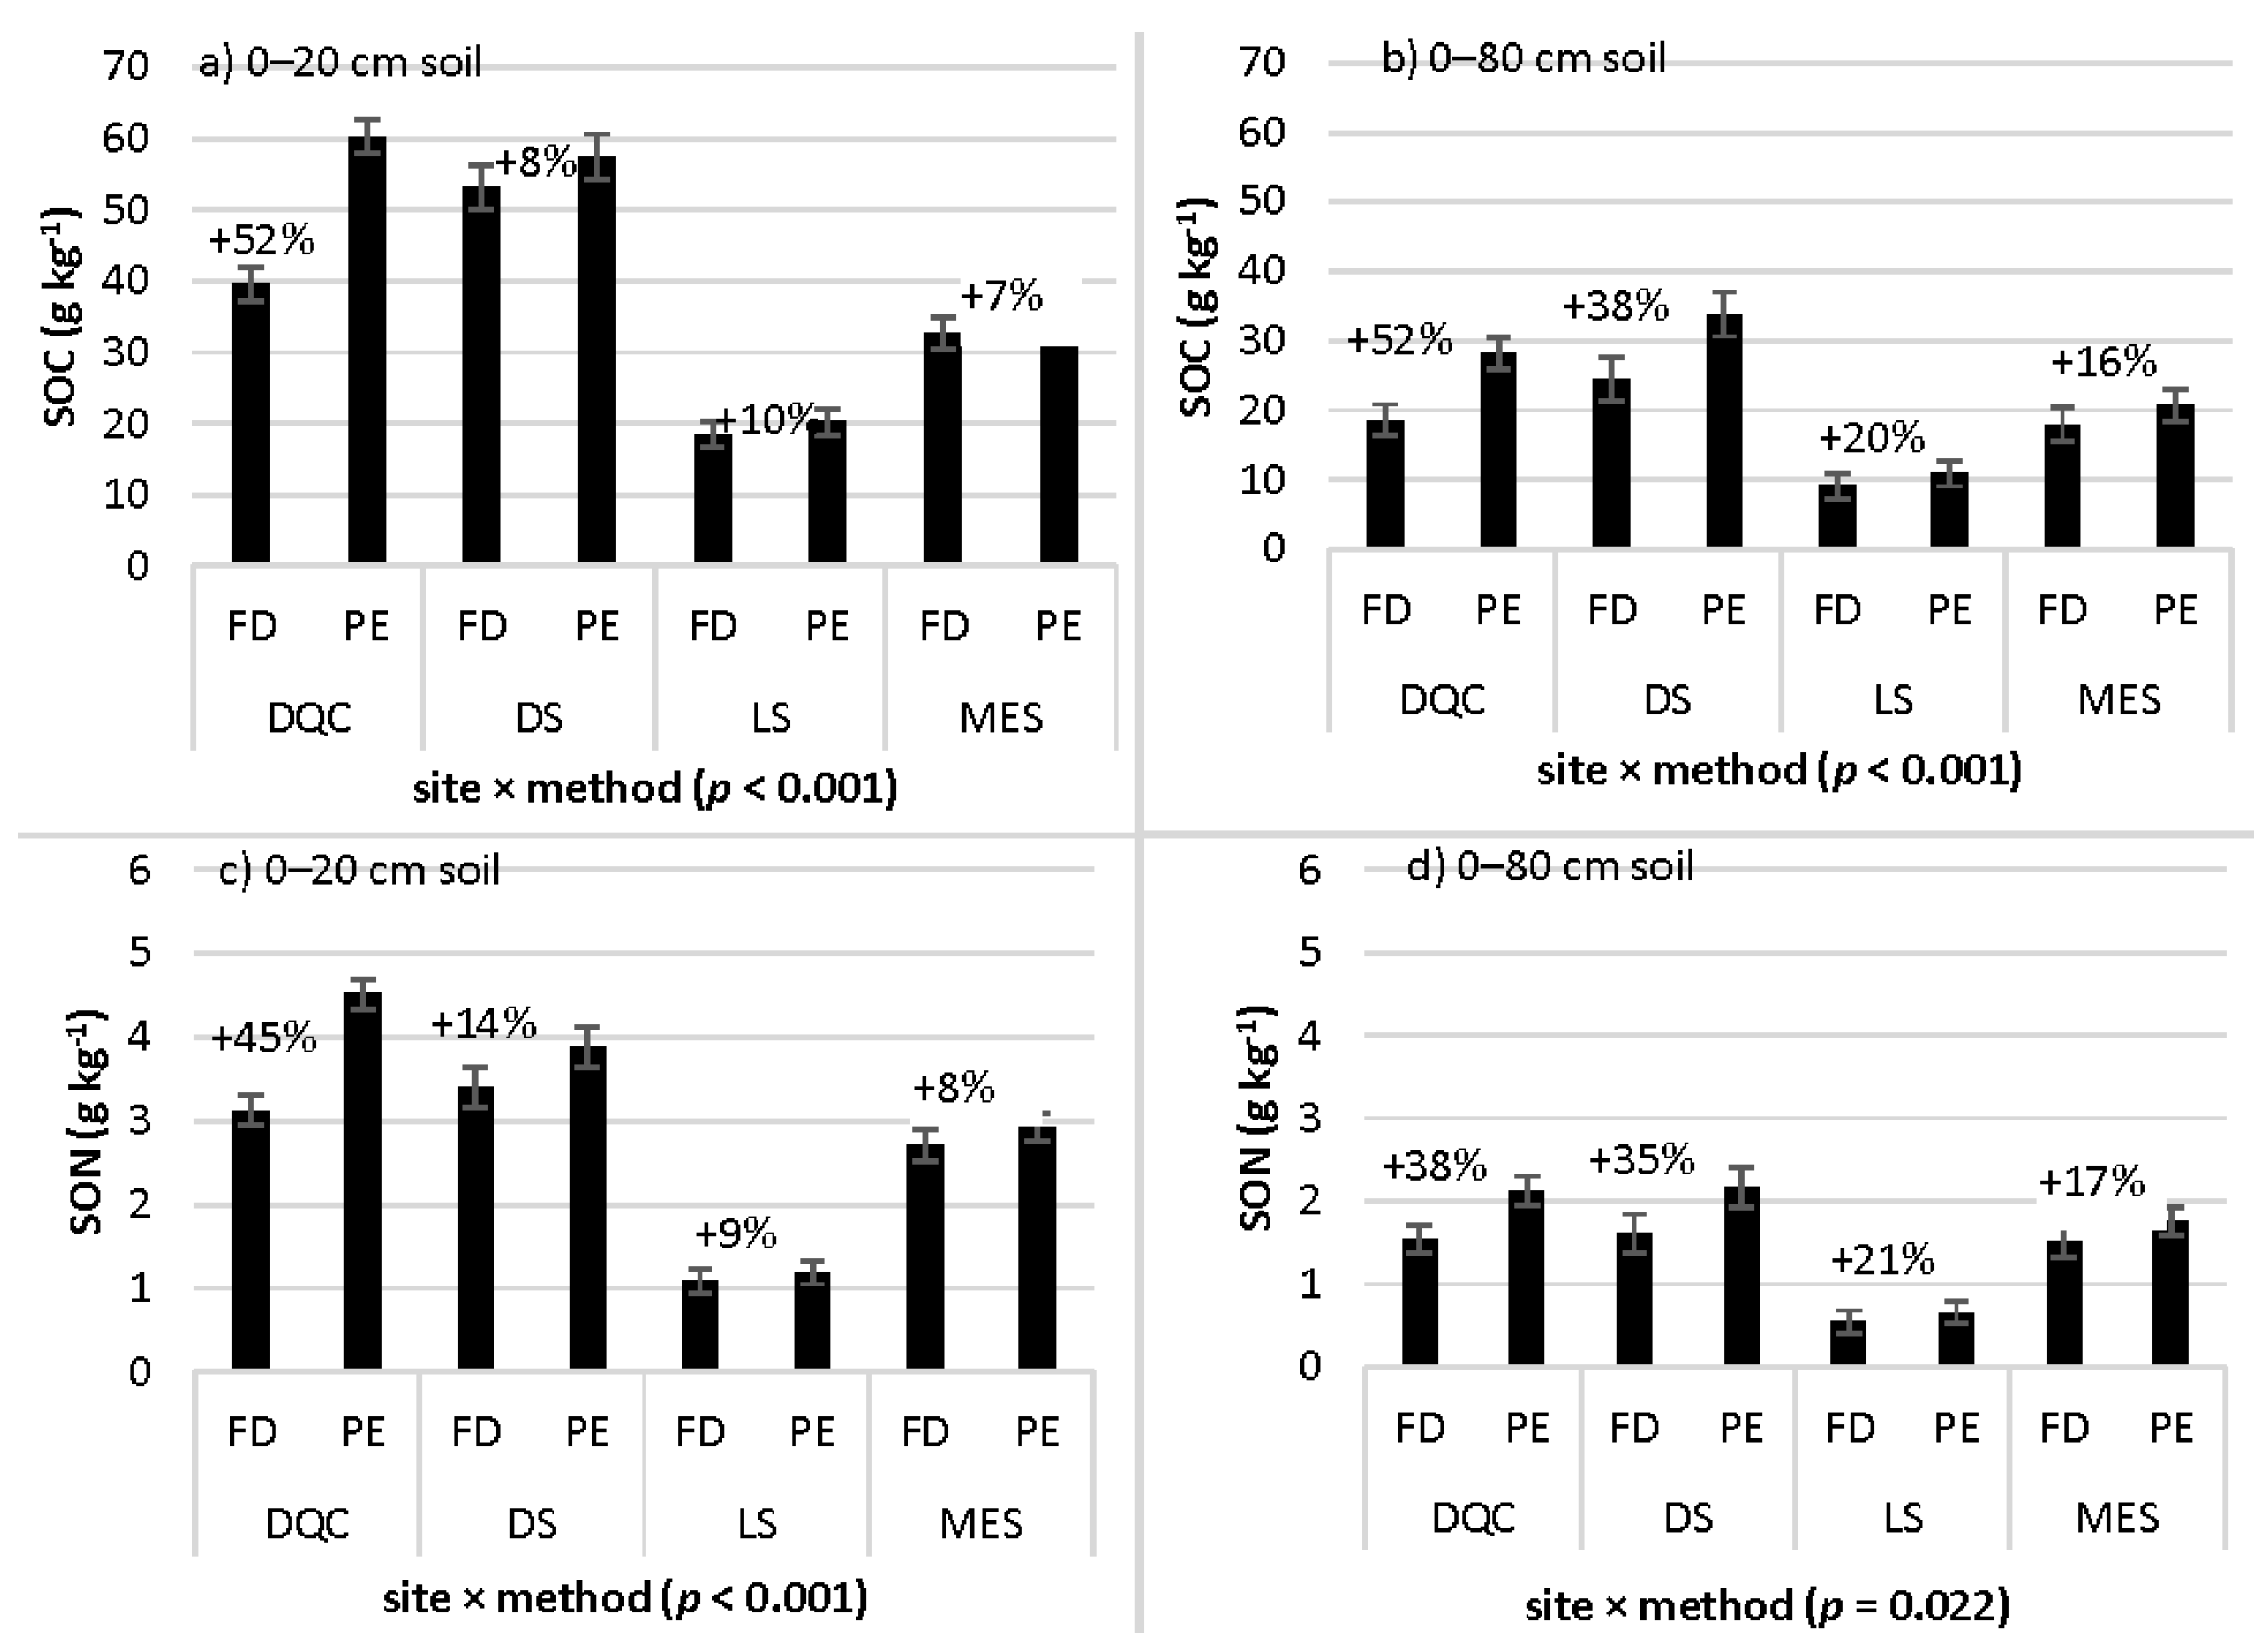
3.2. SOC and SON Concentrations Across Study Sites: Interaction with Sampling Method

Marked site by sampling method interaction was found for SOC and SON concentrations in the surface and whole profile soil (Table 1; Figure 1). Both surface and whole profile soil SOC concentrations were higher with pedogenetic than with fixed-depth sampling. Inter-site differences were also found (Figure 1). The highest increases from one sampling method to another in surface soil SOC concentrations generally occurred in DQC (52%), while moderate increases (7%–10%) were observed in DS, LS, and MES (Figure 1). The whole profile soil (0–80 cm) typically accompanied higher SOC in pedogenetic sampling than in fixed-depth sampling. For example, SOC concentration at DS was 8% higher with pedogenetic sampling than with fixed-depth sampling in the surface soil, whereas it was 38% higher when the whole profile soil was evaluated. Furthermore, at LS, SOC in the surface soil was 10% higher, but that in the whole profile soil was 20% higher in pedogenetic than in fixed-depth sampling (Figure 1).
Sampling influence on SON concentration was similar to that on SOC. Pedogenetic sampling led to higher SON in both surface and whole profile soil as compared with fixed-depth sampling, again with differences among sites (Figure 1). The largest increases (38%–45%) of pedogenetic over fixed-depth sampling occurred at DQC, whereas the other sites had relatively smaller sampling-induced changes (14%–35% at DS, 9%–21% at LS, and 8%–17% at MES; Figure 1). In the surface soil, pedogenetic sampling resulted in 14% (DS), 9% (LS), and 8% (MES) increases in SON concentration as compared with fixed-depth sampling, whereas the increases were 35% (DS), 21% (LS), and 17% (MES) when the whole profile soil was evaluated (Figure 1).

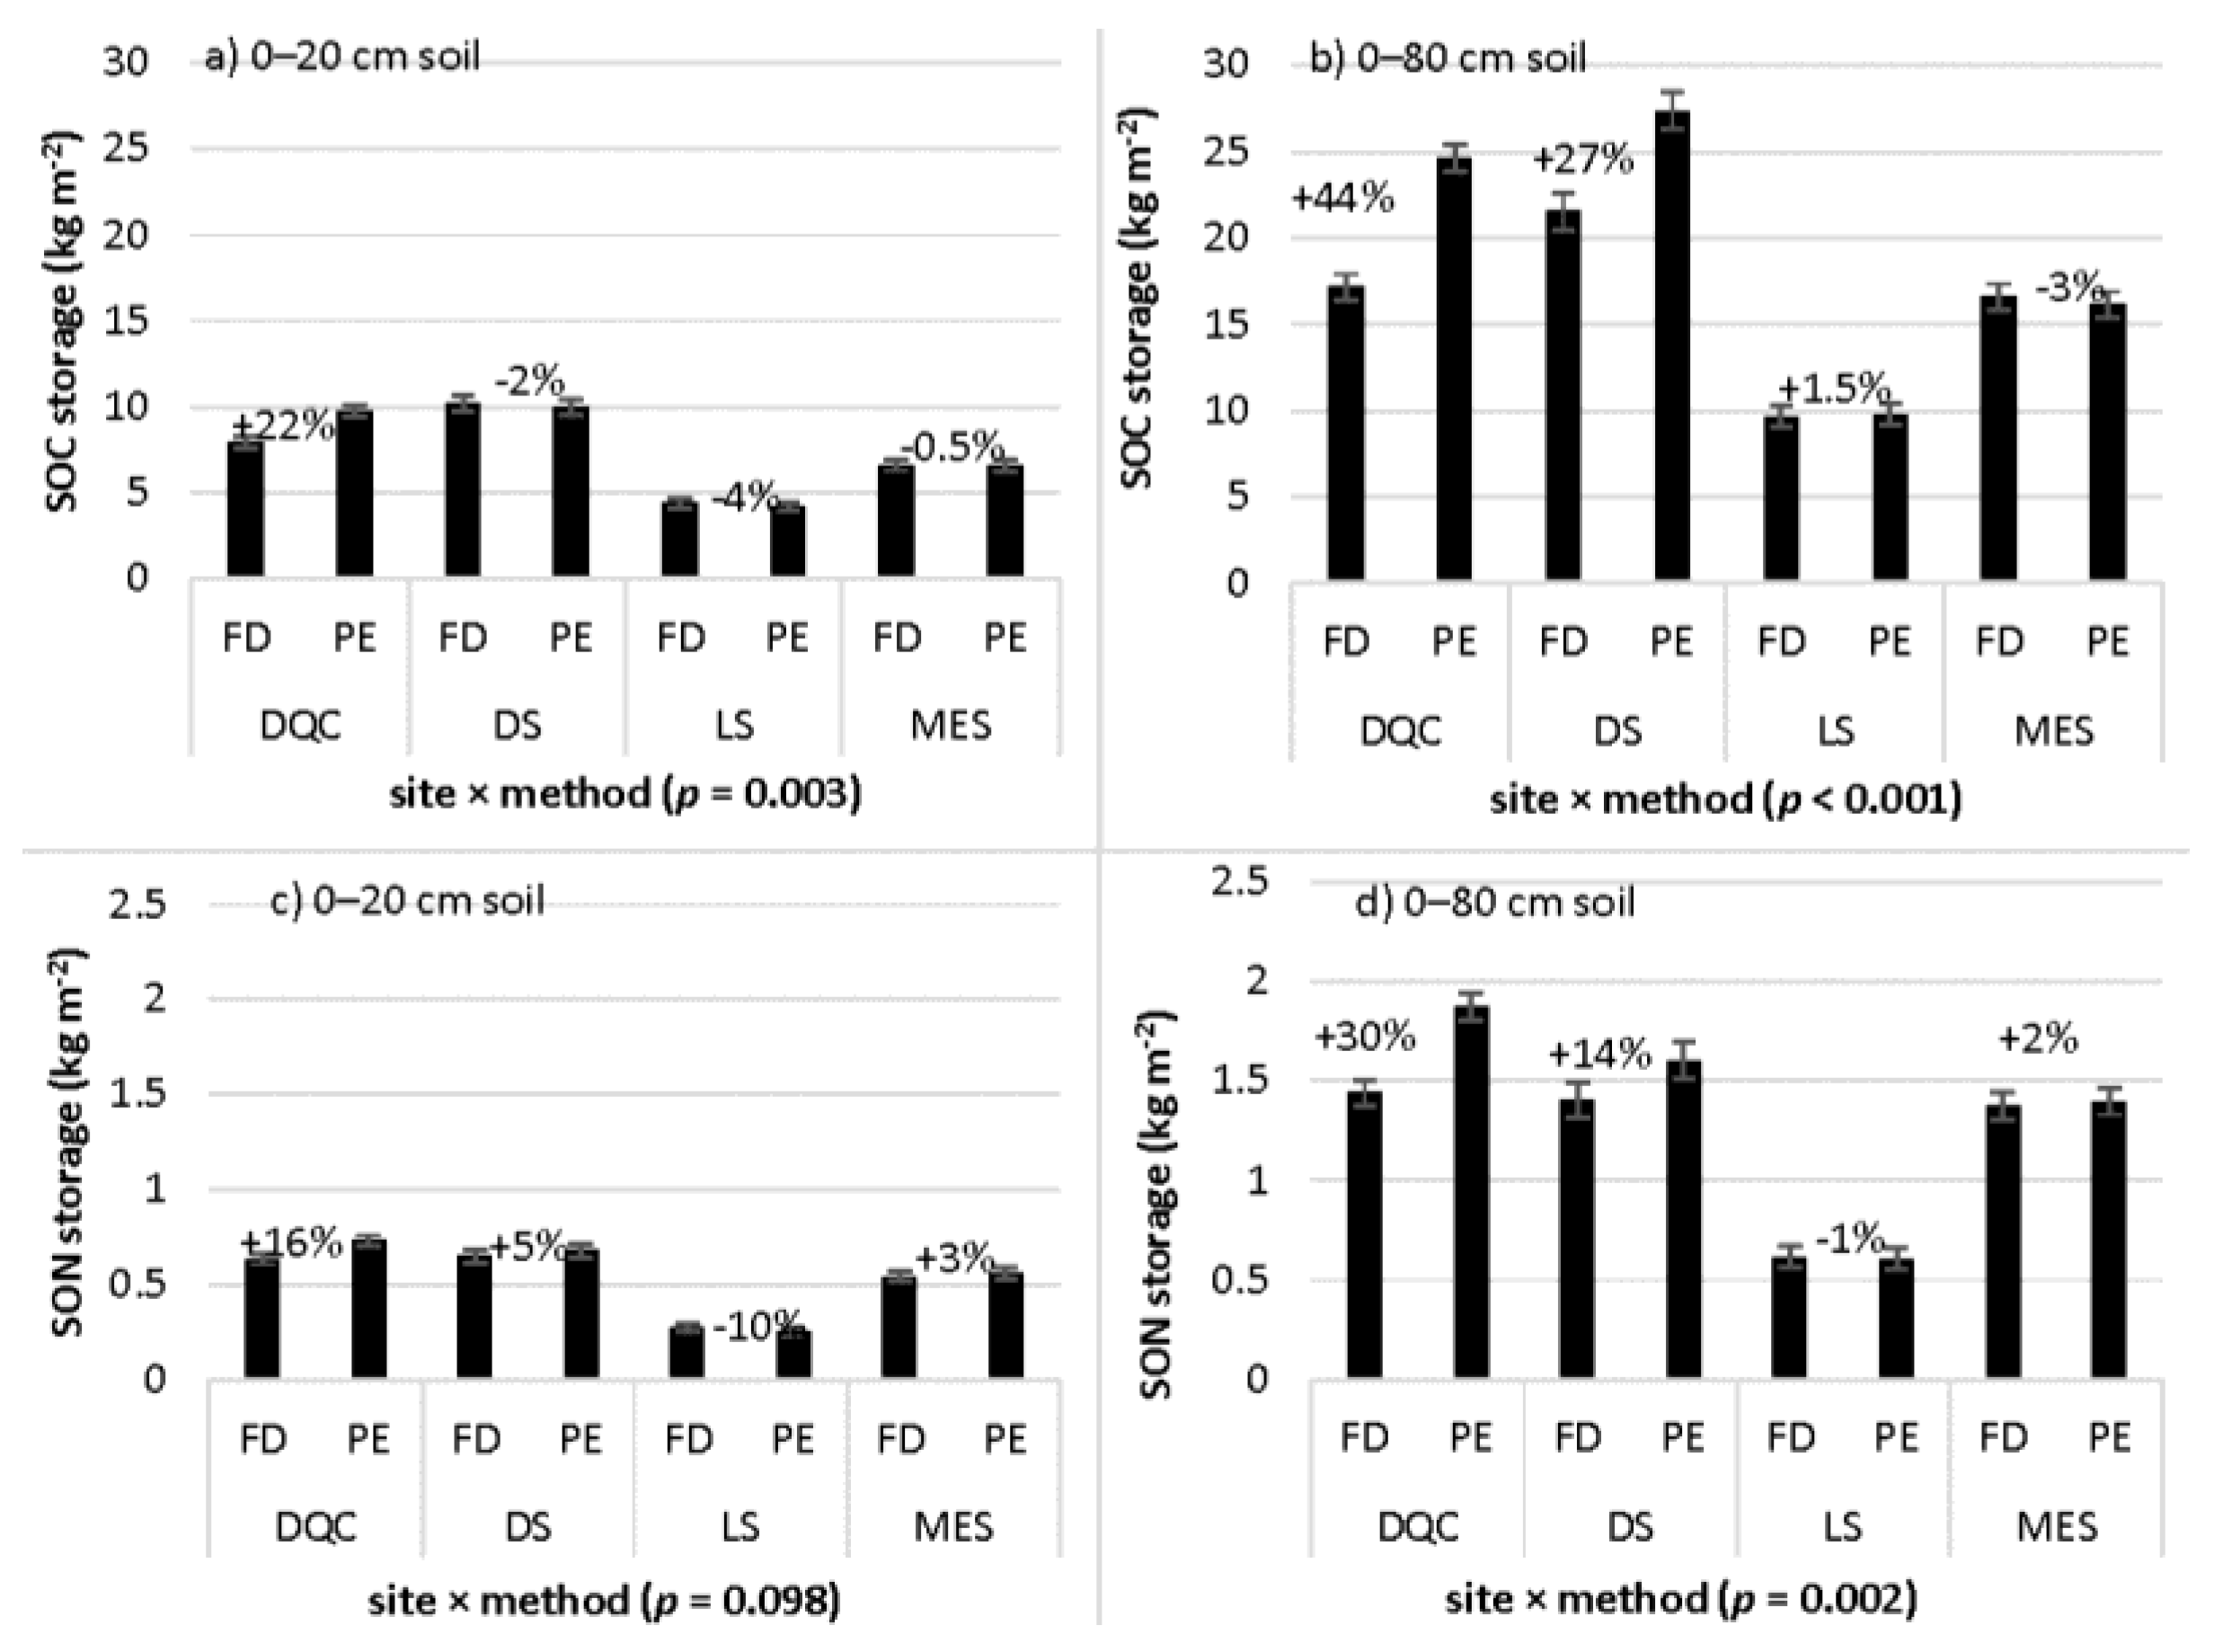
3.3. SOC and SON Storage across Study Sites: Interaction with Sampling Method

The interaction between sampling method and study site significantly affected SOC and SON storage in the two sampling depths, except SON storage in the surface soil (Table 1; Figure 2). At DQC, pedogenetic sampling resulted in 16%–22% higher SOC and SON storage compared with fixed-depth sampling in the surface soil; and 30%–44% higher SOC and SON storage when the whole profile soil was considered. At DS, there was a <6% difference in SOC and SON storage in the surface soil, and a 14%–27% increase in the whole profile soil from pedogenetic to fixed-depth sampling. Additionally, SOC and SON storage values were similar under both methods at LS and MES (Figure 2).

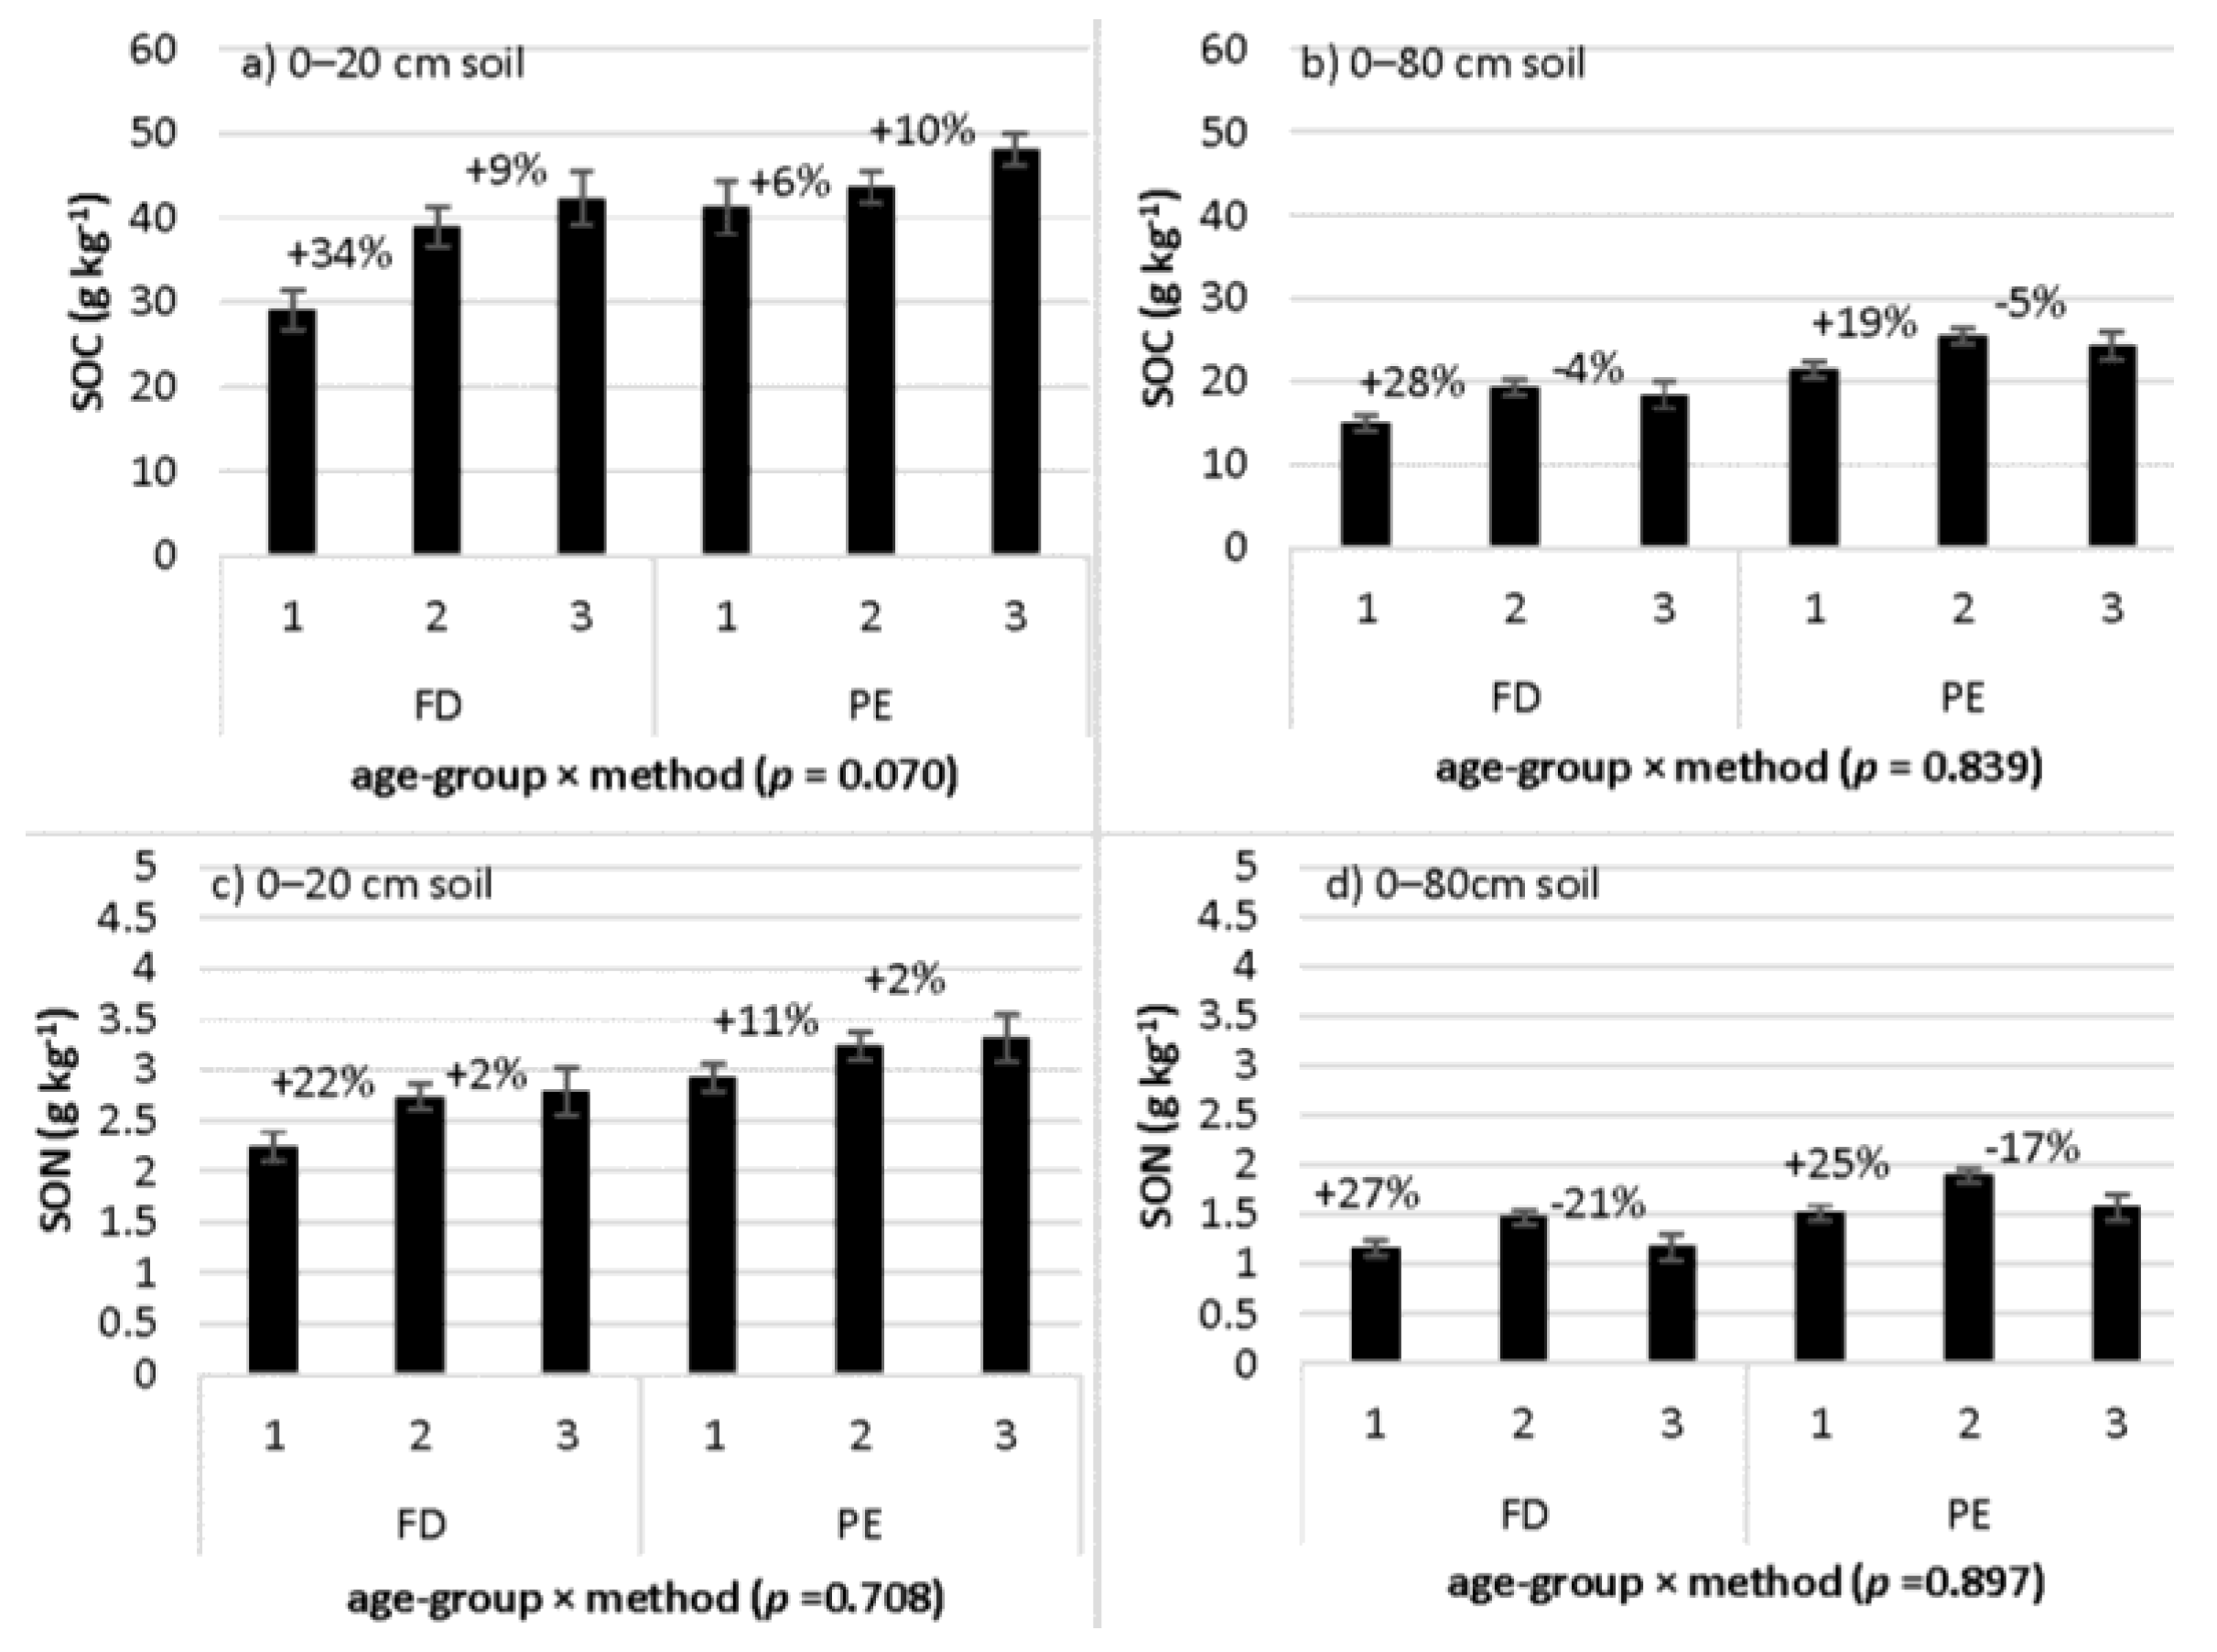
3.4. Age-Group Differences in SOC and SON Concentrations: Interaction with Sampling Method

Age-group effects were similar between the two sampling methods for both SOC and SON concentrations (age-group* method interaction: p > 0.05; Table 1 and Figure 3). Moreover, age-group related differences were apparent in surface versus whole profile soil (Figure 3).
Both pedogenetic and fixed-depth sampling found sharp increases (6%–34%) in surface soil SOC concentrations from the <20 years to the 20–40 years age-group, which then moderately increased (9%–10%) from the latter to the >40 years age-group. Similarly, both fixed-depth and pedogenetic sampling found sharp increases (11%–22%) in SON concentration in the surface soil from the <20 years to the 20–40 years age-group, also followed by a small increase (2%) to the >40 years age-group (Figure 3).
Unlike in the surface soil, SOC and SON concentrations in the whole profile soil were lower in the >40 years age-group compared with the 20–40 years age-group (Figure 3). Both sampling methods found sharp increases (19%–28%) in SOC concentration in the 20–40 years age-group from the <20 years age-group, but 4%–5% decreases from the 20–40 years age-group to the >40 years group. Both sampling methods also found sharp increases (25%–27%) in SON concentration in the 20–40 years age-group from the <20 years age-group, followed by 17%–21% decreases in the >40 years age-group from the 20–40 years age-group (Figure 3).
Owing to non-significant interactions between the age-group and sampling method (Figure 3), the age-group effect could be expressed as group means of the two sampling methods (Table 2). For the surface soil, marked increases in SOC and SON concentrations were found in the 20–40 years age-group from the <20 years age-group, while no marked changes were found between the 20–40 years and >40 years age-groups. However, different patterns were found in the 0–80 cm soil, with marked decreases of SON concentrtion from the 20–40 years age-group to the >40 years age-group (Table 2).

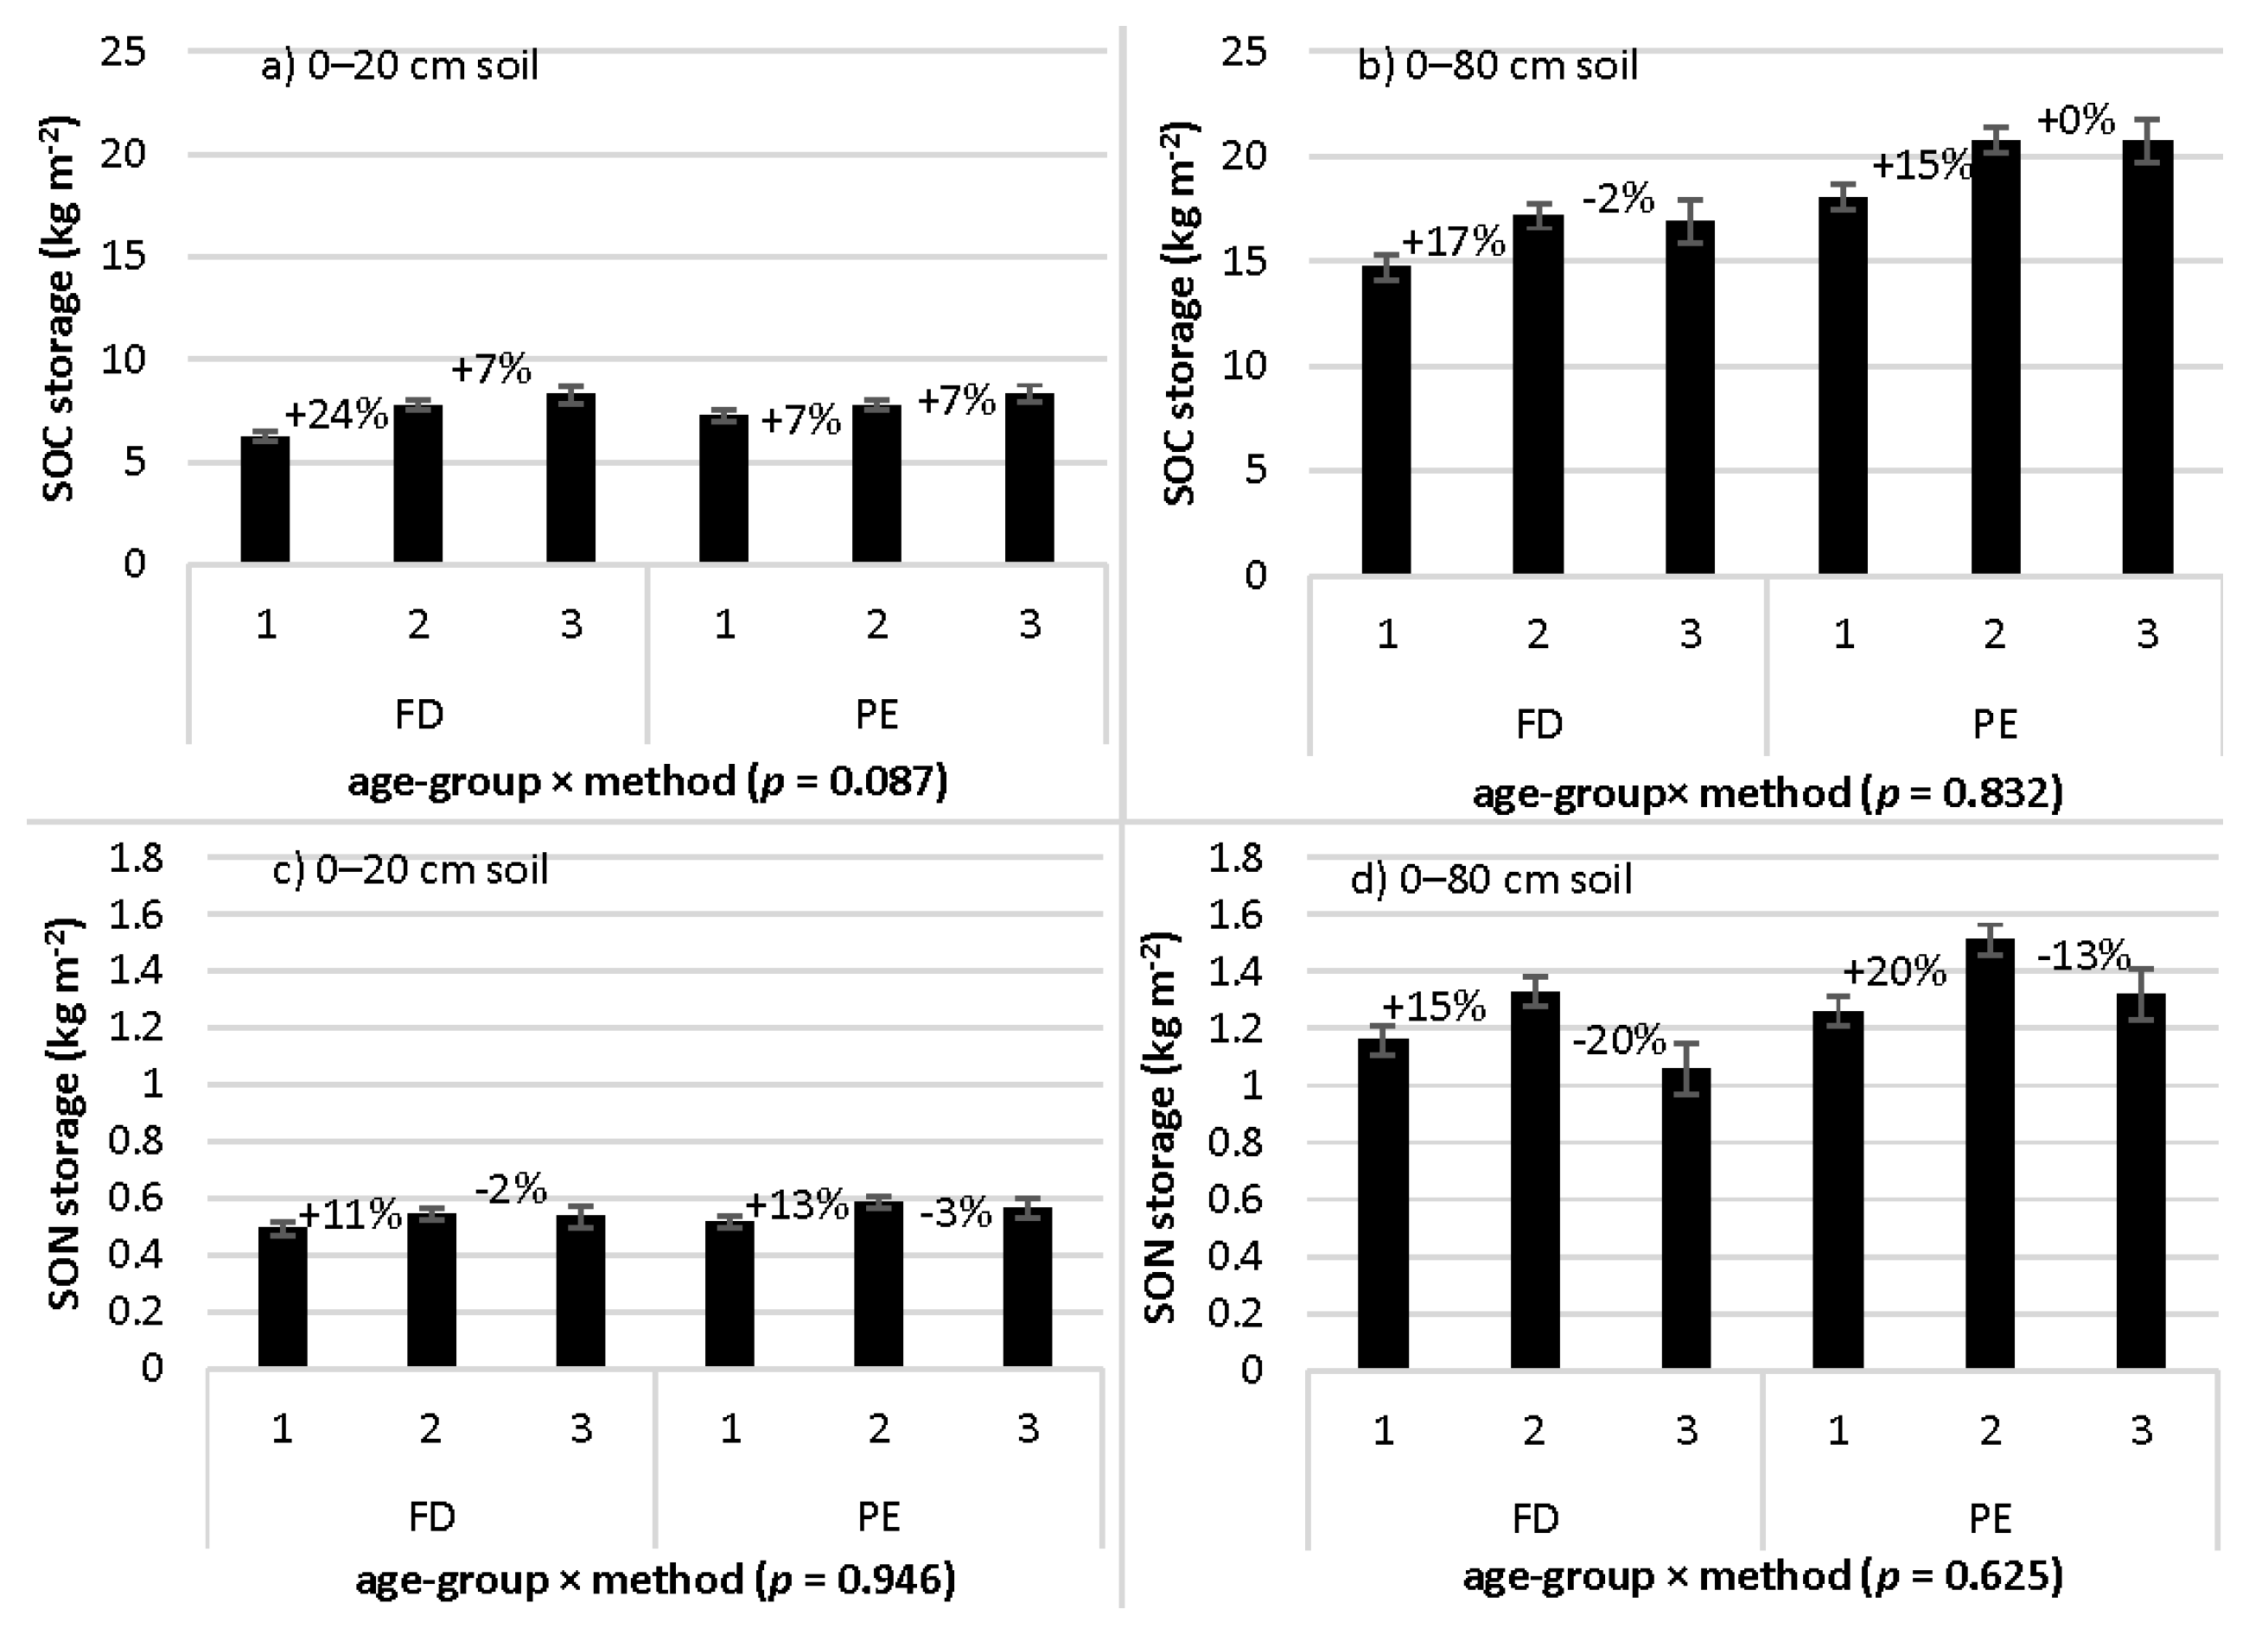
3.5. Age-Group Differences in SOC and SON Storage: Interaction with Sampling Method

Similar to SOC and SON concentrations, the sampling method did not alter age-group effects on SOC and SON storage (non-significant age-group × method interaction; Table 1 and Figure 4). Both fixed-depth and pedogenetic sampling revealed increases (11%–13%) in SON storage from the <20 years to the 20–40 years age-group, then small decreases (2%–3%) from the 20–40 years to the >40 years age-group. In addition, both sampling methods found sharp increases (7%–24%) in SOC storage from the <20 years to the 20–40 years age-group, then small increases (7%) from the 20–40 years to the >40 years age-group. Age-group differences in the whole profile soil SOC and SON storage clearly contrasted those in the surface soil (Figure 4). For example, there were sharp increases (15%–17%) in SOC storage from the <20 years to the 20–40 years age-group, but then no obvious changes (0%–2% decreases) between the 20–40 years and the >40 years age-groups regardless of the sampling method used. Furthermore, there were sharp increases (15%–20%) in SON storage from the <20 years to the 20–40 years age-group, and 13%–20% decreases from the 20–40 years to the >40 years age-group regardless of the sampling method used (Figure 4).
There were moderate increases in SOC storage and sharper decreases in SON storage from the 20–40 years to the >40 years age-group when the whole profile soil was considered (Figure 4). For example, surface soil SOC storage in the >40 years age-group was 7% higher than that in the 20–40 years age-group, whereas the percentage difference was a decrease of 0%–2% in the whole profile soil. Moreover, surface soil SON storage in the >40 years age-group was 2%–3% lower than that in the 20–40 years age-group, but the percentage difference increases to 13%–20% in the whole profile soil (Figure 4).
Owing to non-significant interactions (Figure 4), the age-group effect could be expressed as pooled means of two sampling methods (Table 2). For the surface soil, marked increases in SOC and SON storage were usualy found from the <20 years to the 20–40 years age-group, while no marked changes were found between the 20–40 years and >40 years age-groups. However, different patterns were found in the 0–80 cm soil, with marked decreases of SON storage in the >40 years age-group (Table 2).

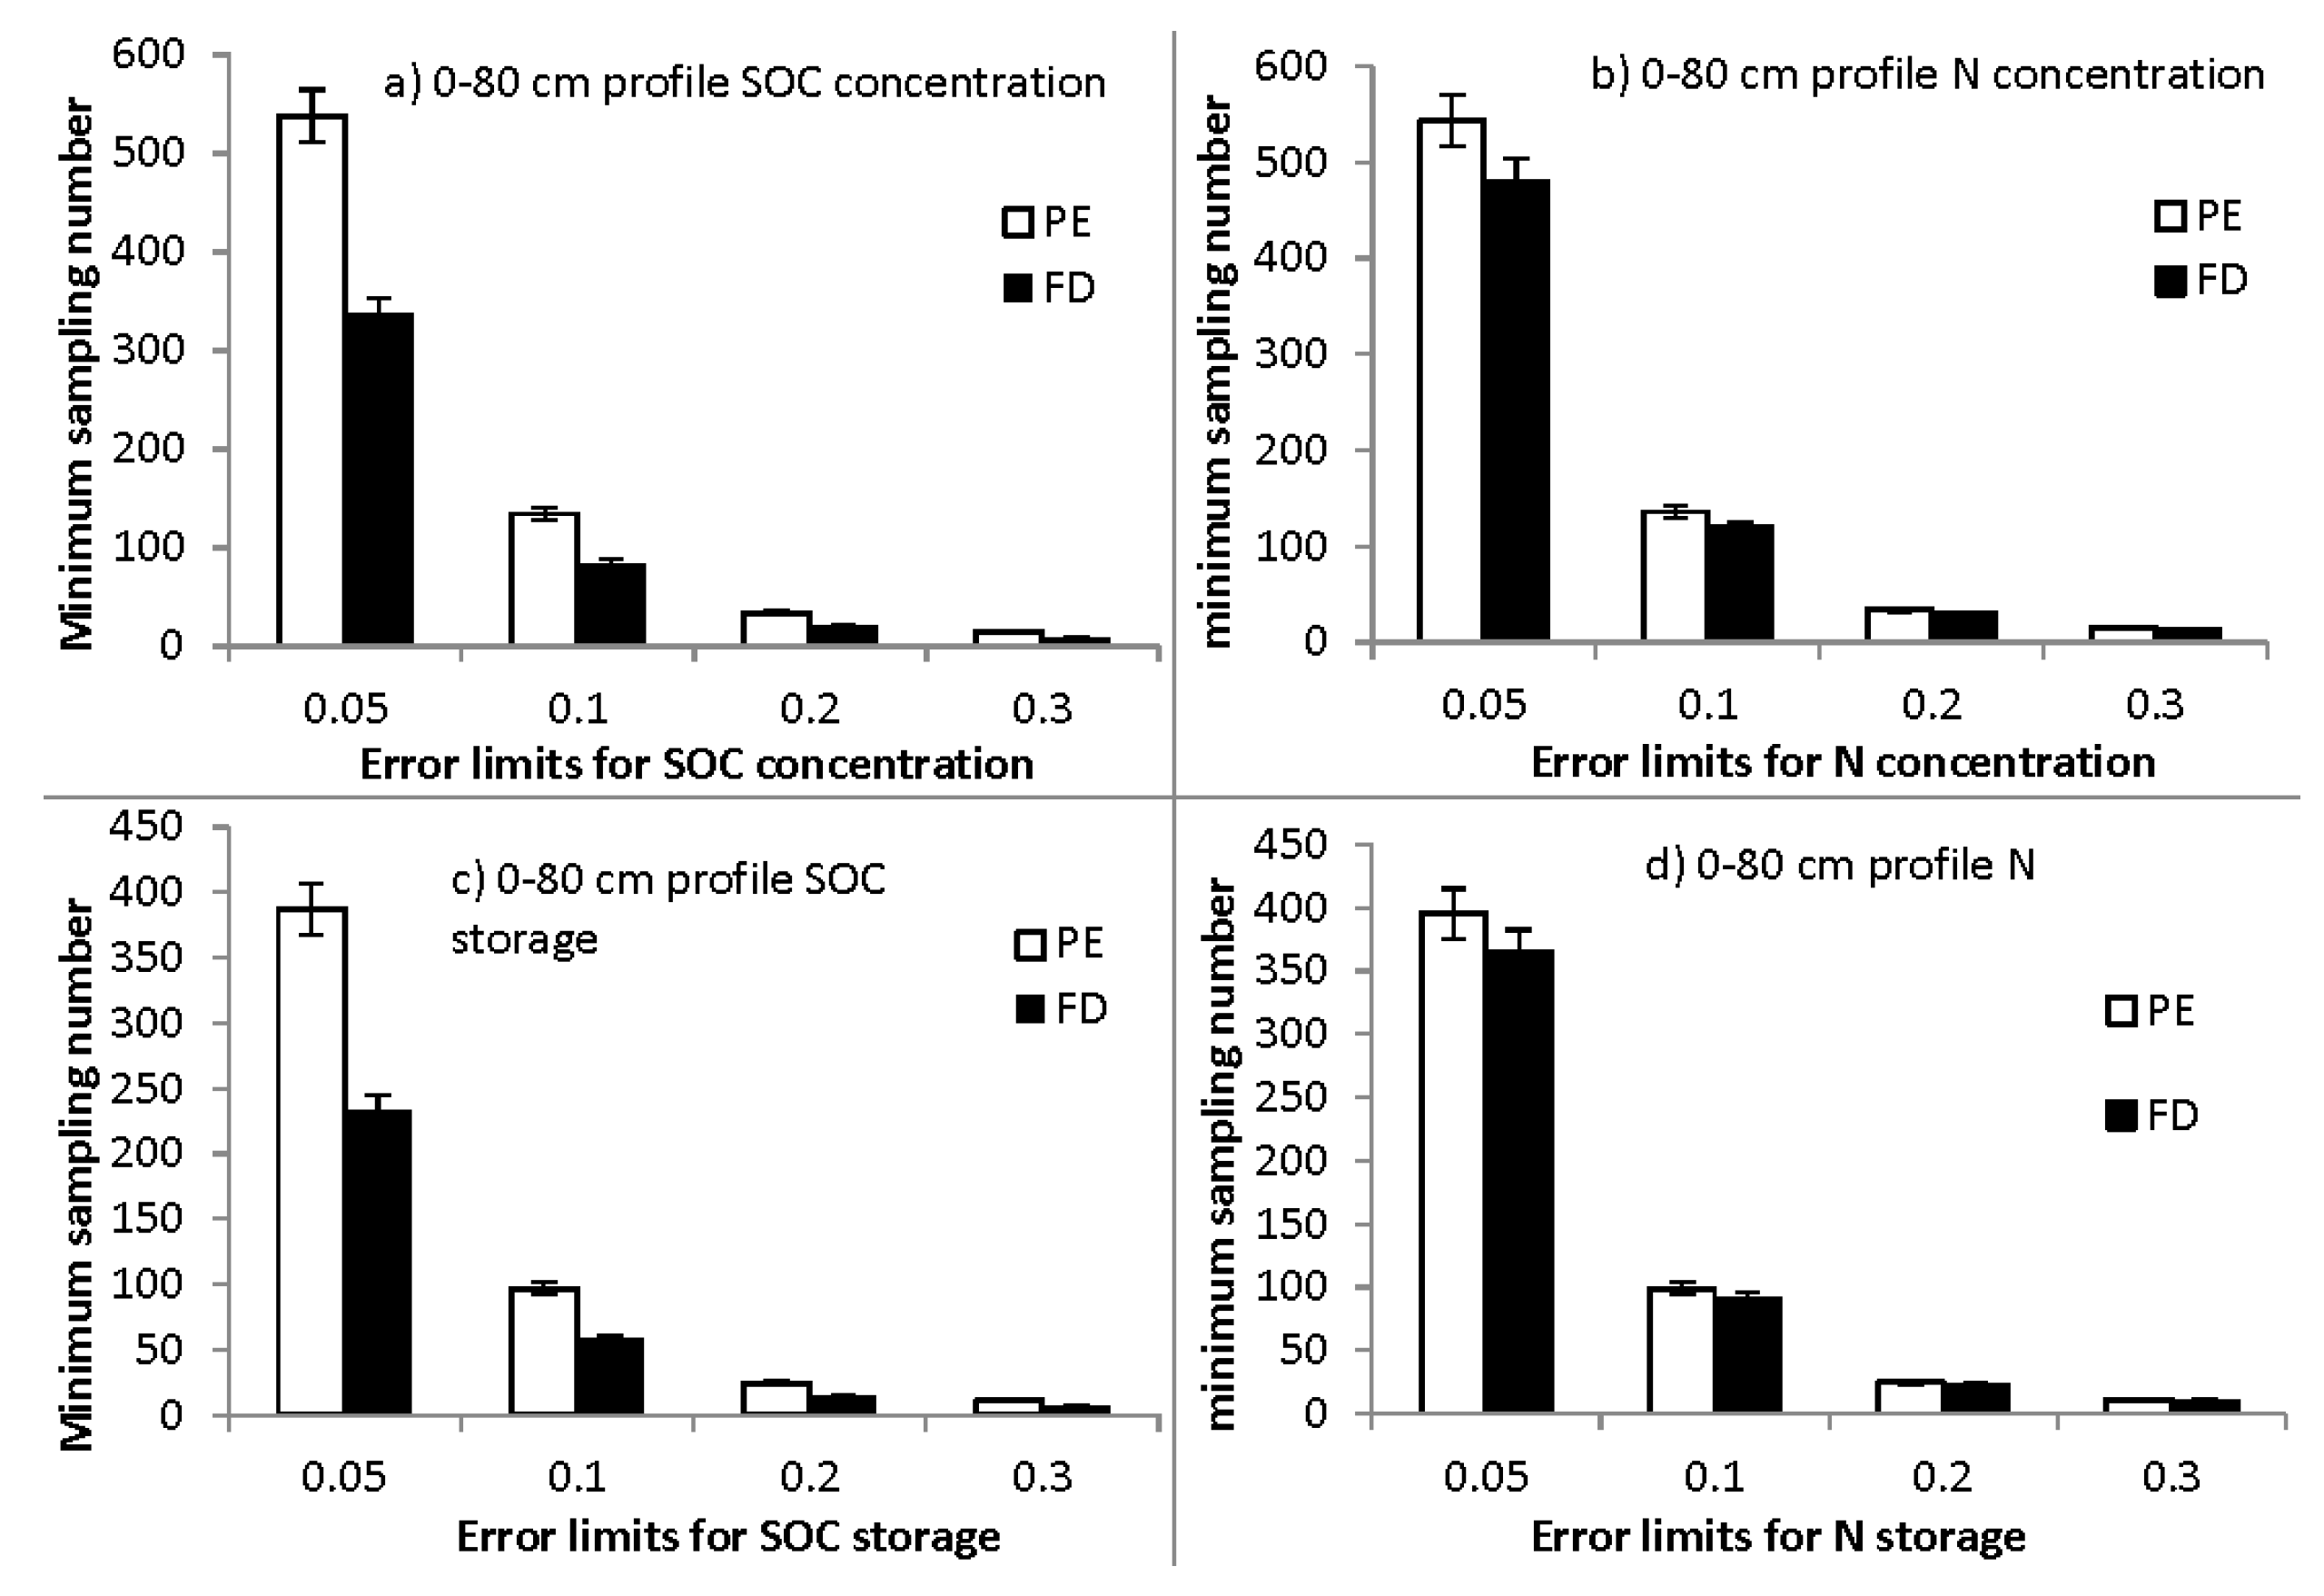
3.6. Minimum Sample Number Required for Estimating SOC and SON at Specific Error Limits: Effects of Sampling Method

Fewer sampling points are required with fixed-depth sampling than with pedogenetic sampling, across multiple error limits (Figure 5). At least 538 samples should be collected for analyzing whole profile soil SOC concentration under pedogenetic sampling at the 5% error limit, whereas 37% fewer points are required with fixed-depth sampling to secure the same precision. This pattern of requiring more data points for pedogenetic sampling holds as the error limit increases (Figure 5). Similarly, under the same error limit, at least 543 pedogenetic samples are needed to analyze whole profile soil SON concentrations, compared with 480 samples for in fixed-depth sampling (12% fewer sampling points required) (Figure 5).
Similar results were observed for whole profile soil SOC and SON storage. At the 5% limit, pedogenetic sampling and fixed-depth required 387 and 233 samples, respectively, to estimate SOC storage, as well as 395 and 364 samples for SON storage estimation. At other error limits, these general patterns again held (Figure 5). Outcomes for surface-soil SOC and SON storage and concentration data were similar to the whole profile soil results (data not shown).

4. Discussion

4.1. Age-Group Effect on SOC and SON Is Dependent on Sampling Depth but Not Sampling Method

Compared with younger forests, older forests can have both higher and lower SOC and SON [11,14,15,16], but few have examined how sampling methods may affect such evaluations. Here, we demonstrated that sampling methods did not alter the estimate of the age-group effect on SOC and SON in larch plantations (Table 1, Figure 3 and Figure 4). Pedogenetic horizon sampling in previous studies has revealed large increases (31.3 to 48.2 g·kg−1) in soil organic matter (SOM) concentration due to thinning [36], as well as large SOM variations (184 to 510 g·kg−1) within different larch forests [37]. Using fixed-depth sampling, SOM was found to increase from 47.7 to 51.6 g·kg−1 after a second rotation of a 36-years old larch forest at the same site [38]. Therefore, differences in sampling methods do not explain contradictory patterns of SOC and SON variation over time in the studied plantations. As seen in previous reports [9,10,11,12,17,18,20], prior land use, tree species planted, and soil nutrient supply may all affect SOC and SON dynamics after afforestation.
The patterns of tree age effect on SOC and SON was strongly dependent on soil sampling depth under both sampling methods. Under a deeper soil sampling depth, the SOC and SON estimates (storage and concentration) were accompanied by moderate SOC increases or sharper SON decreases from the 20–40 years to the >40 years age-group. Previous soil studies in larch forests were focused on the more dynamic surface soil (0–20 cm), which also contains the highest root density [39,40]. However, this focus may have overlooked the importance of deep soil, which is significant given that SOM and nutrient storage in deep soils are important for forest vegetation with deep root systems [41,42], such as the larch trees studied in this paper. A recent, 12 years chronosequence study in larch plantations showed that SOC initially decreased before increasing with stand age [43]. Larch plantations in northeast China could accumulate SOC at a rate that ranges from 57.9 to 139.4 g·m−2·year−1 in the top 20 cm of soil [11]. Moreover, researchers also noted a slight increase in surface soil N storage (~0.33 kg·m−2), which decreased from 0.11–0.16 to 0.06–0.11 kg·m−2 in the 20–60 cm soil during larch forest development [11]. Larch tree growth could cause divergent changes in SIC (soil inorganic carbon) and SOC levels, particularly in terms of their vertical distribution, and therefore, these effects should be fully considered in SIC-rich calcareous soils [44]. Larch reforestation could markedly affect the temporal dynamics in the concentration, storage, and vertical distribution of most soil nutrients, as indicated by findings showing eight SOC, SON, P, and K related parameters with differences between surface and subsurface soils [21]. These studies suggest that deeper soil C and nutrient depletion was possible. In contrast, this study suggests that larch plantation establishment in northeast China could sequester C in the mineral soil without depleting SON, at least in the surface soil of stands in the >40 years age-group. However, the inclusion of deeper soil layers could strongly modify these patterns to indicate possible depletion of SOC and SON with stand age.

4.2. Sampling Method Effects on SOC and SON Differ between Their Concentration and Storage

Understanding SOC and SON spatial variation is important in order to improve intensive forest management [2], but the influence of pedogenetic versus fixed-depth sampling on the assessment of SOC and SON spatial variation has not been statistically assessed [29,30,45,46]. This study demonstrated that sampling method significantly affected (p < 0.05) the identified size of inter-site variations of SOC and SON. Moreover, such sampling effects differed between concentration and storage of SOC and SON, as well as across the two soil sampling depths. These effects suggest that the effect of sampling method and its interaction with soil sampling depth on nutrient storage or concentration should be considered in future research, particularly when comparing results across different studies.
The A and B horizons in this study were generally thicker than 20 cm, with the A horizon at LS, MES, DS, and DQC averaging 17.8, 27.0, 40.5, and 25.0 cm, respectively, whereas the corresponding B horizon averaged 55.2, 66.1, 69.2, and 49.6 cm. Thus, fixed-depth sampling with a 20-cm increment may collect mixed A and B horizon samples. This corroborates with the literature that if soil horizons with different SOC concentrations are mixed during fixed-depth sampling, SOC and SON concentrations could be much higher in fixed-depth sampling than in pedogenetic sampling [47]. Others have also reported that SOC stock variability decreases under fixed-depth sampling as compared with pedogenetic horizon sampling [29]. Therefore, fixed-depth sampling could result in higher SOC and SON estimates than pedogenetic sampling depending on the depth of the soil sampled and also sampling intensities at different horizons [29,47].
Effects of sampling method on SOC and SON have been reported previously [29,30,45], but quantitative assessment on the effect of sampling method on inter-site variation and differences between sampling depths is lacking. In the upper 30 cm of ploughed Gleysols, VandenBygaart et al. found that pedogenetic horizon sampling reduced the variability in SOC stock [45]. Sampling by pedogenetic horizon is also recommended over fixed-depth when monitoring SOC stock variation in hydromorphic soils of the agricultural landscape [46], as well as when studying pedogenetic processes controlling SOC stocks. In contrast, fixed-depth sampling is preferred for determining regional SOC stock [29]. Yet another report [30] indicated that fixed-depth sampling tends to overestimate cultivation-induced SOC depletion, and thus they recommended the use of pedogenetic soil information (e.g., soil classes) in SOC stock calculation and C sequestration when assessing the impact of land-use change. Our findings differed from these reports; we showed that pedogenetic sampling typically resulted in much higher SOC and SON than fixed-depth sampling (Table 2), which was 1.05- to 1.2-fold higher for SOC and SON storage and 1.2- to 1.4-fold higher for SOC and SON concentration. Pedogenetic sampling was also used in several major datasets in China (e.g., the 1979–1982 national survey) and has since become the main sampling method for nationwide evaluation of SOC and SON budgets [48,49,50]. Currently, however, more studies use the fixed-depth method for estimating SOC and SON storage in China [11,21,51]. This study provides a statistical assessment of differences in SOC and SON between two major sampling methods, which should be useful for meta-analysis and soil fertility diagnoses across multiple locations.

4.3. Lower SOC and SON Spatial Variations Requiring Lower Sampling Intensity in Fixed-Depth Sampling

Many studies have addressed the effect of forest development on SOC and SON dynamics [11,21], inter-site and vertical soil variations [29,52], as well as the minimum sample number required for accurate assessment [20,21,22,23]. The minimum number of samples required should be determined for detecting a specified change in soil properties [34,53]. For designing efficient soil sampling methods, Conant et al. found that differences in the order of 2.0 Mg·C·ha−1 could be detected through collecting and analyzing samples from at least five (tilled) or two (forest) microplots in Tennessee [5]. Compared with the large number required as was identified in this paper (300–600 samples), a proper sampling procedure, such as the microplot averaging method, could strongly decrease the number of samples required for accurate evaluation [5]. Moreover, the smaller variation with the fixed-depth sampling indicates that this method requires a lower sampling intensity (10%–40% lower) for a given precision as compared with pedogenetic horizon sampling in assessing changes in SOC and SON over time. Average SOC and SON changing rates are smaller relative to their total amount in the soil, resulting in a small signal to noise ratio [5]. The methodological effect on the minimum sample number required, together with previous findings on proper soil sampling design [5], may increase the precision of SON and SOC evaluations for a given error limit.

5. Conclusions

Larch plantation establishment on degraded farmland increased SOC and SON storage in the 20–40 years age-group, and sampling method (fixed-depth versus pedogenetic horizon sampling) did not alter this pattern (p > 0.05). Furthermore, pedogenetic horizon sampling resulted in higher SOC and SON storage and inter-site variations than fixed-depth sampling. At a given error limit for SOC and SON estimation, the minimum number of sampling points required for fixed-depth sampling was 60%~90% of that required for pedogenetic horizon sampling. These sampling method effects can help interpret differences in data collected in disparate studies (e.g., for meta-analysis), and improve our understanding of the assessment of spatial variations of SOC and SON.

Acknowledgments

This study was supported financially by the National Key Research and Development Program (2016YFA0600802), Fundamental Research Funds for the Central Universities (2572016EAJ1&DL13EA03-03), China’s National Foundation of Natural Sciences (41373075, 31100457), and the ”111” project (B16010). Thanks are due to De’an Xia from Forestry College, Northeast Forestry University for his kind support with statistical analysis and data explanation.

Author Contributions

W.W. conceived and designed the experiment; H.W. performed the experiment and analyzed the data; and H.W., W.W., and SC wrote the manuscript.

Conflicts of Interest

The authors declare no conflict of interest.

References

  1. Rushton, B.T. Matching tree species to site conditions in reclamation. In Evaluation of Alternatives for Restoration of Soil and Vegetation on Phophatic Clay Settling Ponds; Odum, H.T., Rushton, B.T., Paulic, M., Everett, S., McClanahan, T.R., Munroe, M., Wolfe, R.W., Eds.; Florida Institute of Phosphate Research: Bartow, FL, USA, 1991. [Google Scholar]
  2. Kravchenko, A.N. Influence of spatial structure on accuracy of interpolation methods. Soil Sci. Soc. Am. J. 2003, 67, 1564–1571. [Google Scholar] [CrossRef]
  3. Franzen, D.W.; Hopkins, D.H.; Sweeney, M.D.; Ulmer, M.K.; Halvorson, A.D. Evaluation of soil survey scale for zone development of site-specific nitrogen management. Agron. J. 2002, 94, 381–389. [Google Scholar] [CrossRef]
  4. Wang, H.-M.; Wang, W.-J.; Chen, H.; Zhang, Z.; Mao, Z.; Zu, Y.-G. Temporal changes of soil physic-chemical properties at different soil depths during larch afforestation by multivariate analysis of covariance. Ecol. Evol. 2014, 4, 1039–1048. [Google Scholar] [CrossRef] [PubMed]
  5. Conant, R.T.; Smith, G.R.; Paustian, K. Spatial variability of soil carbon in forested and cultivated sites: Implications for change detection. J. Environ. Qual. 2003, 32, 278–286. [Google Scholar] [CrossRef] [PubMed]
  6. Guo, L.B.; Gifford, R.M. Soil carbon stocks and land use change: A meta analysis. Glob. Chang. Biol. 2002, 8, 345–360. [Google Scholar] [CrossRef]
  7. Laganiere, J.; Angers, D.A.; Pare, D. Carbon accumulation in agricultural soils after afforestation: A meta-analysis. Glob. Chang. Biol. 2010, 16, 439–453. [Google Scholar] [CrossRef]
  8. Zinkevičius, R. Influence of soil sampling for precision fertilizing. Agron. Res. 2008, 6, 423–429. [Google Scholar]
  9. Morris, S.J.; Bohm, S.; Haile-Mariam, S.; Paul, E.A. Evaluation of carbon accrual in afforested agricultural soils. Glob. Chang. Biol. 2007, 13, 1145–1156. [Google Scholar] [CrossRef]
  10. Berthrong, S.T.; Jobbagy, E.G.; Jackson, R.B. A global meta-analysis of soil exchangeable cations, pH, carbon, and nitrogen with afforestation. Ecol. Appl. 2009, 19, 2228–2241. [Google Scholar] [CrossRef] [PubMed]
  11. Wang, W.J.; Qiu, L.; Zu, Y.G.; Su, D.X.; An, J.; Wang, H.Y.; Zheng, G.Y.; Sun, W.; Chen, X.Q. Changes in soil organic carbon, nitrogen, pH and bulk density with the development of larch (Larix gmelinii) plantations in china. Glob. Chang. Biol. 2011, 17, 2657–2676. [Google Scholar]
  12. Li, D.; Niu, S.; Luo, Y. Global patterns of the dynamics of soil carbon and nitrogen stocks following afforestation: A meta-analysis. New Phytol. 2012, 195, 172–181. [Google Scholar] [CrossRef] [PubMed]
  13. Springsteen, A.; Loya, W.; Liebig, M.; Hendrickson, J. Soil carbon and nitrogen across a chronosequence of woody plant expansion in North Dakota. Plant Soil 2010, 328, 369–379. [Google Scholar] [CrossRef]
  14. Covington, W. Changes in forest floor organic matter and nutrient content following clear cutting in northern hardwoods. Ecology 1981, 62, 41–48. [Google Scholar] [CrossRef]
  15. Garten, J. Soil carbon storage beneath recently established tree plantations in Tennessee and South Carolina, USA. Biomass Bioenergy 2002, 23, 93–102. [Google Scholar] [CrossRef]
  16. Wirth, C.; Czimczik, C.J.; Schulze, E.D. Beyond annual budgets: Carbon flux at different temporal scales in fire-prone siberian scots pine forests. Tellus B 2002, 54, 611–630. [Google Scholar] [CrossRef]
  17. Kueffer, C.; Klingler, G.; Zirfass, K.; Schumacher, E.; Edwards, P.J.; Gusewell, S. Invasive trees show only weak potential to impact nutrient dynamics in phosphorus-poor tropical forests in the seychelles. Funct. Ecol. 2008, 22, 359–366. [Google Scholar] [CrossRef]
  18. Cavard, X.; Bergeron, Y.; Chen, H.Y.H.; Pare, D. Effect of forest canopy composition on soil nutrients and dynamics of the understorey: Mixed canopies serve neither vascular nor bryophyte strata. J. Veg. Sci. 2011, 22, 1105–1119. [Google Scholar] [CrossRef]
  19. Wei, X.; Shao, M.; Gale, W.; Li, L. Global pattern of soil carbon losses due to the conversion of forests to agricultural land. Sci. Rep. 2014, 4, 4062. [Google Scholar] [CrossRef] [PubMed]
  20. Sauer, T.J.; James, D.E.; Cambardella, C.A.; Hernandez-Ramirez, G. Soil properties following reforestation or afforestation of marginal cropland. Plant Soil 2012, 360, 375–390. [Google Scholar] [CrossRef]
  21. Wang, W.; Wang, H.; Zu, Y. Temporal changes in SOM, N, P, K, and their stoichiometric ratios during reforestation in China and interactions with soil depths: Importance of deep-layer soil and management implications. For. Ecol. Manag. 2014, 325, 8–17. [Google Scholar] [CrossRef]
  22. Yim, M.H.; Joo, S.J.; Shutou, K.; Nakane, K. Spatial variability of soil respiration in a larch plantation: Estimation of the number of sampling points required. For. Ecol. Manag. 2003, 175, 585–588. [Google Scholar] [CrossRef]
  23. Adachi, M.; Bekku, Y.S.; Konuma, A.; Kadir, W.R.; Okuda, T.; Koizumi, H. Required sample size for estimating soil respiration rates in large areas of two tropical forests and of two types of plantation in malaysia. For. Ecol. Manag. 2005, 210, 455–459. [Google Scholar] [CrossRef]
  24. Laiho, R.; Penttilä, T.; Laine, J. Variation in soil nutrient concentrations and bulk density within Pearland forest sites. Silva Fenn. 2004, 38, 29–41. [Google Scholar] [CrossRef]
  25. Kulmatiski, A.; Vogt, D.J.; Siccama, T.G.; Beard, K.H. Detecting nutrient pool changes in rocky forest soils. Soil Sci. Soc. Am. J. 2003, 67, 1282–1286. [Google Scholar] [CrossRef]
  26. Verboom, W.H.; Pate, J.S. Evidence of active biotic influences in pedogenetic processes. Case studies from semiarid ecosystems of south-west Western Australia. Plant Soil 2006, 289, 103–121. [Google Scholar] [CrossRef]
  27. Funakawa, S.; Hirooka, K.; Yonebayashi, K. Temporary storage of soil organic matter and acid neutralizing capacity during the process of pedogenetic acidification of forest soils in Kinki District, Japan. Soil Sci. Plant Nutr. 2008, 54, 434–448. [Google Scholar] [CrossRef]
  28. Eger, A.; Almond, P.C.; Condron, L.M. Pedogenesis, soil mass balance, phosphorus dynamics and vegetation communities across a Holocene soil chronosequence in a super-humid climate, South Westland, New Zealand. Geoderma 2011, 163, 185–196. [Google Scholar] [CrossRef]
  29. Grueneberg, E.; Schoening, I.; Kalko, E.K.V.; Weisser, W.W. Regional organic carbon stock variability: A comparison between depth increments and soil horizons. Geoderma 2010, 155, 426–433. [Google Scholar] [CrossRef]
  30. Wiesmeier, M.; Sporlein, P.; Geuss, U.; Hangen, E.; Haug, S.; Reischl, A.; Schilling, B.; von Lutzow, M.; Kogel-Knabner, I. Soil organic carbon stocks in Southeast Germany (Bavaria) as affected by land use, soil type and sampling depth. Glob. Chang. Biol. 2012, 18, 2233–2245. [Google Scholar] [CrossRef]
  31. Sun, Z.H.; Jin, G.Z.; Mu, C.C. Study on the Keeping Long-Term Productivity of Larix Olgensis Plantation; Science Press: Beijing, China, 2009. [Google Scholar]
  32. Chen, Z.; Gong, Z.; Zhang, G.; Zhao, W. Correlation of soil taxa between Chinese Soil Genetic Classification and Chinese Soil Taxonomy on various scales. Soils 2004, 36, 584–595. [Google Scholar]
  33. Gong, Z.; Chen, Z.; Luo, G.; Zhang, G.; Zhao, W. China Soil Classification Reference System. Soils 1999, 57–63. [Google Scholar]
  34. Petersen, R.; Calvin, L. Sampling. In Methods of Soil Analysis. Part 1. Physical and Mineralogical Methods. Agronomy Monograph 9, 2nd ed.; Klute, A., Ed.; American Society of Agronomy, Soil Science Society of America: Madison, WI, USA, 1986; pp. 33–51. [Google Scholar]
  35. Robertson, G.P.; Coleman, D.C.; Bledsoe, C.S.; Sollins, P. Standard Soil Methods for Long-Term Ecological Research; Oxford University Press: Oxford, UK, 1999; p. 480. [Google Scholar]
  36. Chen, X.Q. The effect of community structure of artificial larch wood on physic-chemical properties of Baijing soil. J. Northeast For. Univ. 1986, 14, 113–116. [Google Scholar]
  37. Niu, X.; Wei, J.S.; Zhou, M.; Liu, B. Study on the soil organic matter under Larix gmelinii forest. In Soil Fertilizer Society of Inner Mongolia 2007 Conference on Soil Fertilizer and Sustainable Development; Inner Mogolica Publisher: Hohhot, China, 2007; Volume 2007, pp. 1145–1149. [Google Scholar]
  38. Yan, D.; Wang, J.; Yang, M. Tendency of Soil Degradation in the Pure Larch Plantations. Chin. J. Ecol. 1997, 16, 62–66. [Google Scholar]
  39. Kajimoto, T.; Osawa, A.; Matsuura, Y.; Abaimov, A.P.; Zyryanova, O.A.; Kondo, K.; Tokuchi, N.; Hirobe, M. Individual-based measurement and analysis of root system development: Case studies for Larix gmelinii trees growing on the permafrost region in Siberia. J. For. Res. 2007, 12, 103–112. [Google Scholar] [CrossRef]
  40. Liu, S.R.; Wang, W.Z.; Wang, M.Q. The characteristics of energy in the formative process of net primary productivity of larch artificial forest ecosystem. Acta Phytoecol. Geobot. Sin. 1992, 16, 209–219. [Google Scholar]
  41. Jobbágy, E.G.; Jackson, R.B. The vertical distribution of soil organic carbon and its relation to climate and vegetation. Ecol. Appl. 2000, 10, 423–436. [Google Scholar] [CrossRef]
  42. Rumpel, C.; Kögel-Knabner, I. Deep soil organic matter—A key but poorly understood component of terrestrial c cycle. Plant Soil 2011, 338, 143–158. [Google Scholar] [CrossRef]
  43. Wang, C.M.; Shao, B.; Wang, R. Carbon sequestration potential of ecosystem of two main tree species in Northeast China. Acta Ecol. Sin. 2010, 30, 1764–1772. [Google Scholar]
  44. Wang, W.; Su, D.; Qiu, L.; Wang, H.; An, J.; Zheng, G.; Zu, Y. Concurrent changes in soil inorganic and organic carbon during the development of larch, Larix gmelinii, plantations and their effects on soil physicochemical properties. Environ. Earth Sci. 2012, 69, 1559–1570. [Google Scholar] [CrossRef]
  45. VandenBygaart, A.J.; Gregorich, E.G.; Angers, D.A.; McConkey, B.G. Assessment of the lateral and vertical variability of soil organic carbon. Can. J. Soil Sci. 2007, 87, 433–444. [Google Scholar] [CrossRef]
  46. VandenBygaart, A.J. Monitoring soil organic carbon stock changes in agricultural landscapes: Issues and a proposed approach. Can. J. Soil Sci. 2006, 86, 451–463. [Google Scholar] [CrossRef]
  47. Palmer, C.J.; Smith, W.D.; Conkling, B.L. Development of a protocol for monitoring status and trends in forest soil carbon at a national level. Environ. Pollut. 2002, 116 (Suppl. 1), S209–S219. [Google Scholar] [CrossRef]
  48. Wu, H.B.; Guo, Z.T.; Peng, C.H. Land use induced changes of organic carbon storage in soils of China. Glob. Chang. Biol. 2003, 9, 305–315. [Google Scholar] [CrossRef]
  49. Yan, X.Y.; Cai, Z.C.; Wang, S.W.; Smith, P. Direct measurement of soil organic carbon content change in the croplands of China. Glob. Chang. Biol. 2011, 17, 1487–1496. [Google Scholar] [CrossRef]
  50. Yang, Y.H.; Fang, J.Y.; Ji, C.J.; Ma, W.H.; Mohammat, A.; Wang, S.F.; Wang, S.P.; Datta, A.; Robinson, D.; Smith, P. Widespread decreases in topsoil inorganic carbon stocks across China‘s grasslands during 1980s-2000s. Glob. Chang. Biol. 2012, 18, 3672–3680. [Google Scholar] [CrossRef]
  51. Lv, H.; Wang, W.; He, X.; Xiao, L.; Zhou, W.; Zhang, B. Quantifying tree and soil carbon stocks in a temperate urban forest in Northeast China. Forests 2016, 7, 200. [Google Scholar] [CrossRef]
  52. Wang, Q.; Wang, W. Grsp amount and compositions: Importance for soil functional regulation. In Fulvic and Humic Acids: Chemical Composition, Soil Applications and Ecological Effects; Barrett, K.D., Ed.; Nova Science Publishers, Inc.: Hauppauge, NY, USA, 2015. [Google Scholar]
  53. Johnson, C.E.; Johnson, A.H.; Huntington, T.G. Sample size requirements for the determination of changes in soil nutrient pools. Soil Sci. 1990, 150, 637–644. [Google Scholar] [CrossRef]
Figure 1. Sampling method influences soil organic C (SOC) and N (SON) concentrations depending on the sampling site (site × sampling method interaction). Data are presented for the two different sampling depths (surface soil: 0–20 cm and whole profile soil: 0–80 cm). A plus sign (+) indicates that the pedogenetic method resulted in higher values than the fixed-depth method, while a minus sign (−) indicates the opposite result. DQC, Daqingchuan site; DS, Dongshan site; LS, Laoshan site; MES, Maoershan site; FD, fixed-depth sampling; PE, pedogenetic horizon sampling. The error bars represent standard error of the mean. 0–20 cm soil for SOC (a); 0–80 cm soil for SOC (b); 0–20 cm soil for SON (c); 0–80 cm soil for SON(d).
Forests 08 00028 g001
Figure 2. The influence of sampling method on soil organic C (SOC) and N (SON) storage across study sites (site×method interaction) and sampling depth (surface soil: 0–20 cm, whole profile soil: 0–80 cm). A plus sign (+) indicates that the pedogenetic method resulted in higher values than the fixed-depth method, while a minus sign (−) indicates the opposite result. DQC, Daqingchuan site; DS, Dongshan site; LS, Laoshan site; MES, Maoershan site; FD, fixed-depth sampling; PE, pedogenetic horizon sampling. The error bars represent standard error of the data. 0–20 cm soil for SOC (a); 0–80 cm soil for SOC (b); 0–20 cm soil for SON (c); 0–80 cm soil for SON (d).
Forests 08 00028 g002
Figure 3. The interaction of age-group and sampling method affected soil organic C (SOC) and N (SON) concentrations, as well as their variation between surface (0–20 cm) and whole profile soil (0–80 cm). A plus sign (+) indicates that the pedogenetic method resulted in higher values than the fixed-depth method, while a minus sign (−) indicates the opposite result. DQC, Daqingchuan site; DS, Dongshan site; LS, Laoshan site; MES, Maoershan site; FD, fixed-depth sampling; PE, pedogenetic horizon sampling. The error bars represent standard error of the data. 0–20 cm soil for SOC (a);. 0–80 cm soil for SOC (b); 0–20 cm soil for SON (c); 0–80 cm soil for SON (d).
Forests 08 00028 g003
Figure 4. The interaction of age-group and sampling method on variation in soil organic C (SOC; upper two panels) and N (SON; lower two panels) storage, and differences between surface (0–20 cm; a and c) and whole profile soil (0–80 cm; b and d). A plus sign (+) indicates higher values in an older group than in the immediately younger one (e.g., >40 year versus 20–40 year), while a minus sign (−) indicates the opposite. 1 = <20 year age-group; 2 = 20–40 year age-group; 3 = >40 year age-group. FD, fixed-depth sampling; PE, pedogenetic horizon sampling. The error bars represent standard error of the data. 0–20 cm soil for SOC (a); 0–80 cm soil for SOC (b); 0–20 cm soil for SON (c); 0–80 cm soil for SON (d).
Forests 08 00028 g004
Figure 5. Effects of sampling method on minimum sampling number at different error limits to estimate differences in soil organic C (SOC) and soil organic N (SON) concentration and storage. PE, pedogenetic sampling; FD, fixed-depth sampling. Vertical bars represent a 5% error. 0–80 cm soil profile SOC concentration (a); 0–80 cm soil profile SON concentration(b); 0–80 cm soil profile SOC storage (c); 0–80 cm soil profile SON storage (d).
Forests 08 00028 g005
Table 1. ANOVA result on the influence of sampling method, age-group, and study site on soil organic C (SOC) and N (SON) concentrations, storage, in surface (0–20 cm), and the whole profile soil (0–80 cm). Bold fonts indicate statistical significance (p < 0.05).
Concentration (g·kg−1)Storage (kg·m−2)
SOCSONSOCSON
Fp-ValueFp-ValueFp-ValueFp-Value
Surface soil (0–20 cm)
Site104.31<0.001119.5<0.001131.26<0.001118.77<0.001
Age-group8.50<0.0015.510.00411.17<0.0014.130.017
Sampling method15.29<0.00115.50<0.0011.650.2001.830.177
Site × age-group0.510.7711.760.1220.620.6822.380.039
Site × method8.08<0.0016.18<0.0014.710.0032.120.098
Age-group × method2.680.0700.350.7082.460.0870.060.946
Site × age-group × method0.750.5860.660.6560.670.6470.410.839
Whole profile soil (0–80 cm)
Site87.56<0.00195.16<0.001135.95<0.001122.43<0.001
Age-group9.74<0.00111.32<0.0019.39<0.0019.25<0.001
Sampling method37.45<0.00125.57<0.00128.60<0.00110.420.001
Site × age-group1.300.2621.640.1491.460.2031.940.088
Site × method6.37<0.0013.250.02213.76<0.0014.890.002
Age-group × method0.180.8390.110.8920.180.8320.470.625
Site × age-group × method0.330.8970.490.7820.210.9580.480.790
Table 2. Differences in soil organic C (SOC) and N (SON) concentration and storage across four sites, three age-groups, and two soil sampling methods.
ItemSiteConcentration (g·kg−1)Storage (kg·m−2)Age-Group (Year)Concentration (g·kg−1)Storage (kg·m−2)MethodConcentration (g·kg−1)Storage (kg·m−2)
SOC 0–20 cmDQC50.3 c8.96 c<2035.5 a6.83 aFD36.3 a7.35 a
DS54.5 c9.95 c20–4040.7 b7.65 bPE43.8 b7.71 a
LS19.4 a4.29 a>4045.2 b8.30 b
MES39.9 b6.61 b
Highest/lowest2.82.3>40/<201.31.2PE/FD1.21.05
SOC 0–80 cmDQC23.8 c21.1 c<2018.5 a16.6 aFD17.5 a16.2 a
DS28.6 d24.1 d20–4022.02 b18.7 bPE23.6 b19.7 b
LS10.0 a9.71 a>4021.4 ab18.8 b
MES19.4 b16.4 b
Highest/lowest2.92.5>40/<201.21.1PE/FD1.41.2
SON 0–20 cmDQC3.80 c0.68 c<202.58 a0.51 aFD2.6 a0.52 a
DS3.70 c0.67 c20–403.02 b0.57 bPE3.2 b0.56 a
LS1.10 a0.26 a>403.05 b0.55 ab
MES2.80 b0.55 b
Highest/lowest3.52.620–40/<201.21.1PE/FD1.21.08
SON 0–80 cmDQC1.80 c1.66 c<201.35 a1.21 aFD1.30 a1.19 a
DS1.90 c1.51 bc20-401.69 b1.42 bPE1.70 b1.37 b
LS0.60 a0.61 a>401.37 a1.19 a
MES1.60 b1.39 b
Highest/lowest3.22.720–40/<201.31.2PE/FD1.31.2
Note: DQC, Daqingchuan site; DS, Dongshan site; LS, Laoshan site; MES, Maoershan site; FD, fixed-depth sampling; PE, pedogenetic horizon sampling. Different letters in the same column and sampling depth indicate significant differences. Means that are significantly different among the treatment under comparison are highlighted.

