Article

Patterns of Branch Growth and Death in Crowns of Sakhalin Spruce, Picea glehnii (F. Schmidt) Mast

Institute of Low Temperature Science, Hokkaido University, N19W8, Sapporo 060-0819, Japan
*
Author to whom correspondence should be addressed.
Forests 2017, 8(1), 26; https://doi.org/10.3390/f8010026
Submission received: 23 December 2016 / Revised: 10 January 2017 / Accepted: 11 January 2017 / Published: 15 January 2017

Abstract

:
The development of crown architecture strongly affects tree growth and survival. Growth and death of primary branches (those branching off from the main stem) and secondary branches (those from a primary branch) in the lowest part of the crown were investigated for Picea glehnii in an even-aged plantation. Probability of death of a primary branch decreased as the length between its basal location and the crown base (LCB) increased (p = 0.04), but this probability was not significantly related to the relative photosynthetic photon flux density (rPPFD) above the primary branch (p = 0.18). The probability of producing one or more current-year shoots on a primary branch increased with increasing rPPFD above the primary branch (p = 0.01); however, this probability was unrelated to LCB (p = 0.29). Secondary branches at the distal part of a primary branch produced more current-year shoots and exhibited a lower probability of death than proximal branches (p < 0.01), probably because rPPFD above the distal secondary branches was greater than the proximal branches (p < 0.01). Our results suggest that, while local light conditions are relevant to shoot production and shoot death on a primary branch, the death of an entire primary branch may be related to some morphological attributes concerning the length to the crown base.

1. Introduction

The architectural development of a tree crown is closely related to the demographic process of branches [1]. Because the development of crown architecture strongly affects tree growth and survival [2,3,4], comprehensively clarifying the major factors controlling branch growth and death is necessary. The study of crown development is also important for the study of timber quality, as it is strongly related to stem taper patterns [5]. Light commonly falls in heterogeneous patterns within a tree crown in natural forest communities [6]. Many studies have demonstrated that light heterogeneity within a tree crown significantly affects the growth and development of the component branches [7,8,9,10]. However, the effects of light heterogeneity on branches and leaves within a tree crown remains unclear. For example, leaves with greater irradiance generally possess a smaller specific leaf area (SLA) due to the decrease in leaf thickness [11,12], but this hypothesis does not apply in all cases [13,14].
The theory of branch autonomy in a carbon economy has been applied to explaining branch growth and death [15]. This theory suggests that branches are autonomous and do not depend on carbon imported from other branches or other parts of a tree; light conditions in the growing season are considered to be the determining factor for both branch growth and death [15,16]. Several studies using isotopic tracing experiments support this concept of the carbon-autonomous nature of the branch (hereafter ‘branch autonomy’) [17,18,19]. However, Sprugel [16] reported that a branch on a shaded tree of Abies amabilis (Dougl.) Forbes grows better than a branch under similar local light conditions on a sunlit tree. Several other studies have found that the growth and death of a branch could be affected by other branches [7,9,20,21]. These studies did not fully appear to support the branch autonomy theory because this theory assumes that the survival of a branch is determined by the carbon budget of the branch itself. In contrast, the theory of correlative inhibition predicts that branches within a tree crown mutually affect each other, because competition for resources other than carbon might exist among branches [9,20,22,23]. Thus, to gain a better understanding of the development of tree architecture, taking the relative importance of branch autonomy and correlative inhibition in the process of branch growth and death into account is needed [24].
Trees can be considered as combinations of similar repetitive units [25,26]. In this study, we consider two levels of a branching unit, the primary and secondary branches. Primary and secondary branches are defined as branches that branch off from the main stem and that branch off from a primary branch, respectively. A tree crown can be viewed as an assemblage of primary branches, which include many secondary branches. Within a tree crown, the local light conditions would vary among primary branches, and light would be heterogeneous among secondary branches located at different positions within a primary branch. The growth (e.g., diameter growth, extension of a current year shoot, the number of current-year shoots produced) and survival of secondary branches are considered to be closely related to the growth and death of an entire primary branch. Therefore, to comprehensively understand the patterns of branch growth, it is important to investigate the effects of light heterogeneity on the growth and survival of branches from different levels of branching units.
In this study, we investigated growth and survival patterns of both primary and secondary branches in a plantation of Picea glehnii (F. Schmidt) Mast. (Sakhalin spruce). The objectives were to investigate the effects of morphological factors and light conditions on shoot production, shoot extension, and death of primary and secondary branches. Then, we briefly discuss the causes of branch growth and death of primary and secondary branches in relation to the relative importance of branch autonomy and correlative inhibition.

2. Materials and Methods

2.1. Study Site

The study was conducted in a plantation of Sakhalin spruce that had been established in 1981, located in the Sapporo Experimental Forest of Hokkaido University, Sapporo, Hokkaido, Japan (43°4′11′′ N, 141°20′10′′ E, 13 m above sea level). Sakhalin spruce is an evergreen coniferous species, mainly distributed in northern Japan [27]. It survives not only at extremely low winter temperatures but also grows in diverse and severe environmental conditions [28,29]. The stand had a level forest floor and was surrounded by deciduous broad-leaved trees that were ~15 m in height. The mean tree height and diameter at breast height (DBH) in 2013 were 8.8 m and 10.2 cm, respectively. Tree density and total basal area were 1827 ha−1 and 15.74 m2·ha−1, respectively, in 2013. The trees in the 15 m × 40 m study plot had a range of DBH in July 2013 of 7.9–12.6 cm. The annual mean temperature and precipitation from 1981 to 2010 were 8.9 °C and 1107 mm (Japan Meteorological Agency), respectively.

2.2. Field Measurements

In this study, all the data were obtained using nondestructive measurements. The crown base and the crown base height were defined as the basal location of the lowest live primary branch on a main stem and its height above ground level, respectively. In July 2013, DBH, tree height, and the crown base height were measured for each tree in the study plot. These trees were grouped into two DBH classes: 7.0–9.9 cm, and >10.0 cm. Eight trees were selected from each diameter class. Hence, a total of 16 trees were chosen as the sample trees (Appendix Table A1). Because of partial shading from neighboring broad-leaved trees around the site, five out of the 16 trees at the edge of the study site died during the field measurement period from July 2013 to July 2014 (Table A1).
Because light resources were heterogeneous not only among primary branches within a tree crown but also among secondary branches within a primary branch, both types of branches were selected to investigate the effects of light conditions on branch growth and death. In order to study the growth and death of branches simultaneously, branches in the lower part of a crown were chosen, because branch death mainly occurs in the lower part of the crown rather than in the upper part [30,31,32]. Four primary branches were randomly chosen from each sample tree. Therefore, a total of 64 primary branches (16 trees × 4 branches) were selected. The mean branch diameter at the basal location ± SE and the mean length of the primary branches in July 2013 were 13.5 ± 0.5 mm and 113.0 ± 4.2 cm, respectively. For all these primary branches, the length between the basal location of a primary branch and the crown base (LCB, cm) was measured to document the primary branch location within a crown.
All of the 64 primary branches were categorized into those having one or more current-year shoots and those that did not in July 2013. For each of the 26 primary branches having one or more current-year shoots, two or three opposite pairs of secondary branches were selected from each of three positions (the distal, middle, and proximal parts) in a primary branch in July 2013. A total of 121 secondary branches were selected. The mean basal diameter and the mean length (±SE) of the secondary branches were 4.5 ± 0.3 mm and 38.4 ± 2.9 cm, respectively. The number of all current-year shoots on all of the selected secondary branches was counted. Some of these current-year shoots (five, on average) were randomly chosen from each secondary branch, and their lengths were also measured in July 2013. The mean current-year shoot length of a primary branch was calculated as the mean length for all these secondary branches selected within the primary branch. Because extension of the current-year shoots ceased before the July measurement, this length represents the entire shoot extension growth of 2013. A primary or secondary branch on which all the needle colors changed from green to yellow and finally fell off by December 2013 was identified as a dead branch. The number of living primary and secondary branches was recorded in each month from July 2013 to July 2014.

2.3. Light Measurements

Photosynthetic photon flux density (PPFD; μE·m−2·s−1) for all 64 primary branches was measured with two quantum sensors (PAR-01L, Prede Co., Ltd., Tokyo, Japan) on overcast days in May 2014. Because we could not measure light intensity in 2013, the relative photosynthetic photon flux densities (rPPFDs) measured in 2014 were used as surrogates of rPPFDs in 2013. Between 2013 and 2014, no anthropogenic damage (e.g., branch pruning) or natural disturbance (e.g., typhoons or fires) occurred in the study site.
When measuring rPPFDs, one sensor was fixed on the top of a vertically standing 15 m long pole, approximately 1 m higher than the top of the canopy at the study site. Another sensor was placed horizontally above the tip of primary or secondary branches and was held there for more than 20 s when measuring light intensities above the branches. Measurements from both sensors were recorded simultaneously at 20-s intervals using a data logger (FTJR-2 CH, M.C.S Co., Ltd., Sapporo, Japan). The rPPFD was calculated as the ratio of PPFD above a primary or secondary branch to that above the canopy. This rPPFD measurement was repeated three times for each primary or secondary branch, and their average was defined as the rPPFD of each primary or secondary branch.
As explained below, we analyzed whether the number of current-year shoots, the probability of death, and the mean length of current-year shoots on a secondary branch were affected by its position on a primary branch. Meanwhile, these attributes may also be affected by rPPFD on these secondary branches, but we did not measure rPPFD on secondary branches during 2013 and 2014. Because the positions of the secondary branches and the rPPFDs on these secondary branches were expected to be closely interrelated, the relationship between the position of secondary branches and their light conditions was also examined as follows. In May 2015, six trees were selected from the 11 sample trees that had survived (see Table A1). Then, 24 primary branches were newly selected from these trees. Using the method described above, two or three pairs of secondary branches were randomly selected from the distal, middle, and proximal parts of each of these primary branches in May 2015. A total of 126 new secondary branches were selected and the rPPFD values of these primary and secondary branches were measured in June 2015. Note that these newly selected branches were used only for examining the relationship between rPPFD of the primary branch in 2015 and LCB, and between rPPFD of the secondary branch in 2015 and secondary branch positions, respectively.

2.4. Statistical Analysis

2.4.1. Primary Branches

The effects of LCB (cm) in 2013 and natural-log transformed rPPFD (%) (hereafter ‘ln(rPPFD)’) measured in May 2014 on the probability (P) of shoot production (probability of producing at least one current-year shoot) in the growing season of 2013 were analyzed by generalized linear mixed models (GLMM). We employed ln(rPPFD) and the LCB as fixed effects, and individual trees as the random effect. The logit link was used for the relationship between the response variable Y and the probability of shoot production P. The model of GLMMs was formulated as follows:
Y i j = ln ( P 1 P ) i j = β 0 + β 1 x i j + ε i
where Yij = 1 if a primary branch j on tree i produced at least one current-year shoot and 0 if otherwise; xij represents the ln(rPPFD) or LCB for primary branch j on tree i; β0 and β1 are the fixed effects; ε i is the random intercept of tree i.
The effects of LCB (cm) in 2013 and ln(rPPFD) in May 2014 on the probability of the death of primary branches between 2013 and 2014 were also analyzed with Equation (1), where Yij = 1 if a primary branch j on tree i died during the period between July 2013 and July 2014, and 0 if it survived.
The effects of LCB (cm) in 2013 and ln(rPPFD) above the primary branches in May 2014 on the mean length of current-year shoots per primary branch (cm) in 2013 were analyzed using linear mixed models (LMMs). The mean length was the response variable, ln(rPPFD) and LCB were the fixed effects of predictor variables, and individual trees was the random effect.
The relationship between LCB (cm) and ln(rPPFD) above a primary branch was also investigated with LMMs, where data from six trees that were selected in both 2013 and 2015 were separately investigated to determine if the results of the two years were comparable. Although both LCB and ln(rPPFD) were the predictor variables in the abovementioned GLMMs and LMMs, for convenience, ln(rPPFD) was regarded as the response variable, and LCB as the fixed effect of the predictor variable, and individual trees as random effect.

2.4.2. Secondary Branches

The effects of the position of secondary branches within a primary branch on the current-year shoot production (the number of current-year shoots produced) in 2013 were analyzed by GLMM. The position of secondary branches (distal, middle, and proximal) was the categorical fixed effects predictor variable and primary branches within an individual tree were set as the random effects. The logarithmic link was assumed for the relationship between the response variable Y of the GLMM and the number of current-year shoots NS in each secondary branch position. Because the position was a categorical variable, the three positions were coded using dummy variables [33,34]. The model is briefly expressed using Equation (2):
Y i j = ln ( N S ) i j =   α + β 1 x 1 i j + β 2 x 2 i j
where (x1,x2) = (0,0) for the distal position, (x1,x2) = (1,0) for the middle position, and (x1,x2) = (0,1) for the proximal position, and β1 and β2 are coefficients specific to each position. Because the data of the response variable included many zero data values (i.e., many secondary branches with no current-year shoot production) [35], negative binomial distribution was assumed for the response variable [36].
The effects of the position of a secondary branch on the probability of death P of a secondary branch between July 2013 and July 2014 were also analyzed by GLMM. By assuming a binomial distribution, the response variable Y was expressed as the logit link of the probability of death P, where P = 1 if a secondary branch died during the period above; otherwise P = 0. The positions of secondary branches were coded using dummy variables as in the right side of Equation (2). The primary branches within an individual tree were set as a random effect.
Further, the effects of the position of a secondary branch on the mean length of current-year shoots Ls (cm) on secondary branches in 2013 were examined by LMMs. The positions of secondary branches were the categorical response variable. As in Equation (2), it was coded using a dummy variable.
As mentioned above, the relationship between rPPFD and the secondary branch positions was examined. Natural-log transformed rPPFD (%) measured in 2015 was the quantitative response variable, and primary branches within an individual tree were set as the random effects.
Tukey’s pairwise comparison method in the multcomp package [37] of R [38] was used for multiple comparisons among secondary branch positions after the analysis of the abovementioned GLMMs. For the analysis concerning branch death, data from the sample trees that died between 2013 and 2014 (Table A1) were excluded. The lme4 [39] and glmmADMB packages [40] of R version 3.2.2 [38] were used to perform the LMMs and GLMMs, respectively.

3. Results

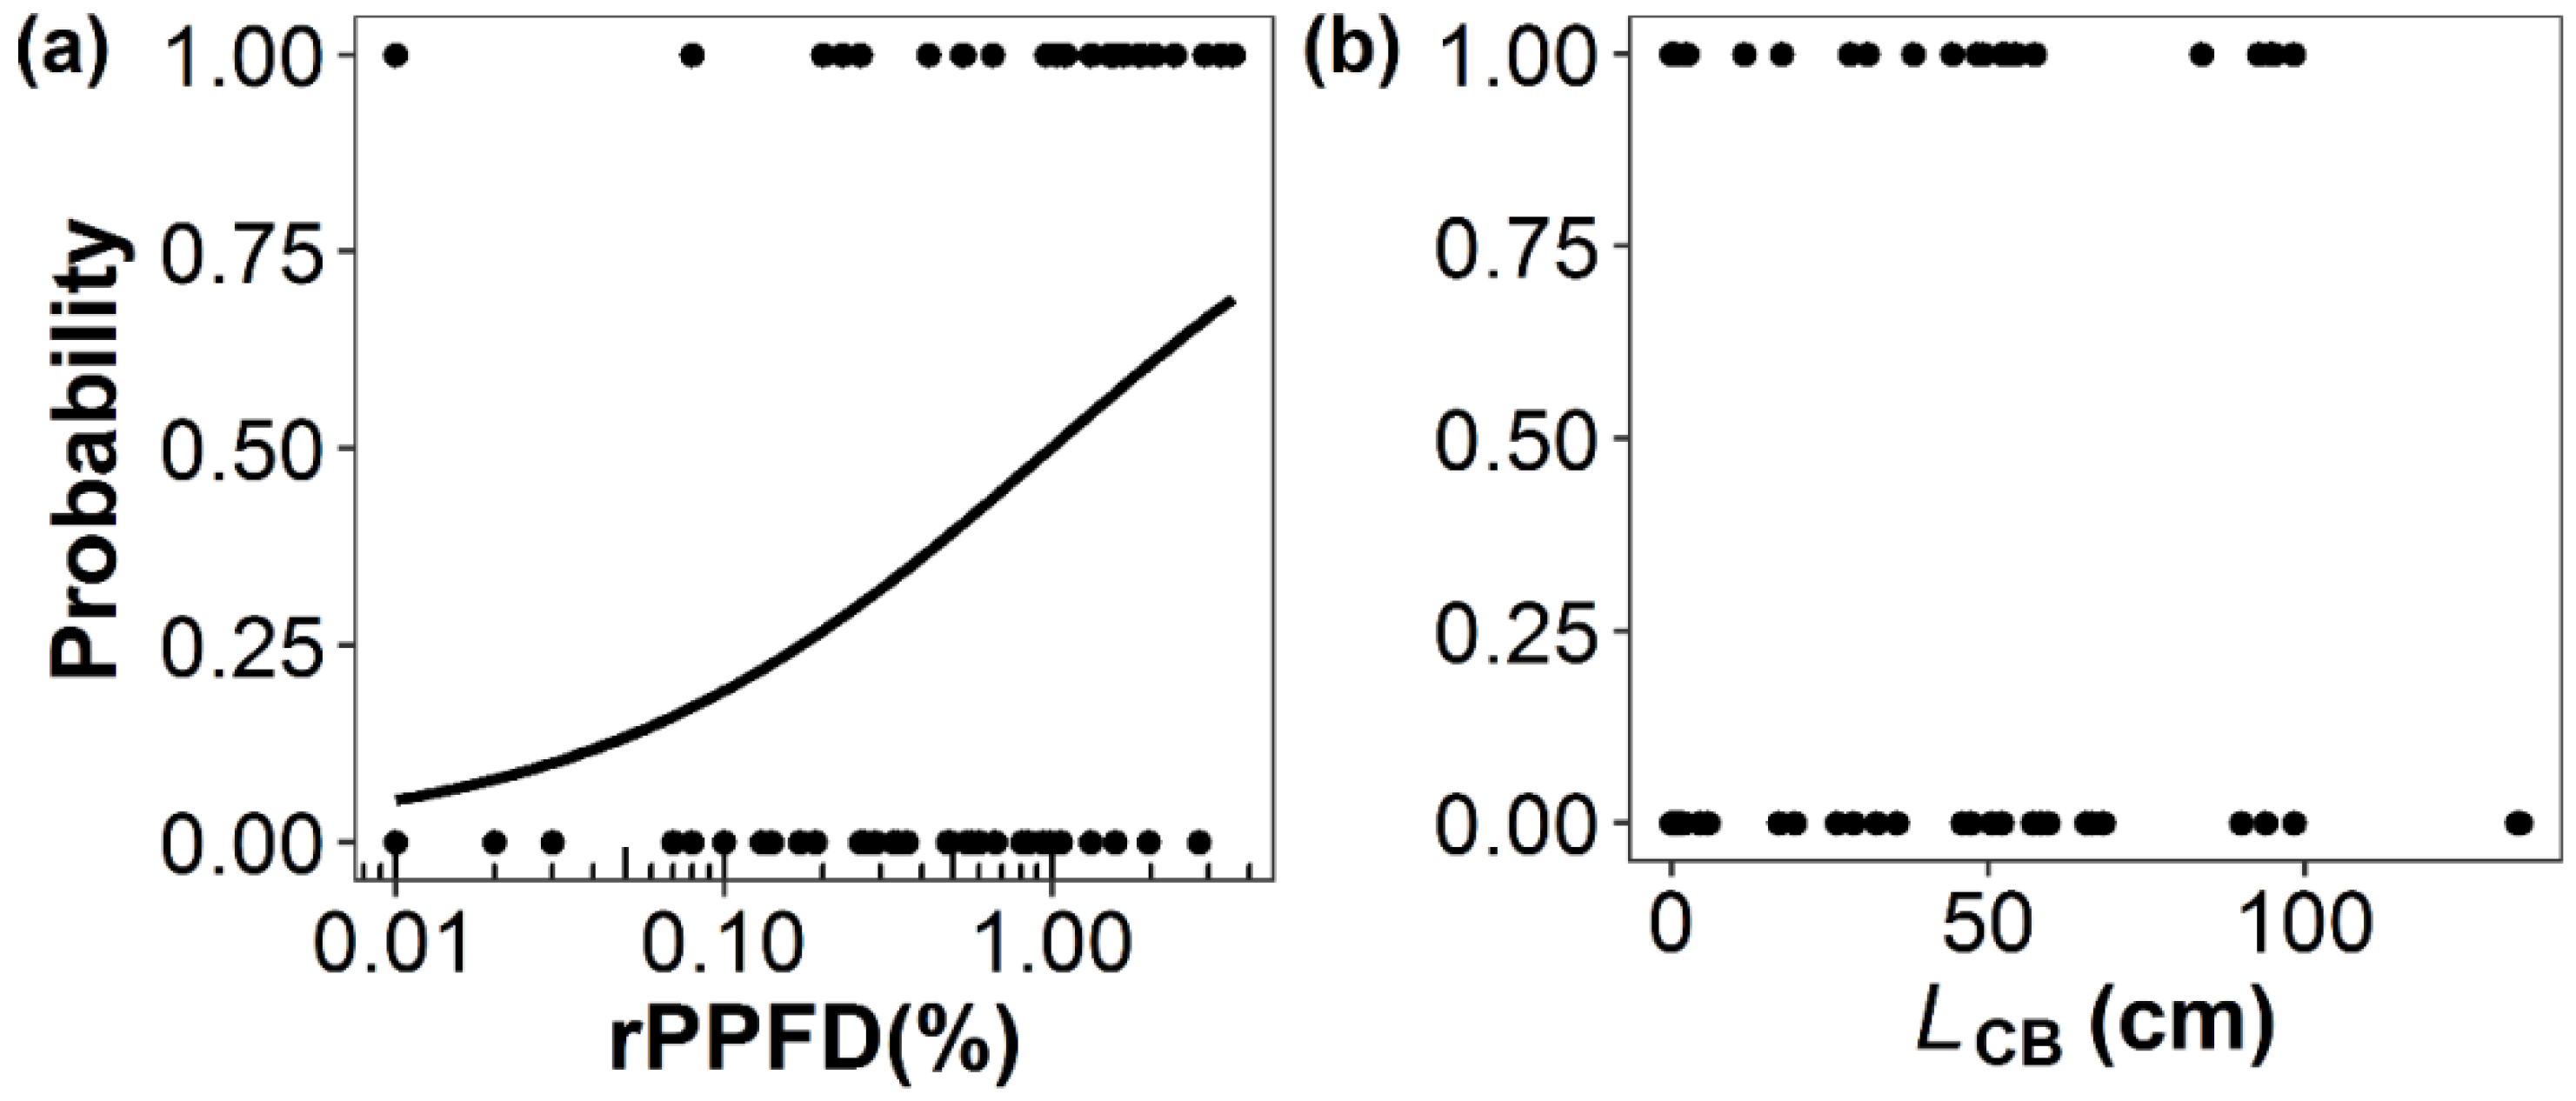
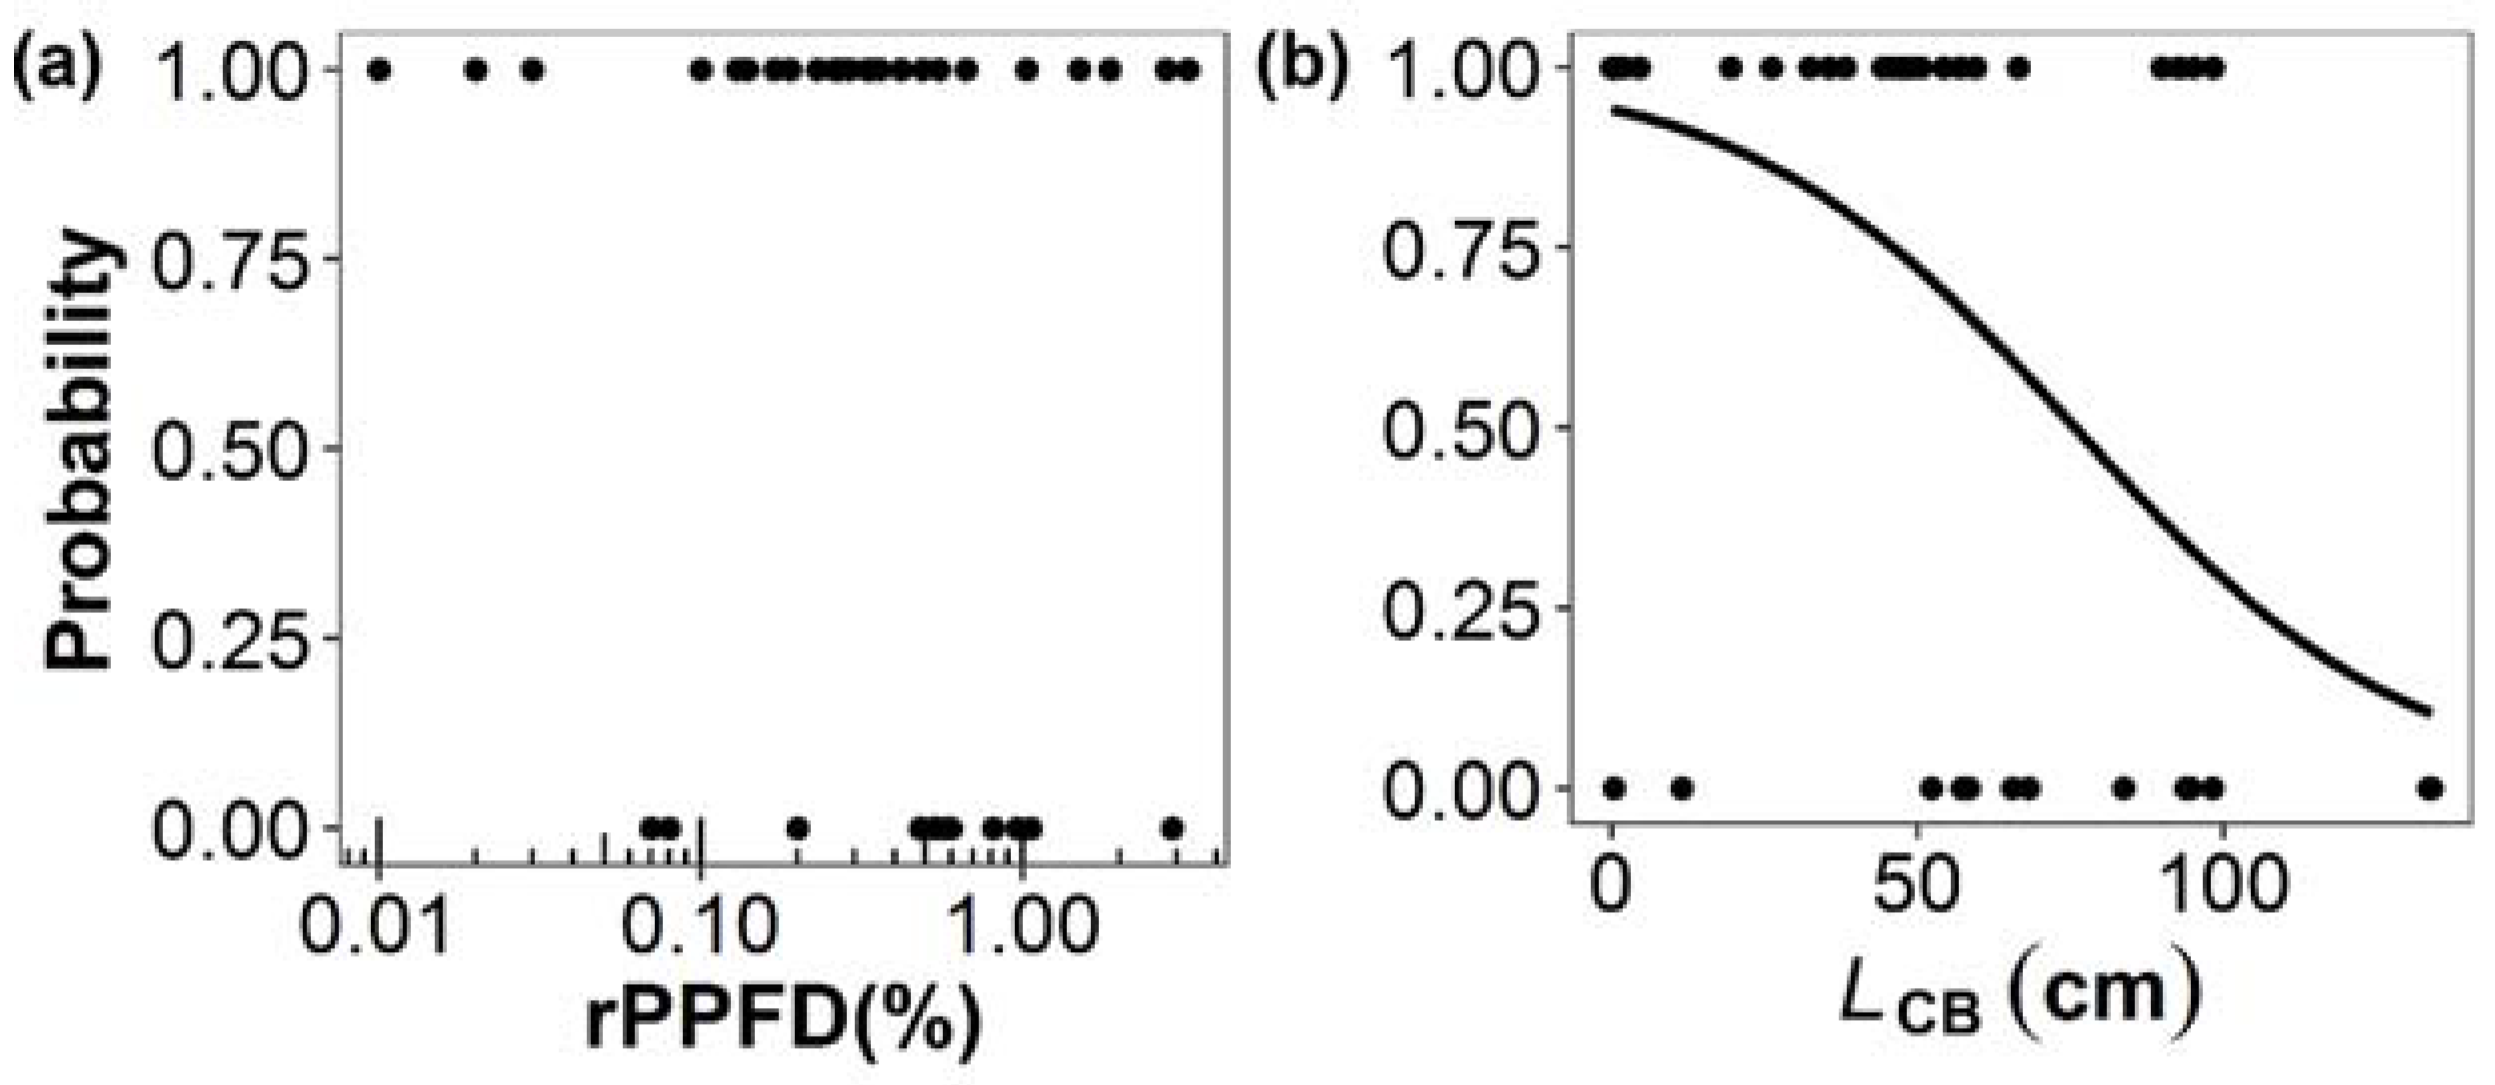
3.1. Factors Affecting Shoot Production, Shoot Length, and Death of Primary Branches

Figure 1a shows the relationship between rPPFD above a primary branch and the probability that one or more current-year shoots are produced on a primary branch. The rPPFD had a significant effect (p = 0.01) on the probability of producing current-year shoots (Table 1, Figure 1a). The rPPFDs above the primary branches were about <3%, indicating that the branches that were chosen in the lower part of the crown experienced dark conditions. Primary branches with more intense light conditions were more likely to produce current-year shoots than those with darker conditions (Figure 1a). However, branch position (LCB) had no significant effect (p = 0.29) on the current-year shoot production (Table 1, Figure 1b).
For the primary branches that produced one or more current-year shoots, the effects of rPPFD and LCB on the mean length of current-year shoots Ls were examined. However, both of these effects were not significant (p = 0.66, p = 0.83; Table 1).
In addition, the effects of rPPFD above a primary branch and the effects of LCB on the probability of death of a primary branch were examined. In contrast with the results shown in Figure 1, the effect of ln(rPPFD) was not significant (p = 0.18; Table 1, Figure 2a), but the effect of LCB was significant (p = 0.04; Table 1, Figure 2b). The probability significantly decreased with increasing LCB (Table 1, Figure 2b). Incidentally, the relationships between LCB and ln(rPPFD) above primary branches were not significant in both 2013 and 2015 (p = 0.23, p = 0.38, respectively; Table 2).

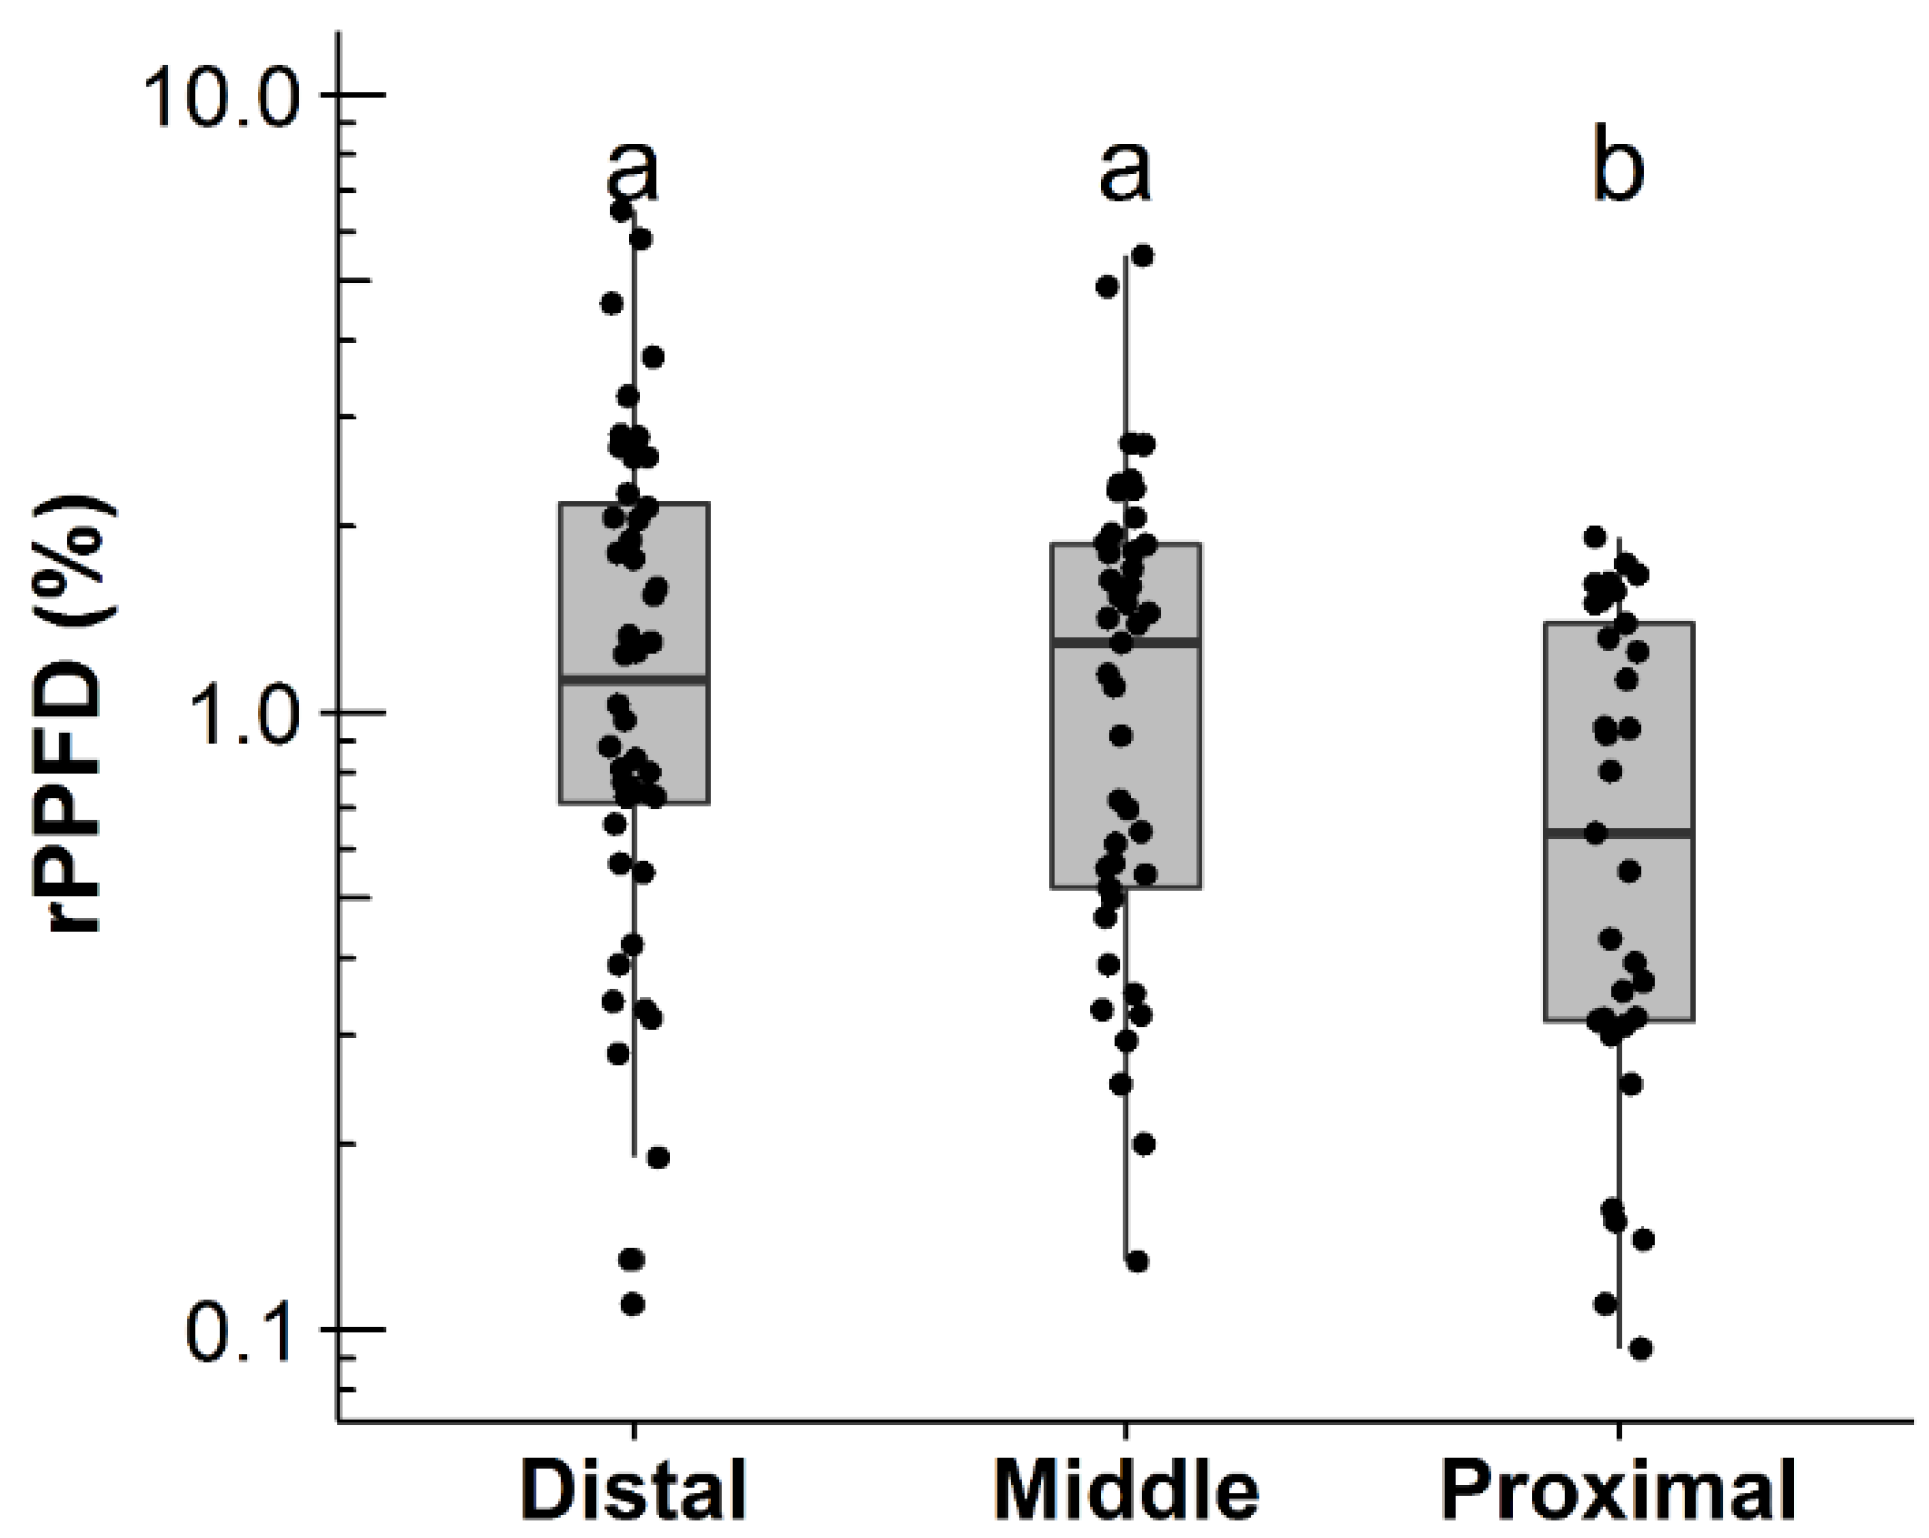
3.2. Factors Affecting Shoot Production, Shoot Length, and Death of Secondary Branches

The location of a secondary branch (distal, middle, and proximal parts on a primary branch) had a significant effect on the mean number of current-year shoots per secondary branch (Table 3; p < 0.05). Secondary branches at the distal part of a primary branch produced more current-year shoots than those at the proximal part (Figure 3). However, the difference in the mean length of current-year shoots was not significant among secondary branches at the distal, middle, and proximal parts of primary branches (p > 0.05) (Table 3, Figure 4).
The effect of the position of secondary branches on the probability of death of a secondary branch between 2013 and 2014 is shown in Table 3. The probability of death was significantly higher for the proximal part of these secondary branches than in the distal part (p < 0.05, Table 3). Incidentally, ln(rPPFD) above the secondary branches that had been selected in 2015 was stronger on the distal part of a primary branch than on the proximal part (Table 4, Figure 5). Therefore, it is possible that rPPFD on secondary branches affected the probability of their death.

4. Discussion

4.1. Primary Branches

Local light conditions above individual primary branches determined the probability of the production of one or more current-year shoots (Table 1, Figure 1), which is consistent with previous studies [7,9,41]. Primary branches with a lower light intensity were expected to have a higher tendency to die [15] according to the theory of branch autonomy. However, we found that the death of primary branches in the lower part of a crown, where the relative photosynthetic photon flux density (rPPFD) levels were about <3% (Figure 2), was not related to the light conditions of the branch, but was significantly affected by the length between branch basal location and the crown base (LCB) within the tree crown (Table 1, Figure 2). These results suggest that, under this low rPPFD range, the death of primary branches was not determined solely by the light intensity. In this sense, the primary branches investigated here could not be regarded as fully autonomous in the crown of Sakhalin spruce.
The reason why the length from the crown base was related to branch death remains unknown, but it might be ascribed to the mechanism that causes correlative inhibition. The Introduction states that the growth conditions of other parts of the crown affect survival of an individual branch. That is, when branches in the upper part of the crown are growing vigorously under sunlit conditions and resources such as nitrogen are limited, the resources stored in the older part of the crown are translocated to the vigorously growing part [42,43,44]. This is thought to be a reason why lower branches in a sunlit crown are prone to death and cause correlative inhibition [22]. Because we did not measure light conditions or growth/death patterns of primary branches in the upper part of the crown, it remains unclear whether or not the observed branch death in the lower part of the crown resulted from correlative responses to the light conditions in the upper part. However, if the upper, vigorously growing sunlit branches acquire necessary resources that are translocated from the branches at the lowest part of the crown, the lowest branches may easily die because of the loss of these translocated resources. This branch death may occur even if the light conditions of the lower branches were sufficient to produce a positive photosynthetic budget in those lower branches. Trees may translocate resources from the most unnecessary parts, such as the lower branches. This may be a reason why LCB was negatively related to the probability of branch death irrespective of the light conditions (Table 1, Figure 2). If so, the effect of LCB is a representation of correlative inhibition. Clearly, further studies considering resource translocation are needed to better understand the relationship between branch death and the length from the crown base in relation to the physiological mechanisms regarding correlative inhibition.

4.2. Secondary Branches

In contrast to the results for primary branches, secondary branches exhibited ordinary responses to the ambient light conditions. Within a primary branch, the secondary branches at the proximal part not only produced fewer current-year shoots (Figure 3) but also exhibited a higher probability of death than those at the distal part (Table 3). In addition, light intensities of secondary branches at the proximal part were lower than those of the distal part (Figure 5). Therefore, the death of secondary branches at the proximal part was probably primarily caused by low light conditions [45]. If continuous death of secondary branches occurs, which moves from the proximal part towards the distal part and results in a decrease in the amount of needles produced per primary branch, this change would reduce the photosynthetic and transpirational activity of the entire primary branch [46,47]. Although we did not measure the amounts of needles and current-year shoots per primary branch, our results suggest that a decrease in the amount of needles per primary branch occurs from the proximal to distal part on a primary branch. Considering that such decreases would be pronounced in primary branches of the lower part of the crown, the light independent death of primary branches (Figure 2) may be affected by the degree to which the amount of needles per primary branch has decreased.

4.3. Branch Autonomy versus Correlative Inhibition

Our results suggest that branch autonomy could explain the growth of primary branches in the sense that the probability of current-year shoot production had a significant positive relationship with rPPFD (Figure 1). However, light conditions or branch autonomy alone were not likely to explain the death of primary branches (Figure 2). In other words, the factor responsible for branch autonomy (local light conditions) can explain both growth (current-year shoot production) and death of secondary branches (Table 3), but this factor could not explain the death of primary branches. This suggests that factors affecting current-year shoot production and death of a primary branch may be different from those affecting secondary branches. In addition, the factor responsible for correlative inhibition could be the dominant factor causing the death of an entire primary branch. These findings also suggest that the relative importance of correlative inhibition and branch autonomy in branch growth and death is different for primary and secondary branches.
Despite spatial and temporal variability of the light conditions of branches, the measurement of relative PPFDs on overcast conditions has been accepted as a method to conveniently assess the light conditions of branches [48,49,50,51,52,53]. However, the growth and longevity of branches would be influenced by stand density, inter-tree competition [54,55,56], plant hormones [57], and programmed cell death [58]. Hence, it is desirable for further work to take such physical and physiological factors into consideration to clearly clarify the limiting factors for branch growth and death within the crowns of adult trees in situ.

5. Conclusions

In this study, we found that factors affecting current-year shoot production on a primary branch and death of an entire primary branch were different. As we expected, the former was related to light conditions. However, the latter was not related to light conditions, which was related to the location of the primary branch measured from the crown base. In contrast to primary branches, both shoot production and death of secondary branches exhibited ordinary responses to the ambient light conditions. This suggests that while local light conditions are relevant to shoot production of primary and secondary branches, death of the primary branch may be related to some morphological attributes concerning the distance to the crown base, and that the relative importance of correlative inhibition and branch autonomy in branch growth and death is different for primary and secondary branches as well.

Acknowledgments

We thank the staff of the Sapporo Experimental Forest, Field Science Center for Northern Biosphere, Hokkaido University, for the use of their facilities. We are grateful to Toshihiko Hara and to Kiyomi Ono, Shigeaki Hasegawa, and Azusa Tabata-Suzuki of Hokkaido University for their comments on an earlier stage of this study. Lei Chen would like to acknowledge the State Scholarship Fund provided by the China Scholarship Council which supported his study in Japan. This work was supported in part by the Japan Society for the Promotion of Science (JSPS) KAKENHI (Grant No. 24580209 and 16K14933).

Author Contributions

A.S. conceived and designed the experiments; L.C. performed the experiments and analyzed the data; L.C. and A.S. wrote the paper.

Conflicts of Interest

The authors declare no conflicts of interest.

Appendix

Table A1. Individual sizes of 16 sample trees. Status = 1 represents trees that died between July 2013 and July 2014; otherwise status = 0. DBH, diameter at breast height; HLB, height of the lowest live branch.
Tree IDStatusDBH (cm)HLB (m)Height (m)
117.04.377.02
217.13.425.88
317.62.686.00
408.32.976.74
508.63.448.00
618.94.457.54
709.63.549.00
819.63.296.93
9010.53.438.81
10010.53.128.19
11010.84.249.26
12012.14.119.63
13013.34.019.85
14013.43.8510.04
15013.43.4512.63
16015.93.7612.05

References

  1. Maillette, L. Structural dynamics of silver birch. I. The fates of buds. J. Appl. Ecol. 1982, 19, 203–218. [Google Scholar] [CrossRef]
  2. Küppers, M. Ecological significance of above-ground architectural patterns in woody plants: A question of cost-benefit relationships. Trends Ecol. Evol. 1989, 4, 375–379. [Google Scholar] [CrossRef]
  3. Sumida, A.; Komiyama, A. Crown spread patterns for five deciduous broad-leaved woody species: Ecological significance of the retention patterns of larger branches. Ann. Bot. 1997, 80, 759–766. [Google Scholar] [CrossRef]
  4. Sumida, A.; Terazawa, I.; Togashi, A.; Komiyama, A. Spatial arrangement of branches in relation to slope and neighbourhood competition. Ann. Bot. 2002, 89, 301–310. [Google Scholar] [CrossRef] [PubMed]
  5. Sumida, A.; Miyaura, T.; Torii, H. Relationships of tree height and diameter at breast height revisited: Analyses of stem growth using 20-year data of an even-aged Chamaecyparis obtusa stand. Tree Physiol. 2013, 33, 106–118. [Google Scholar] [CrossRef] [PubMed]
  6. Niinemets, U. Photosynthesis and resource distribution through plant canopies. Plant Cell Environ. 2007, 30, 1052–1071. [Google Scholar] [CrossRef] [PubMed]
  7. Dong, T.; Li, J.; Zhang, Y.; Korpelainen, H.; Niinemets, Ü.; Li, C. Partial shading of lateral branches affects growth, and foliage nitrogen-and water-use efficiencies in the conifer Cunninghamia lanceolata growing in a warm monsoon climate. Tree Physiol. 2015, 35, 632–643. [Google Scholar] [CrossRef] [PubMed]
  8. He, W.; Dong, M. Physiological acclimation and growth response to partial shading in Salix matsudana in the Mu Us Sandland in China. Trees 2003, 17, 87–93. [Google Scholar] [CrossRef]
  9. Takenaka, A. Shoot growth responses to light microenvironment and correlative inhibition in tree seedlings under a forest canopy. Tree Physiol. 2000, 20, 987–991. [Google Scholar] [CrossRef] [PubMed]
  10. Sugiura, D.; Tateno, M. Concentrative nitrogen allocation to sun-lit branches and the effects on whole-plant growth under heterogeneous light environments. Oecologia 2013, 172, 949–960. [Google Scholar] [CrossRef] [PubMed]
  11. Yoshimura, K. Irradiance heterogeneity within crown affects photosynthetic capacity and nitrogen distribution of leaves in Cedrela sinensis. Plant Cell Environ. 2010, 33, 750–758. [Google Scholar] [PubMed]
  12. Burns, K. Patterns in specific leaf area and the structure of a temperate heath community. Divers. Distrib. 2004, 10, 105–112. [Google Scholar] [CrossRef]
  13. Sellin, A.; Kupper, P. Spatial variation in sapwood area to leaf area ratio and specific leaf area within a crown of silver birch. Trees 2006, 20, 311–319. [Google Scholar] [CrossRef]
  14. Marron, N.; Dreyer, E.; Boudouresque, E.; Delay, D.; Petit, J.-M.; Delmotte, F.M.; Brignolas, F. Impact of successive drought and re-watering cycles on growth and specific leaf area of two Populus × canadensis (Moench) clones, ‘Dorskamp’ and ‘Luisa_Avanzo’. Tree Physiol. 2003, 23, 1225–1235. [Google Scholar] [CrossRef] [PubMed]
  15. Sprugel, D.G.; Hinckley, T.M.; Schaap, W. The theory and practice of branch autonomy. Annu. Rev. Ecol. Evol. Syst. 1991, 22, 309–334. [Google Scholar] [CrossRef]
  16. Sprugel, D.G. When branch autonomy fails: Milton’s law of resource availability and allocation. Tree Physiol. 2002, 22, 1119–1124. [Google Scholar] [CrossRef] [PubMed]
  17. Volpe, G.; Bianco, R.L.; Rieger, M. Carbon autonomy of peach shoots determined by 13C-photoassimilate transport. Tree Physiol. 2008, 28, 1805–1812. [Google Scholar] [CrossRef] [PubMed]
  18. Hoch, G. Fruit-bearing branchlets are carbon autonomous in mature broad-leaved temperate forest trees. Plant Cell Environ. 2005, 28, 651–659. [Google Scholar] [CrossRef]
  19. Lacointe, A.; Deleens, E.; Ameglio, T.; Saint-Joanis, B.; Lelarge, C.; Vandame, M.; Song, G.; Daudet, F. Testing the branch autonomy theory: A 13C/14C double-labelling experiment on differentially shaded branches. Plant Cell Environ. 2004, 27, 1159–1168. [Google Scholar] [CrossRef]
  20. Stoll, P.; Schmid, B. Plant foraging and dynamic competition between branches of Pinus sylvestris in contrasting light environments. J. Ecol. 1998, 86, 934–945. [Google Scholar] [CrossRef]
  21. Umeki, K.; Seino, T.; Lim, E.M.; Honjo, T. Patterns of shoot mortality in Betula platyphylla in Northern Japan. Tree Physiol. 2006, 26, 623–632. [Google Scholar] [CrossRef] [PubMed]
  22. Novoplansky, A. Ecological implications of the determination of branch hierarchies. New Phytol. 2003, 160, 111–118. [Google Scholar] [CrossRef]
  23. Novoplansky, A.; Cohen, D.; Sachs, T. Ecological implications of correlative inhibition between plant shoots. Physiol. Plant. 1989, 77, 136–140. [Google Scholar] [CrossRef]
  24. Rahman, L.; Umeki, K.; Honjo, T. Modeling qualitative and quantitative elements of branch growth in saplings of four evergreen broad-leaved tree species growing in a temperate Japanese forest. Trees 2014, 28, 1539–1552. [Google Scholar] [CrossRef]
  25. Kozlowski, T.T.; Kramer, P.J.; Pallardy, S.G. The Physiological Ecology of Woody Plants, 3rd ed.; Academic Press: San Diego, CA, USA, 2010. [Google Scholar]
  26. Harper, J.L. The concept of population in modular organisms. In Theoretical Ecology: Principles and Applications; May, R.M., Ed.; Blackwell: Oxford, UK, 1981; pp. 53–77. [Google Scholar]
  27. Kojima, S. Classification and ecological characterization of coniferous forest phytogeocoenoses of Hokkaido, Japan. Vegetatio 1991, 96, 25–42. [Google Scholar] [CrossRef]
  28. Bae, J.-J.; Choo, Y.-S.; Ono, K.; Sumida, A.; Hara, T. Photoprotective mechanisms in cold-acclimated and nonacclimated needles of Picea glehnii. Photosynthetica 2010, 48, 110–116. [Google Scholar] [CrossRef]
  29. Kayama, M.; Choi, D.; Sasa, K.; Satoh, F.; Nomura, M.; Koike, T. A trial for reforestation after forest fires with Sakhalin spruce in the northern most Japan. Eurasian J. For. Res. 2007, 10, 31–39. [Google Scholar]
  30. Ishii, H.; McDowell, N. Age-related development of crown structure in coastal Douglas-fir trees. For. Ecol. Manag. 2002, 169, 257–270. [Google Scholar] [CrossRef]
  31. Hartman, J.R.; Pirone, T.P.; Sall, M.A. Pirone’s Tree Maintenance; Oxford University Press: Oxford, UK, 2000; pp. 18–34. [Google Scholar]
  32. Ishii, H.R.; Sillett, S.C.; Carroll, A.L. Crown dynamics and wood production of Douglas-fir trees in an old-growth forest. For. Ecol. Manag. 2017, 384, 157–168. [Google Scholar] [CrossRef]
  33. Suits, D.B. Use of dummy variables in regression equations. J. Am. Stat. Assoc. 1957, 52, 548–551. [Google Scholar] [CrossRef]
  34. Draper, N.R.; Smith, H. Applied Regression Analysis; Wiley: New York, NY, USA, 1998. [Google Scholar]
  35. Venables, W.N.; Ripley, B.D. (Eds.) Modern Applied Statistics with S, 4th ed.; Springer: New York, NY, USA, 2002.
  36. Zeileis, A.; Kleiber, C.; Jackman, S. Regression models for count data in R. J. Stat. Softw. 2008, 27, 1–25. [Google Scholar] [CrossRef]
  37. Bretz, F.; Hothorn, T.; Westfall, P. Multiple Comparisons Using R; Chapman and Hall/CRC: London, UK, 2010. [Google Scholar]
  38. R Core Team. R: A Language and Environment for Statistical Computing; R Foundation for Statistical Computing: Vienna, Austria, 2015. [Google Scholar]
  39. Lme4 packages. Available online: http://CRAN.R-project.org/package=lme (accessed on 1 October 2014).
  40. GlmmADMB packages. Available online: http://glmmadmb.r-forge.r-project.org/ (accessed on 16 November 2014).
  41. Koike, F. Foliage-crown development and interaction in Quercus gilva and Q. acuta. J. Ecol. 1989, 77, 92–111. [Google Scholar] [CrossRef]
  42. Han, Q.; Chiba, Y. Leaf photosynthetic responses and related nitrogen changes associated with crown reclosure after thinning in a young Chamaecyparis obtusa stand. J. For. Res. 2009, 14, 349–357. [Google Scholar] [CrossRef]
  43. Marty, C.; Lamaze, T.; Pornon, A. Endogenous sink–source interactions and soil nitrogen regulate leaf life-span in an evergreen shrub. New Phytol. 2009, 183, 1114–1123. [Google Scholar] [CrossRef] [PubMed]
  44. Millard, P.; Grelet, G.-A. Nitrogen storage and remobilization by trees: Ecophysiological relevance in a changing world. Tree Physiol. 2010, 30, 1083–1095. [Google Scholar] [CrossRef] [PubMed]
  45. Goulet, J.; Messier, C.; Nikinmaa, E. Effect of branch position and light availability on shoot growth of understory sugar maple and yellow birch saplings. Can. J. Bot. 2000, 78, 1077–1085. [Google Scholar]
  46. Nobel, P.S.; Zaragoza, L.J.; Smith, W.K. Relation between mesophyll surface area, photosynthetic rate, and illumination level during development for leaves of Plectranthus parviflorus Henckel. Plant Physiol. 1975, 55, 1067–1070. [Google Scholar] [CrossRef] [PubMed]
  47. Lambers, H.; Chapin, F.S., III; Pons, T.L. Photosynthesis. In Plant Physiological Ecology; Springer: New York, NY, USA, 2008; pp. 11–99. [Google Scholar]
  48. Sumida, A.; Ito, H.; Isagi, Y. Trade-off between height growth and stem diameter growth for an evergreen oak, Quercus glauca, in a mixed hardwood forest. Funct. Ecol. 1997, 11, 300–309. [Google Scholar] [CrossRef]
  49. Dewar, R.C.; Tarvainen, L.; Parker, K.; Wallin, G.; McMurtrie, R.E. Why does leaf nitrogen decline within tree canopies less rapidly than light? An explanation from optimization subject to a lower bound on leaf mass per area. Tree Physiol. 2012, 32, 520–534. [Google Scholar] [CrossRef] [PubMed]
  50. Osada, N.; Okabe, Y.; Hayashi, D.; Katsuyama, T.; Tokuchi, N. Differences between height-and light-dependent changes in shoot traits in five deciduous tree species. Oecologia 2014, 174, 1–12. [Google Scholar] [CrossRef] [PubMed]
  51. Gendron, F.; Messier, C.; Comeau, P.G. Comparison of various methods for estimating the mean growing season percent photosynthetic photon flux density in forests. Agric. For. Meteorol. 1998, 92, 55–70. [Google Scholar] [CrossRef]
  52. Comeau, P.; Gendron, F.; Letchford, T. A comparison of several methods for estimating light under a paper birch mixedwood stand. Can. J. For. Res. 1998, 28, 1843–1850. [Google Scholar] [CrossRef]
  53. Parent, S.; Messier, C. A simple and efficient method to estimate microsite light availability under a forest canopy. Can. J. For. Res. 1996, 26, 151–154. [Google Scholar] [CrossRef]
  54. Mäkinen, H. Effect of stand density on the branch development of silver birch (Betula pendula Roth) in central Finland. Trees 2002, 16, 346–353. [Google Scholar]
  55. Weiskittel, A.R.; Maguire, D.A.; Monserud, R.A. Modeling crown structural responses to competing vegetation control, thinning, fertilization, and Swiss needle cast in coastal Douglas-fir of the Pacific Northwest, USA. For. Ecol. Manag. 2007, 245, 96–109. [Google Scholar] [CrossRef]
  56. Courbet, F.; Hervé, J.-C.; Klein, E.K.; Colin, F. Diameter and death of whorl and interwhorl branches in Atlas cedar (Cedrus atlantica Manetti): A model accounting for acrotony. Ann. For. Sci. 2012, 69, 125–138. [Google Scholar] [CrossRef]
  57. Cline, M.G. The role of hormones in apical dominance. New approaches to an old problem in plant development. Physiol. Plant. 1994, 90, 230–237. [Google Scholar] [CrossRef]
  58. Hoeberichts, F.A.; Woltering, E.J. Multiple mediators of plant programmed cell death: Interplay of conserved cell death mechanisms and plant-specific regulators. BioEssays 2003, 25, 47–57. [Google Scholar] [CrossRef] [PubMed]
Figure 1. Effects of (a) relative photosynthetic photon flux density (rPPFD); and (b) the length between its basal location and the crown base (LCB) on the probability (P) that one or more current-year shoots are produced on a primary branch. The curved line in (a) is represented by Equation (1), and its coefficients are provided in Table 1. In (b), the effects of LCB were not significant (p = 0.29; see Table 1).
Forests 08 00026 g001
Figure 2. Effects of (a) natural-log transformed relative photosynthetic photon flux density (ln(rPPFD)); and (b) the length between the basal location of the primary branch and the crown base (LCB, cm) on the probability of death (July 2013–July 2014) of a primary branch. In (a), the effects of ln(rPPFD) were not significant (p = 0.18; see Table 1c). The coefficients of the curved line in (b) showing Equation (1) are given in Table 1.
Forests 08 00026 g002
Figure 3. Differences in the mean number of current-year shoots per secondary branch among the secondary branch positions. Different letters indicate significant differences between groups (p < 0.05; Tukey honest significant difference test). The generalized linear mixed models coefficients are given in Table 3. Error bars indicate standard error.
Forests 08 00026 g003
Figure 4. Comparison between the secondary branch positions of the mean length of current-year shoots. Closed circles show the data, but the data fluctuated randomly in horizontal directions. The letters indicate that the differences between groups were not significant (p < 0.05, Tukey honest significant difference test). Length of a box indicates the interquartile range, where the horizontal lines inside each box represent the median, and the bottom and top of the box represent the first and third quartiles, respectively. The lower and upper whiskers show 95% confidence intervals. The closed circles outside the boxes represent outliers. The generalized linear mixed models coefficients are given in Table 3.
Forests 08 00026 g004
Figure 5. Comparisons between the secondary branch positions (distal, middle, and proximal parts of primary branches) of their relative photosynthetic photon flux density ln(rPPFD). Different letters indicate significant differences between groups (p < 0.05, Tukey’s honest significant difference test). Length of a box indicates the interquartile range, where the horizontal lines inside each box represent the median, and the bottom and top of the box represent the first and third quartiles, respectively. The lower and upper whiskers show 95% confidence intervals. The closed circles outside the boxes represent outliers. The generalized linear mixed models coefficients are given in Table 4.
Forests 08 00026 g005
Table 1. Coefficients of the effects of relative photosynthetic photon flux density (rPPFD) (%) and the length between the basal location of a primary branch and the crown base (LCB, cm) on (a) the probability (P) of current-year shoot production on a primary branch (see Figure 1); (b) the length of current-year shoots of primary branches; and (c) the probability (P) of death of primary branches (see Figure 2).
(a) Shoot Production of Primary Branches (n = 64)
EstimateStandard errorz-valuep-value
Intercept0.010.290.030.97
ln(rPPFD)0.620.242.570.01
EstimateStandard errorz-valuep-value
Intercept−0.900.59−1.520.13
LCB0.010.011.060.29
(b) Length of Current-Year Shoot of Primary Branches (n = 26)
EstimateStandard errort-valuep-value
Intercept2.080.307.050.00
ln(rPPFD)−0.050.12−0.440.66
EstimateStandard errort-valuep-value
Intercept2.230.2110.560.00
LCB0.000.00−0.210.83
(c) Probability of Death of Primary Branches (n = 44)
EstimateStandard errorz-valuep-value
Intercept0.350.430.810.42
ln(rPPFD)−0.350.26−1.330.18
EstimateStandard errorz-valuep-value
Intercept2.811.152.440.02
LCB−0.040.02−2.100.04
Note: In (b), primary branches on trees that died during the observation period were excluded.
Table 2. The regression between relative photosynthetic photon flux density (ln(rPPFD)) and the length between the crown base and the base of primary branch (LCB) in (a) 2013 and (b) 2015. The data of rPPFD (%; the response variable) were log-transformed to meet the assumption of normal residuals.
(a) 2013 (n = 24)
EstimateStandard errort-valuep-value
Intercept−1.270.48−2.610.03
LCB0.010.001.240.23
(b) 2015 (n = 24)
EstimateStandard errort-valuep-value
Intercept0.070.380.180.86
LCB0.000.000.900.38
Table 3. Results of generalized linear mixed models concerning the effects of secondary branch position on (a) the number of current-year shoots on secondary branches (see Figure 3), (b) the mean length of current-year shoots on secondary branches (see Figure 4), and (c) the probability of death of a secondary branch. The predictor (position) was a categorical variable having three parts (Distal, Middle, and Proximal), where α corresponds to the estimates of the Distal, α + β1 to the Middle, and α + β2 to the Proximal parts.
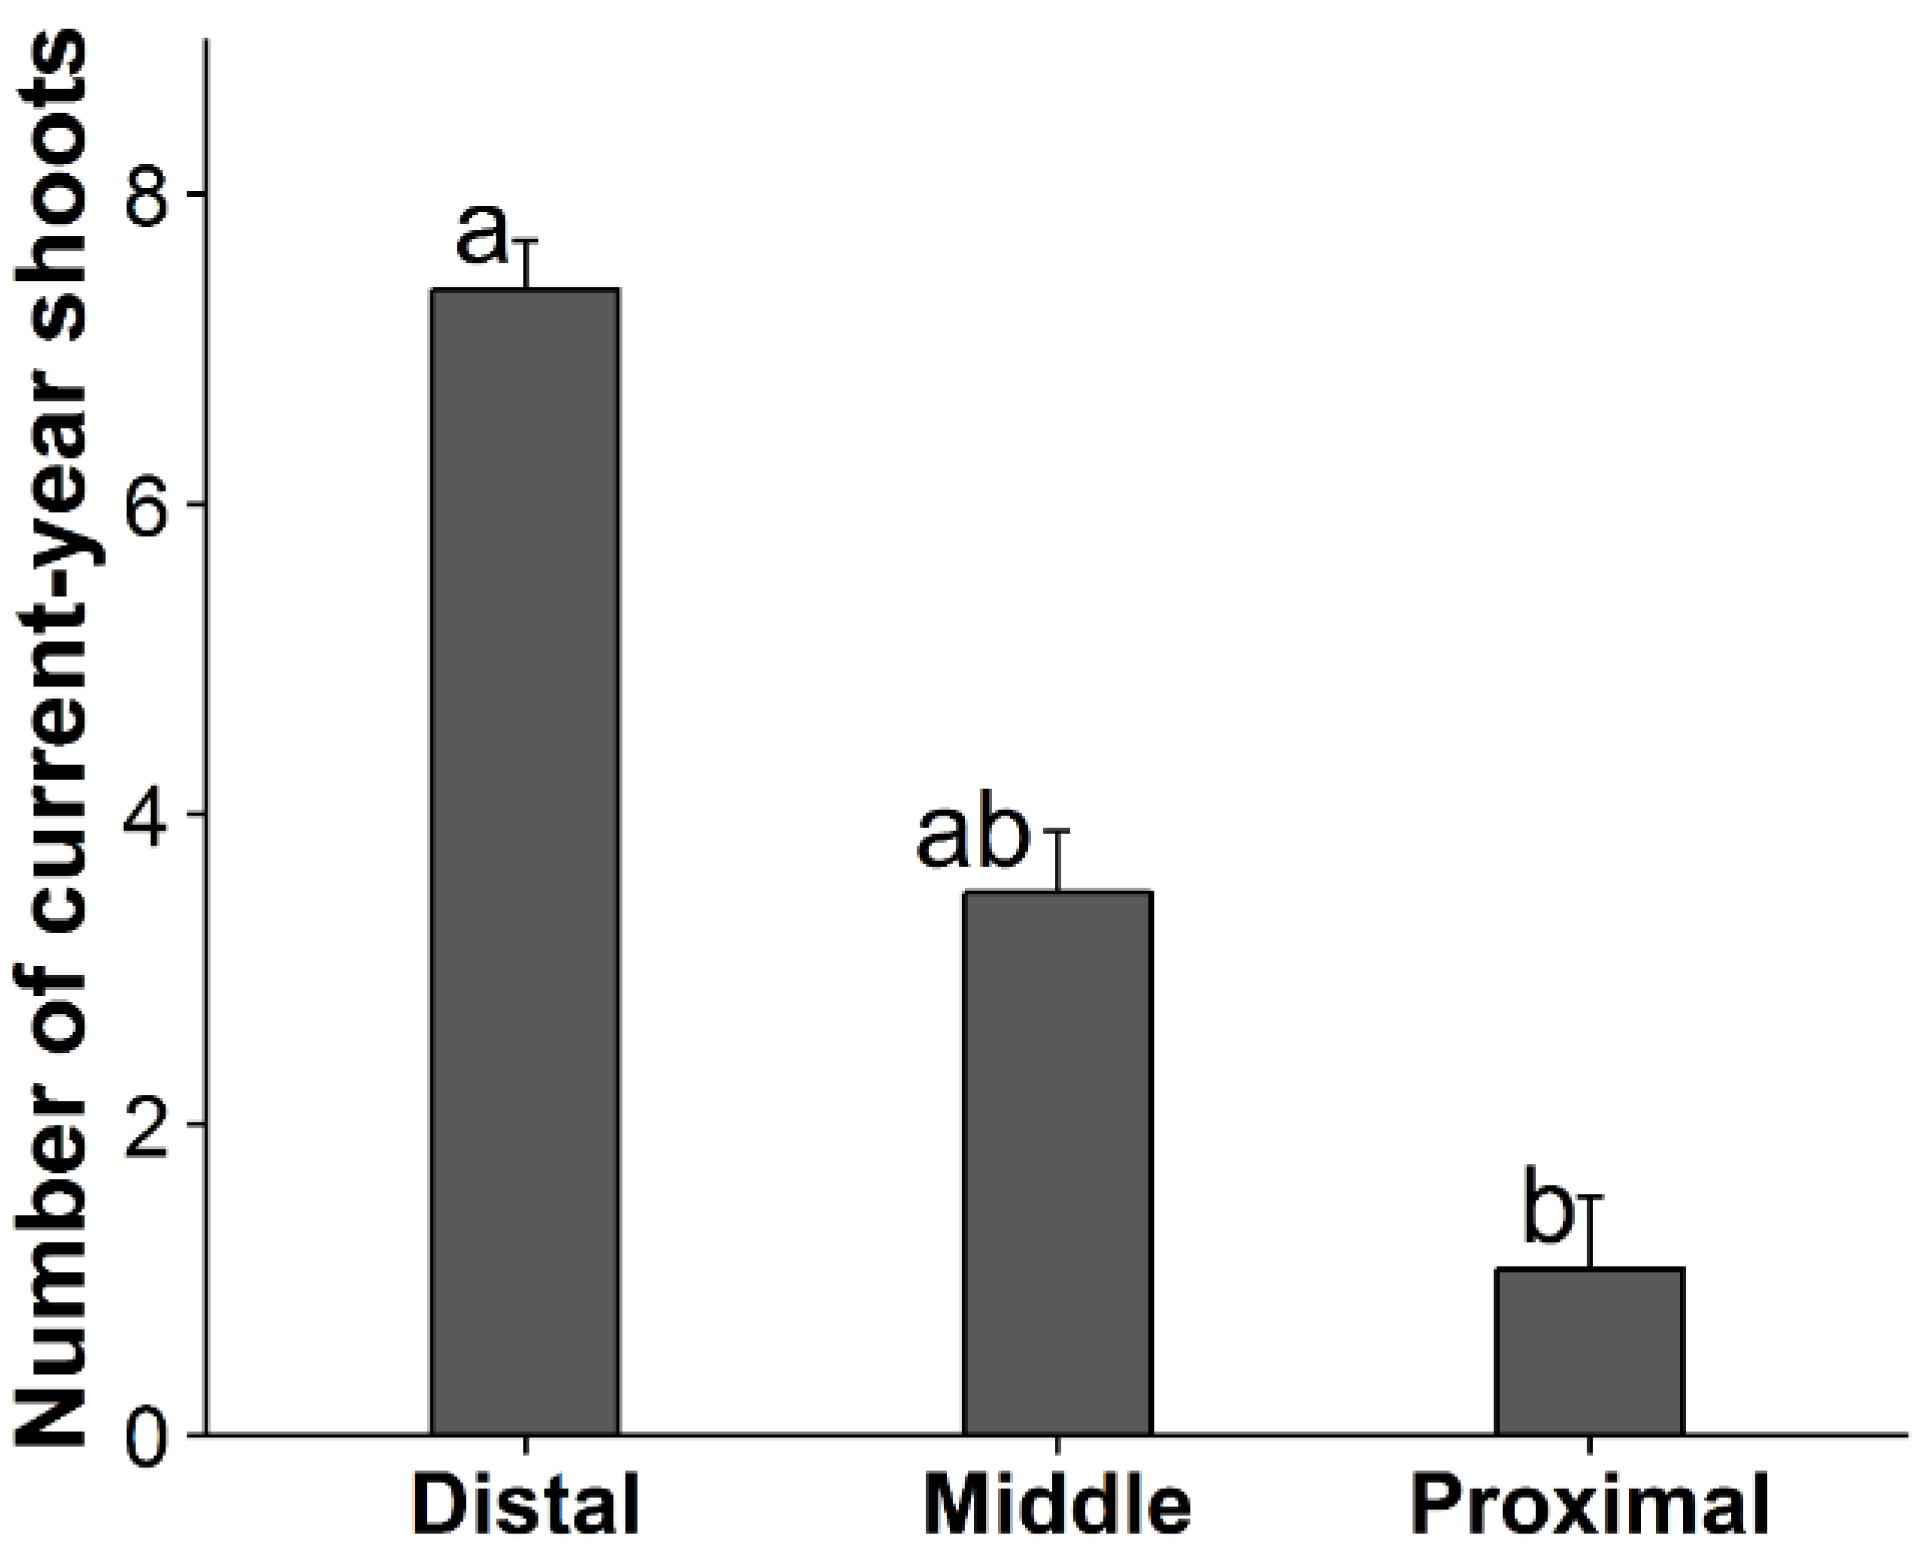
(a) Number of Current-Year Shoots on a Secondary Branch (n = 121)
EstimateStandard errorz-valuep-value
α2.050.316.530.00
β1−0.800.40−2.030.04
β2−1.980.47−3.640.00
(b) Mean Length (cm) of Current-Year Shoots of Secondary Branches (n = 64)
EstimateStandard errort-valuep-value
α2.220.1613.760.00
β1−0.200.12−1.690.10
β20.070.170.450.66
(c) Probability of Death of a Secondary Branch (n = 60)
EstimateStandard errorz-valuep-value
α−2.061.60−1.290.20
β10.381.21−0.310.76
β23.541.582.250.02
Table 4. The effect of secondary branch positions on the relative photosynthetic photon flux density ln(rPPFD) for secondary branches selected in 2015. The estimates correspond with the mean ln(rPPFD)s at the Distal, Middle, and Proximal parts, where α corresponds to the estimates of the Distal, α + β1 to the Middle, and α + β2 to the Proximal parts. The data of rPPFD (%) (the response variable) were transformed into natural logarithm to meet the assumption of normal residuals (n = 126).
EstimateStandard Errort-Valuep-Value
α0.080.330.240.82
β1−0.090.06−1.420.16
β2−0.570.07−8.450.00

