Article

Changes of Chemical and Biological Properties of Distinct Forest Floor Layers after Wood Ash Application in a Norway Spruce Stand

1
Faculty of Forestry, Technical University in Zvolen, TG Masaryka 24, Zvolen SK-96053, Slovakia
2
Research Station Košice, National Forest Centre Zvolen, Moyzesova 18, Košice SK-04001, Slovakia
*
Author to whom correspondence should be addressed.
Forests 2016, 7(5), 108; https://doi.org/10.3390/f7050108
Submission received: 19 February 2016 / Revised: 25 April 2016 / Accepted: 5 May 2016 / Published: 21 May 2016

Abstract

:
The effect of wood ash (WA) fertilisation on chemical and biological properties of forest floor layers was studied in a Norway spruce (Picea abies (L.) Karst.) stand in the central part of Slovakia at an altitude of 1300 m above sea level. In the forest floor, litter (OL), fragmented (OF), and humic (OH) horizons with average thickness of 1.5, 2, and 4 cm, respectively, could be distinguished. Three replicates of two wood ash treatments (3 and 6 t·ha−1) and a control were established in the autumn of 2012. Soil samples from OL, OF, OH and A-horizon were taken 0.5, 1, 6 and 12 months after the WA application. In soil samples chemical (pH, C and N content, C:N ratio, concentration of exchangeable Ca, Mg and K) and microbial properties (basal respiration, catalase activity, structure of microbial community based on BIOLOG assay) were determined. Our results showed that the changes in microbial and chemical properties do not occur simultaneously in particular horizons. WA application in autumn lead to a significant increase in pH, base cation concentration, and distinct losses in C and N content in the OL layer in the first month; however, at the beginning of the vegetation period, the most pronounced effect of WA was observed in OF and especially OH horizons; no changes were found in the A-horizon. Different properties of particular forest floor horizons led to a vertical stratification of the microbial community. Each forest floor horizon had particular properties, leading to a vertical stratification of the microbial community; deeper horizons had more homogenous functional groups.

1. Introduction

Forest floor (FF) is a typical component of undisturbed forest soils consisting mainly of dead organic matter in a different stages of decomposition. It has an important effect on the hydrological characteristics of a site. It represents an important part of the forest ecosystem from the point of view of maintaining the element cycle in forest ecosystems and preserving their stability. It provides habitat and nutrition for many organisms living in the soil as well as a substrate for seedling establishment in forest ecosystems, as it represents a source of nutrients for plants and water [1,2,3,4,5,6].
The thickness of FF varies from several millimeters to several centimeters, depending on environmental conditions that regulate the processes of decomposition and transformation of dead organic matter coming onto the soil surface. FF properties differ distinctly from the underlying mineral horizon. However, also within FF, several layers can often be recognized representing a gradient of decomposition, differing in their morphological and physico-chemical properties (e.g., thermal conductivity, water storage, bulk density, soil acidity, nutrient contents, etc.; cf. [1,7,8]). Changing water and nutrient supplies in FF layers leads to different living conditions for soil organisms and plant roots [9]: While the top L-horizon of temperate deciduous forests can be a hostile and unpredictable environment for humus-dwelling animals, conditions in the underlying horizons are more favourable for the fauna and seedling roots. Gömöryová et al. [10] demonstrated that the responses of soil water content as well as microbial activity to environmental factors such as air temperature and rainfall differ in individual FF layers, and different microbial characteristics do not uniformly respond to such stimuli. Under natural conditions, equilibrium among plant communities, soil microorganisms, and FF composition is established. However, any catastrophic event (e.g., windthrow, fire) destroying the FF organic layers or amendment of additives (e.g., fertilizers, pollution) onto the soil surface could significantly alter water and nutrient regimes of these systems [11]. In the last two decades, an increasing number of studies on the effect of wood ash (WA) application on soil has appeared [12,13,14,15,16,17,18]. WA is used as liming agent in agriculture and forestry and its application on the soil has become a convenient way to recycle nutrient elements [13,19]. Contradictory effects of WA on soil properties have been reported in the literature, especially regarding soil microorganisms; both increased and decreased microbial biomass, respiration, fungal-to-bacterial ratio, etc. were observed [13,20]. Studies of the impact of WA on forest soil mostly focus on the top mineral horizon and forest floor, without differentiating the FF subhorizons. In fact, there is a gap of knowledge regarding changes in the physico-chemical properties of different FF layers after WA application, and consequently on living conditions for soil microorganisms, decomposition processes, and thus nutrient release and supply for seedlings, roots, etc. The lack of information can be associated with the difficulties resulting from a gradual transition between the FF layers, dense herb layer and rooting, etc.
To improve our understanding of the processes in progress in particular horizons after the treatments, and to also improve our ability to make better management decisions regarding WA application, the aim of this study was to evaluate the influence of WA application on the changes in chemical and biological soil properties, in particular FF layers and the underlying mineral A-horizon, during a one year field experiment. We hypothesize that WA application on the soil surface will evoke gradual changes throughout the FF profile depending on the FF layer and time elapsed after the WA amendment. However, differences between layers at the amended and not-amended plots do not need to be constant in the course of a year because of a positive/negative impact of WA on microbial activity on the one side and natural changes of decomposition processes throughout the year on the other side.

2. Materials and Methods

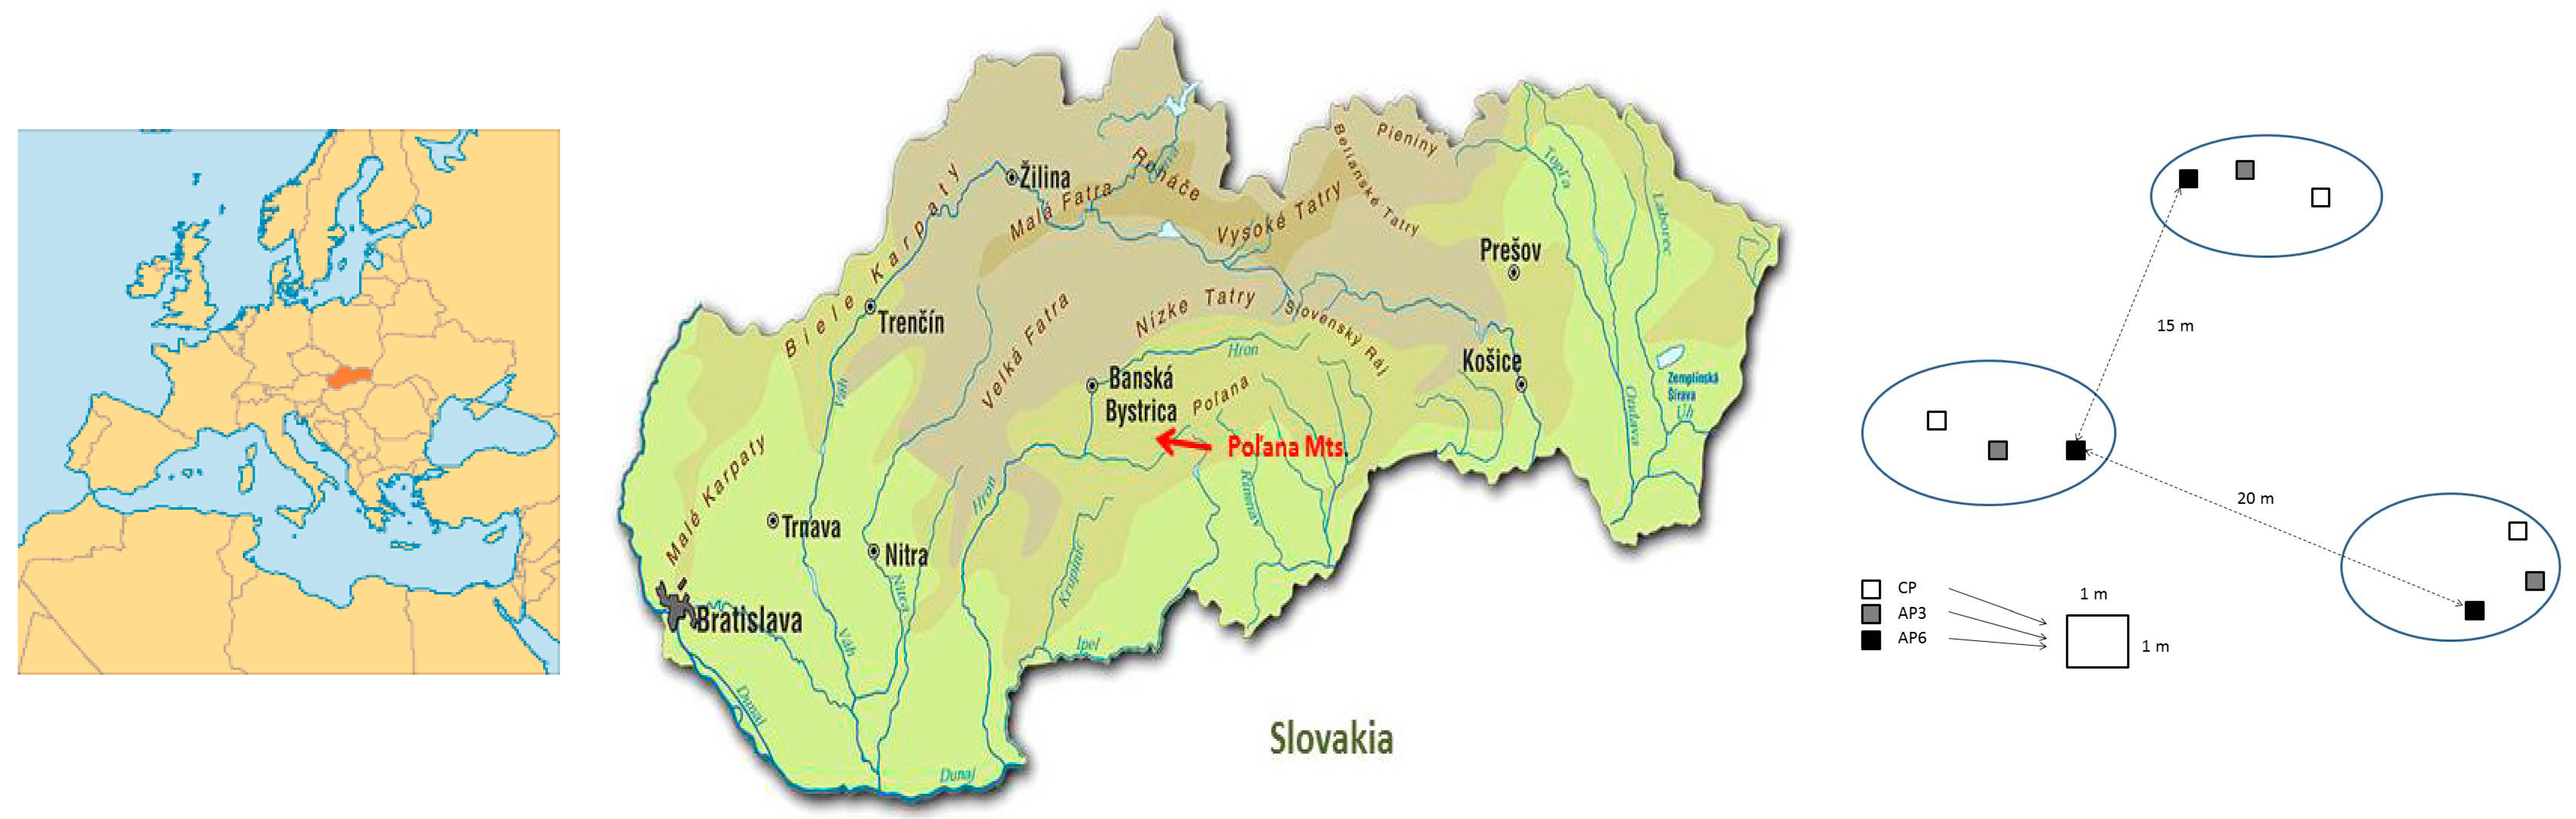
2.1. Site Description, Experimental Design, and Soil Sampling

The study was performed in an 80-year old Norway spruce (Picea abies (L.) Karst.) stand, located in the Poľana Mountains, in the central part of Slovakia at an altitude of 1300 m.a.s.l. Mean annual temperature at the experimental plot is 3.2 °C, and the yearly precipitation averages 1044 mm. The dominant soil type is Andic Cambisol with a loamy texture derived from andesite and pyroclastic rocks. In the forest floor, litter (OL), fermentation (OF) and humus (OH) horizons with average thicknesses of 1.5, 2, and 4 cm, respectively, could be recognized.
The experiment consisted of three levels of WA fertilization: 0 t·ha−1 (control plot, CP), 3, and 6 t·ha−1 of WA (plots AP3 and AP6, respectively). Nutrient and potentially toxic heavy metal contents of the wood ash are shown in Table 1.
WA stabilised on air but not pelleted was carefully and evenly spread on the soil surface of 1 × 1 m plots in the middle of October 2012. WA was not mixed with FF, and plots were not irrigated to ensure conditions similar to the forestry practice. A series of plots randomly distributed over the stand area was established in three replications located 15 to 20 m from each other (nine plots in total). Each replication contained all three treatments (CP, AP3, AP6), the distance between plots within each cluster was approx. 2–3 m to minimize the effects of spatial variability of soil properties. Plots were established where the herb layer was poor or non-existent. The scheme of sampling plot distribution is shown in Appendix Figure A1. As the slope is very slight and infiltration of water into soil rapid because of the FF and soil properties (extremely loose), there was no risk of spreading ash onto the control plots.
Sampling was done 0.5, 1, 6, and 12 months after the treatment. Rain appeared one week after WA application, a part of WA dispersed in the rainwater and infiltrated through the topsoil. Three weeks after WA application it was snowing and the 1 month samples were collected by gently removing 3 cm of snow from the forest floor before sampling. Soil samples were collected using a 0.12 × 0.12 m frame from OL, OF, OH horizons and using knife and scoop from the A-horizon (0 m–0.1 m depth) at two different places within each plot and mixed to produce a composite sample for each soil layer.

2.2. Soil Analyses

After the bringing samples to the laboratory, fresh mass of each sample from the distinct FF layer was determined. Each sample (including samples from the A-horizon) was divided into two parts. One part (fresh samples) intended for microbial analyses and moisture and dry mass assessment was stored in field-moist condition at 4 °C until the analysis; the other part was air-dried and used for measurements of chemical properties.
In air-dried samples, soil acidity, total carbon and nitrogen content, as well as the concentration of exchangeable Ca2+, Mg2+, and K+ cations was determined. Soil acidity was measured in 1 M KCl suspension (20 g soil from the A-horizon plus 50 mL KCl, and/or 10 g samples from the OL, OF, and OH horizons plus 50 mL KCl solution) after 24 h potentiometrically. For the determination of total carbon and nitrogen, a MACRO Elemental Analyzer (CNS Version; Elementar, Germany) was used, employing the dry combustion method. Exchangeable Ca2+, Mg2+, and K+ were estimated in NH4Cl extract using atomic absorption spectrometry (GBC Avanta AAS).
In fresh samples, basal respiration, catalase activity, and soil microbial community characteristics using BIOLOG approach were analysed. Soil samples were not sieved nor ground prior to analysis to preserve natural conditions for microorganisms. However, larger organic debris, roots, or rocks were removed by hand. Basal respiration was measured by estimating the amount of carbon dioxide released from fresh soil after a 3 day incubation at 21 °C and absorbed in 0.05 M NaOH. The amount of carbonate was determined by titration with 0.05 M HCl after the precipitation of carbonates by BaCl2. Catalase activity was measured 10 min after 3% H2O2 was added to fresh soil sample, based on the volume of discharged oxygen according to the method of Khaziev [22]. For the study of the structure of the soil microbial community, BIOLOG (Hayward, CA, USA) EcoPlates [23] were used. The plates contain 31 different organic substrates complemented by the redox dye tetrazolium, which is reduced by NADH produced by respiration. The rate and extent of colour formation indicate the rate and extent to which respiration occurs with the substrate present in the well. Inocula were prepared by re-suspending fresh soil in 0.9% NaCl, the supernatant was diluted 1:10,000–100,000 depending on microbial biomass, which was measured on a small group of samples. The amount of 150 μL of extract was incubated in microtitration plates at 27 °C. Absorbance at 590 nm was recorded using the Sunrise Microplate reader (Tecan, Salzburg, Austria) for 6 days. Absorbance values were blanked against the control well. The metabolic activity was calculated as the area below the time–absorbance curve, and was used as a measure of the abundance of the respective functional group. The richness of the soil microbial community was assessed as the number of substrates with a non-zero response. For the estimation of functional diversity of the microbial community, Hill’s diversity index (Div) was calculated [24] (Equatioin (1)):
Div =   1 p i 2
where pi is the frequency (relative abundance) of the i-th functional group.
All results were expressed on dry mass. Dry mass and soil water content were determined gravimetrically by oven-drying fresh soil at 60 °C (FF layers) and 105 °C (A-horizon) for 24 hours. Fresh mass of distinct FF horizons were converted on the plot of 1 m2. C and N concentrations in FF were converted on C and N content regarding the dry mass of distinct FF horizons per the plot of 1 m2.

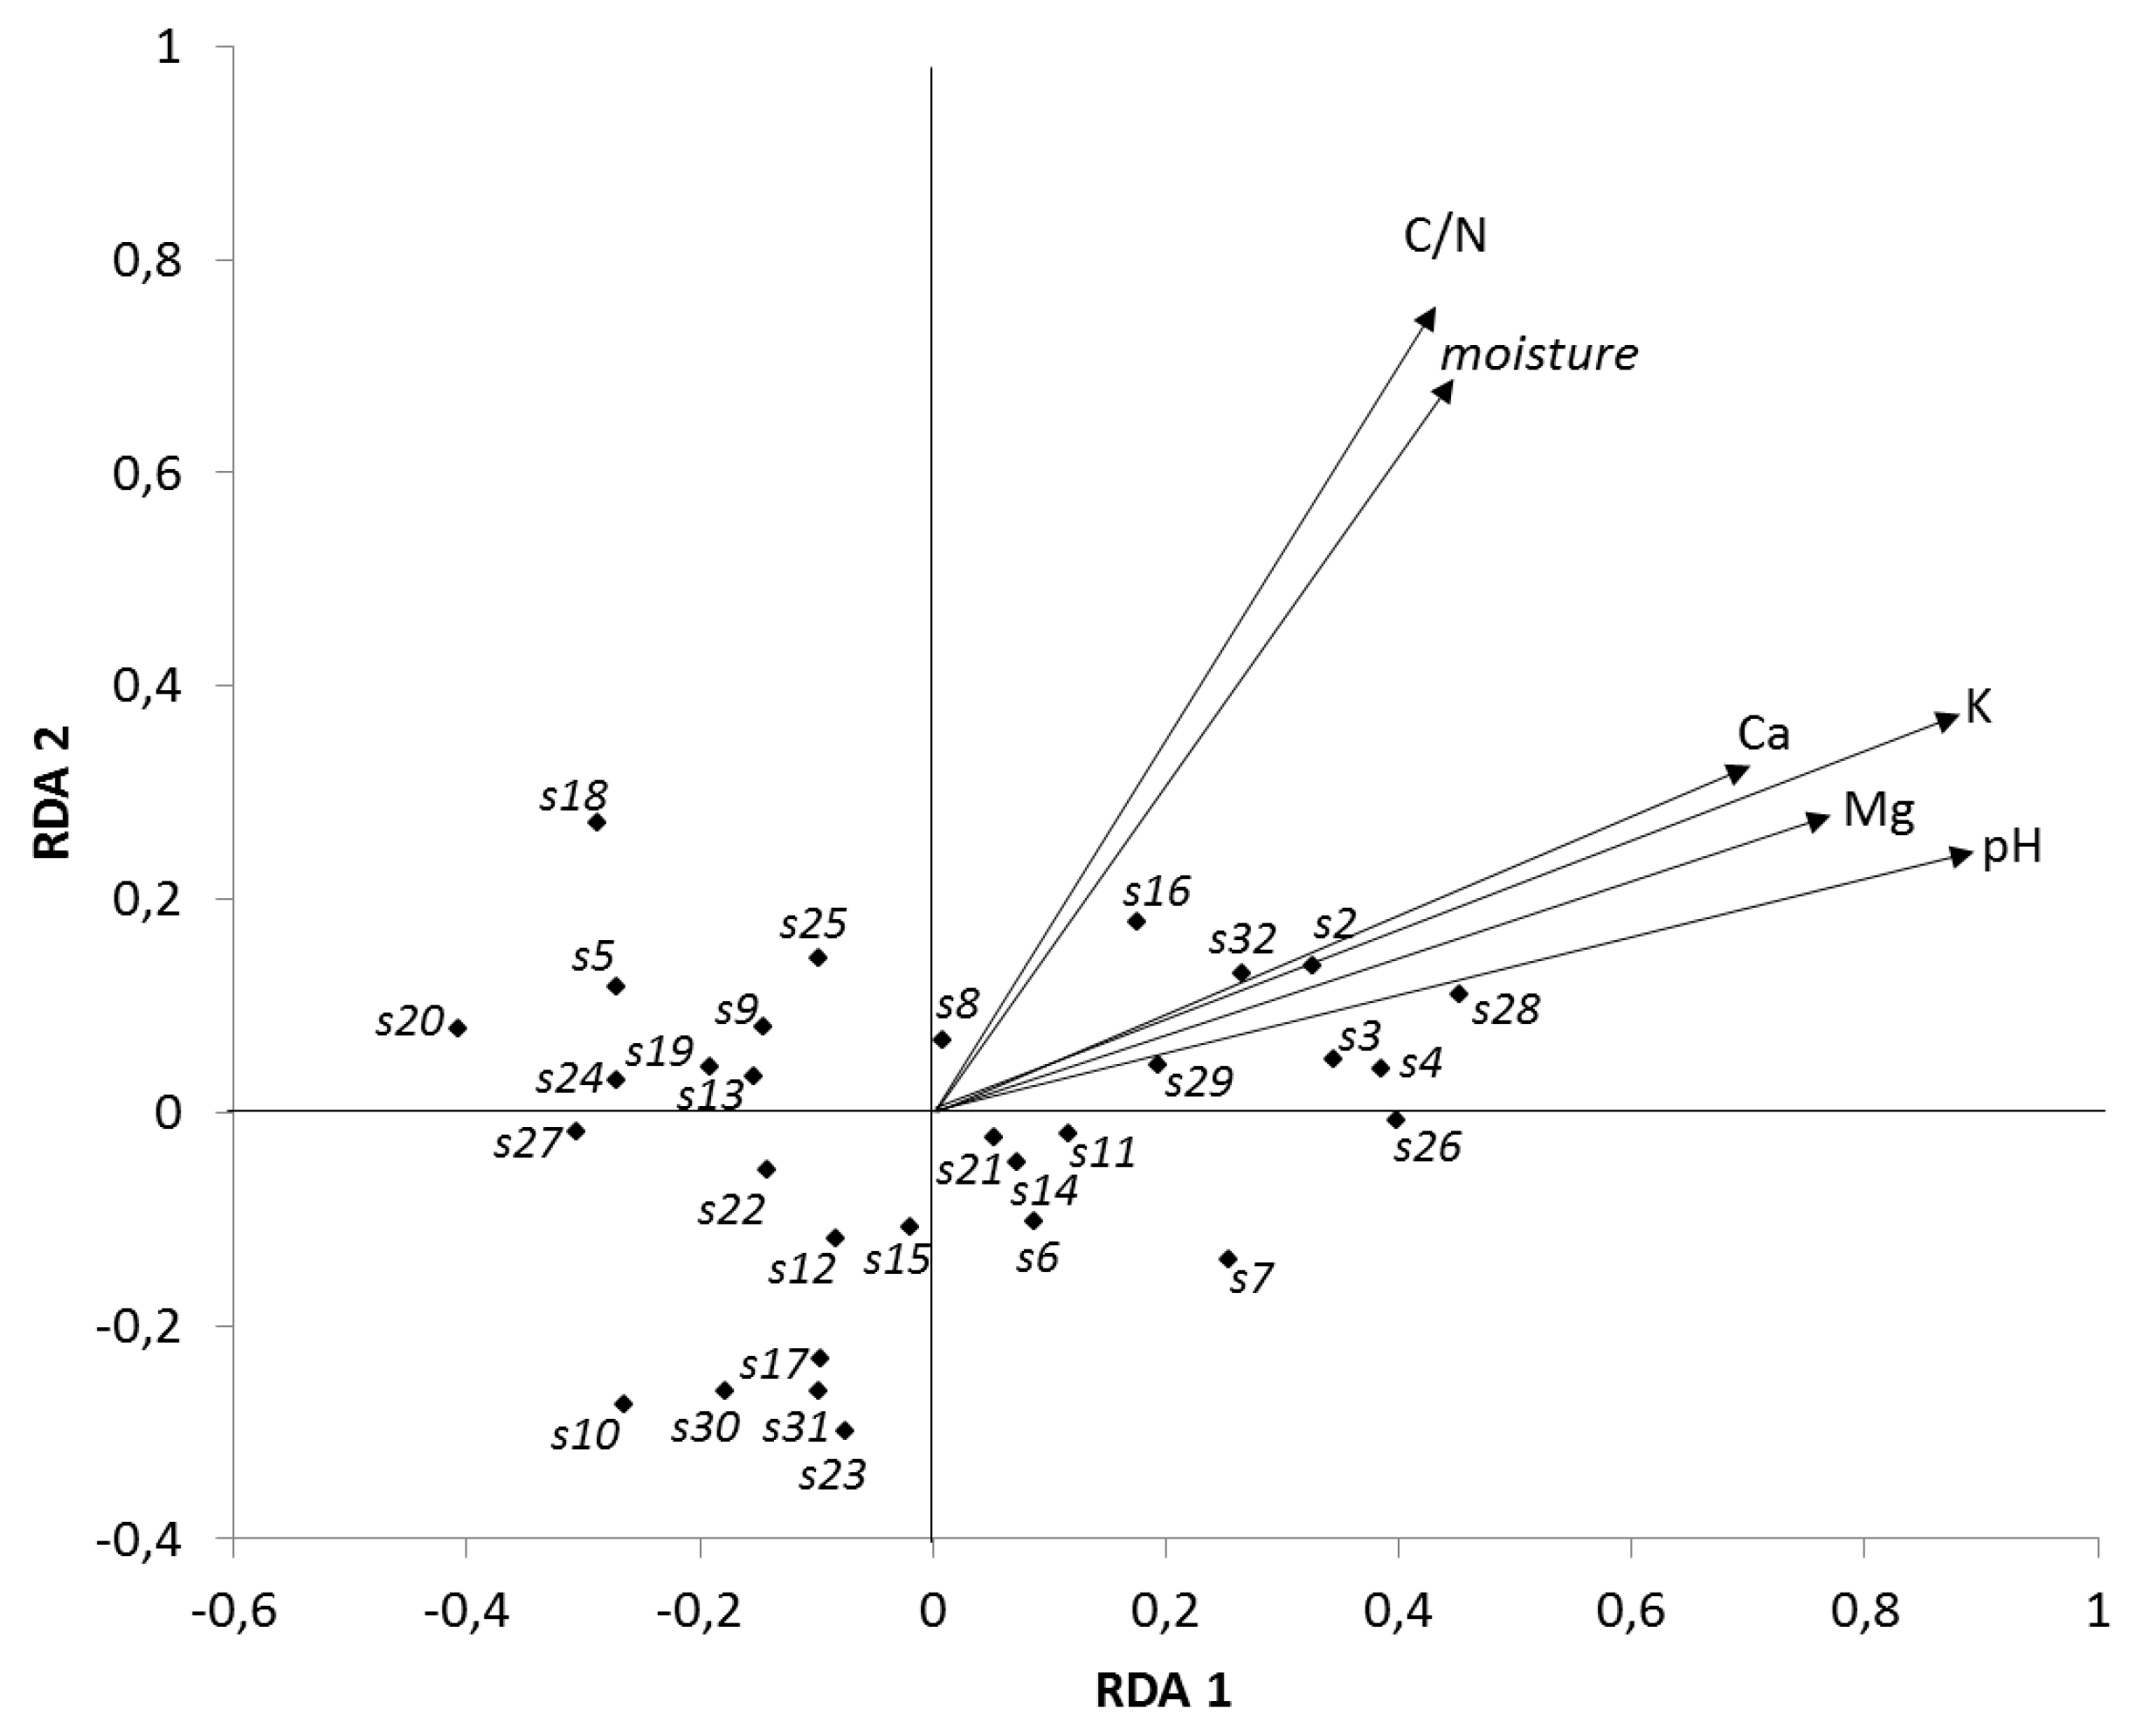
2.3. Data Evaluation
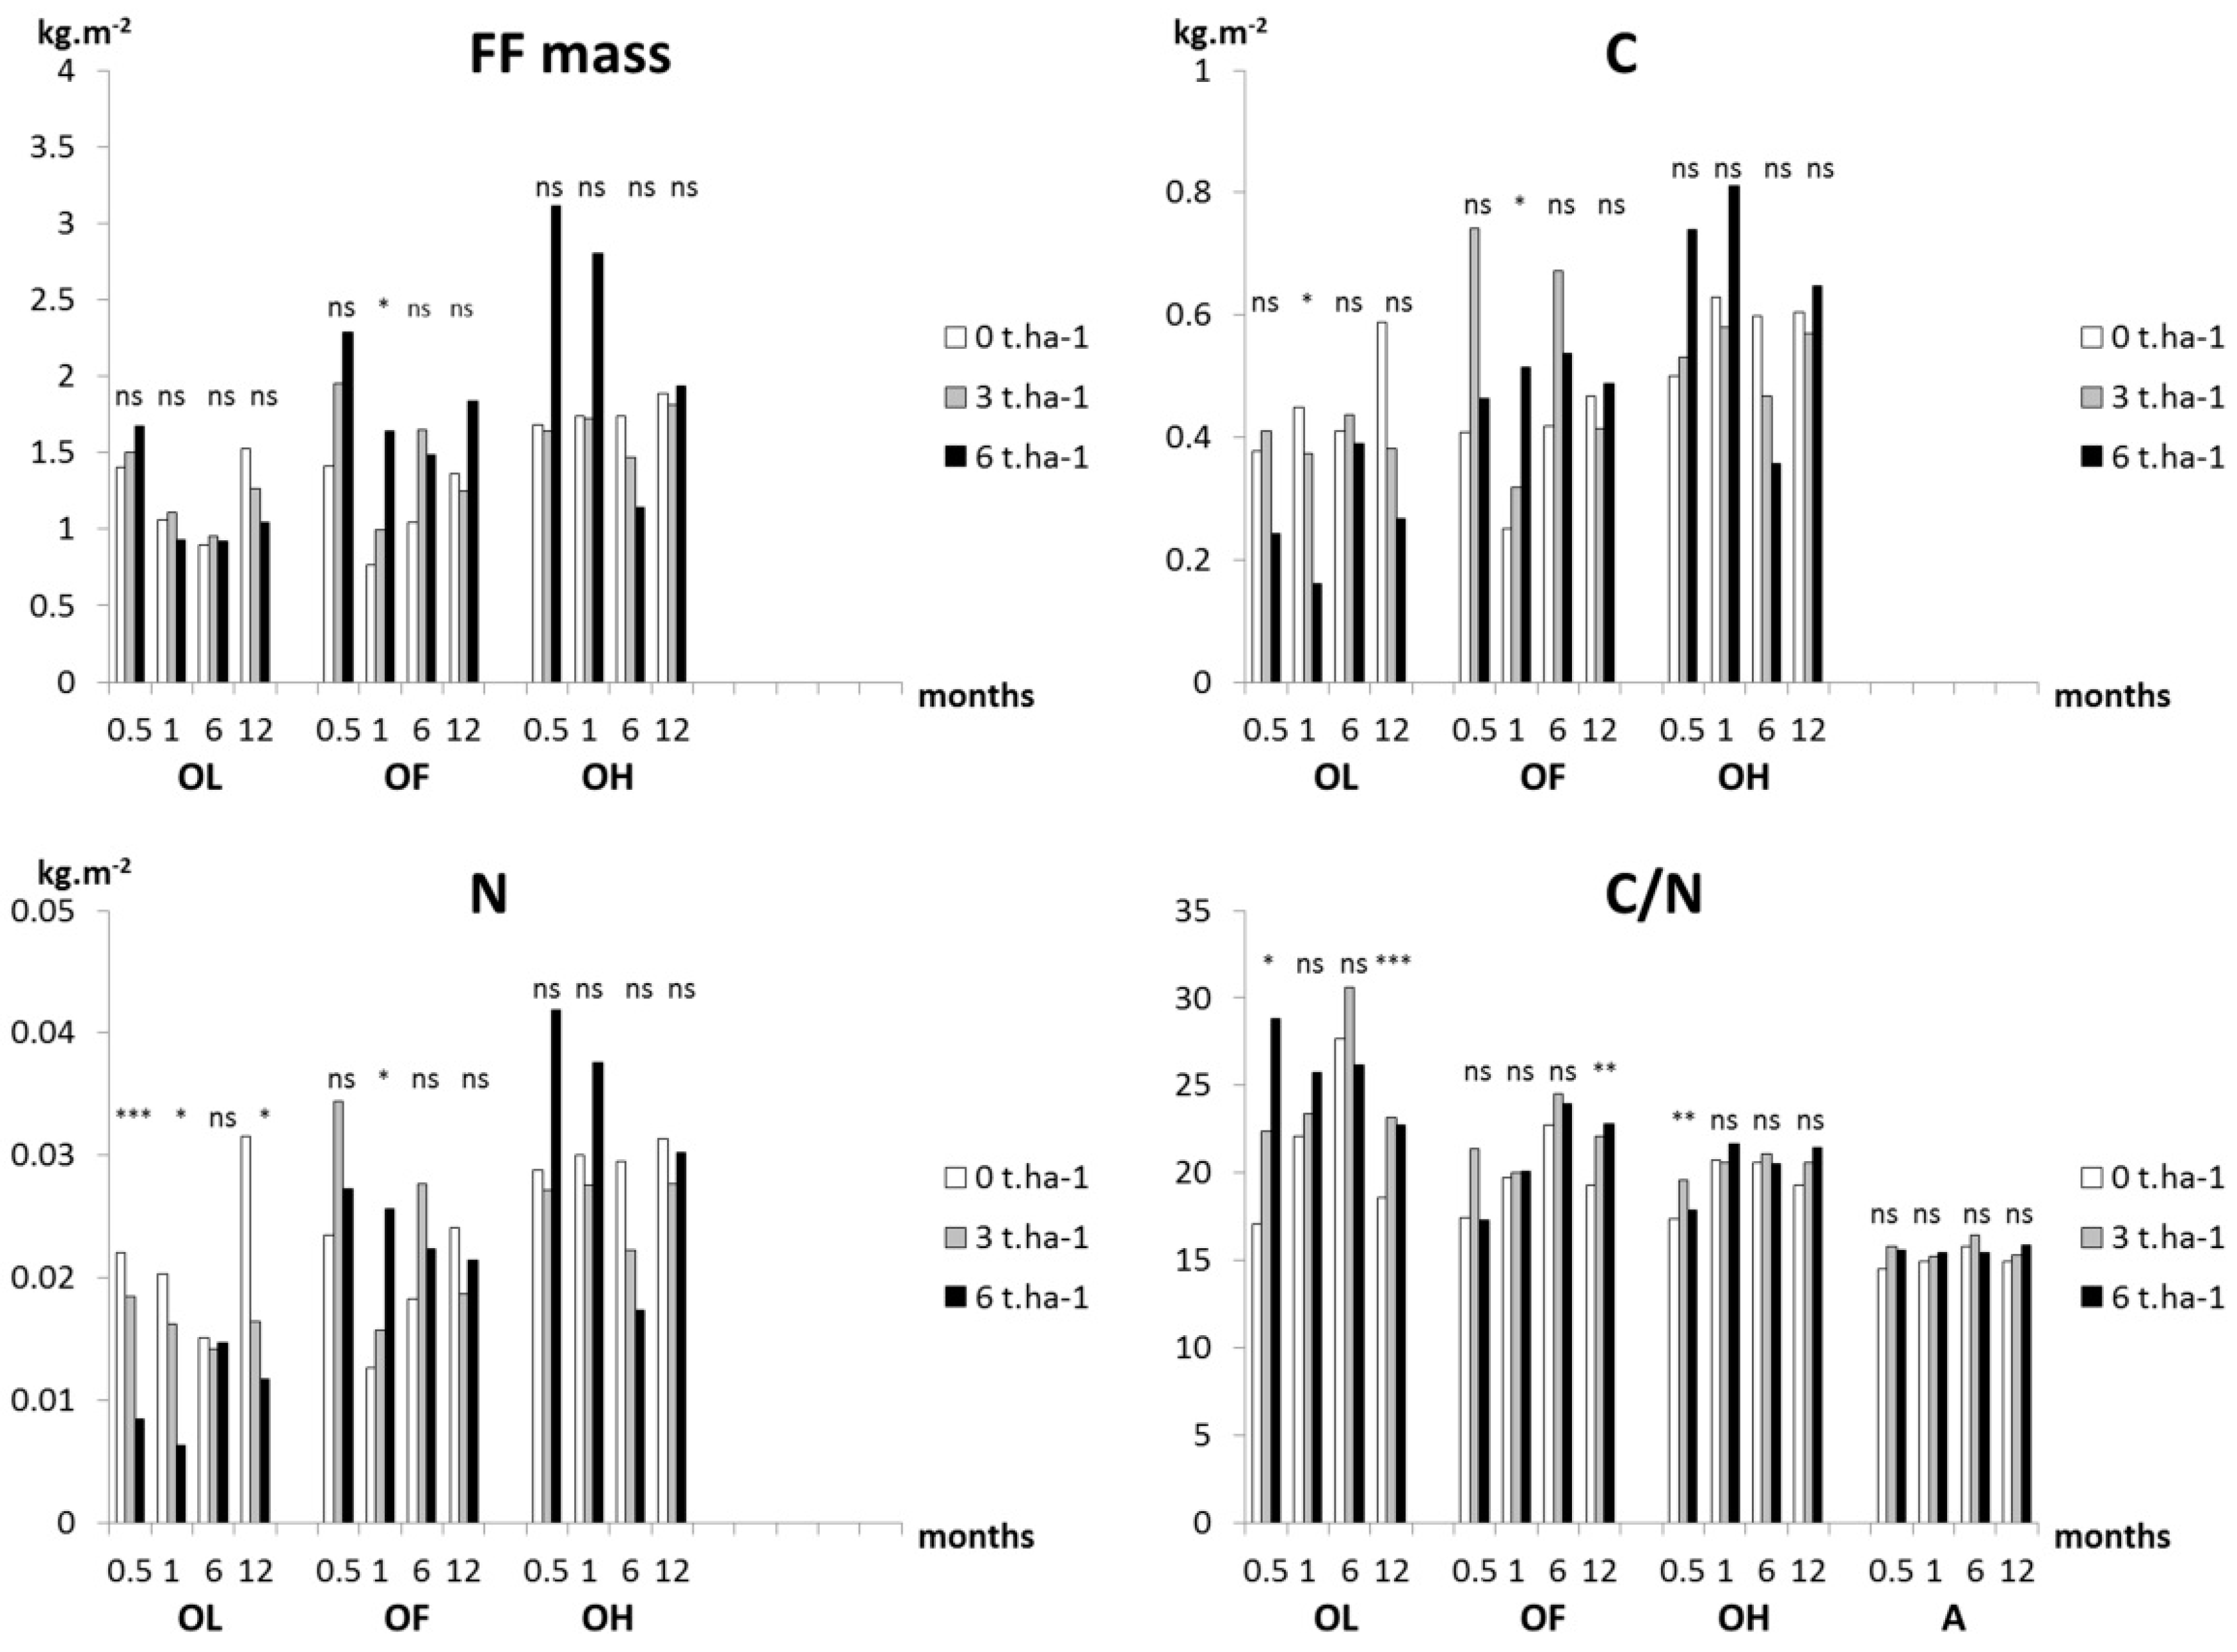
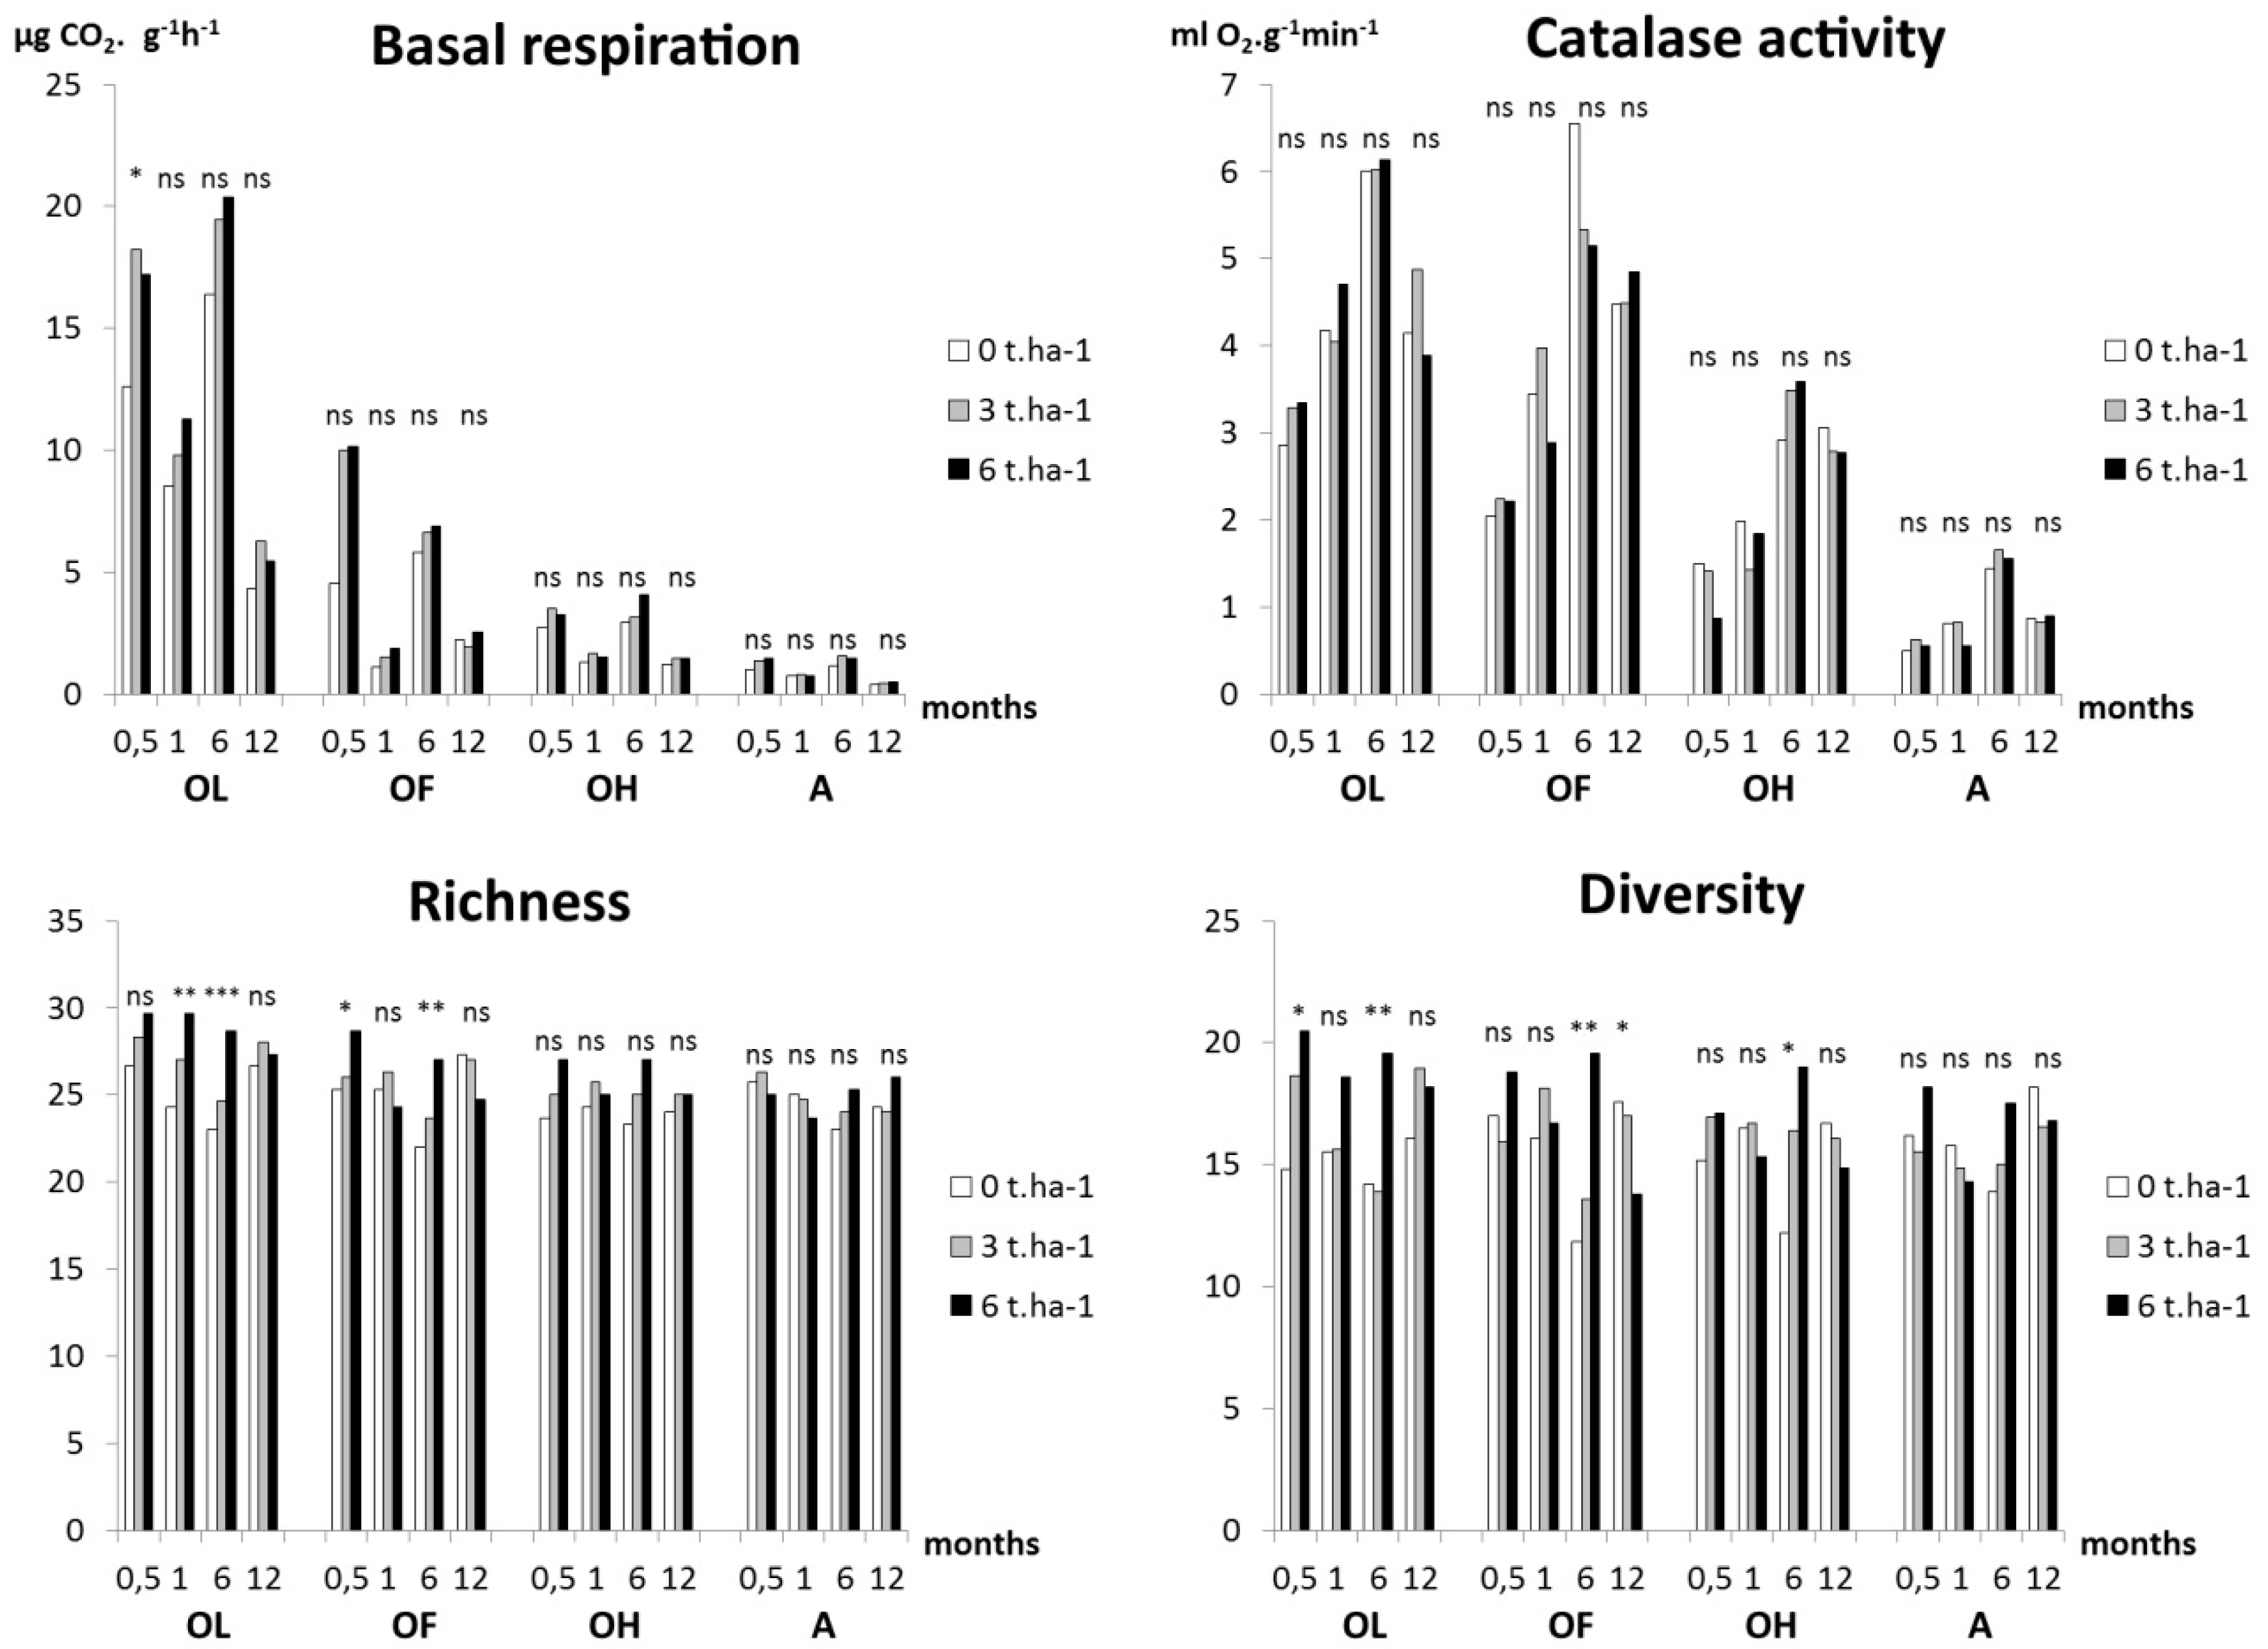
Statistical analyses were done using the statistical package SAS/STAT [25]. Analysis of variance (ANOVA) with repeated measures was used to test the effect of soil horizon, WA treatment, and sampling date on soil variables. Horizon and WA dose were considered fixed-effect factors and sampling date was treated as a repeated-measure factor. Greenhouse–Geissler adjustment of degrees of freedom was used for significance tests for date, date × horizon, and date × treatment interactions [26]. Because interactions were generally significant (which means that the microbial community responses to treatments were horizon- and date-dependent), we separately compared treatments by horizons and sampling dates (one-way ANOVAs).
As microbial richness and diversity do not completely explain how the composition of functional groups of microorganisms is related to WA, a multivariate analysis was performed. We chose a direct gradient analysis (redundancy analysis; RDA), allowing the determination of environmental variables that best explain the changes of the frequency distributions of microbial functional groups in different horizons with WA. RDA is based on a linear approximation of the species’ response to environmental gradients (appropriate when the gradient length is small) and yields constrained ordination axes reflecting the direction of the maximum variability within the dataset that can be explained by the assessed environmental factors [27]. The significance of environmental variables and RDA axes was tested using Monte Carlo permutation test (9999 runs). Unrestricted permutations were employed, since the abundance of microorganisms and the composition of microbial communities generally change at very short distances, so we did not expect spatial dependence at the scale used in this study. Significant environmental variables were identified by forward selection.

3. Results

The application of WA on the soil surface was reflected in all soil variables except C and N content and catalase activity (Table 2). Generally, WA application significantly increased base cations concentration and microbial richness and diversity, whereas it decreased soil acidity and soil nitrogen content (Figure 1, Figure 2 and Figure 3); for most soil characteristics, the effects were dose-dependent (pairwise Duncan’s tests). Similarly, highly significant differences between dates and between horizons were observed in almost all measured characteristics. Most interactions were significant as well (except for microbial community characteristics), indicating that the responses of soil properties and microbial community were not uniform over combinations of experimental variants (Table 2).

3.1. Base Cations

Surprisingly, the concentrations of Ca, Mg and K cations at AP3 and AP6 were very similar in the OL horizon during the whole measurement period and were distinctly higher at both amended plots in comparison to CP during the first half-year after the treatment (Figure 1). In the underlying OF horizon, amended plots exhibited higher Ca concentration already 0.5 months after the WA amendment; however, the highest concentration of base cations in this horizon was observed after 6 months in the case of Ca and after 1 month for Mg. A general increase of base cations in the OH horizon was found at 6 months. Differences in cations and pH were generally not detected in the A horizon within the duration of this study.

3.2. Soil Acidity (pH/KCl)

A significant pH increase was recorded in the OL horizon on both amended plots 0.5 months after the WA application (Figure 1). Soil acidity changed from pH = 3.4 at CP to pH = 6.9 at the AP6. However, during the following months, pH gradually decreased at both AP3 and AP6 in the OL horizon, but it was still significantly higher in comparison to CP one year after the WA application. In the OF horizon, significantly higher pH was observed at both treated plots during the observation period, but the differences in pH between CP and AP6 were lower than in the OL horizon. The highest pH in OF was found 1 month after WA amendment. In the OH horizon, distinct differences between treated plots and CP were detected until 6 months after the WA amendment. In the A-horizon, no changes in pH were observed after treatment during the first year.

3.3. Soil Organic Matter

The mass of distinct FF layer differed significantly between horizons with the highest in the OH layer (Table 2, Figure 2). Generally, the averages in the OF and OH horizons were higher in plots with higher WA dose; however, the differences are not significant because of high within-treatment variability (data not shown). Only the OF mass one month after treatment at AP6 was significantly higher in comparison to the OF mass with other dose.
At the amended plots, the C content became lower compared to the control plot one month after WA application in the top OL horizon. In the deeper horizons, the differences were generally non-significant and no consistent pattern was found in the case of amended plots. N content also decreased in OL starting from 0.5 months after the treatment at both amended plots, whereas in the OF and OH horizons, there were no significant changes in N content during the observation period. With regard to C:N ratio, no clear temporal or vertical trend was identified. In the uppermost OL horizon, C:N deteriorated shortly after WA addition, but after 6 months this difference disappeared and no clear pattern was observed in deeper horizons.

3.4. Soil Microorganisms

Two indicators were used for the characterisation of microbial activity–basal respiration and catalase activity. Their responses to the treatment differed. Basal respiration generally responded to the WA treatment (Table 2), but the ANOVAs by horizons and sampling dates with decreased sample sizes did not identify significant differences among WA doses (Figure 3). No changes were found in the case of catalase activity (Table 2, Figure 3). Microbial community structure changed after WA amendment–when significant differences were observed. Higher richness and diversity of functional groups were generally found at the amended plots, especially at AP6 and mostly during the first 6 months (Figure 3). The exception to this pattern is a decrease in microbial diversity after 1 year in the OF horizon. The differences between AP3 and AP6 were more distinct for richness than for diversity and more pronounced in the FF layers. In the A-horizon, no trend between plots was found.
RDA was used to assess community structure (BIOLOG-based functional groups) changes along the environmental gradients produced by WA amendment. The first two RDA axes accounted for 7.7% of the variance in the species data and 64.3% of the species–environment relationship. The forward selection of environmental variables in the RDA yielded six variables significantly affecting the frequency distributions of functional microbial groups: the concentration of base cations (potassium, calcium, magnesium), soil acidity, soil moisture, and C:N ratio (Figure 4). With increased base content and decreased soil acidity, positive correlation with the utilisation of β-methyl d-glucoside (s2), putrescine (s32), phenylethylamine (s28), and α-d-lactose (s29), and partly d-galactonic acid, γ-lactone (s3) and l-arginine (s4), and a negative correlation with d-glucosaminic acid (s22) was found. C:N-ratio, which is also affected by WA (cf. Table 2), negatively correlated with the activity of microbial groups utilizing i-erythritol (s10), dl-α-glycerol phosphate (s30), α-cyclodextrin (s17), d-malic acid (s31), and l-phenylalanine (s12). Figure 5 shows the sample scores of the first two RDA axes sorted according to WA dose in individual horizons. There is a gradient related to WA addition along the 1st RDA axis that is discernible in all horizons, although with increasing depth it becomes less pronounced: RDA 1 scores increase from the control plot over AP3 to AP6. There is no uniform response of functional group composition to the year’s season, but there seems to be a sort of cyclic fluctuation: the positions of samples taken at 2 weeks after WA application largely overlap with those at 1 year after WA treatment, whereas the samples taken at the other two dates are shifted. These changes are apparently associated with weather development rather than WA application. As expected, point clouds become progressively compact towards deeper horizons, where the environment is less heterogeneous, and tend to be concentrated in the lower-left quadrant (Figure 5), which means that their community compositions become similar to that of the above horizons on the control plots.

4. Discussion

4.1. Soil Chemical Properties

Based on existing studies, it is known that the most prominent (although temporary) consequence of WA application is an increase of base cation content, resulting in a decrease of soil acidity. The difference in acidity between treatments varies distinctly depending on the dose and date of sampling. Martikainen et al. [28] found in the humus layer an increase of 2 pH units 2–3 years after the WA amendment of 6 t·ha−1, Saarsalmi et al. [29] 1.1–1.5 pH units after 7 years, Levula et al. [30] observed a pH increase of up to 2 pH units 5 months after WA application of 5 t·ha−1, and Bååth et al. [31] even 2.5 pH units. Our study confirmed a significant increase in pH; however, during the first year after WA amendment, the changes were visible only in FF layers and not in the A-horizon. The most striking changes were found in the top OL layer where pH increased from 3.4 up to 6.9 and 6.1 by the dose of 6 and 3 t·ha−1, respectively—much larger differences in pH than observed in other studies. This can be explained by the sampling method. Samples are usually taken from the FF as a whole without differentiating into subhorizons [32,33,34]. In our study, pH was determined on three distinct FF layers, and as the results showed that there are significant differences in pH between them. The differences in the OL horizon against the not-amended plot decreased with time, but pH was still 1.5 and 1.8 pH units higher 1 year after the WA treatment. We suppose that a continuous pH decrease in this horizon is associated with the transport of base cations with percolated water into underlying horizons, which can be documented by the pH increase in OF after 1 month and in OH even 6 months later. The fact that, unlike other studies, we did not find pH changes in the A-horizon can be associated with the extremely high sorption capacity for cations/anions typical for this soil type with andic features [35].
The pattern of temporal changes of base cations in particular horizons is not as clear as that of pH. Unlike pH, we did not observe a continuous decrease of the base cation concentration in the OL horizon. Surprisingly, the amount of calcium did not peak at the beginning of the study but mostly 6 months later; in the OF and OH horizons, this temporal shift is visible in all base cations. However, the fluctuations of base cations concentration were also found in plots without WA. Relatively large amounts of nutrients are stored in the forest litter [36] and become continuously released by decomposition processes. As the intensity of decomposition processes varies during a year, depending on weather and input of fresh organic material, fluctuation of exchangeable cations during a year can also be expected in the non-amended plots. We suppose that the increase of base cations concentration 6 months after WA application can be associated with the increasing intensity of decomposition, as in April, at the beginning of the vegetation period at this altitude, solar radiation, air, and soil temperature increase, which is reflected in a higher microbial activity [11]. This suggestion is supported by a parallel increase of respiration and catalase activity observed in our study. The temporal shift observed in the case of calcium and magnesium concentration is less pronounced in potassium, probably because of rapid leaching on the one side: potassium is released from litter into the soil solution relatively quickly compared to other nutrients, and on the other side, potassium is also a weaker hold on cation exchange sites compared to Ca and Mg [37,38,39].
FF mass, as well as C and N content, did not show a clear pattern after the treatment. WA caused a significant decrease of C and N content in FF compared to the control plot early after the treatment. Decrease of C and N content after WA amendment was observed in many studies and is usually explained by the increase of cellulose decomposers and microorganisms involved in N-cycle inhabiting forest litter [40,41]. At our plots, the most distinct decrease in C and N content was found in the OL layer one month after treatment. Soil microorganisms can be responsible for a part of the C and N loss. The decrease can also be associated with loss via dissolved organic carbon (DOC) release. Fresh litter is the main source of DOC, its production and leaching is controlled by many factors, including soil pH [15]. It was shown that DOC concentration increases after WA application [42]. Jokinen et al. [15] found that the DOC concentration increased three-to-four-fold at WA amendment plot in comparison to the control plot and higher DOC amount was already observed 2 days after WA application. The inconsistent pattern of organic matter characteristics in our study can be associated with high spatial and temporal variability. In coniferous stands, the input of organic matter on the soil surface is very irregular, which can reduce the effect of WA on FF decomposition. In laboratory experiments, where the conditions are controlled, the effect could be much more pronounced.

4.2. Soil Microorganisms

The outcomes of studies dealing with microbial activity after WA treatment are quite inconsistent, increases as well as decreases in microbial biomass and activity were observed [16,40,43,44,45,46]. The discrepancies can be explained by variation in fertility and management regimes among sites, different degrees of stabilisation and wood ash dosage used, and different time scales among different studies [47]. WA usually stimulates microbial activity and mineralisation due to the changes of soil properties [13]. However, enhanced activity was mostly observed only during a relatively short period after WA amendment. Perucci et al. [17] detected increased microbial activity over the first 8 months; however, most pronounced changes occurred in the first two months. Zimmermann and Frey [14] observed that basal respiration peaked 4 days after WA addition, although the effect was still detectable after 460 days. There are few exceptions; e.g., Perkiömäki and Fritze [44] found changes in microbial activity and the phospholipid-derived fatty acids (PLFA) pattern still 18 years after WA treatment, but generally the duration of the WA effect was short. In our previous experiment in another spruce stand with soil sampling several months after WA application (plots were established for a different purpose), changes in soil chemical properties were distinct but the activity and composition of microbial community did not reflect them in general [48]. This was the motivation for a new experiment presented in this study, where soil samples were taken much earlier after WA application than in the first study to see whether the microbial community would reflect the physico-chemical changes at a short time scale. The results confirmed this expectation and, with the exception of catalase activity, all soil characteristics differed between plots with and without WA amendment.
Our results demonstrate that the effect of WA is not reflected in different attributes of microbial activity in the same way. As we already mentioned, we analysed basal respiration and catalase activity to characterize microbial activity. The reason for the choice of these characteristics is that during the years of 2003–2006, we monitored the responses of respiration and catalase activity in distinct FF layers to environmental conditions at this locality [11], and we supposed that the findings could help us by the interpretation of results in this study. Basal respiration is generally used as an indicator of total microbial activity in soil. Catalase (peroxide oxidoreductases; EC 1.11.1.6) catalyzing the decomposition of peroxidic bonds occurs in all cells growing aerobically and most facultative anaerobes. Catalase activity was found to be correlated with many soil variables and also very sensitive, e.g., to soil contaminants [49,50].
An immediate effect of WA throughout horizons was observed in the case of basal respiration but not in catalase activity, which is in accordance with Zimmermann and Frey [14] and confirms that the effect of WA on soil enzymes is less consistent, maybe because of different origins of soil enzymes and their interactions with the environment. The increase of microbial activity after WA treatment is usually associated with direct and indirect pH effects, because at neutral pH, the concentration of DOC is higher and its quality is enhanced. More carbon being available for microorganisms could lead to the proliferation of microbial species present in soil but inactive before the treatment [14,15]. In our study, the most distinct effect of WA on basal respiration was found only in the top 2–3 cm of the FF, i.e., in layers with relatively fresh materials (OL, OF), which due to increased pH are capable of releasing more DOC, serving as an easily utilised carbon source for microorganisms.
The structure of the microbial community usually reflects changes in soil acidity. Frostegåard et al. [51] showed that increased pH caused a shift in the bacterial community to more Gram-negative and fewer Gram-positive bacteria, while the amount of fungi was unaffected. Even though the studies of the changes of the soil microbial community after WA addition or liming mostly focused on taxonomic composition, employing PLFA assay [12,20,44], Niklińska et al. [52] showed that the BIOLOG approach oriented on functional groups may be useful because of its sensitivity and is more closely related to ecosystem functions. Actually, the adaptation of bacterial communities to changed environments (including changes in substrate supplies) does not necessarily require a change of taxonomic composition by natural selection; the famous experiments of Jacques Monod with enzyme adaptation [53] have already shown that the capacity of prokaryotic cells to adapt to different available substrates through gene activity regulation is enormous. Moreover, a large proportion of living bacterial cells in soil are inactive, and their ability to switch to the active state in the presence of substrates depends from the degree of dormancy [54]; taxonomic composition thus need not truly reflect the function of the microbial community. In our study, WA treatment was significantly reflected in the richness and diversity of microbial functional groups and several microbial groups showed changed substrate utilisation patterns (enhancement or decline) in relationship to changes of base cations availability and soil acidity. Lupwayi et al. [16] found that substrates responding to WA in the BIOLOG assay included carboxylic acids, amino acids, and carbohydrates. This is partly in accordance with our results, where increased utilisation of substrates was observed, which are produced by the breakdown of amino acids or heteropolysaccharides in dead plant tissues. The changes in community structure can be related to the availability of substrates, which depends on their incorporation into high-molecular complexes or stabilization on mineral surfaces [55]. Changes of the acidity and cation concentration of soil solution caused by WA affect stability of such organic or organo-mineral complexes [56] and may have increased the variety of substrates available for decomposition. Nevertheless, whether the higher functional diversity in WA-treated soils is a consequence of selective processes and colonization by new microbial taxa or a simple physiological adaptation of strains already present on site to a broader offer of substrates remains an open question. On the other hand, the increased microbial activity probably resulted from the preferential growth of certain members of microbial community that are favoured by high pH [12,15].

5. Conclusions

Wood ash application on the forest floor in a Norway spruce stand was reflected in the changes of chemical and microbial characteristics of the forest floor layers throughout the first year but not in the mineral A-horizon. The results demonstrate that the changes of particular horizons of forest floor are not simultaneous and of the same extent. WA application in autumn led to a significant increase in pH, base cation concentration, and distinct losses in C and N content in the OL layer in the first month; however, at the beginning of the vegetation period, the most pronounced effect of WA was observed in the OF and especially the OH horizon, which means that more appropriate conditions appear there due to less acidity and more available nutrients for plant roots or seedlings. The study also showed that WA provoked changes in the activity and composition of the microbial community when increased utilisation of some groups of amines and carbohydrates were found with decreasing soil acidity. Different properties of particular forest floor horizons led to a vertical stratification of the microbial community; in deeper layers, a less heterogeneous composition of functional groups was observed. The results indicate that forest floor layers need to be considered separately to understand environmental impacts on processes occurring there, as well as to identify their effects on aboveground vegetation rooting in these layers.

Supplementary Files

Supplementary File 1

Acknowledgments

We thank Vladimír Kriššák, Terézia Dvorská and Želmíra Brnáková for technical and laboratory assistance. This study was financed by the projects VEGA 1/0761/14, APVV-0580-10 and the Centre of Excellence “Wood ash application in forestry and evaluation of its effects”, ITMS: 26220220016, supported by the Research & Development Operational Programme funded by the ERDF.

Author Contributions

Erika Gömöryová conceived and designed the study, performed the experiments, analysed results, wrote the manuscript; Viliam Pichler conceived and designed the study, analysed results; Slávka Tóthová performed the experiments; Dušan Gömöry analysed results, wrote the manuscript.

Conflicts of Interest

The authors declare no conflict of interest.

Abbreviations

WAwood ash
OLlitter horizon
OFfragmented horizon
OHhumic horizon
FFforest floor
CPcontrol plot, WA fertilization: 0 t·ha−1
AP3amended plot, WA fertilization: 3 t·ha−1
AP6amended plot, WA fertilization: 6 t·ha−1
Respbasal respiration
Catcatalase activity
Richrichness of the soil microbial community
Divfunctional diversity of the soil microbial community
RDAredundancy analysis

Appendix

Figure A1. Localization of the research area and scheme of the distribution of research plots.
Forests 07 00108 g006

References

  1. Barney, R.J.; Bevins, C.D.; Bradshaw, L.S. Forest Floor Fuel, Loads, Depths, and Bulk Densities in Four Interior Alaskan Cover Types. In Forest Service; Research Note INT-304; U.S. Government Printing Office: Ogden, UT, USA, 1981; pp. 1–7. [Google Scholar]
  2. Knoepp, J.D.; Reynolds, B.C.; Crossley, D.A.; Swank, W.T. Long-term changes in forest floor processes in southern Appalachian forests. For. Ecol. Manag. 2005, 220, 300–312. [Google Scholar] [CrossRef]
  3. Greiffenhagen, A.; Wessolek, G.; Facklam, M.; Renger, M.; Stoffregen, H. Hydraulic functions and water repellency of forest floor horizons on sandy soils. Geoderma 2006, 132, 182–195. [Google Scholar] [CrossRef]
  4. Šnajdr, J.; Valášková, V.; Marhautová, V.; Herinková, J.; Cajthaml, T.; Baldrián, P. Spatial variability of enzyme activities and microbial biomass in the upper layers of Quercus petraea forest soil. Soil Biol. Biochem. 2008, 40, 2068–2075. [Google Scholar] [CrossRef]
  5. Menšík, L.; Kulhavý, J.; Kantor, P.; Remeš, M. Humus conditions of stands with different proportion of Douglas fir in the Hůrky training district and Křtiny training forest enterprise. J. For. Sci. 2009, 55, 345–356. [Google Scholar]
  6. Vance, E.D.; Nadkarni, N.M. Root biomass distribution in a moist tropical montane forest. Plant Soil 1992, 142, 31–39. [Google Scholar]
  7. Pernar, N.; Matic, S.; Bakšic, D.; Klimo, E. The accumulation and properties of surface humus layer in mixed selection forests of fir on different substrates. Ekológia (Bratislava) 2008, 27, 41–53. [Google Scholar]
  8. Rodkey, K.S.; Kaczmarek, D.J.; Pope, P.E. The distribution of nitrogen and phosphorus in forest floor layers of oak-hickory forests of varying productivity. In Proceedings of the 10th Central Hardwood Forest Conference, Morgantown, WV, USA, 5–8 March 1995; Gottschalk, K.W., Fosbroke, S.L.C., Eds.; Gen. Tech. Rep. NE-197. U.S. Department of Agriculture, Forest Service, Northeastern Forest Experiment Station: Radnor, PA, USA, 1995; pp. 94–108. [Google Scholar]
  9. Bruckner, A. Temperature variabiIity and fluctuation in the humus layer of a temperate deciduous forest in spring: Implications on the resident fauna. Bodenkultur 1998, 49, 229–237. [Google Scholar]
  10. Gömöryová, E.; Střelcová, K.; Škvarenina, J.; Gömöry, D. Responses of soil microorganisms and water content in forest floor horizons to environmental factors. Eur. J. Soil Biol. 2013, 55, 71–76. [Google Scholar] [CrossRef]
  11. Reichler, D.E. Dynamic Properties of Forest Ecosystems; International Biological Programme 23; Cambridge University Press: Cambridge, UK, 1981. [Google Scholar]
  12. Bååth, E.; Frostegård, Å.; Pennanen, T.; Fritze, H. Microbial community structure and pH response in relation to soil organic matter quality in wood-ash fertilized, clear-cut or burned coniferous forest soils. Soil Biol. Biochem. 1995, 27, 229–240. [Google Scholar] [CrossRef]
  13. Demeyer, A.; Voundi Nkana, J.C.; Verloo, M.G. Characteristics of wood ash and influence on soil properties and nutrient uptake: An overview. Bioresour. Technol. 2001, 77, 287–295. [Google Scholar] [CrossRef]
  14. Zimmermann, S.; Frey, B. Soil respiration and microbial properties in acid forest soil: Effects of wood ash. Soil Biol. Biochem. 2002, 34, 727–1737. [Google Scholar] [CrossRef]
  15. Jokinen, H.K.; Kiikkilä, O.; Fritze, H. Exploring the mechanisms behind elevated microbial activity after wood ash application. Soil Biol. Biochem. 2006, 38, 2285–2291. [Google Scholar] [CrossRef]
  16. Lupwayi, N.Z.; Arshad, M.A.; Azooz, R.H. Soon, Y.K. Soil microbial responses to wood ash or lime applied to annual crops and perennial grass in an acid soil of northwestern Alberta. Can. J. Soil Sci. 2008, 89, 169–177. [Google Scholar] [CrossRef]
  17. Perruci, P.; Monaci, E.; Onofri, A.; Vischetti, C.; Casucci, C. Changes in physico-chemical and biochemical parameters of soil following addition of wood ash: A field experiment. Eur. J. Agron. 2008, 28, 155–161. [Google Scholar] [CrossRef]
  18. Saarsalmi, A.; Smolander, A.; Kukkola, M.; Moilanen, M.; Saramäki, J. 30-Year effects of wood ash and nitrogen fertilization on soil chemical properties, soil microbial processes and stand growth in a Scots pine stand. For. Ecol. Manag. 2012, 278, 63–70. [Google Scholar] [CrossRef]
  19. Pitman, R.M. Wood ash use in forestry—A review of the environmental impacts. Forestry 2006, 79, 563–588. [Google Scholar] [CrossRef]
  20. Björk, R.G.; Ernfors, M.; Sikstrom, U.; Nilsson, M.B.; Andersson, M.X.; Rutting, T.; Klemedtsson, L. Contrasting effects of wood ash application on microbial community structure, biomass and processes in drained forested peatlands. FEMS Microbiol. Ecol. 2010, 73, 550–562. [Google Scholar] [CrossRef] [PubMed]
  21. Tóthová, S. Wood Ash User’s Manual for Wood Application; Forest Research Institute: Zvolen, Slovakia, 2012; p. 20. (In Slovak) [Google Scholar]
  22. Khaziev, F.K. Fermentativnaja Aktivnost’ pochv; Metodicheskoje posob’e: Moskva, Russia, 1976; p. 180. [Google Scholar]
  23. Insam, H. A new set of substrates proposed for community characterization in environmental samples. In Microbial Communities. Functional versus Structural Approaches; Insam, H., Rangger, A., Eds.; Springer: Heidelberg, Germany, 1997; pp. 260–261. [Google Scholar]
  24. Hill, M.O. Diversity and evenness: A unifying notation and its consequences. Ecology 1973, 54, 427–432. [Google Scholar] [CrossRef]
  25. SAS. SAS/STAT® User’s Guide. 2009. Available online: http://support.sas.com/documentation/onlinedoc/stat/index.html (accessed on 21 February 2010).
  26. Quinn, G.P.; Keough, M.J. Experimental Design and Data Analysis for Biologists; Cambridge University Press: Cambridge, UK, 2002; p. 557. [Google Scholar]
  27. Ter Braak, C.J.F.; Šmilauer, P. Reference Manual and User’s Guide to Canoco for Windows, Software for Canonical Community Ordination (version 4); Centre of Biometry: Wageningen, The Netherlands, 2002. [Google Scholar]
  28. Martikainen, P.J. Nitrification in two coniferous forest soils after different fertilisation treatments. Soil Biol. Biochem. 1984, 16, 577–582. [Google Scholar] [CrossRef]
  29. Saarsalmi, A.; Mälkönnen, E.; Piirainen, S. Effects of wood ash fertilisation on forest soil chemical properties. Silva Fenn. 2001, 35, 355–368. [Google Scholar] [CrossRef]
  30. Levula, T.; Saarsalmi, A.; Rantavaara, A. Effects of ash fertilization and prescribed burning on macronutrient, heavy metal, sulphur and 137Cs concentrations in lingonberries (Vaccinium vitis-idea). For. Ecol. Manag. 2000, 126, 269–277. [Google Scholar] [CrossRef]
  31. Bååth, E.; Arnebrant, K. Growth rate and response of bacterial communities to pH in limed and ash treated soils. Soil Biol. Biochem. 1994, 26, 995–1001. [Google Scholar] [CrossRef]
  32. Guckland, A.; Ahrends, B.; Paar, U.; Dammann, I.; Evers, J.; Meiwes, K.J.; Schönfelder, E.; Ullrich, T.; Mindrup, M.; König, N.; et al. Predicting depth translocation of base cations after forest liming: Results from long-term experiments. Eur. J. For. Res. 2012, 131, 1869–1887. [Google Scholar] [CrossRef]
  33. Thiffault, E.; Hannam, K.D.; Quideau, S.A.; Paré, D.; Bélanger, N.; Oh, S.-W.; Munson, A.D. Chemical composition of forest floor and consequences for nutrient availability after wildfire and harvesting in the boreal forest. Plant Soil 2008, 308, 37–53. [Google Scholar] [CrossRef]
  34. Rosenberg, O.; Persson, T.; Högbom, L.; Jacobsom, S. Effect of wood ash application on potential carbon and nitrogen mineralization at two forest sites with different tree species, climate and N status. For. Ecol. Manag. 2010, 260, 511–518. [Google Scholar] [CrossRef]
  35. Blume, H.P.; Brummer, G.W.; Horn, R.; Kandeler, E.; Kögel-Knabner, I.; Kretzschmar, R.; Stahr, K.; Wilke, B.M. Scheffer/Schachtschabel: Lehrbuch der Bodenkunde; Spektrum Akademischer Verlag: Heidelberg, Germany, 2010; p. 569. [Google Scholar]
  36. Cole, D.W.; Rapp, M. Elemental cycling in forest ecosystems. In Dynamic Properties of Forest Ecosystems; Reichler, D.E., Ed.; Cambridge University Press: England, UK, 1981; pp. 341–409. [Google Scholar]
  37. Ranjbar, F.; Jalali, M. Calcium, magnesium, sodium, and potassium release during decomposition of some organic residues. Commun. Soil Sci. Plant Anal. 2012, 43, 645–659. [Google Scholar] [CrossRef]
  38. Berg, B.; Staaf, H.; Wessen, B. Decomposition and nutrient release in needle litter from nitrogen-fertilized Scots Pine (Pinus sylvestris) stands. Scand. J. For. Res. 1987, 2, 399–415. [Google Scholar] [CrossRef]
  39. Jonczak, J. Decomposition of beech leaves in 120-years old stand on the area of Middle Pomerania. Sylwan 2014, 158, 621–629. [Google Scholar]
  40. Weber, A.; Karsisto, M.; Leppiinen, R.; Sundman, V.; Skujins, J. Microbial activities in a Histosol: Effects of wood ash and NPK fertilizers. Soil Biol. Biochem. 1985, 17, 291–293. [Google Scholar] [CrossRef]
  41. Ozolinčius, R.; Varnagiryte, I.; Armolaitis, K.; Gaitnieks, T.; Buozyte, R.; Raguotis, A.; Skuodiene, L.; Aleinikoviene, J.; Stakenas, V. Short term effects of compensatory wood ash fertilization on soil, ground vegetation and tree foliage in Scots pine stands. Baltic For. 2007, 13, 158–168. [Google Scholar]
  42. Ludwig, B.; Heil, B.; Flessa, H.; Beese, F. Use of 13C and 15N mass spectrometry to study decomposition of Calamagrostis epigeios in soil column experiments with and without ash additions. Isotopes Environ. Health Stud. 2000, 36, 49–61. [Google Scholar] [CrossRef] [PubMed]
  43. Fritze, H.; Smolander, A.; Levula, T.; Kitunen, V.; Mälkönen, E. Wood-ash fertilization and fire treatments in a Scots pine forest stand: Effects on the organic layer, microbial biomass, and microbial activity. Biol. Fert. Soils 1994, 17, 57–63. [Google Scholar] [CrossRef]
  44. Perkiömäki, J.; Fritze, H. Short and long term effects of wood ash on the boreal forest humus microbial community. Soil Biol. Biochem. 2002, 34, 1343–1353. [Google Scholar] [CrossRef]
  45. Maljanen, M.; Liimatainen, M.; Hytönen, J.; Martikainen, P.J. The effect of granulated wood-ash fertilization on soil properties and greenhouse gas (GHG) emissions in boreal peatland forests. Boreal Environ. Res. 2006, 19, 295–309. [Google Scholar]
  46. Augusto, L.; Bakker, M.R.; Meredieu, C. Wood ash applications to temperate forest ecosystems–potential benefits and drawbacks. Plant Soil 2008, 306, 181–198. [Google Scholar] [CrossRef]
  47. Aronsson, K.A.; Ekelund, N.G.A. Biological effects of wood ash application to forest and aquatic ecosystems. J. Environ. Qual. 2004, 33, 1595–1605. [Google Scholar] [CrossRef] [PubMed]
  48. Gömöryová, E.; Tóthová, S.; Pichler, V.; Homolák, M.; Kriššák, V.; Gömöry, D. Wood ash effect on chemical and microbiological properties of topsoil in a Norway spruce stand one year after the treatment. Folia Oecol. 2016, in press. [Google Scholar]
  49. Rodriguez-Kábana, R.; Truelove, B. Effects of crop rotation and fertilization on catalase activity in a soil of the southeastern United States. Plant Soil 1982, 69, 97–104. [Google Scholar] [CrossRef]
  50. Brzezińska, M.; Stępniewska, Z.; Stępniewski, W. Dehydrogenase and catalase activity of soil irrigated with municipal wastewater. Pol. J. Environ. Stud. 2001, 10, 307–311. [Google Scholar]
  51. Frostegåard, Å.; Bååth, E.; Tunlid, A. Shifts in the structure of soil microbial communities in limed forests as revealed by phospholipid fatty acid analysis. Soil Biol. Biochem. 1993, 25, 723–730. [Google Scholar] [CrossRef]
  52. Niklińska, M.; Chodak, M.; Laskowski, R. 2005 Characterization of the forest humus microbial community in a heavy metal polluted area. Soil Biol. Biochem. 2005, 37, 2185–2194. [Google Scholar] [CrossRef]
  53. Monod, J. The phenomenon of enzymatic adaptation. In Selected Papers in Molecular Biology by Jacques Monod; Lwoff, A., Ullmann, A., Eds.; Academic Press: New York, NY, USA, 1947; pp. 68–134. [Google Scholar]
  54. Blagodatskaya, E.; Kuzyakov, Y. Active microorganisms in soil: Critical review of estimation criteria and approaches. Soil Biol. Biochem. 2013, 67, 192–211. [Google Scholar] [CrossRef]
  55. Turner, S.; Schippers, A.; Meyer-Stüve, S.; Guggenberger, G.; Gentsch, N.; Dohrmann, R.; Condron, L.M.; Eger, A.; Almond, P.C.; Peltzer, D.A.; et al. Mineralogical impact on long-term patterns of soil nitrogen and phosphorus enzyme activities. Soil Biol. Biochem. 2014, 68, 31–43. [Google Scholar] [CrossRef]
  56. Laudicina, V.A.; Palazzolo, E.; Badalucco, L. Natural organic compounds in soil solution: Potential role as soil quality indicators. Curr. Org. Chem. 2013, 17, 2991–2997. [Google Scholar] [CrossRef]
Figure 1. Comparisons of base concentration and soil acidity under different wood ash (WA) treatments. Significances of F-tests of one-way ANOVAs by horizons and sampling dates are shown (*** p < 0.001, ** p < 0.01, * p < 0.05, ns p ≥ 0.05). OL: Litter horizon; OF: Fragmented horizon; OH: Humic horizon; A: A horizon.
Forests 07 00108 g001
Figure 2. Comparisons of organic matter properties under different WA treatments. Significances of F-tests of one-way ANOVAs by horizons and sampling dates are shown (*** p < 0.001, ** p < 0.01, * p < 0.05, ns p ≥ 0.05). FF: Forest floor.
Forests 07 00108 g002
Figure 3. Comparisons of soil microbial community characteristics under different WA treatments. Significances of F-tests of one-way ANOVAs by horizons and sampling dates are shown (*** p < 0.001, ** p < 0.01, * p < 0.05, ns p ≥ 0.05).
Forests 07 00108 g003
Figure 4. Redundancy analysis (RDA) of soil microbial data: functional groups positions and significant environmental variables which passed the forward selection. Arrow tips instead of complete arrows show the positions of functional microbial groups (metabolizing specific substrates): s2, β-methyl-d-glucoside; s3, d-galactonic acid γ-lactone; s4, l-arginine; s5, pyruvic acid methyl ester; s6, d-xylose; s7, d-galacturonic acid; s8, l-asparagine; s9, Tween 40; s10, i-erythritol; s11, 2-hydroxybenzoic acid; s12, l-phenylalanine; s13, Tween 80; s14, d-mannitol; s15, 4-hydroxybenzoic acid; s16, l-serine; s17, α-cyclodextrin; s18, N-acetyl-d-glucosamine; s19, γ-hydroxybutyric acid; s20, l-threonine; s21, glycogen; s22, d-glucosaminic acid; s23, itaconic acid; s24, glycyl-l-glutamic acid; s25, d-cellobiose; s26, glucose-1-phosphate; s27, α-ketobutyric acid; s28, phenylethylamine; s29, α-d-lactose; s30, dl-α-glycerol phosphate; s31, d-malic acid; s32, putrescine.
Forests 07 00108 g004
Figure 5. Redundancy analysis of soil microbial data: Sample positions.
Forests 07 00108 g005
Table 1. Nutrient and heavy metal concentrations of the wood ash used for the experiment [21].
CaMgKP
g·kg−112012368
CdPbCrAs
mg·kg−13.4930.2739.059.01
Table 2. Analyses of variance of soil characteristics (significance of F-tests).
Source of VariationdfpHCaMgKC:NBRCatRichDivdfCNFFm
Horizon3************************ns2nsns*
Treatment2******************ns******2********
Horizon × Treatment6************nsnsnsns4ns**ns
Error2418
Date 13ns**********************3ns***
Date × Horizon 14*********************nsns6*nsns
Date × Treatment 16**ns******nsns*****6nsnsns
Date × Horizon × Treatment 118***nsns****nsnsnsns12nsns
Error (Date) 17254
df–degrees of freedom. Significance levels: ns non-significant (p > 0.05), * 0.01 < p < 0.05, ** 0.001 < p < 0.01, *** p < 0.001. 1 approximate DF; Greenhouse-Geissler adjustment of DF was used for probability tests. BR, basal respiration; Cat, catalase activity; Rich, richness of microbial functional groups; Div, diversity of microbial functional groups; FFm, forest floor mass.

