1. Introduction
Forest planning is more challenging than ever. This is because sustainable forest management planning decisions cannot be made from only an economic perspective but must take into account other factors such as ecological and social values [
1]. Furthermore, it is common that the planning process also involves various stakeholders, experts, or decision makers in addition to the forest owner, all of whom have specific objectives [
2]. In a situation where the goal is to identify the optimal forest plan, the first step is often to use decision support systems, such as Heureka [
3], for generating a wide array of alternative forest management plans. These different management plans can then be analyzed with respect to forest development over time and how different management options affect the outcome in terms of a range of ecosystem services. However, objective facts are not always sufficient to make the 'best' decision in complex situations. An example would be a public forest owner, e.g., a municipality that wants to evaluate the effect of applying continuous-cover forestry on its forest holdings. The decision makers must also reflect on their own and other stakeholders’ preferences, because one specific forest plan seldom performs best in terms of all objectives. When there are multiple conflicting objectives, improving the outcome for one objective could lead to worse outcomes for other objectives. Consequently, which forest plan is best depends on how important different objectives are. It is thus important for decision makers to utilize planning tools that can handle situations where multiple stakeholders are included in the planning process and where these stakeholders can evaluate a number of forest plans from the perspective of a number of different objectives. That is, there is a need for planning tools that are based both on the production potential of the ecosystem—data that to some extent can be seen as objective facts—and on the decision makers and stakeholders' preferences—data that to some extent can be seen as subjective values.
One such tool is multiple-criteria decision analysis (MCDA). MCDA is a set of decision analysis methods that can be used to address problems that are characterized by multiple and conflicting objectives [
4]. MCDA was originally developed as a tool for a single decision maker, but the multi-objective character makes MCDA very useful also in participatory planning and group decision making when we want to include the opinions of several stakeholders. Through a structured process, MCDA will support the decision maker(s) in making trade-offs between objectives in order to identify alternative solutions that fulfill these objectives in the best possible way. Further, MCDA methods enable comparison of values measured on different scales which means that values need not be converted into monetary terms. Assuming that the objectives have been identified and arranged in a hierarchical structure and that a number of alternatives have been identified or created, MCDA is usually implemented in three steps: (i) weighting of the objectives and attributes according to relative importance; (ii) evaluation of the outcome for each alternative with respect to each attribute; and finally (iii) ranking of alternatives and sensitivity analysis of the results.
One of the most frequently used MCDA methods in participatory forest planning is the Analytic Hierarchy Process (AHP), which was developed in the 1970s [
5,
6]. AHP is based on pairwise comparisons of objectives and alternatives, from which the alternatives can be ranked according to relative importance. With pairwise comparisons, the decision maker considers only two objectives at a time and the process of weighting objectives is thus facilitated. However, a disadvantage of AHP, and many other MCDA methods, is that as the number of objectives and alternatives increase, the evaluations grow very complex [
7]. Thus, even though the method is relatively user-friendly and can involve multiple stakeholders, there are only a limited number of alternatives that it can evaluate. Saaty and Ozdemir [
8] have recommended that the number of objectives and alternatives should not exceed 7 ± 2, respectively, to make the decision process more manageable. Furthermore, Nordström
et al. [
9] report that, based on their experience, including five or more objectives into the AHP will often become problematic. However, limiting the number of alternatives included in the analysis introduces a risk that the most suitable plan will be excluded from the actual decision process.
One way to handle this problem and still retain the user-friendliness of AHP is to use hybrid methods that combine AHP with other MCDA methods, such as value or utility functions, goal programming, or heuristic optimization [
5,
10]. In this study we propose the combination of AHP and the Technique for Order Preference by Similarity to Ideal Solution (TOPSIS). TOPSIS was developed by Hwang and Yoon [
11] and is based on the concept that the chosen alternative should have the shortest distance to the positive-ideal solution and the longest distance from the negative-ideal solution [
12]. The evaluation of every alternative based on the objectives of each stakeholder is a demanding task and TOPSIS simplifies this process by automating it, with no need, for example, for the construction of value functions or subjective selection of a rather limited number of alternatives in order to make the decision process manageable. In this way TOPSIS can evaluate more alternatives than AHP and many other MCDA methods [
7]. A disadvantage of TOPSIS is that it does not assign weights to various stakeholders’ objectives. Previously, researchers have therefore successfully combined AHP and TOPSIS in multiple criteria problems; AHP is used to assign weights to the objectives and TOPSIS is used to calculate the final rankings of the alternatives, (e.g., [
13,
14]). However, there is little evidence that the combination of AHP and TOPSIS is useful in strategic forest planning problems, which usually have a more complex nature than other planning problems in which MCDA is used. In addition to multiple objectives, two other features of strategic forest planning problems may affect the successful application of MCDA methods. First, the time frames in strategic forest planning are typically rather long because they must reflect the slow-growing nature of the forest. Furthermore, forests have high spatial complexity, involving many interacting processes over large areas.
The aim of this study is to test whether the combination of AHP and TOPSIS can facilitate the evaluation of a large number of strategic forest management plans in a situation with multiple objectives and several stakeholders. This approach is applied to a case study of the Vilhelmina municipality forest holding in northern Sweden. We hypothesize that the combination of TOPSIS and AHP can benefit strategic forest management planning, especially in participatory planning processes that are characterized by multiple conflicting objectives. Our hypothesis is based on two assumptions. First, when more plans are included in the decision process there will be a wider range of variety between the plans. This could reduce the gaps between them and increase the chance of finding the optimal plan. Additionally, the exclusion of management plans from the weighting process may make the process more adapted to those with less knowledge about forestry and thereby make the approach suitable for participatory planning involving lay stakeholders.
2. Material and Methods
2.1. The Combined MCDA Process
In this study, the AHP and TOPSIS methods were used together in a participatory MCDA process consisting of five steps, adapted from the works of Nordström
et al. [
9], Kangas & Kangas [
5], Yoon & Hwang [
12], and Keeney [
15]. The steps are as follows:
Stakeholder analysis: In the first step, stakeholders that are affected by or who can affect the situation are identified.
Definition of objectives: In the second step, the stakeholders’ objectives for the decision problem are identified and arranged in a hierarchical structure. The objectives on the lowest level of the hierarchy, which are used to measure the outcomes of the alternatives, are termed “attributes” in this study.
Elicitation of preferences for the objectives: In the third step, the stakeholders rate how important each objective is to them. In this study AHP was used to determine preferences for the objectives through systematic, pairwise comparisons [
6]. In the standard version of AHP, pairwise comparisons are made for both objectives and alternatives (in terms of each attribute), but in this study pairwise comparisons were only made for the objectives. The pairwise comparisons begin at the highest level of the objective hierarchy and proceed for all the objectives at this level. After this, the comparisons proceed to the next hierarchical level and continue until all of the objectives, at all hierarchical levels, have been compared. To determine how important each objective is the comparisons are made using a nine-point ratio scale (
Table 1).
The weights of the objectives and attributes are calculated by the eigenvector method. This method accounts for the possibility that pairwise comparisons might be inconsistent; e.g., even though objective a is twice as important as objective b, and b is three times more important than objective c, this does not mean that a is necessarily six times more important than c. Consistency is measured through a consistency ratio (CR), and Saaty [
6] recommends that the CR should not exceed 0.10% or 10%.
Generation of alternatives: In the fourth step, alternative plans, in this case long-term forest management plans, are generated. These alternatives differ in the extent to which they fulfill the various attributes. The alternatives should be Pareto efficient (i.e., it should not be possible to improve the outcome in terms of one attribute without causing a loss with respect to some other attribute).
Ranking of alternatives: Finally, the alternative plans are ranked based on how well they fulfill the attributes, and the importance of the objectives. In this study, TOPSIS was used to rank the alternatives in terms of each attribute and produce an overall ranking of alternatives based on the weights for objectives from AHP. The TOPSIS procedure can be described in six steps as follows (for a full mathematical description, see [
12]):
1. Vector normalization: Since the attributes are measured on different scales, the outputs for the alternatives in terms of attributes are normalized to values between 0 and 1.
2. Calculation of weighted normalized ratings: The weights of attributes and objectives, determined through AHP, are multiplied by the normalized values from step 1.
3. Identification of positive-ideal and negative-ideal solutions: The largest and the smallest values of the weighted normalized ratings of each attribute are called the positive-ideal and the negative ideal solution, respectively, if the attribute is of the type “more is better” and vice versa if the attribute is of the type “less is better”.
4. Calculation of separation measures: The normalized values of each attribute in every alternative are compared to those of the positive- and negative-ideal solutions. The Euclidean distances (2-norms) of each normalized value from the positive- and negative-ideal values is calculated, providing a measure of each alternative’s separation from the two extremes. The greatest separation is that between the positive- and negative-ideal solutions, and all of the other solutions are ordered by separation in relation to these two.
5. Calculation of similarities to the positive-ideal solution: The measure of each alternative’s separation from the negative-ideal solution is divided by the sum of that alternative’s separations from the positive- and negative-ideal solutions. This provides a value between 0 and 1 for each alternative depending on its position with respect to these two extremes.
6. Ranking of preference order: The alternatives are ranked based on how close they are to the positive-ideal solution.
2.2. The Application of the Combined MCDA Process in Vilhelmina
2.2.1. Vilhelmina Municipality
The combination of AHP and TOPSIS was tested in a case study for a forest holding in northern Sweden consisting of 6682 ha of productive forest land. The forest holding is owned by the municipality of Vilhelmina, scattered over a large area, and managed by a company called Skogssällskapet (Gothenburg, Sweden). A management plan produced in 2006 provided data regarding the forest area. The municipality established general guidelines for the forest’s management, proposing that forestry activities should generate an income of 1 million Swedish krona (SEK) per year. Forest areas around towns and villages are to be managed in a way that accommodates the residents’ recreational activities, so there are restrictions on management activities that would dramatically alter the landscape. Furthermore, the municipality of Vilhelmina is obligated by the Swedish Forestry Act (SFS 1979:429) [
17] to consult with reindeer herding districts located within its borders (Vilhelmina Norra and Vilhelmina Södra) before final felling and the construction of new forest roads. Many sections of the forest holding are of high ecological value and other sections border either nature reserves or other areas of special ecological interest.
In 2004 Vilhelmina became a part of the International Model Forest Network, as the Vilhelmina Model Forest (VMF). The VMF aims to achieve sustainable use of the land within the municipality through public participation [
18]. This commitment has created a well-established network of stakeholders, representing both landowners and specific interest groups. The VMF also provides an online geographic information system (MFGIS), with thematic maps for forest management that highlight important areas for reindeer husbandry [
18].
2.2.2. Stakeholder Analysis
The stakeholder analysis followed a representative democracy approach, with the stakeholders divided into four interest groups. Each interest group (production, reindeer management, recreation, and environment) has specific objectives that can affect, or is affected by, the forest management. One to five representatives who could represent the public’s opinions were distinguished for each interest group. In the process of finding relevant representatives the well-established network of stakeholders in the VMF was very helpful in the selection of interest group representatives.
The “production” group was represented by the Vilhelmina municipality forest manager, the “reindeer management” group by a former chairman of a Sami village in the municipality (Vilhelmina Norra), the “recreation” group by four people with different backgrounds and/or recreational interests, and the “environment” group by the local chairman of a nature conservation association (Naturskyddsföreningen). Both the “recreation” and “environment” interest groups also included scientists from the Swedish University of Agricultural Sciences with expertise in the respective field.
2.2.3. Definition of Objectives
All stakeholders with local attachment to Vilhelmina were interviewed on phone with the purpose of identifying the objectives of each interest group. The interviews were semi-structured and centered on objectives often mentioned in the literature as significant for each interest group represented. An objective hierarchy was created based on the interview answers (
Figure 1). This hierarchy was then e-mailed to each stakeholder and they were asked to evaluate whether it truly reflected the main objectives of their interest group. None of the stakeholders made any corrections to the hierarchy. Based on the recommendations of Nordström
et al. [
9] and Kangas [
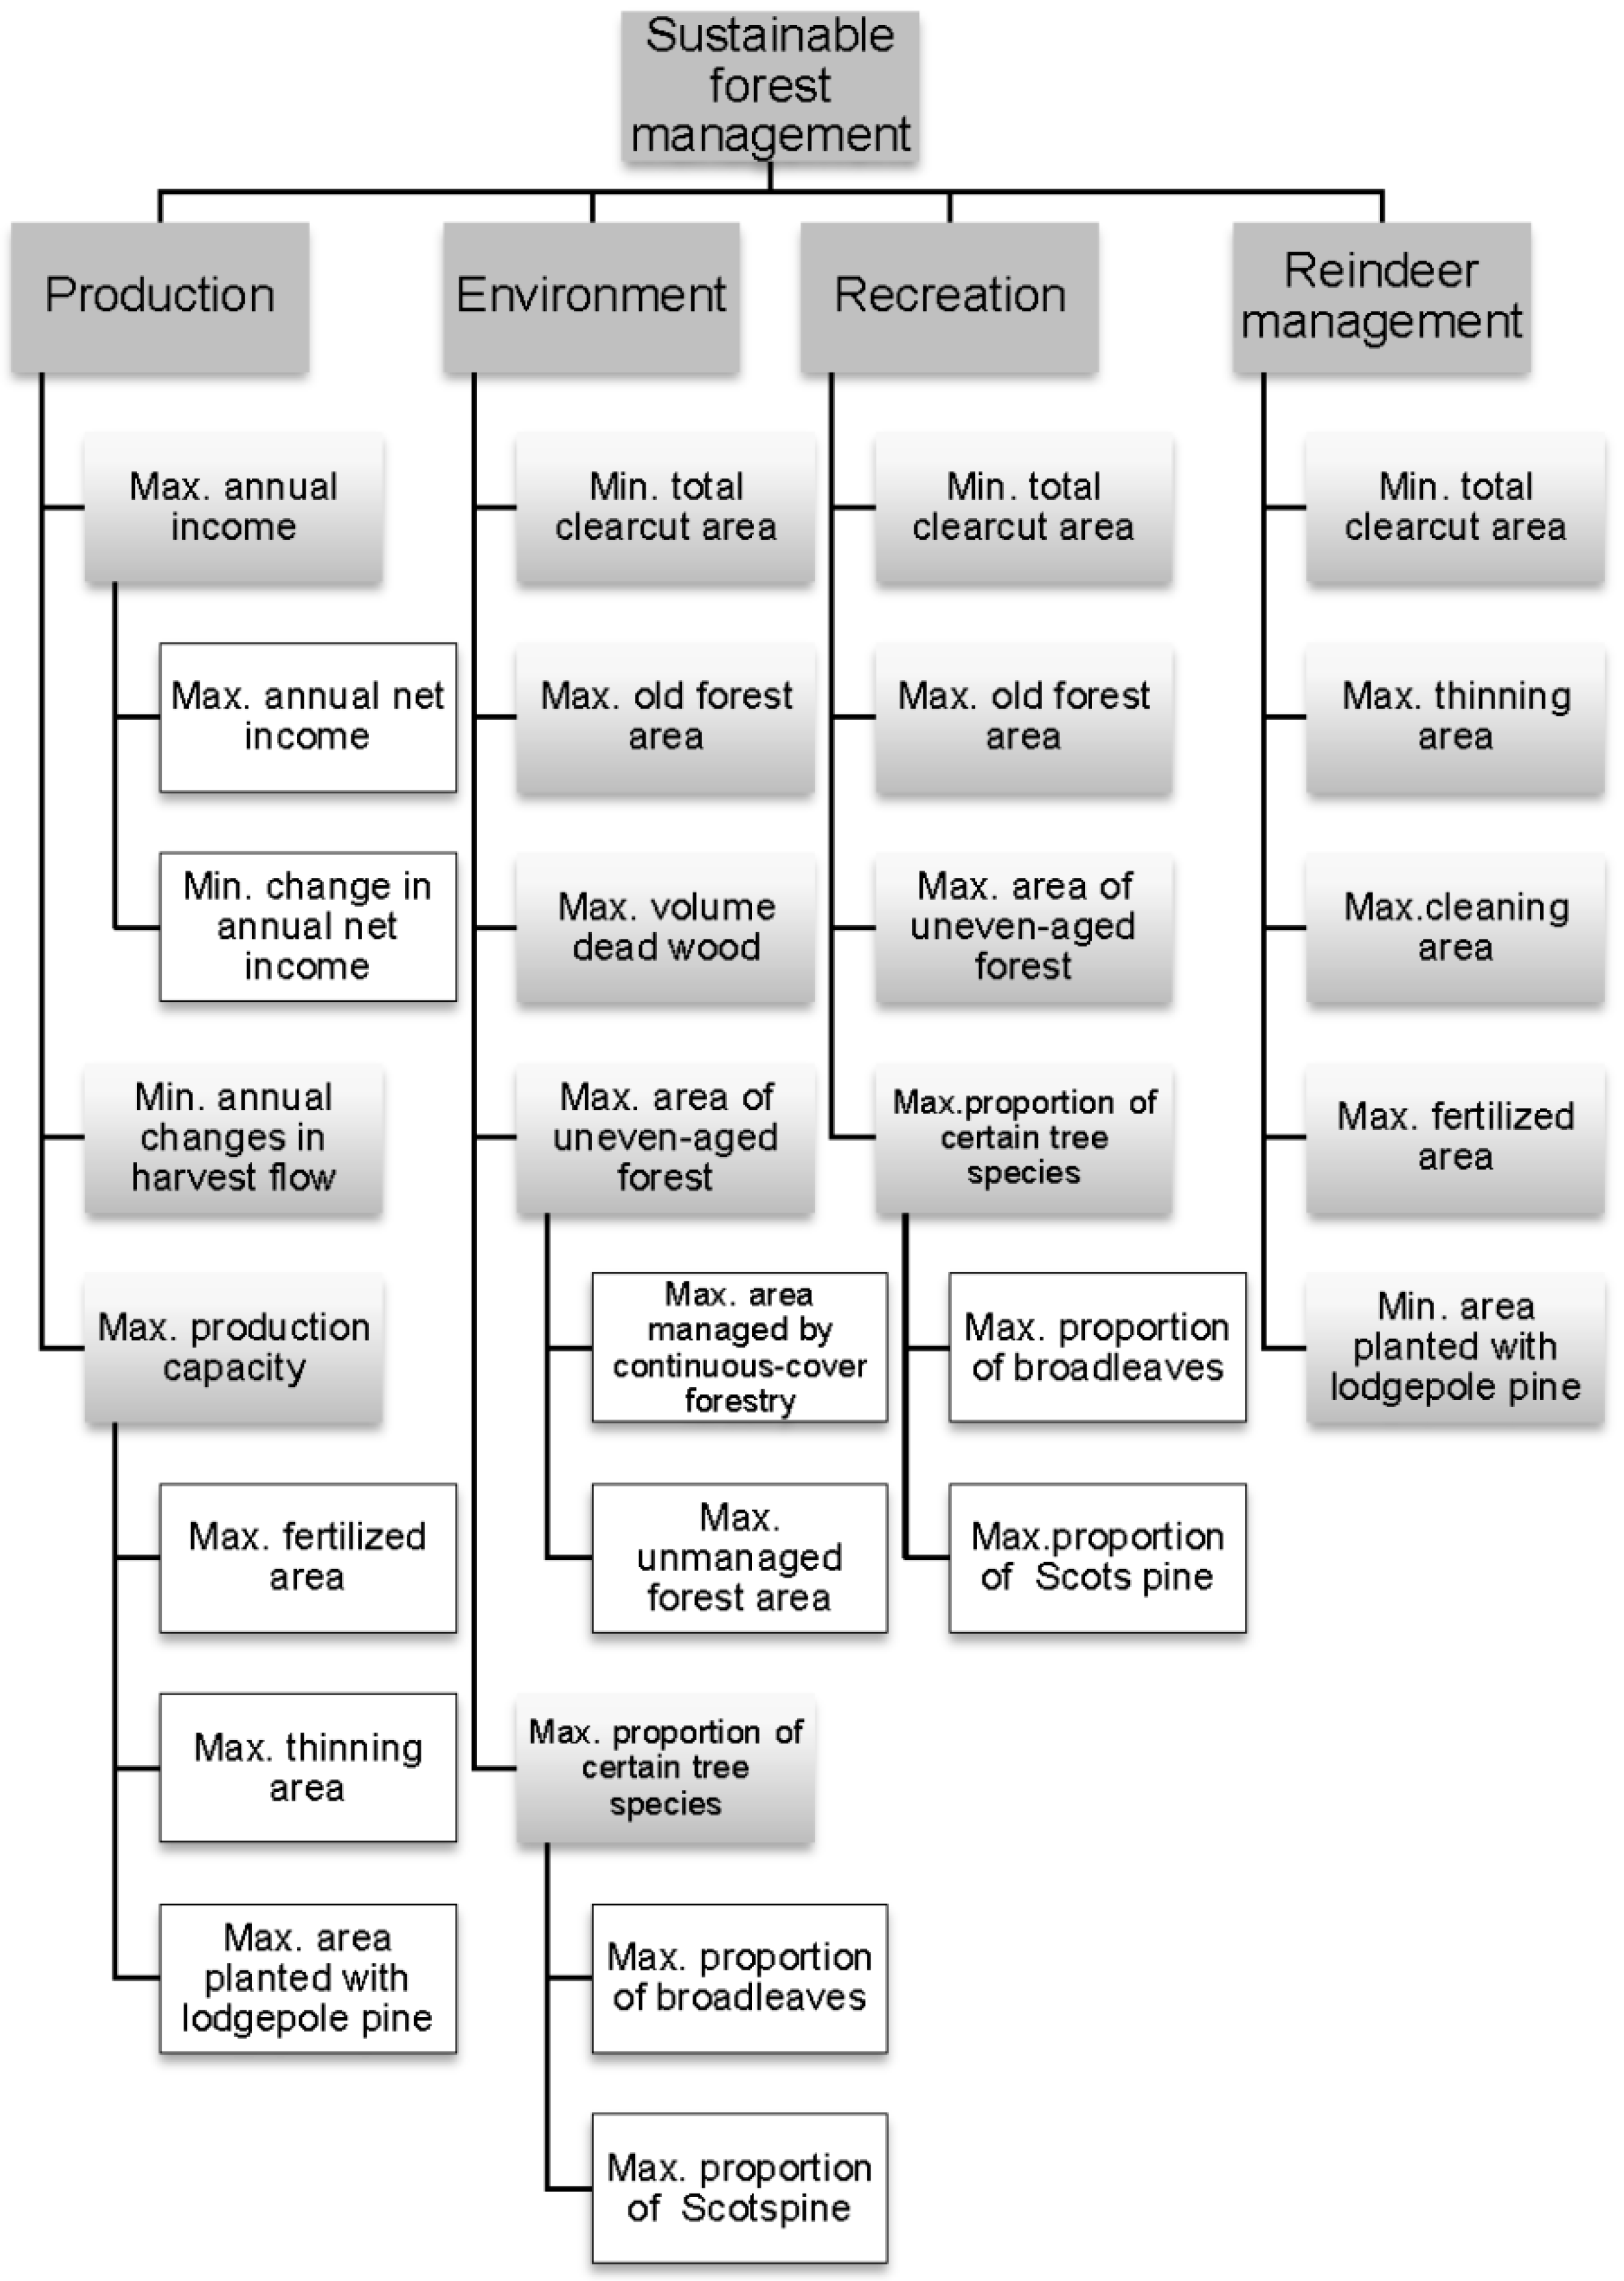
19], thematic maps of the Vilhelmina municipality forest were created to help the representatives discuss the importance of various objectives. The forest was classified into four different management zones based on data from the 2006 management plan and from geographic overview maps of the municipality: (1) a zone with no commercial cutting; (2) a zone with prolonged rotation; (3) an unmanaged zone; and (4) a zone with commercial cutting. Thus, the classifications included both spatial features, such as proximity to villages, and non-spatial features, such as the management type. The MFGIS, provided by VMF, was used to locate and highlight stands with special characteristics such as reindeer migration routes, areas with restrictions on plantation of lodgepole pine and on final fellings, borders of nature reserves, and areas close to mountains and Natura2000 areas.
In addition, five of the nine stakeholders were invited to personal meetings, during which they were given the possibility to mark areas of special concern and discuss areas they had specific knowledge of on the thematic maps. A representative from the recreation group and the representative for the reindeer management had to cancel their meetings. The scientists were not shown the maps since they did not have any local connection to Vilhelmina. The objective of the meetings was to discuss how different forest management strategies may affect the stakeholders’ objectives. Following these discussions, the forest classification was modified to contain three zones: (1) a zone with prolonged rotation and regeneration under forest cover; (2) a zone with commercial cutting; and (3) a zone with no treatment.
2.2.4. Elicitation of Preferences for the Objectives
In this study, preference elicitation was performed based on the AHP method (
Section 2.1.). To reduce the risk of biased judgments each stakeholder compared only objectives relevant to his or her interests [
15]. Moreover, the five people with local attachments to Vilhelmina were asked to state their preferences at the personal meeting when thematic maps were presented (
Section 2.2.3.). The three recreation representatives stated their preferences as a group. As the reindeer representative was not able to attend the personal meeting he/she demonstrated his/her preferences through a questionnaire. One of the recreation representatives had to resign from the study due to a heavy workload following a local storm and was unable to state his/her preferences. Both scientists stated their preferences at separate personal meetings. All of the stakeholders, except the reindeer representative who filled in a questionnaire, conducted the AHP assignment in the Heureka PlanEval software [
20]. However, it should be noted that the fundamental scale in PlanEval that the representatives used did not include the intermediate values shown in
Table 1.
The weights given to various objectives and attributes by the four different interest groups as well as the corresponding CR values are shown in
Table 2,
Table 3,
Table 4 and
Table 5. A representative of the environment interest group, environmentalist 1 (E1), had a CR higher than 0.26 and due to this apparent inconsistency the weights set by this individual were not aggregated with the weights set by environmentalist 2 (E2) (
Table 3) or used in the ranking of alternatives during step 5 of the MCDA. The weights for the recreation objectives were assigned by both a single individual, recreationist 1 (R1), and a group consisting of three individuals, hereafter called the group of recreationists (GoR). Their weight allocations were aggregated using a weighted arithmetic mean, with a contribution of 0.33 by R1 (25%) and a contribution of 0.66 by GoR (75%) (
Table 4).
2.2.5. Generation of Alternatives
A set of alternative long-term forest management plans, each with a time horizon of 100 years divided into 20 five-year periods, were created with the Heureka PlanWise software (Version 1.9.8, Swedish University of Agricultural Sciences, Umeå, Sweden) [
3]. In Heureka plans are created in two steps: management simulation and alternative selection. During management simulation various management actions (
i.e., treatment schedules) are simulated for each forest stand over the entire time horizon. In this way each stand has multiple possible development trajectories for the time horizon. The next step is alternative selection, which use Heureka’s built-in optimization tool to identify combinations of actions that will fulfill the specified objectives and constraints.
In this study, the forest was first divided into seven zones based on the three zones identified during the interviews with stakeholders and four additional zones that represented stands that should be handled with special concern during the simulations. Next, forest management simulations were performed for each stand in Heureka, and the settings were chosen based on which zone the stand was in. Three runs of simulations with different management settings were performed and each simulation included up to 100 alternative treatment schedules for each stand. The optimization module in PlanWise then produced 27 different management plans by applying various combinations of different objectives and constraints (see
Table A1). The combinations were chosen so that the plans would represent compromises of all the objectives rather than having a clear orientation towards a certain objective. The chosen management plans and their performance in terms of each attribute are presented in
Table A2 and
Table A3.
2.2.6. Ranking of Alternatives
The plans were ranked with TOPSIS, using the objective weights set by AHP of the MCDA process. The six steps of the TOPSIS process were performed over multiple spreadsheets in Excel (2010, Microsoft, Redmond, Washington, DC, USA). The definitions for the positive-ideal solutions, which are maximizations or minimizations of the adapted attributes, are shown in
Table 6. The negative-ideal solutions are defined as the opposite of the positive-ideal solutions—for example, if a positive-ideal solution is defined by a maximized attribute, then the negative-ideal solution is defined by a minimized attribute. Some attributes (clearcut area, old forest area, dead wood, pine trees, broadleaf, and lodgepole pine) have positive-ideal solutions defined by two measurements—a mean value and the standard deviation between periods. The standard deviation was included to account for potential fluctuations between periods. The weight given to such an attribute will be equally distributed between its definitions for positive/negative-ideal solutions. Concerning the objective “maximizing area of uneven-aged forest” for the recreation interest this has also been defined with two measurements, “maximizing the mean area managed by continuous-cover forestry” and “maximizing the mean area regenerated under shelterwood”. The weight given to this objective will be equally distributed between its definitions for positive/negative-ideal solutions. An attribute concerning income was added; “maximizing the net income in the first period”. This is not an attribute stated by the forest manager, but was added in the ranking of the plans because it was needed to make the income even over the beginning of the planning horizon in the highest ranked plans. The weight assigned to “maximizing income” was equally distributed between the three attributes. The performance of the alternative plans with respect to each attribute is shown in
Table A1.
When the TOPSIS method is used in participatory planning, Wei-guo & Hong (cited in [
21]) recommend that the process should initially be conducted separately for each interest group, resulting in four sets of ranked alternative plans representing the preferences of the four interest groups. Thus, steps 1 to 6 of TOPSIS were carried out for each interest group separately. Following this, weights were set for the interest groups and steps 2 to 6 of the TOPSIS procedure were performed. The weights define the influence of each interest group on the overall objective, sustainable forest management. In this study, three different sets of weights were applied (
Table 7). First, the four interest groups were assigned equal weights. Next, the weight for the production interest group was increased. This “production weight scheme” is based on an interpretation of the Swedish Forestry Act (SFS 1979:429) [
17], which states that production and environmental considerations (including social values) are equally important. Finally, in the “environment weight scheme” the environmental interest group was assigned an increased weight.
3. Result
The four highest ranked alternative plans, and the respective weights, for each interest group are shown in
Table 8.
The rankings of the forest management plans determined by TOPSIS when all interest groups had equal weights are shown in
Table 9. These rankings were quite similar to the rankings produced separately by the production, recreation, and reindeer management interest groups, all of which assigned quite high ranks to most of the plans ranked highly in
Table 9. However, the rankings differed strongly from those produced by the environment interest group, which ranked some of all these plans rather low.
The rankings for the forest management plans determined by TOPSIS when the production interest group had a weight of 0.5 and the three other interest groups each had a weight of (0.5/3) are shown in
Table 10. The top four forest management plans remain the same as when each interest group had an even weight, but the order of these plans has changed. When the rankings determined for this weighting scheme were compared to the rankings calculated for each interest group separately they were similar to the production, recreation, and reindeer management interest group rankings. In contrast, the highly ranked plans are not included in the top plan alternatives when the environment interest group is looked at separately.
The rankings for the forest management plans determined by TOPSIS when the environment interest group had a weight of 0.5 and the three other interest groups each had a weight of (0.5/3) are shown in
Table 11. When the highest ranked plans from this weighting scheme were compared to the rankings based on each interest group separately there were some similarities, but the interest groups did not include all of the best plans in their specific ranking orders.
4. Discussion
Traditionally, Swedish forestry has focused on the economic aspect of timber production as a source of income and jobs. However, forests are now considered valuable also as a provider of other ecosystem services such as water quality and recreation for an increasingly urbanized population. Taking all these values into account creates a complex problem. This study presents a combination of two MCDA methods, AHP and TOPSIS, for handling situations with several stakeholders and many conflicting objectives. The combined MCDA approach was used for ranking a set of long-term management plans with consideration to multiple objectives for forested land belonging to Vilhelmina municipality. In general, the results show that the proposed method facilitates the evaluation of a large number of management plans and keeps the process comprehensible for stakeholders. An alternative to using TOPSIS would have been to use continuous MCDA methods such as Goal Programming and Pareto frontier methods. However, a drawback with those methods is that it may be difficult to formulate and include objectives like fragmentation measures and other spatial objectives in the optimization model, which is possible with TOPSIS.
The results also showed how the prioritization of specific objectives and attributes in forest management plans can have varying impacts on the state of the forests in the future. It was possible to find forest management plans that fulfilled the objectives of each interest group to some extent, but as these objectives are clearly conflicting there had to be trade-offs. For example, fulfilling the objectives of the recreation interest group will negatively affect the objectives of production and environment interest groups, shown through an increase in forest management costs and a loss of natural value, respectively. The objectives of the environment interest group seemed to be least compatible with the preferences of the other groups, yet must still be taken into account in long-term forest management. This difference in objectives may be due to the other three groups sharing certain objectives. For example, the production objective of stand cleaning and thinning promotes the specific objectives of reindeer herding and recreation interest groups. However, these groups also have clear differences in objectives, shown in the minimum annual required rate of return of SEK 1 million for the forest management. To reach this production value and take into account social and environmental aspects, there needs to be increased fertilization and planting of lodgepole pine, actions which will detract from the objectives of both the recreation and reindeer herding interest groups.
The TOPSIS methodology was adapted to a decision process involving several stakeholders using an approach suggested by Wei-guo & Hong (cited in [
21]). This approach was easy to implement and had clear advantages, since the interest group representatives did not need to judge how well various management plans fulfill their objectives. As the stakeholders used AHP for preference elicitation a broad understanding of how different forest management strategies might affect their objectives was not required. Furthermore, we chose to combine AHP with TOPSIS because if only AHP had been used for evaluating management plans then the stakeholders would have been presented with a relatively small number of alternatives, which limits the likelihood of finding the optimal plan [
9]. Further, in this study three different sets of weights were applied for describing the influence of the interest groups in the evaluation. These weights were selected to reflect different interpretations of how sustainable forest management could be implemented. Another possibility could have been to let the stakeholders or forest owner make pair-wise evaluations between the different interest groups.
The results from the case study are promising, but there are some issues relating to the method that need be discussed in order to provide guidance for future implementation. First, even though a large number on management plans can be evaluated using TOPSIS, in real-world case studies, care has to be taken in the generation of alternative plans and the process may even have to be iterated to generate a second set of plans. As this study shows, objectives may be unrealistic in the sense that they may be met but only at great expense in terms of other objectives. This may only be apparent when the final rankings are produced and sensitivity analysis is carried out for a first set of plans. For instance, the highest ranked management plan for the production interest group was MP27. In MP27, the economic goal of 1 million SEK set by Vilhelmina municipality will not be reached during the first ten periods. Some plans resulted in a net income of at least 1 million SEK per year as early as in the third period, but then there was no income at all in the first two periods. This indicates that the goal of 1 million SEK per year should be reconsidered and that other management plans should be created based on a more realistic target value.
The temporal dimension is another problem in many situations, as it adds further complexity to the evaluation of long-term forest management plans. Ideally, the values of attributes should be assessed over time rather than as a single value for the entire time horizon. In this study, some attributes were expressed as mean values over the planning horizon. However, the mean does not indicate how the value is changing over time, so that there may be large fluctuations or a decreasing trend over time and the mean may still be relatively high. The formulation as mean was used for attributes of the production and reindeer herding objectives which was suitable in this case because there were no large fluctuations of trends. In order to detect fluctuations of trends, some attributes were measured as mean values combined with standard deviations between periods. This showed, for example, that the volume of old forest was decreasing in all management plans and that there were rather similar fluctuations in the plans, which indicates that new management plans based on other settings should be generated if this trend or the fluctuations are to be avoided. In addition to the temporal dimension, also the spatial dimensions of objectives should be measured by the attributes. However, in this study spatial relationships were not taken into account (e.g., the specific location of old forest at a certain time). Since different geographical areas may be of special concern for different interest groups, the spatial dimension could be important for some attributes. As a result, further studies could investigate if it might be more meaningful for some stakeholders to focus on and have their interest weigh more in those areas than in others.
In general, a participatory MCDA process could be quite demanding in terms of time, both for the planners and stakeholders. In this study the combination of AHP and TOPSIS only required one personal meeting and no discussions between the interest groups were scheduled. However, these limits on stakeholder interactions and meetings may have affected the data, as several interviews have been shown to provide better data than only one [
22]. Additionally, as the interest groups did not meet to communicate with one another they could not increase their awareness and understanding for each other’s opinions, which is one of the most positive results of the participatory planning process. When implementing this approach more opportunities for interactions between stakeholders should therefore be considered.
Finally, a certain degree of inconsistency may have to be accepted in the AHP preference elicitation process since the pair-wise evaluation could be demanding, especially if the number of objectives is large. In this study, an upper limit for CR was set at 26%, even though Saaty [
6] recommends a maximum CR of 10%. Previous participatory forest planning cases have also allowed a CR above 20% (e.g., [
9,
19]). We allowed a CR of 26% because certain stakeholders did not have specific knowledge of forestry and this introduced more uncertainty and a larger margin of error. In this study, Heureka PlanEval was used for the AHP procedure in most of the interviews. Thus, CRs were available while representatives stated their preferences. However, we only asked the representatives to reconsider the judgments with the most obvious inconsistencies. It would have been time-consuming for the representatives to reconsider all of their judgments and this could have introduced further uncertainty to the results.


