1. Introduction
Cultural heritage is a very important component of human history and identity but is increasingly threatened by various natural hazards associated with climate change such as extreme weather events and related hazards, e.g., wildfires, floods, and windstorms. Wildfires constitute a severe threat to cultural heritage sites. Extreme weather events and their associated hazards in the Mediterranean basin are predicted to become more frequent and damaging under all proposed scenarios of climate change [
1].
The wildfire threat to cultural heritage sites is particularly important in southern European countries where the majority of cultural heritage and archaeological sites are covered with vegetation or situated close to forests and other flammable vegetation, and therefore are exposed to high wildfire hazard. It is assumed that climate change will worsen the situation in the near future. The increase in seasonal temperatures has already resulted in extended droughts and an increase in the area burned by wildfires. Wildfires may become even more disastrous for many cultural heritage sites that are already threatened, and may also threaten other sites that historically—before the onset of climate change—were less prone to fire [
2,
3,
4]. In fact, reports of damages caused by wildfires on historical sites are becoming more frequent and alarming. One example is the wildfire that threatened Ancient Olympia in 2007. Olympia, the birthplace of the Olympic Games and a UNESCO World Heritage Property, bears the remains of the ancient stadium, temples, a museum, and administrative buildings. The wildfire almost entered the site, reaching a historic pine-covered hilltop above the stadium. Various wildfire events have threatened Natural UNESCO World Heritage Properties in the past, such as Garajonay National Park (Canary Islands, Spain), Nea Moni Monastery (Chios Island, Greece), and Laurisilva (Madeira Island, Portugal). However, not only natural heritage sites are fire-prone. Cultural and mixed sites (
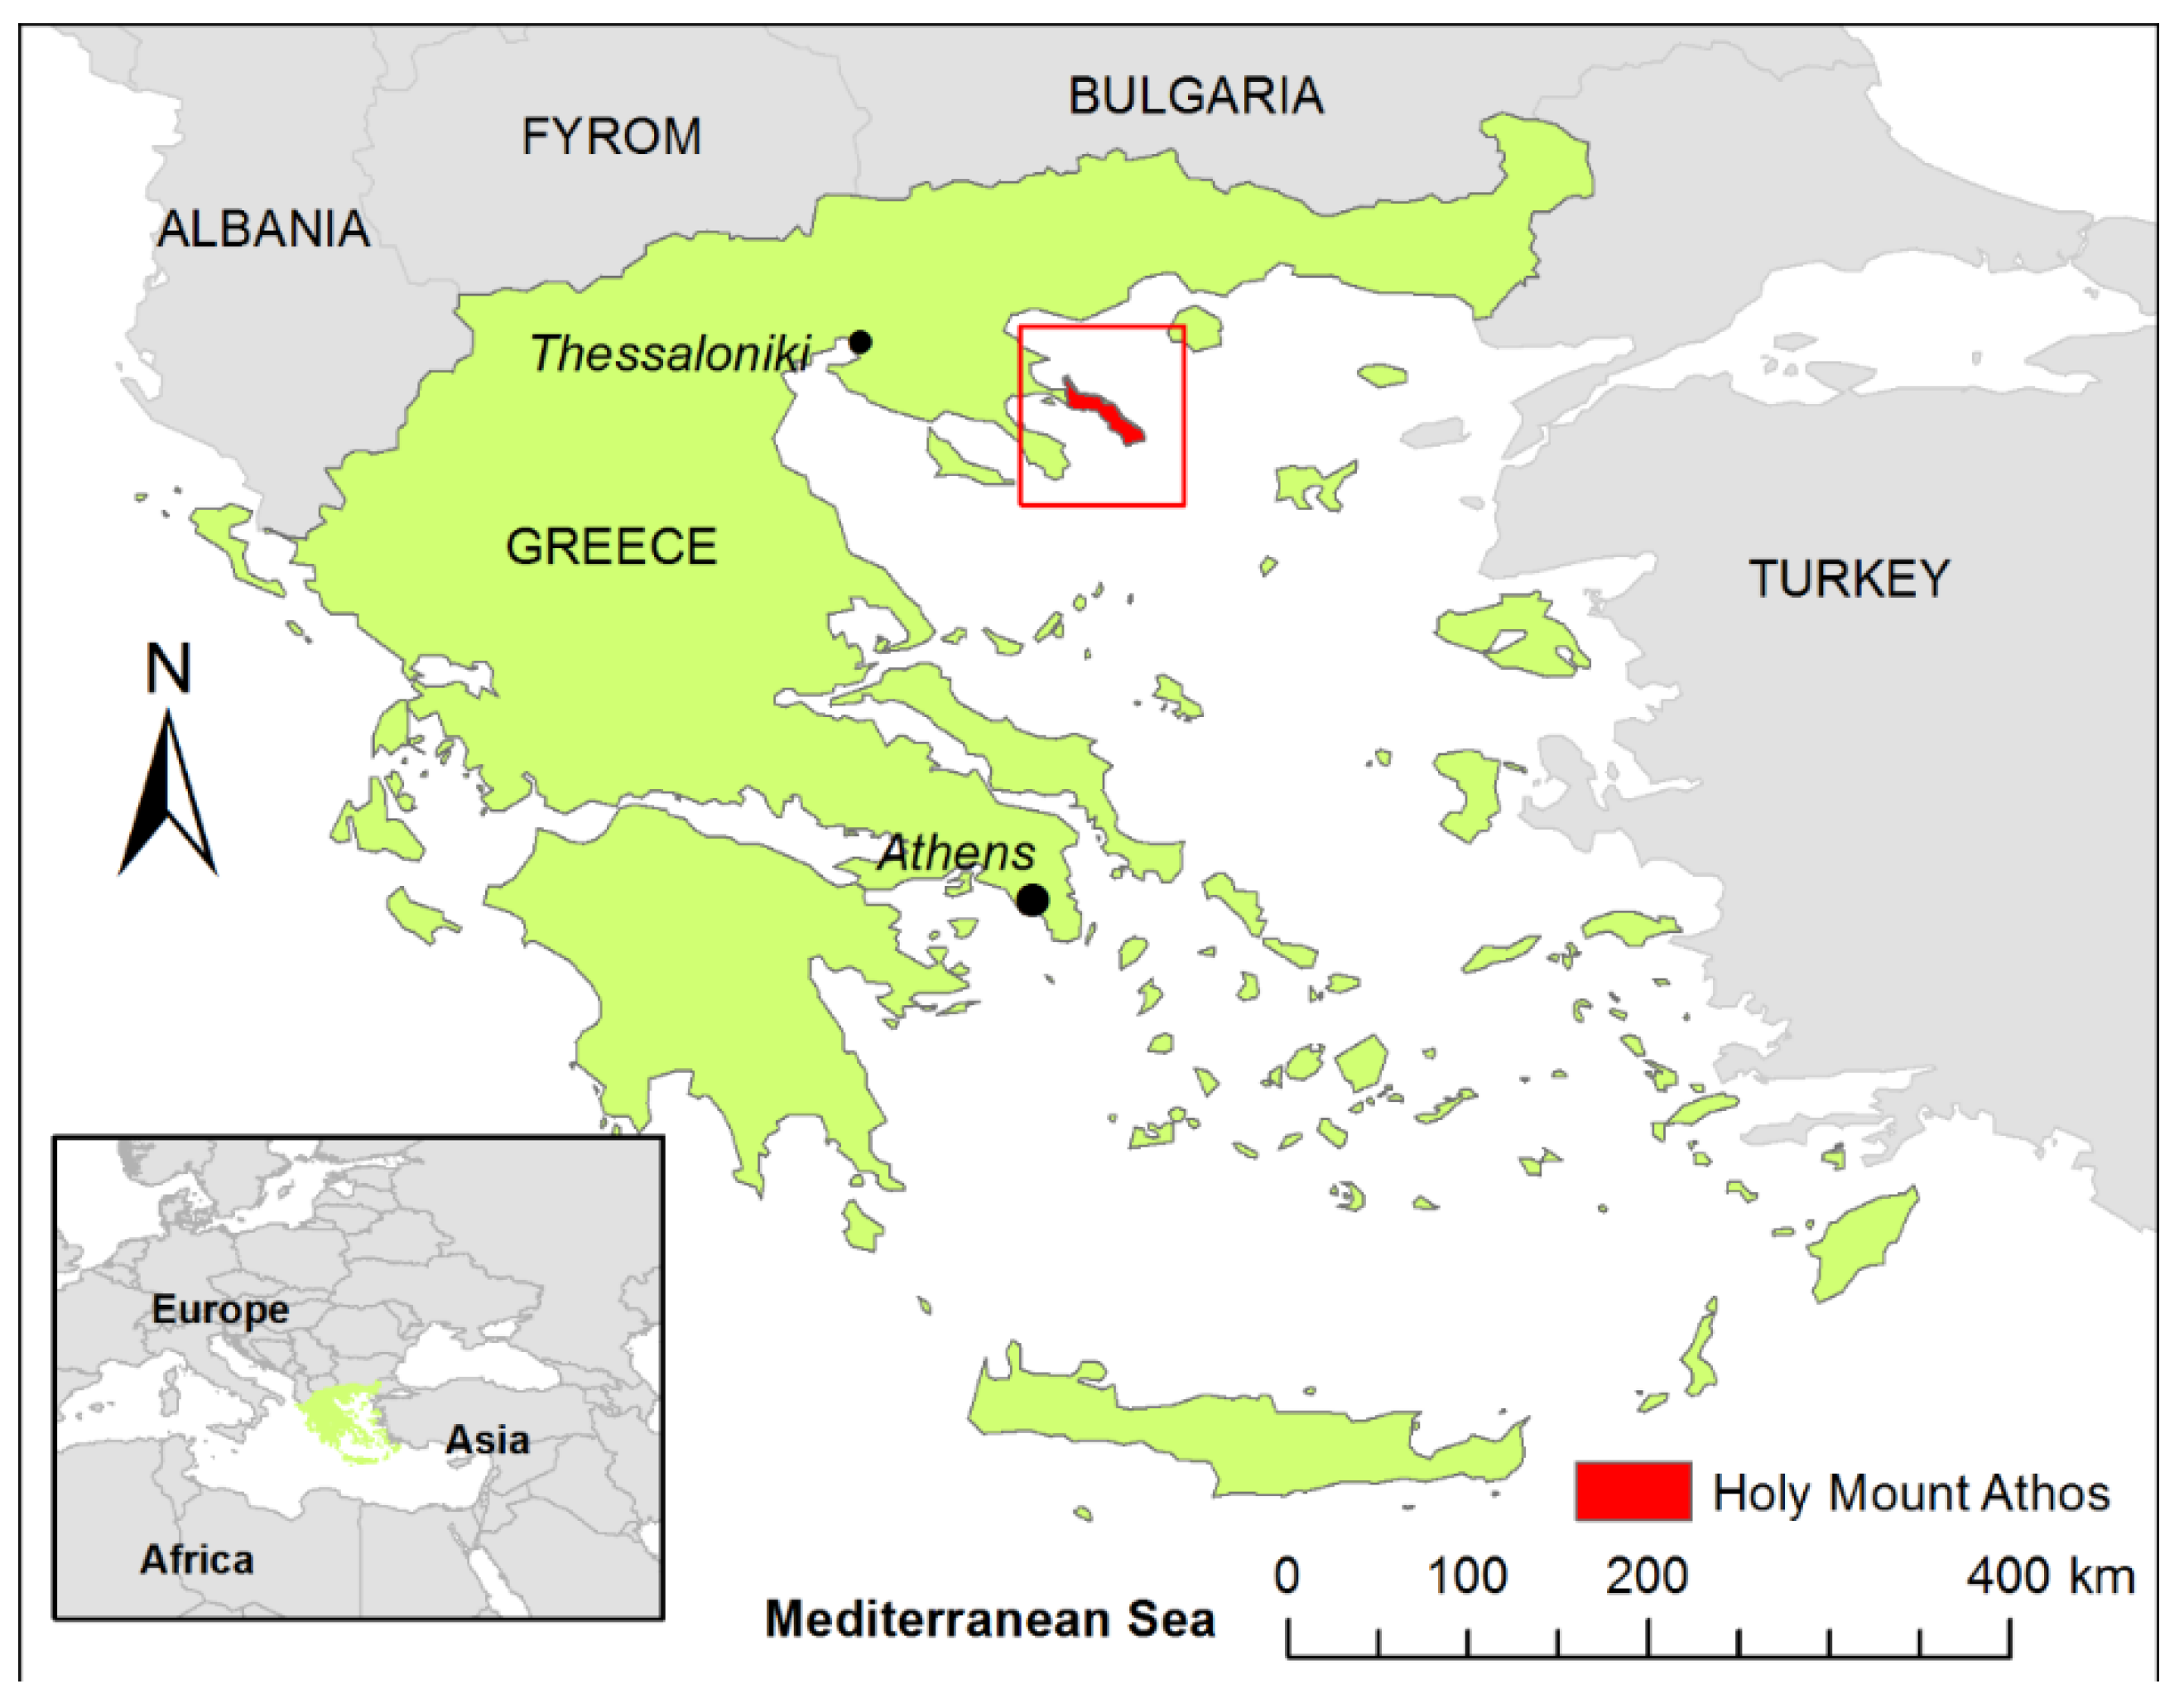
i.e., sites with a particularly significant combination of cultural and natural features) such as Mount Athos in Greece and the Historic Quarters of the city of Valparaiso in Chile, which are embedded in or surrounded by natural vegetation, have been threatened by wildfires, whether natural or human-ignited. In August 2012, during a major wildfire that threatened the Holy Mount of Athos, the Director-General of UNESCO expressed her deep concern over the impact of wildfires on World Heritage Sites in Southern Europe, indicating that “these catastrophic fires highlight the fragility of protected sites and the importance of their conservation” [
5].
Wildfire risk is seen as a combination of likelihood, intensity, and effects [
6]. Advances in fire risk assessment systems have resulted largely from improvements in software, systems integration, data availability, GIS, and simulation techniques [
7,
8]. Computer models can replicate spatially explicit fire growth through heterogeneous fuels and map fire behavior characteristics across large landscapes [
9]. Geospatial data on important social and ecological values that are potentially affected by fire are now widely available for many regions of the world. Online weather, fuel, and burn severity datasets have helped to feed large-scale modeling efforts, and all of these technological advances have facilitated the quantification of likelihood, intensity, and effects at a range of space-time scales [
10,
11].
Wildfire risk management solutions appropriate for cultural heritage sites have their own specificities, more demanding than the normal protective measures used in urban–forest interface. The valuable assets at risk, such as the historical, cultural, religious, and environmental heritage with priceless value and additionally the health and life of visitors or workers, justify targeted measures of defense against wildfires. In this sense, integrated solutions with a broad scope should be promoted to ensure the effectiveness of protection of these assets against the threat of wildfire and to decrease the wildfire risk [
12]. Consequently, fuel management considerations based on wildfire risk assessment should be incorporated into policies and management plans of cultural heritage sites threatened by wildfires.
The aim of this study was to present an example of the use of satellite remote sensing and GIS application to fire management at a local scale that will support management of cultural heritage to assess fire risk and exposure and to develop and implement fire management plans. The study resulted in: i) development of detailed site-specific fuel models in a Mediterranean study area that is suitable for fire behavior prediction; ii) production of a detailed fuel-type map with the use of high spatial and temporal resolution remote sensing data processed through an object-based classification approach; and iii) generation of accurate fire risk and exposure maps in a fragmented landscape.
3. Materials and Methods
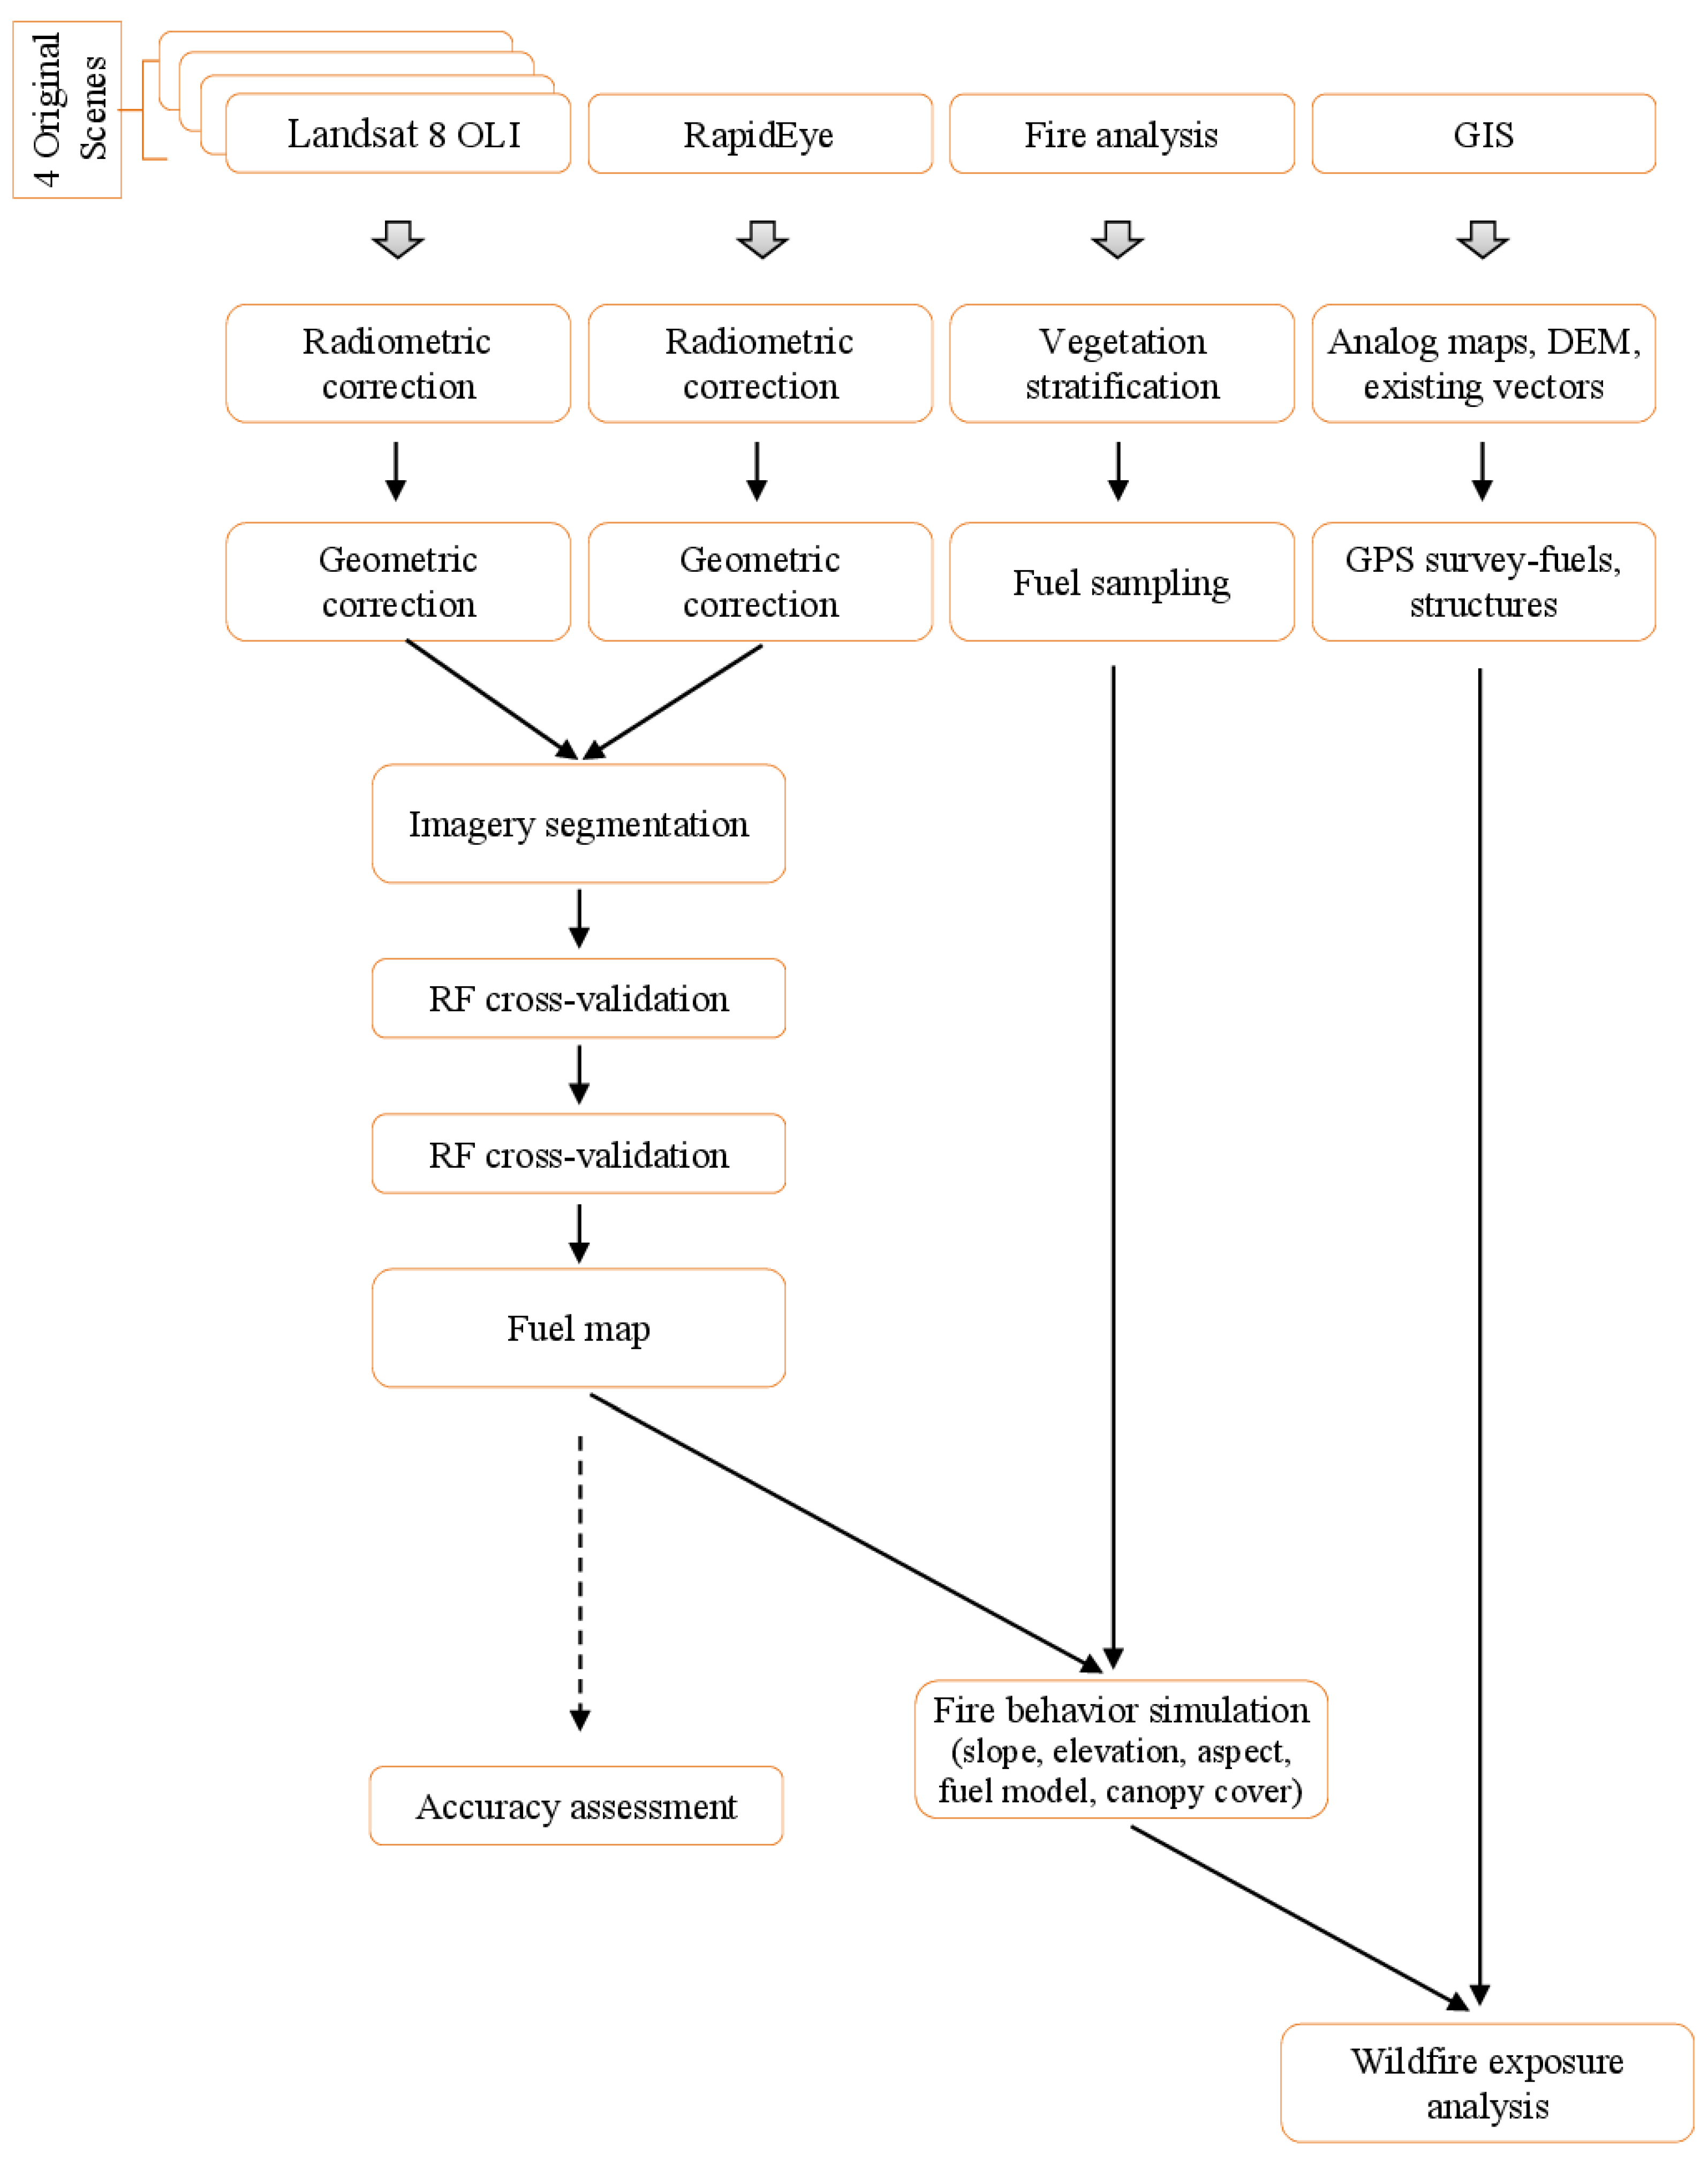
3.1. Outline of the Methodology
Field sampling over Mt. Athos was used for developing site-specific fuel models as well as for determining the classification scheme of the remote sensing dataset used in the study. The latter consisted of a high-resolution RapidEye image and four Landsat-OLI images acquired over an 18-month period. We generated a Mt. Athos fuel type map by using an object-based approach and a machine-learning algorithm. The fuel type map along with topography-related variables and meteorological parameters were used for spatially explicit fire simulations. Information regarding the location and the type of various structures distributed over this World Heritage Site was collected and organized within a GIS. Finally, a spatial wildfire risk and exposure analysis was implemented for identifying elements of cultural heritage at wildfire risk (
Figure 2).
3.2. Remote Sensing and Ancillary Data
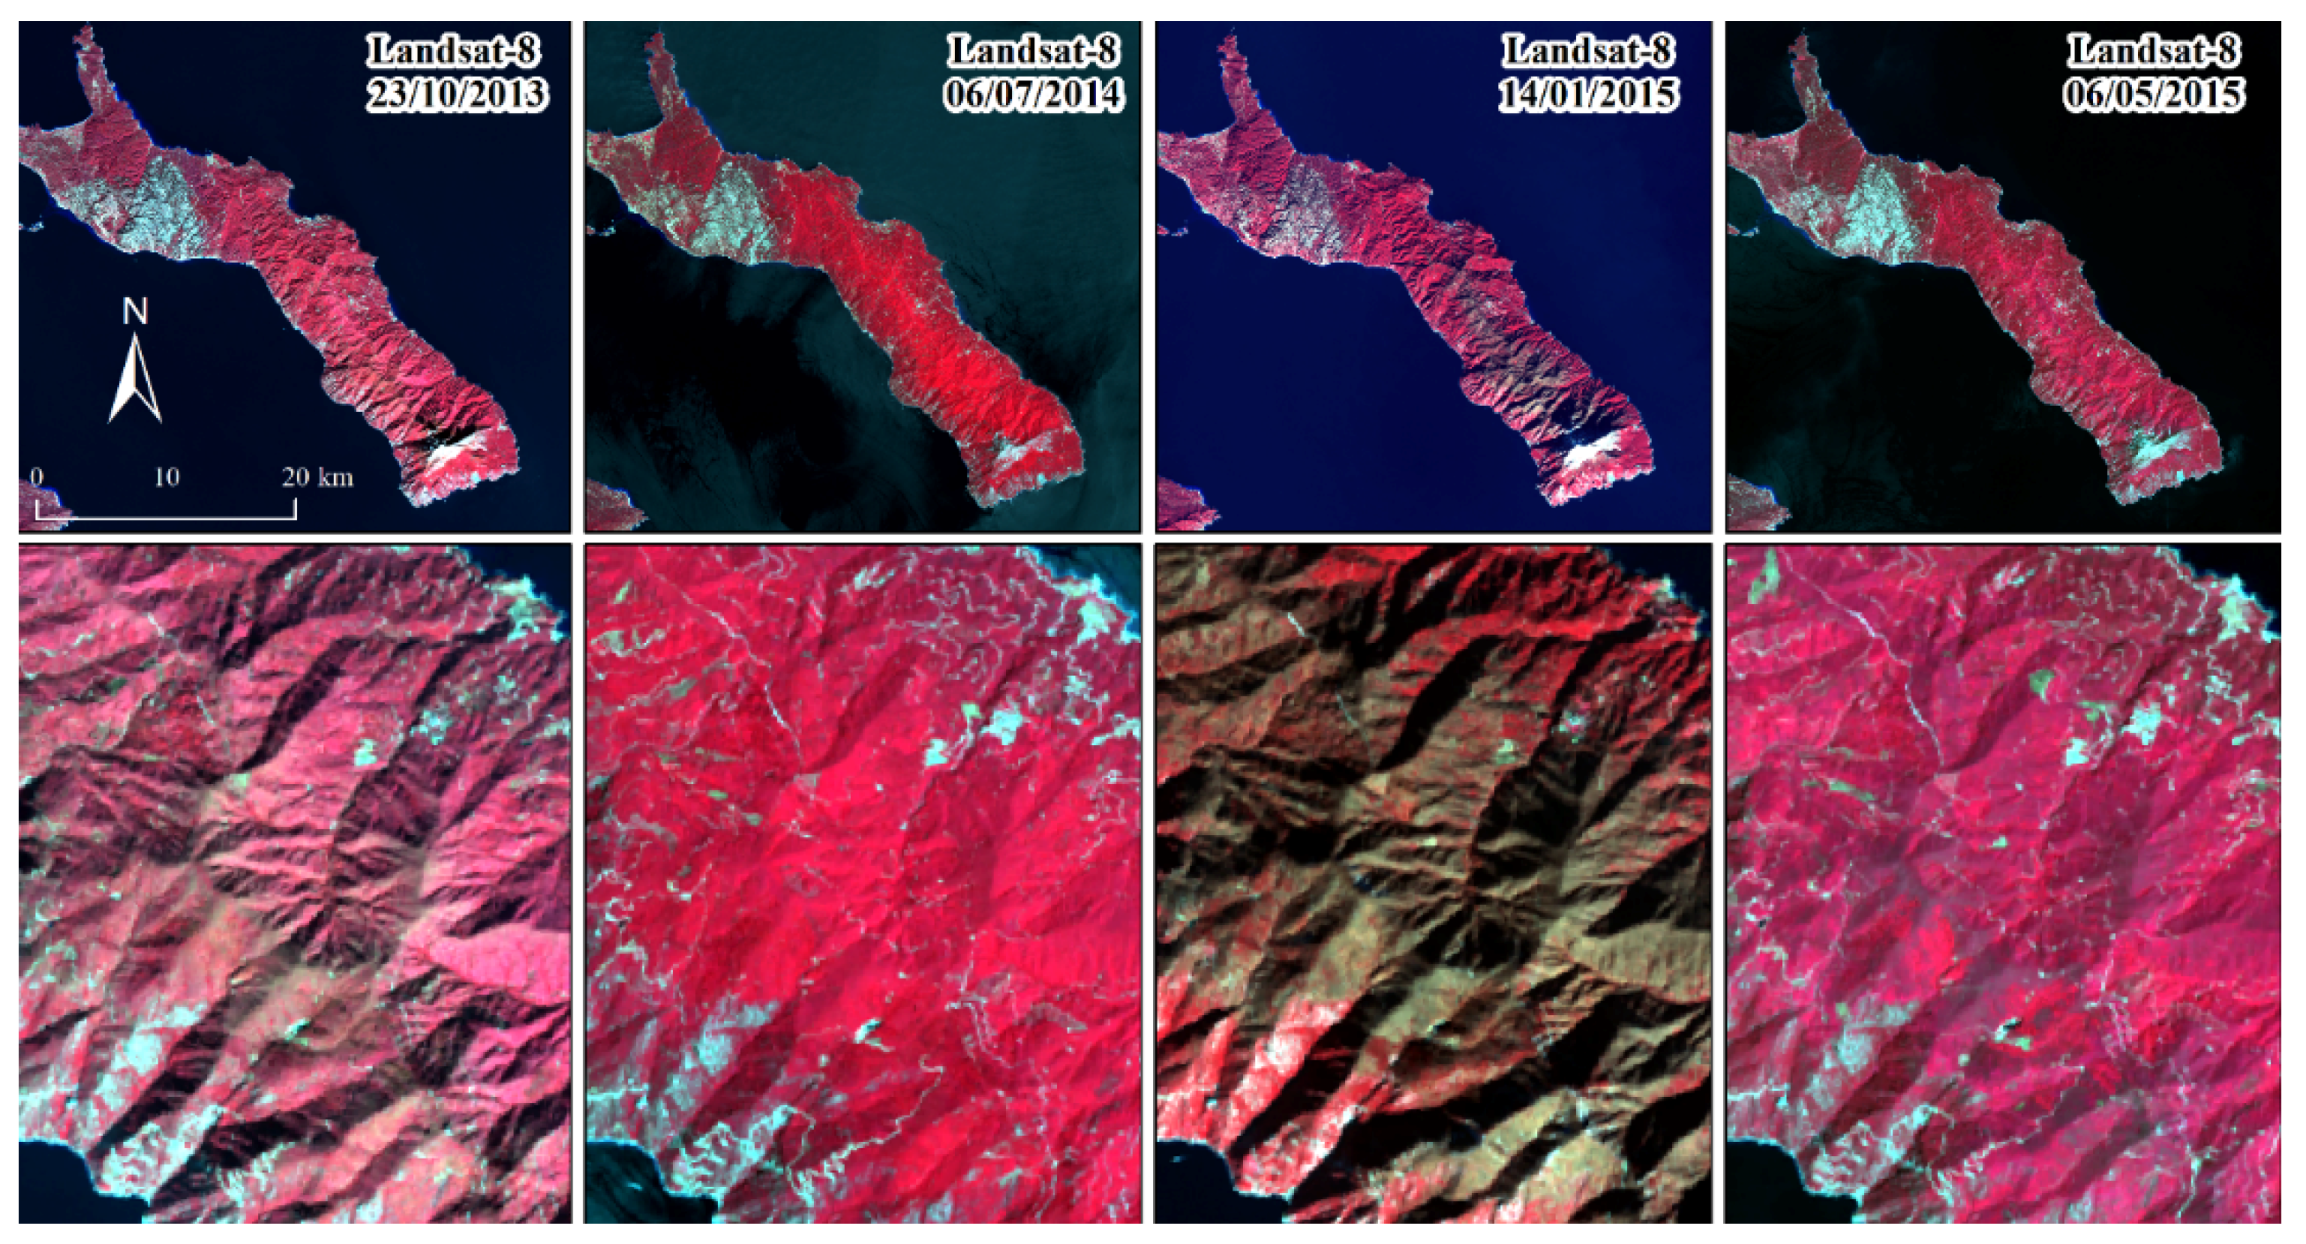
With regard to remote sensing data, a high spatial resolution RapidEye satellite image (Level 3A) acquired on May 2014, along with four images acquired from Landsat 8 Operational Land Imager (OLI) sensor (path/row 183/032), were used to extract fuel cover of Holy Mount Athos.
RapidEye represents a constellation of five mini-satellites and provides high-resolution multi-spectral imagery in five optical bands in the 400–850 nm part of the electromagnetic spectrum (blue, green, red, red-edge, near infrared) in the 12 bit dynamic range. The satellites are equally spaced in a single sun-synchronous orbit at an altitude of 630 km. The swath width is 77 km, the revisit time is 5.5 days (at nadir), and the ground sampling distance is 6.5 m (at nadir).
The Landsat 8 satellite carries a two-sensor payload, the Operational Land Imager (OLI) and the Thermal Infrared Sensor (TIRS). Compared to its predecessors, the Landsat 8 OLI sensor has a greater number of bands, including two additional reflective wavelength bands: a new shorter wavelength blue band (0.43–0.45 μm) intended for improved sensitivity to chlorophyll and other suspended materials in coastal waters and for retrieving atmospheric aerosol properties, and a new shortwave infrared band (1.36–1.39 μm) for cirrus cloud detection [
14]. Furthermore, OLI-8 has narrower spectral ranges; however, it maintains 30-m spatial resolution, as well as 16-day temporal resolution and scene size (170 km × 183 km) with push-broom design (
Figure 3).
The Digital Elevation Model (DEM) of the area was generated from digitized contour lines on a 1:50,000 topographical maps. Topographic maps (scale 1:50,000) have been provided by the Army Map Service of Greece and were used for the DEM production. Slope and aspect images were generated from the DEM, using the corresponding algorithms within GIS environment.
3.3. Satellite Image Pre-Processing
The Nearest Neighbor resampling method was applied for projecting the RapidEye image to the Greek National Geodetic System (EGSA 1987). The pre-processing of Landsat 8 images included the geo-rectification of image subsets by manual extraction from the study that were rectified based on the RapidEye imagery. The geo-rectification was done using 45 ground control points, a 5-m spacing Digital Elevation Model (DEM) of the area, and second-order polynomial coefficients. All satellite images were delivered as digital numbers (DN) at first place.
The dark object subtraction approach was applied to correct the effects caused by the solar zenith angle, solar radiance, and atmospheric scattering on the radiometric properties of pixels [
15]. One advantage of this image-based approach is that it is relatively simple to apply and does not require any
in situ measurements and atmospheric parameters. First, recorded DN values were converted to radiance at sensor
for each band of the RapidEye and Landsat images using the corresponding radiometric scale and multiplicative and additive factors respectively. Second, radiance at sensor was converted to surface reflectance by applying the following equation:
where
is the surface reflectance,
is the corresponding path radiance,
is Exo-Atmospheric solar Irradiance, D is the distance between the Earth and Sun, and θ is the sun zenith angle. The path radiance for each band was identified based on the analysis of water bodies and shades in the images.
For the Landsat 8 the ESUN values were calculated on the basis of the following formula:
where
and
is the radiance and reflectance maximum, respectively.
3.4. Surface Fuel Model Mapping
The classification of the image and fuel model delineation was carried out following an object based image analysis approach consisting of segmentation and classification procedures. To delineate individual meaningful objects, a multi-resolution segmentation algorithm was applied using the Trimble eCognition v 9.0 software. With this segmentation technique, individual pixels are perceived as the initial regions, which are sequentially merged pairwise into larger ones with the intent of minimizing the heterogeneity of the resulting objects. The segmentation process starts by having the analyst specify the layers of the image that will be used for the definition of heterogeneity. Weighting can be given either to the spectral (color) or the shape heterogeneity. The latter is decomposed to the smoothness and compactness criteria of heterogeneity.
The smoothness heterogeneity equals the ratio of the
de facto border length l and the border length b given by the bounding box of an image object parallel to the raster, while the compactness heterogeneity equals the ratio of the
de facto border length l and the square root of the number of pixels forming this image object:
A crucial unit-less threshold, the scale parameter, is determined by the user, to specify the maximum allowed increase in the resulting heterogeneity after a pairwise merge of the objects. The sequence of the merging objects, as well the size and shape of the resulting objects, are empirically determined by the user [
16]. Several empirical trials were undertaken in order to generate meaningful segments depicting small patches of similar fuel cover.
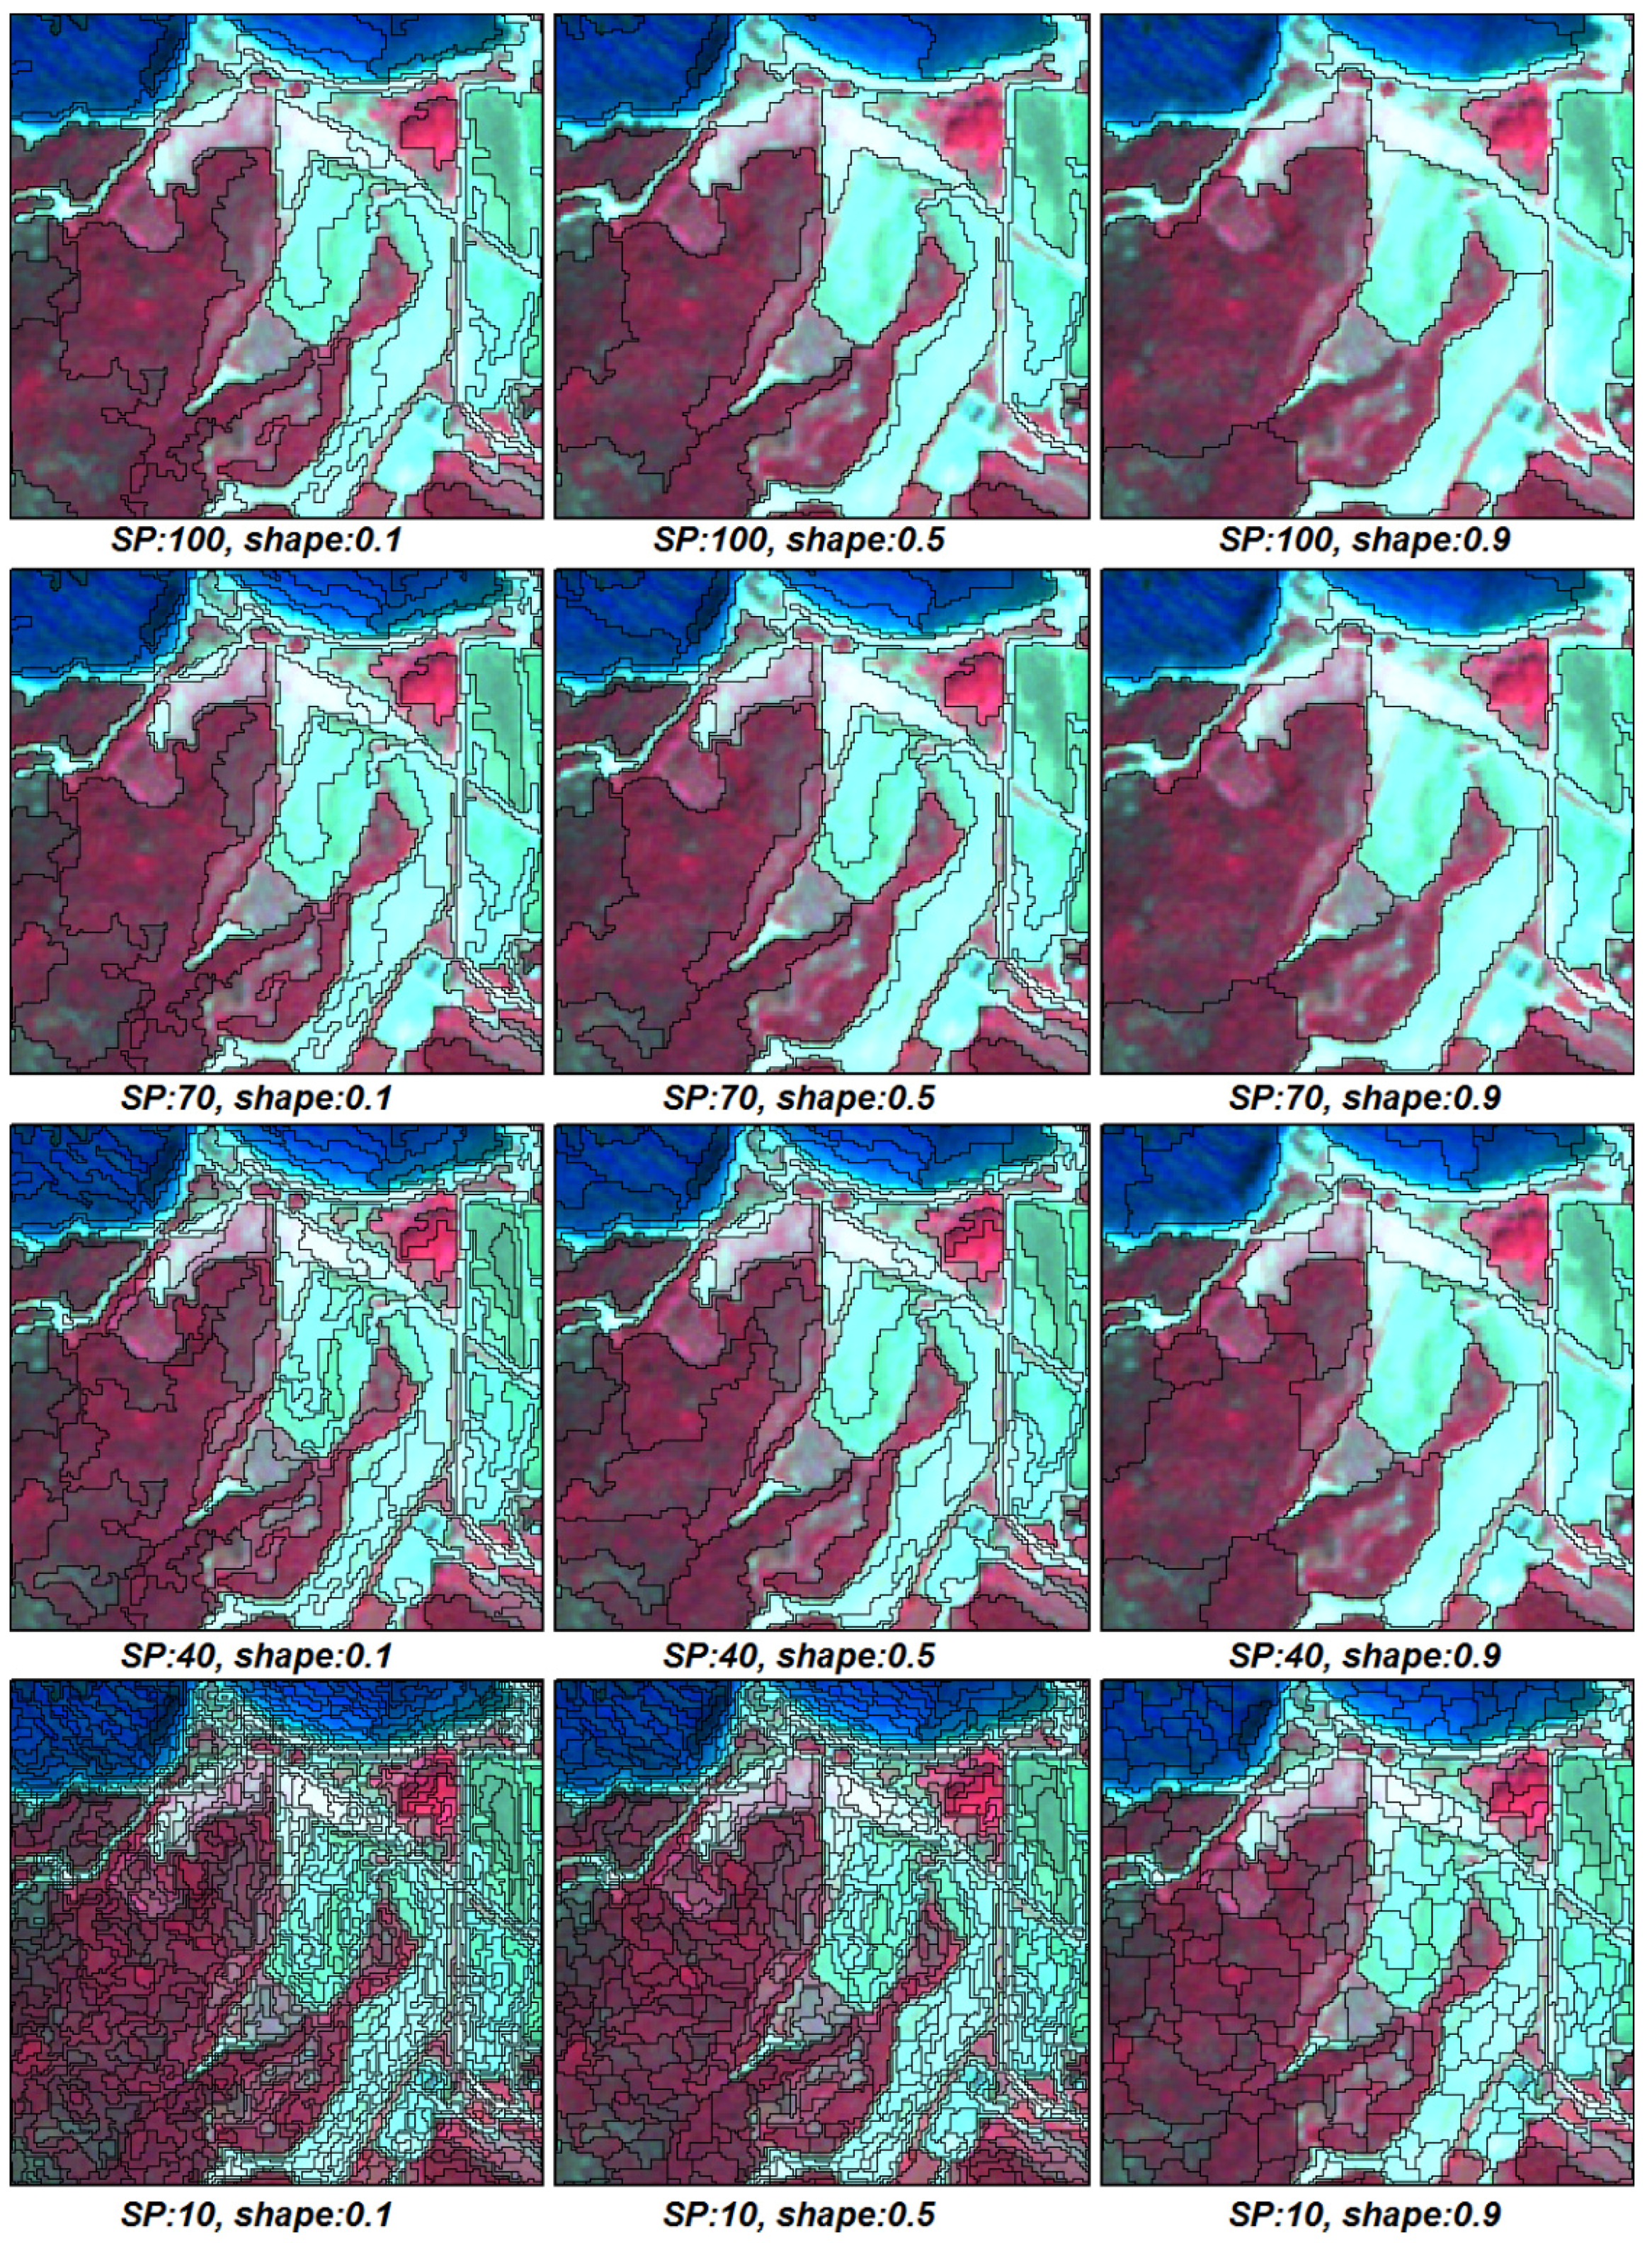
In addition, we quantitatively evaluated a range of potential image segmentation scale alternatives in order to evaluate the effect of segmentation parameters in the spatial explicit automatic prediction of the fuel classes of interest. While trial and error is the dominant paradigm for selecting segmentation parameters [
17], in several studies segmentation evaluations have been performed both qualitatively and quantitatively, based on the thematic quality of segments against reference polygons or the resulting accuracy of object-based classifications [
18]. The tested parameter settings used a scale parameter ranging from 10 to 100 in intervals of 10 and color/shape ratios of 0.1, 0.5, and 0.9, while the compactness has been kept at the default value of 0.5. In all cases we used all five bands of the RapidEye imagery.
Random Forest is a machine learning ensemble based on CART decision tree classifiers [
19]. To individualize each tree in the “forest,” the trees are grown with a random subset drawn with replacement from the original training samples, and only a defined subset of input variables is used to find the best split criteria at each node. One of its greatest strengths, in addition to its high accuracy and robustness to outliers and noise, is the calculation of different internal diagnostic indicators, such as out-of-bag error (OOB) or Feature Importance (FI). Compared to other supervised classifiers, it is not necessary to perform prior data pre-processing for validation purposes, such as splitting, as the algorithm uses its internal error estimation (OOB error).
The R-package Random Forest [
20] used in this study allows for tuning the input parameters—
i.e., the number of trees and the number of features to be drawn from at each node with respect to the OOB. For each tree, the prediction accuracy of the out-of-bag portion of the data is recorded. Then the same is done after permuting each predictor variable. The difference between the two accuracies is then averaged over all trees, and normalized by the standard error. The initial RF model was built using 1000 trees and the feature subset was defined as one third of the overall number of features.
3.5. Fuel Sampling
A fuel model is a combination of forest fuel components defined by vegetation type, volume, biomass, condition, arrangement, and location. In order to inventory fuel models, all the areas in the study site were stratified on existing vegetation maps according to the dominant vegetation type. All the stratified areas were surveyed on site and 49 locations with a size of 10 m
2 each, representing typical (“average”) fuel conditions, were selected. The surface fuel load was estimated with the Brown
et al. [
21] method for inventorying surface fuel biomass. Eleven fuel parameters were measured in each location as follows:
- 1)
The 1, 10, 100, 1000-h, and total fuel loads were measured with the transect-line method (four 30 m-long transects). The 1, 10, 100, and 1000 h fuels correspond to plant parts (branches) with diameters of 0.0–0.5, 0.6–2.5, 2.6–7.5, and >7.5 cm, respectively.
- 2)
Foliage load, litter load and depth, and shrub (up to 2.0 m in height) and herbaceous (live and dead) vegetation loads were measured in 1-m2 sampling plots with the clip-and-weigh method.
- 3)
The height of the shrub and herbaceous vegetation layers was also measured in the sampling plot.
The clip-and-weigh method was used to determine all fuel loads by size category [
21]. The percentage of the total area covered by each fuel type (shrub herbaceous, litter,
etc.) was determined with the line intercept method along fuel transects (30 m long) that were used for fuel measurements [
22]. All fuel loads (fuel weight per unit surface area) were expressed on a dry-weight basis.
3.6. Fire Simulation
In order to assess fire risk, we used a landscape fire behavior modeling approach. Simulated wildfire spread and behavior were performed with the MTT algorithm [
23] as implemented in FlamMap software [
24]. The MTT algorithm replicates fire growth according to the Huygen’s principle, where the growth and behavior of the fire edge is a vector or wave front. MTT simulations were conducted by using as input data the DEM of the area, the spatial extent of the fuel models, and the fuel parameter values of each model in the study area. The later data was used to build the raster input files for fire simulations. Canopy cover information of the forest area was extracted from satellite imagery. Heat content and surface area-to-volume ratio values for the fuel models developed were obtained by Dimitrakopoulos and Panov [
25]. MTT was used to simulate fire behavior following 30,000 random ignitions across the study area. The duration of all fires was set to 480 minutes since, according to the historical fire records, all fires in the region are suppressed within that average period [
26]. Simulated fire behavior was performed using dominant summer weather and fuel moisture conditions obtained from the historical fire occurrence data observed in the study area using the PYROSTAT software [
26]. The wind speed and wind direction for the simulation study were set at 25 km/h and NE, respectively. Wind fields for FlamMap simulations in ASCII grid format were obtained by running a mass consistent model (WindNinja) [
27], from which wind speed and direction were estimated at 6 m above vegetation height. Crowing and spotting modules in FlamMap software were not activated, since canopy fuels were not measured during field sampling. The outputs obtained for every simulation were burn probability (BP), conditional flame length (CFL), and fire size (FS). The burn probability (BP) output defines the probability of each pixel burning for twenty 0.5 m intervals of flame length (from 0 to 10 m). So, BP is the chance that a pixel will burn at a given flame length interval considering one ignition in the whole study area under the assumed fuel moisture and weather conditions [
28]. BP is defined as:
where F
xy is the number of times the pixel
xy burns, and n
xy is the number of simulated fires (30,000).
Moreover, conditional flame length (CFL) is a weighted probability of flame length given a fire occurrence and is defined as:
where F
i is the flame length (m) midpoint, and BP
i is the burn probability on the
i-th category. Conditional flame length is the average flame length given among the simulated fires that burned a given pixel and is a measure of wildfire hazard [
29].
FlamMap also generates text files containing the fire size (FS, ha) and ignition x–y coordinates for each simulated fire. These outputs were used to analyze spatial variation in fire size. Fire size (FS) refers to the average fire size (ha) for all fires that originated from a given pixel.
To measure wildfire transmission among the different residential structure categories, the Source-Sink Ratio (SSR) approach proposed by Ager
et al. [
30] was used. SSR is calculated as the ratio of fire size generated by an ignition to burn probability:
The SSR ratio measures a pixel’s wildfire contribution to the surrounding landscape (FS) relative to the frequency with which it is burned by fires that originated elsewhere (BP) or were ignited on the pixel. The SSR ratio depicts pixels that have a high burn probability but do not generate large fires from an ignition (wildfire sinks) and those that generate large fires when an ignition occurs and have low burn probability (wildfire sources). SSR ratio was calculated by using ArcFuels10, which is a streamlined fuel management planning and wildfire risk assessment system that creates a trans-scale (stand to large landscape) interface to apply various forest growth and fire behavior models within an ArcMap 10.1 GIS platform [
31].
Fire risk assessment was performed using the expected Net Value Change (eNVC) conceptual model, which assesses wildfire risk combining exposure and effects analysis [
25]. The eNVC represents in quantitative terms the potential losses and/or benefits from wildfires at individual flame lengths to specified resource values. The eNVC was estimated using the customized response function as it is embedded in ArcFuels 10 software [
31]. The response function obtained various negative values (loss) based on the flame length categories resulted by the FlamMap simulations. Fire effects represent the negative impact of fire on landscape values, such as damage to monasteries. For the purposes of this study, a response function was used that reflects the loss of monasteries from slight to strong as the fire intensity (flame length categories) increases (
Table 1).
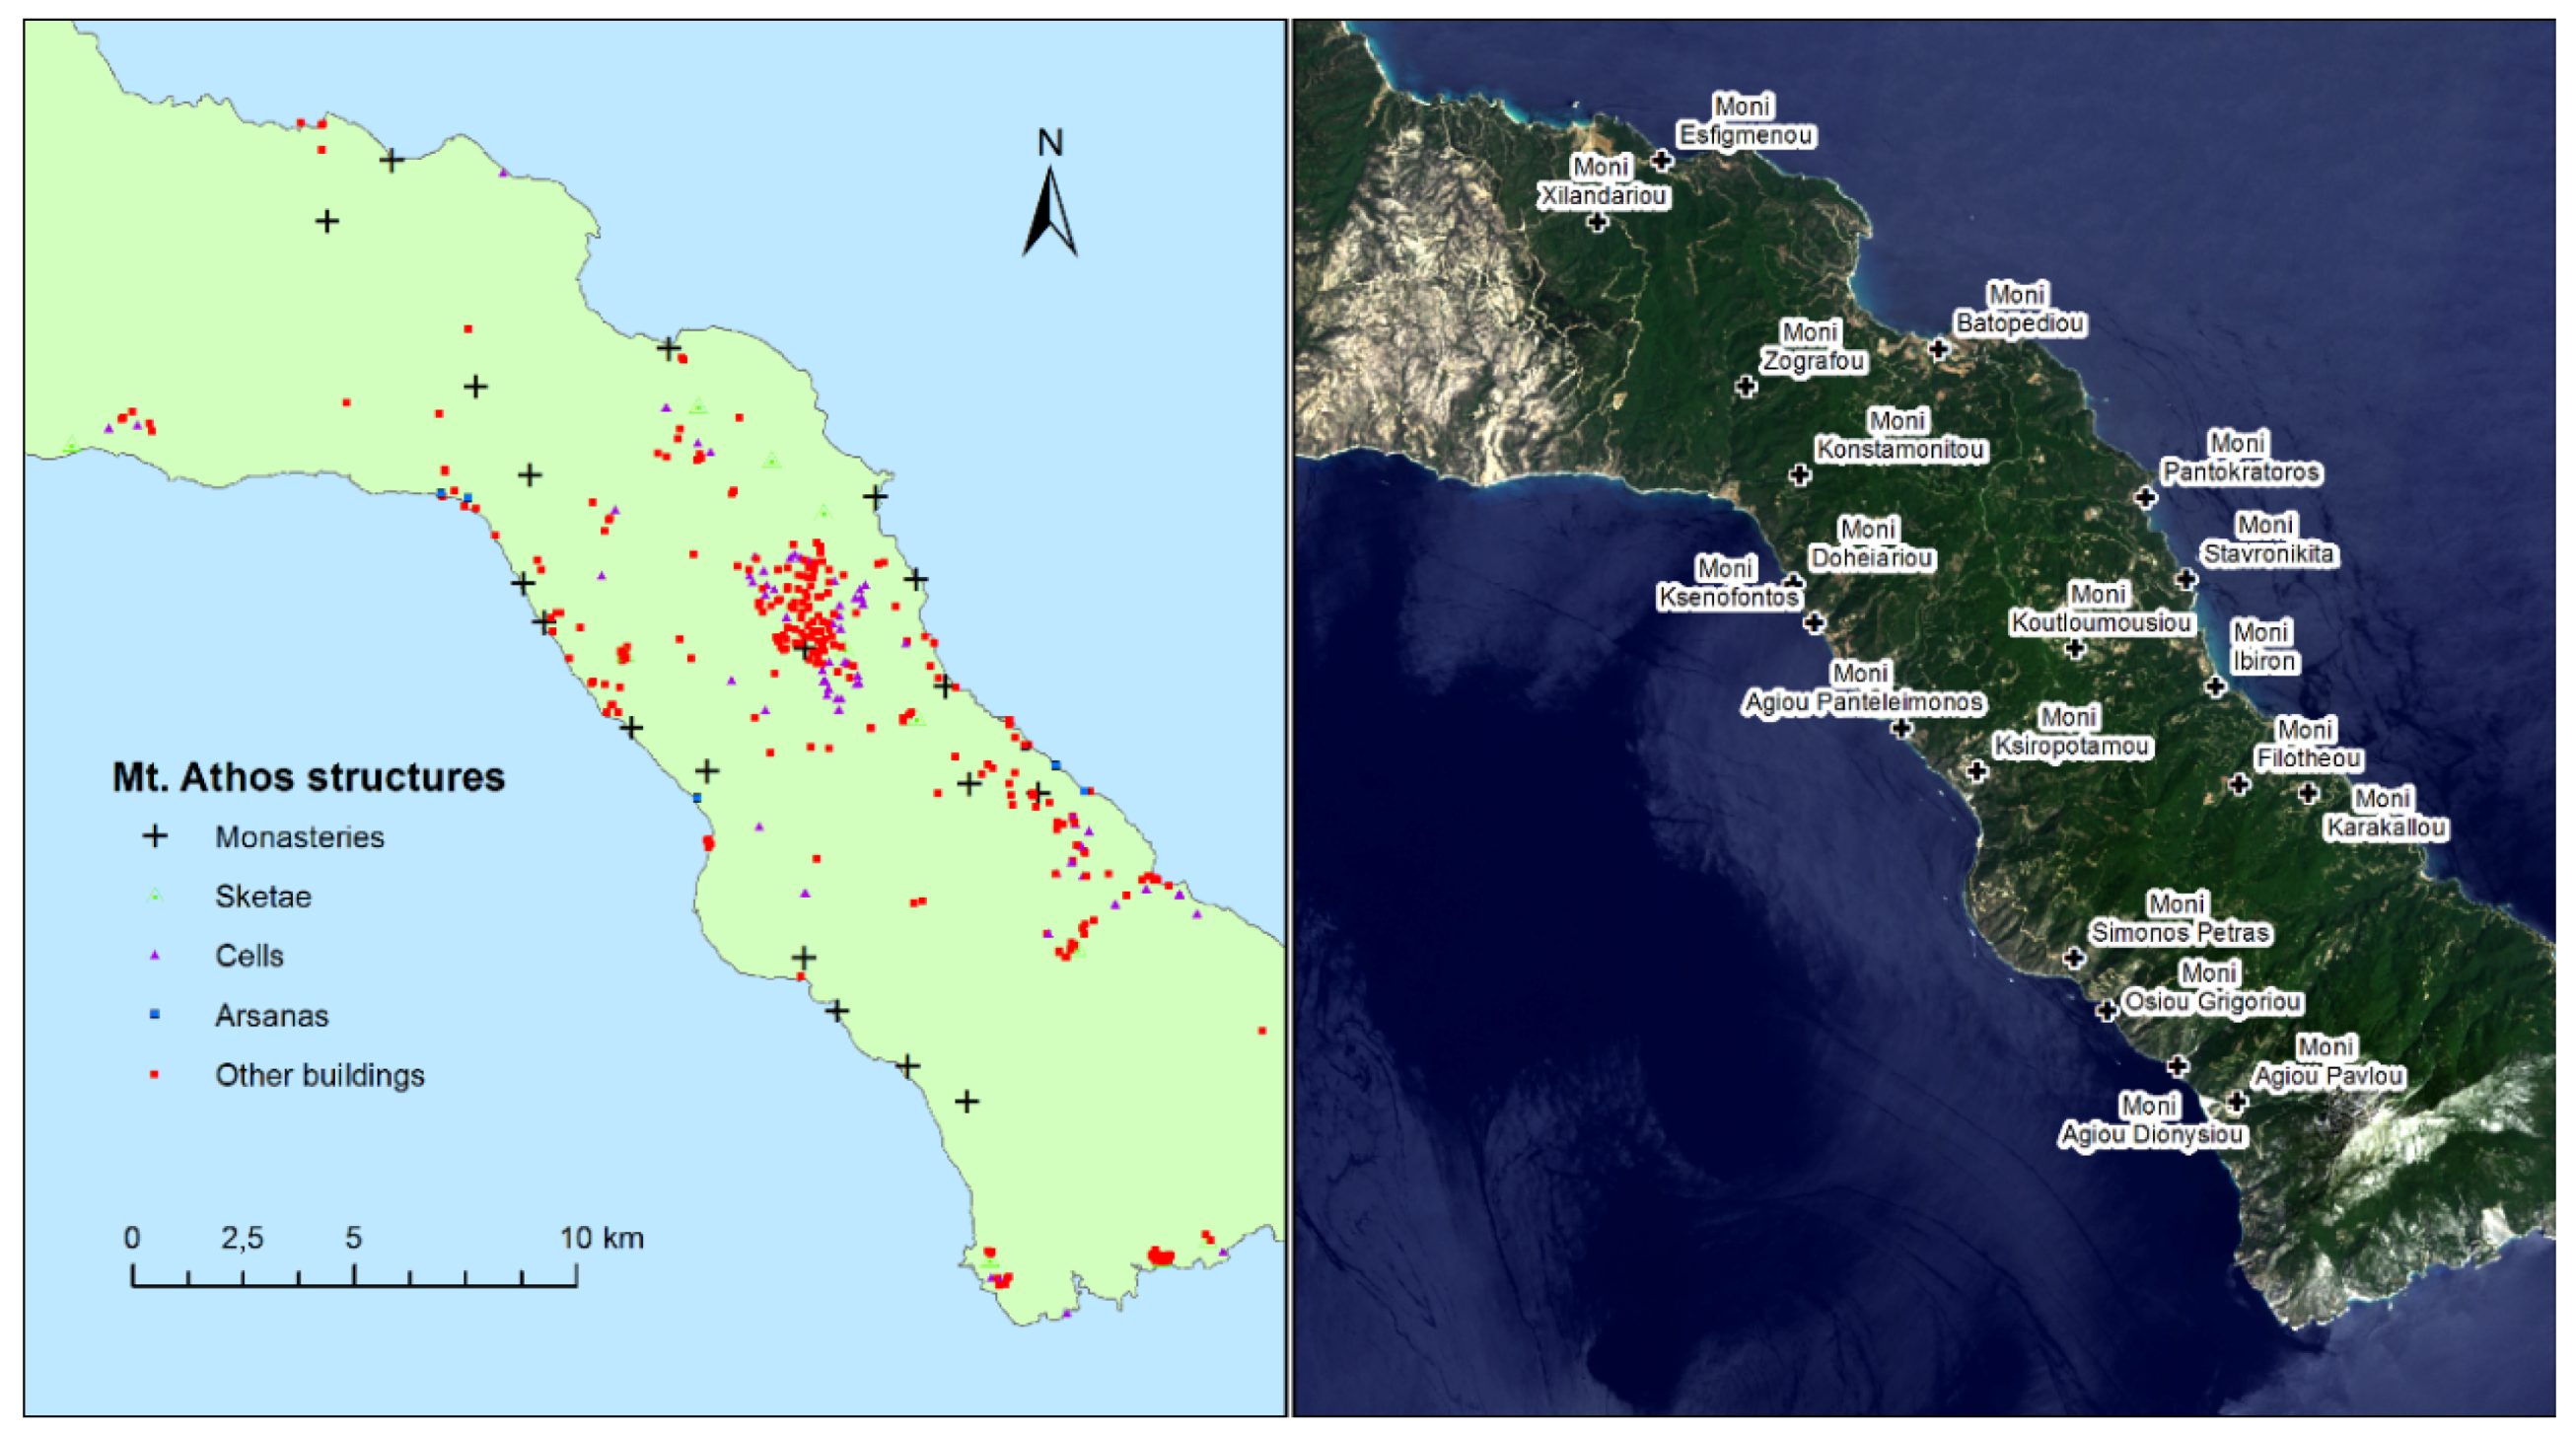
Mt. Athos includes lodgings and structures of different size and construction quality. These include monasteries, sketes, cells, arsanas, hermitages, and small chapels and churches. There are 20 monasteries located on the Mt. Athos. In addition, cells are houses with a small church, where 1–3 monks live under the spiritual and administrative supervision of a monastery. Sketes represent small communities of neighboring cells. Finally, arsanas represent assigned landing areas of the monasteries or sketes.
Since no information was readily available in digital format, scanned analog maps and large-scale orthoimages available on a web mapping service (WMS) (
http://gis.ktimanet.gr/wms/wmsopen/wmsserver.aspx) from the Hellenic National Cadastre were used for manually identifying and spatially allocating them. The monasteries map was overlaid on the BP map and exposure analysis was performed by creating a map that depicts the spatial coincidence of the expected wildfire conditional flame length
vs. burn probability with the location of the structures found in the area.
4. Results and Discussion
The six fuel types (models) that resulted from the field sampling represent all the major vegetation types of the study area. The dense shrublands (maquis) fuel model incorporates maquis with heights up to 2.0 m, a high proportion of foliage load, and a substantial part of the fuel load distributed to the large size class, while the sparse shrublands fuel model is characterized by low height and ground cover shrubs. The understory of Aleppo pine (
Pinus halepensis Mill.) forests is mainly composed of shrubs that present reduced fuel load values and height compared to the dense shrublands fuel model and increased values compared to sparse shrublands fuel model. The litter of conifer and broadleaved forests (mainly litter) demonstrated limited spatial heterogeneity and are represented by fuel model 4 for broadleaved forests and fuel model 5 for conifer species. Finally, a fuel model with the recently burned areas has been developed; it features a very low fuel load (
Table 2). The fuel values represented by the models fall well within the range reported for vegetation types in Greece and for Mediterranean vegetation types in other parts of the world [
32,
33].
The segmentation results using the trial and error approach were deemed satisfactory with the use a scale parameter of 35, shape criterion of 0.1, and compactness of 0.5, which resulted in as coarse as possible but not too complex and meaningful segments.
The segmentation results from an experimental series of various scale and shape parameters combination are presented in
Figure 4.
Through the visual observation of the relationship between the varying parameters and the segmented images, it is shown that a scale parameter bigger than 70 resulted to very large, less homogeneous segments. Similarly, the introduction of larger values for the shape homogeneity resulted in arbitrary, less homogeneous segments.
In order to further evaluate the effect of the segmentation results on the classifications, 261 randomly selected accuracy points were used and, similar to the approach of Gao
et al. [
34], a buffer zone of 3 × 3 pixels was created around each of the verification points for eliminating inconsistencies in the evaluation of the segment-based classification using individual pixels. We evaluated segmentations up to a scale factor of 70, since the visual assessment indicated a major degree of over-segmentation above this value.
According to the accuracy assessment procedure (
Table 3), a peak accuracy at the scale of 40 and with a shape parameter of 0.1 was noted, close to the optimal scale determined to be based on empirical evaluation and expertise. In all the combinations evaluated, a higher consideration of spatial (shape) homogeneity in the segmentation process resulted in decreased accuracy. Several studies have indicated that better segmentation leads to higher classification accuracy and different efforts have been put into achieving optimized image segmentation through classification accuracies comparison [
17,
34,
35]. On the other hand, some studies concluded that there is not a straightforward solution to such a problem [
18], or found minor differences when comparing optimal accuracy-based segmentations with manual-based image segmentations [
36]. Nevertheless, the ambiguity inherent in forest patches delineation, the variability in the spectral reflectance patterns of the forest patches [
16,
37], and the lack of fine-scale vector datasets contrary to the urban environment [
38] that would facilitate per-field or per-parcel image analysis make image segmentation optimization a challenging task.
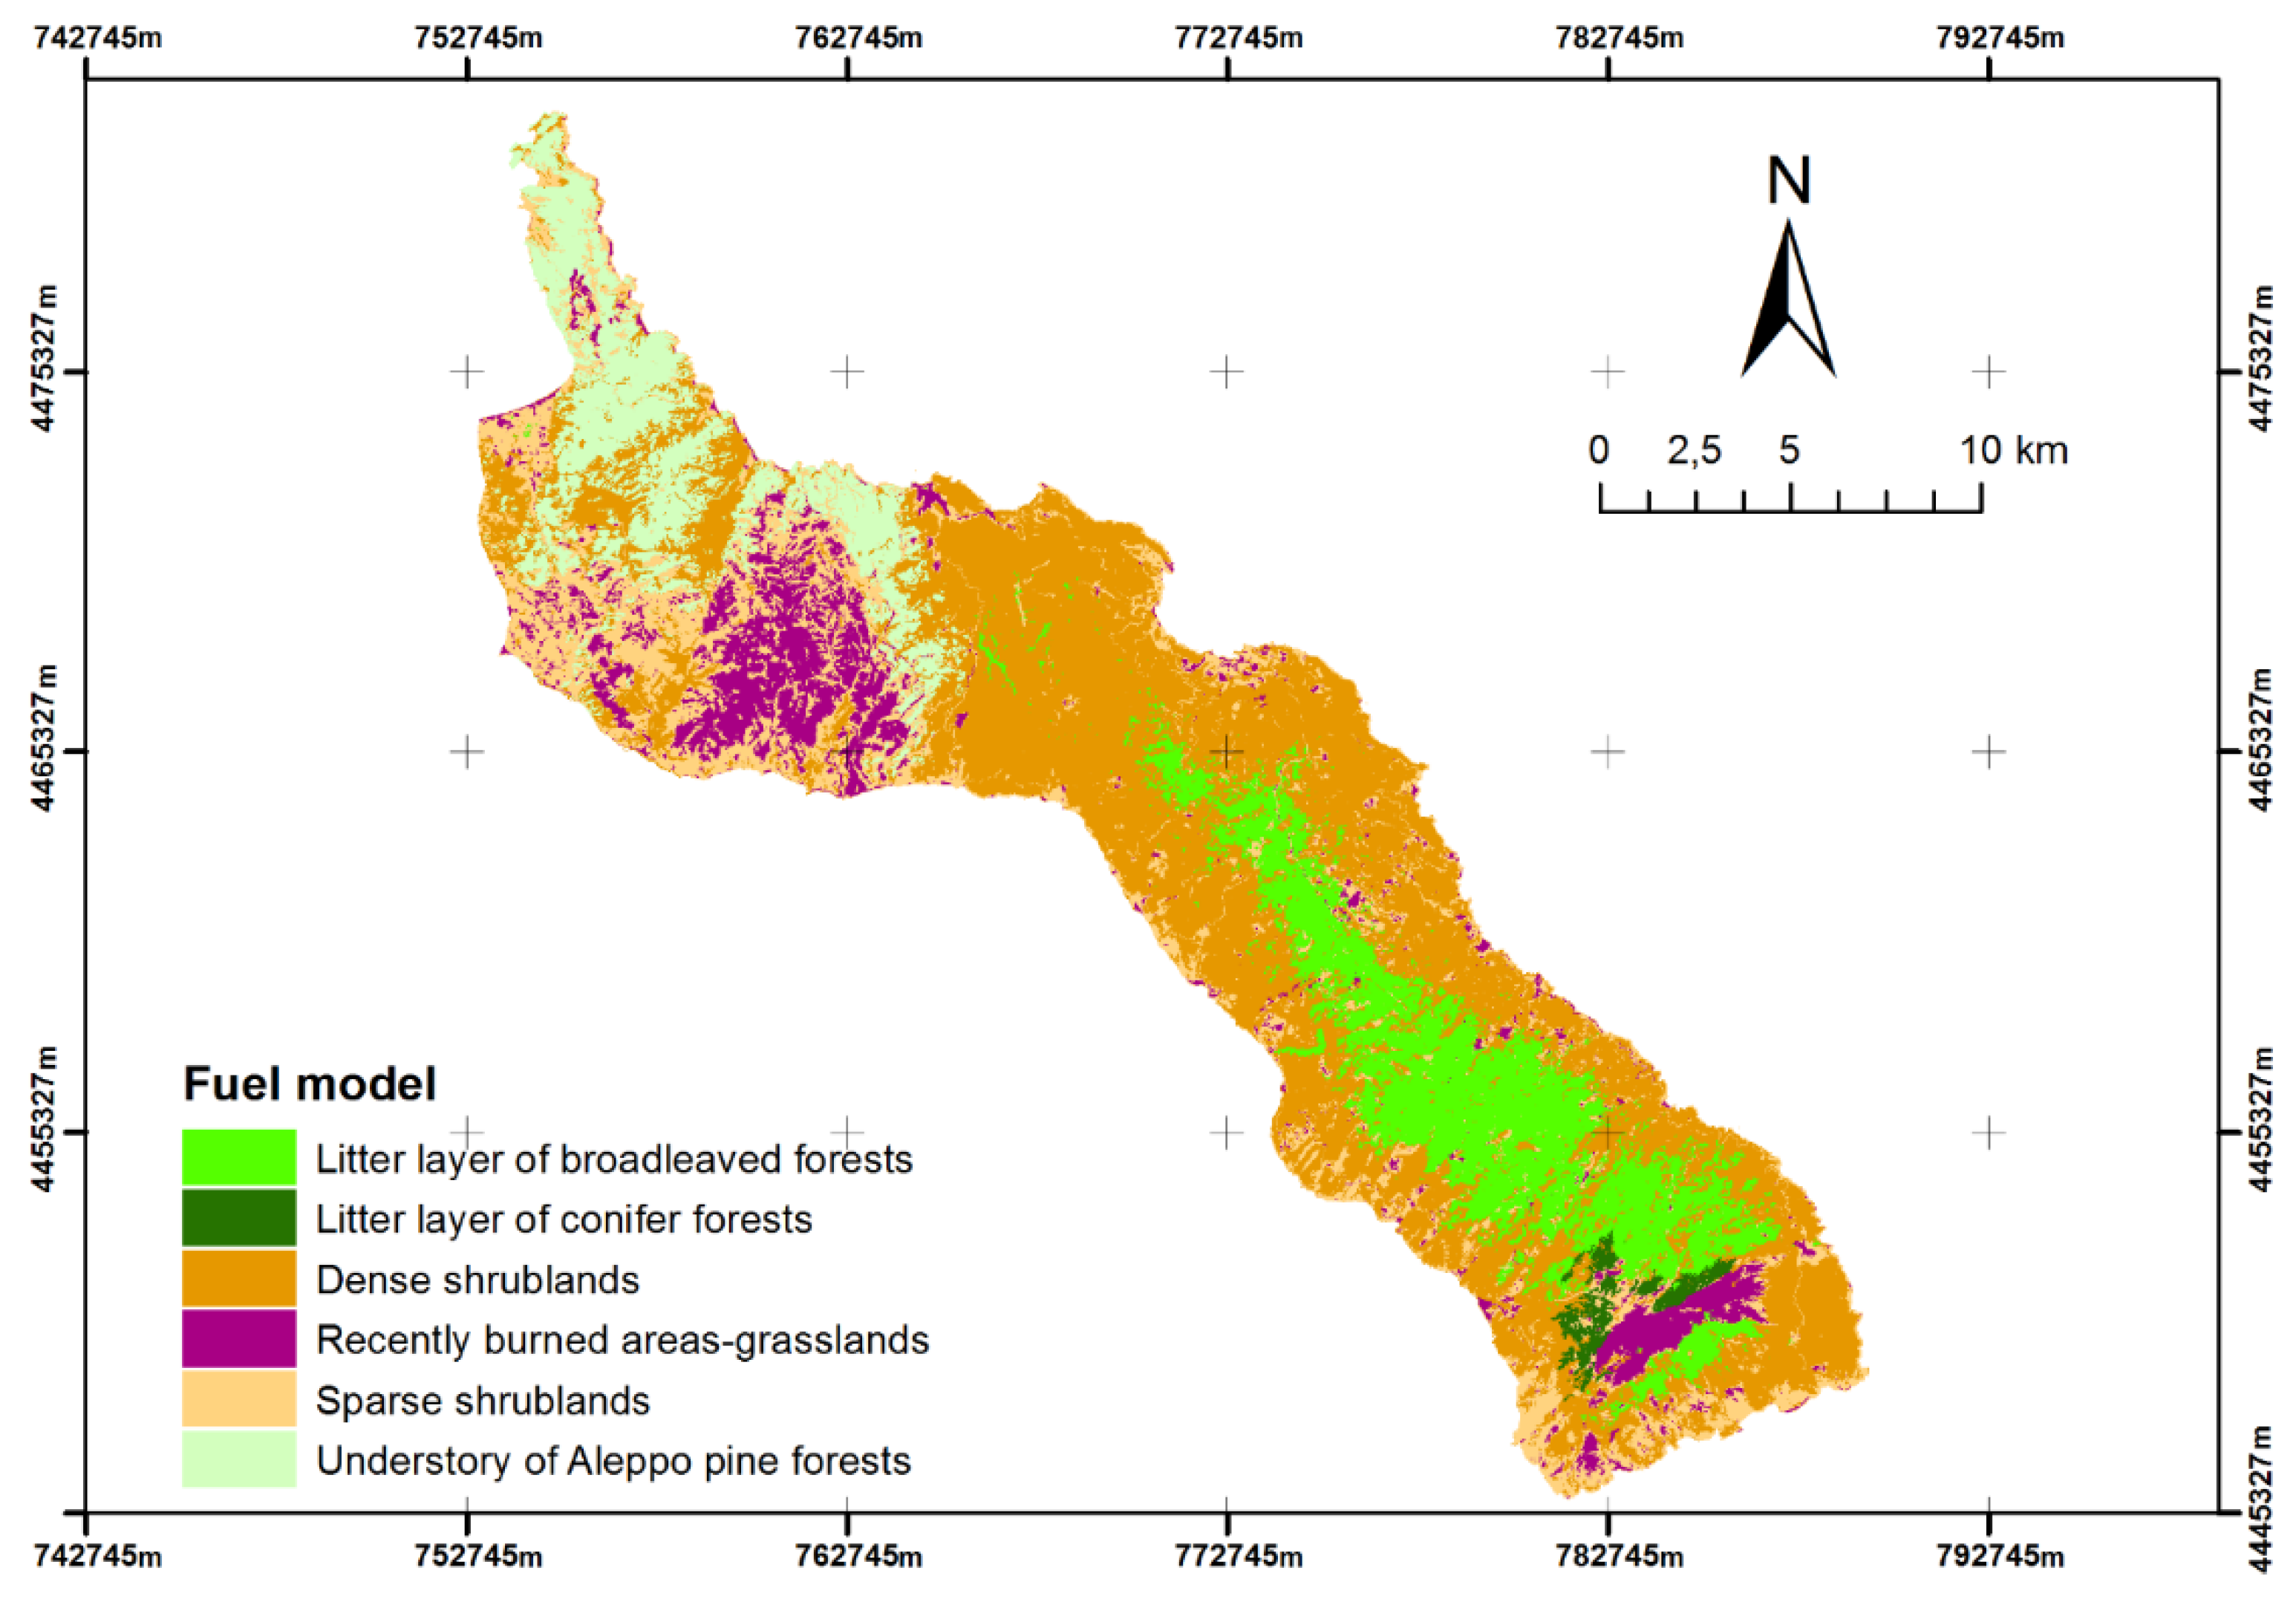
Classification of the satellite image provided the spatial extent of the different fuel types (
Figure 5). As can be seen, the majority of the area is covered with dense shrublands (43%), sparse shrublands (18%) broadleaved (14%), and Aleppo pine forests (36%). The smallest extent is covered by conifer species (2.3%).
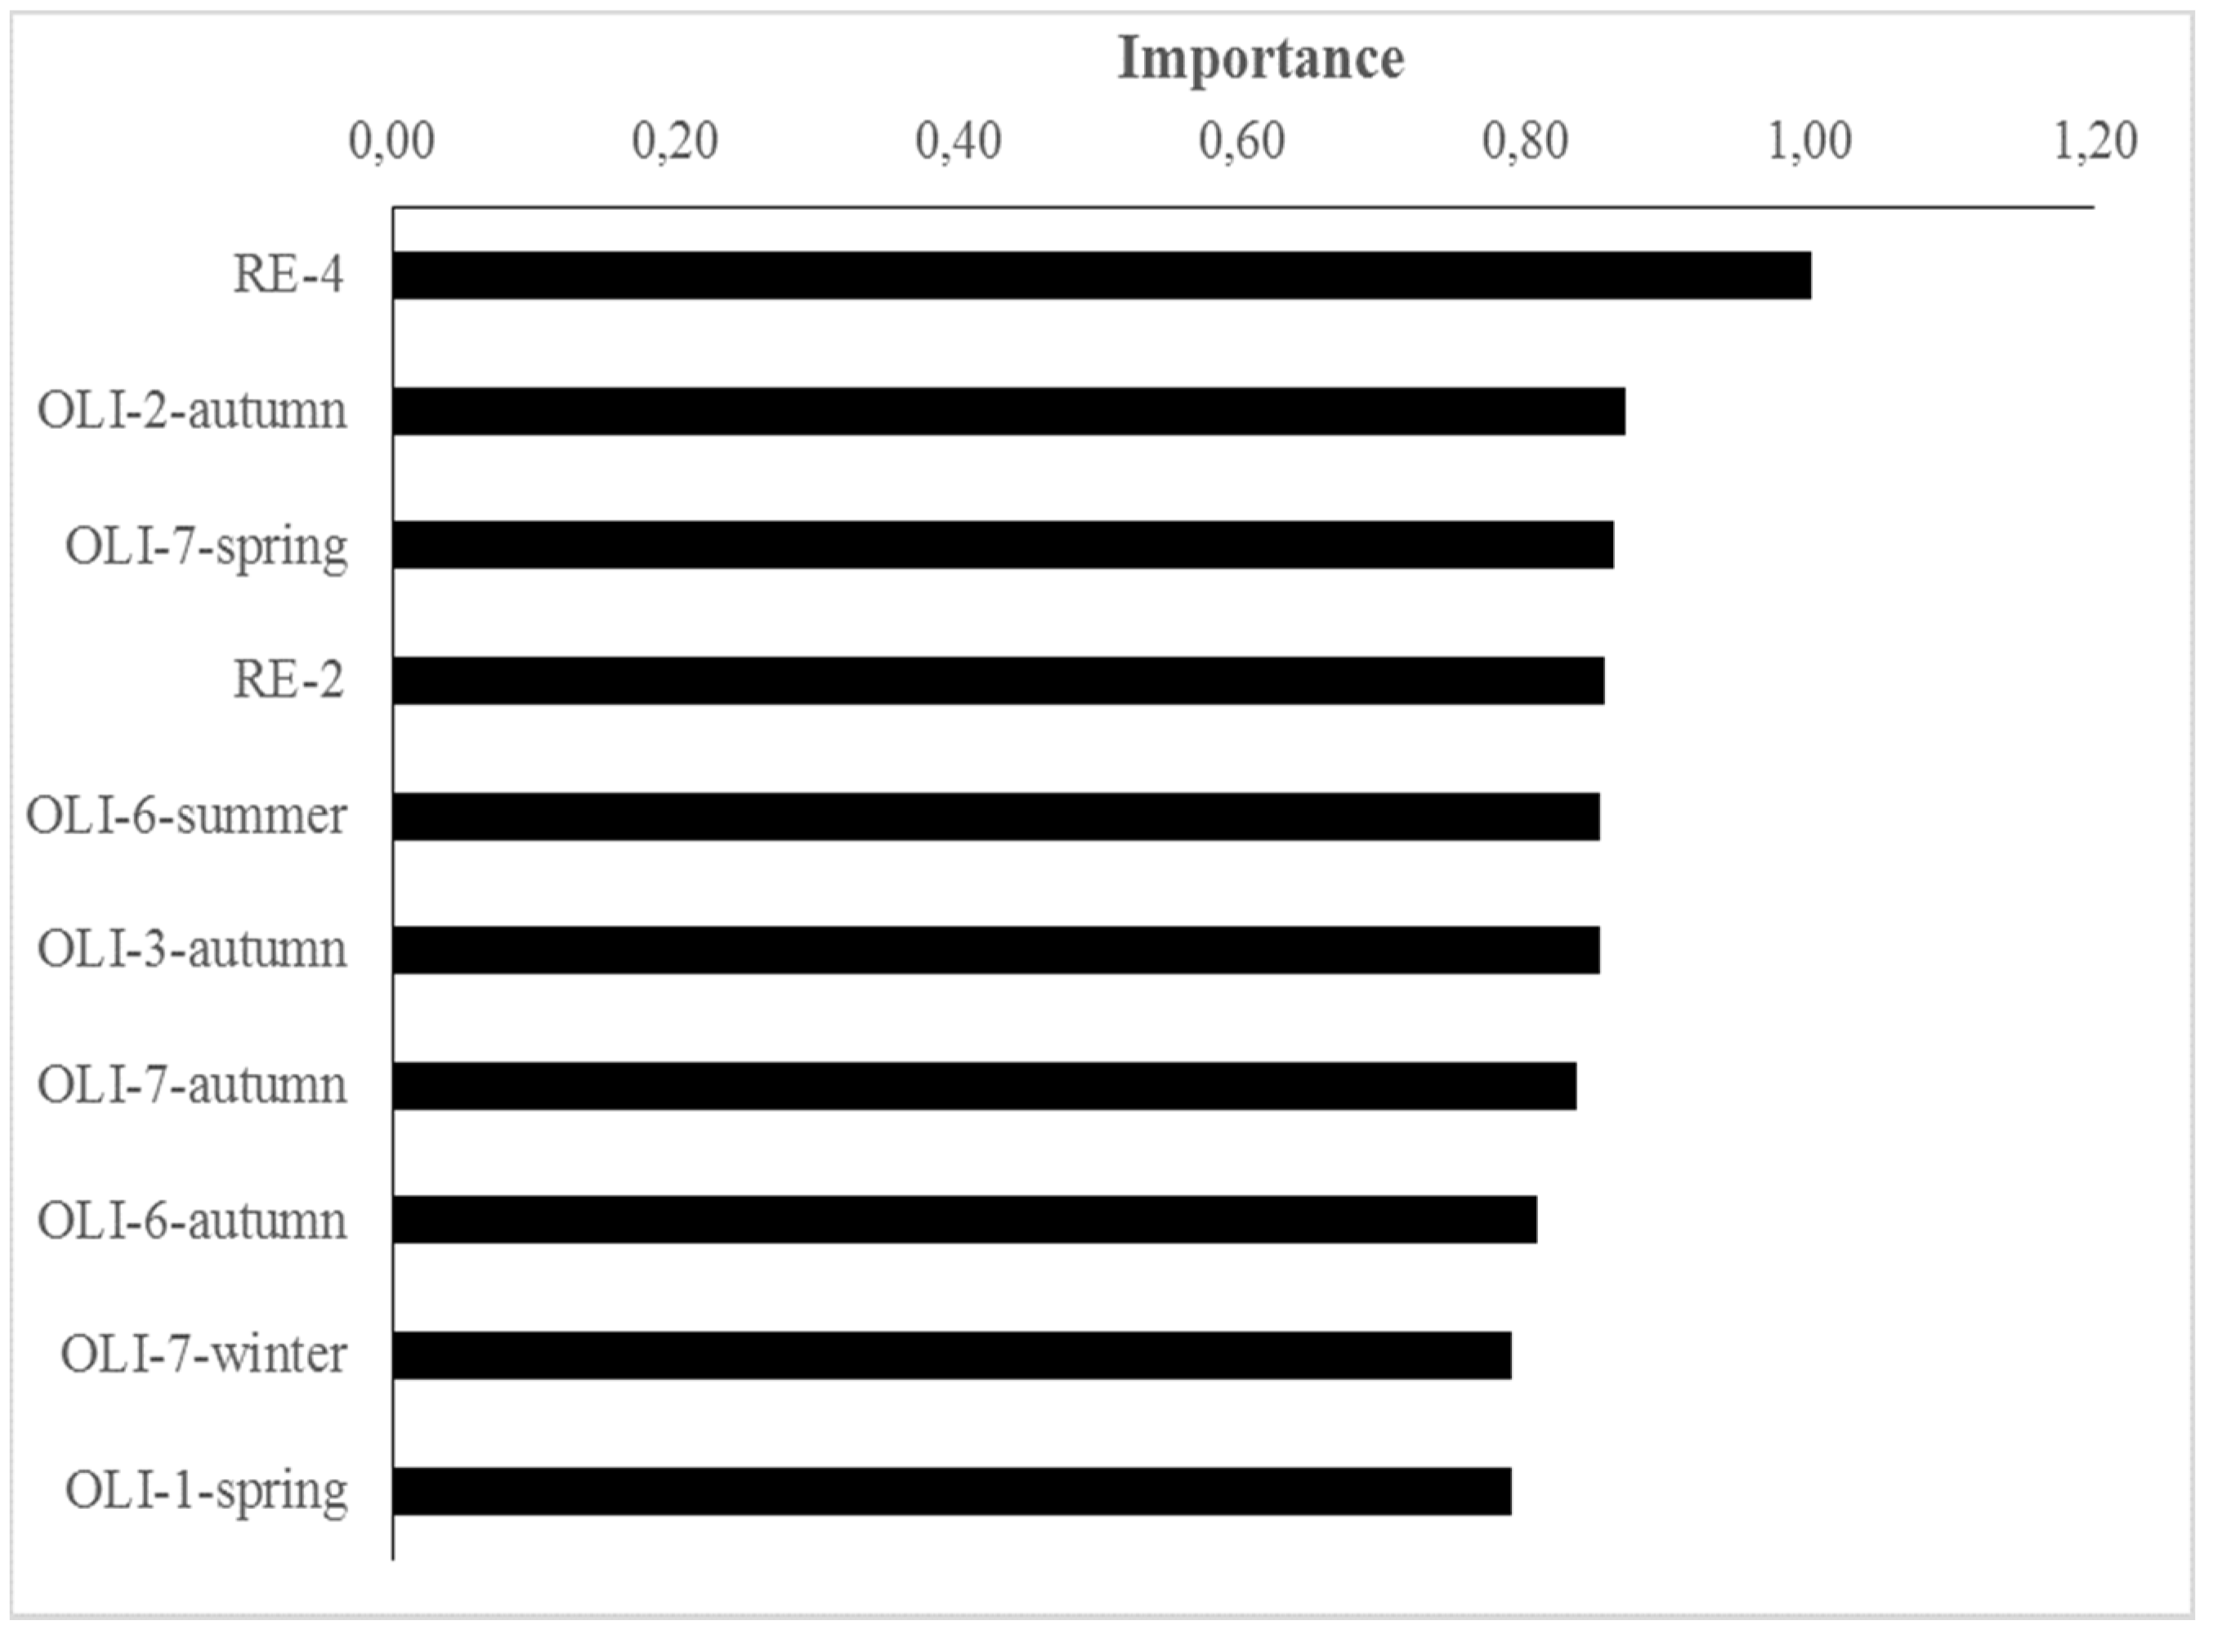
The red-edge spectral band proved to be the most important one (
Figure 6). Previous studies similarly reported an increase in classification accuracy related to this finding [
39].
The majority of the structures mapped are located in the center-north part of the peninsula, nearby Karyes. Karyes is a settlement in Mount Athos and seat of the clerical and secular administration of Mt. Athos Monastic State. However, many other monasteries, sketes, and cells are located along the coast of the peninsula. It is also noted that many monasteries or other residential sites are surround by agricultural or otherwise intensively managed vegetated parcels that result in fragmentation of fuel complexes and thus perform the function of fuel breaks. On the other hand, many cells or small churches are well distributed within the dense vegetation of the inner peninsula (
Figure 7).
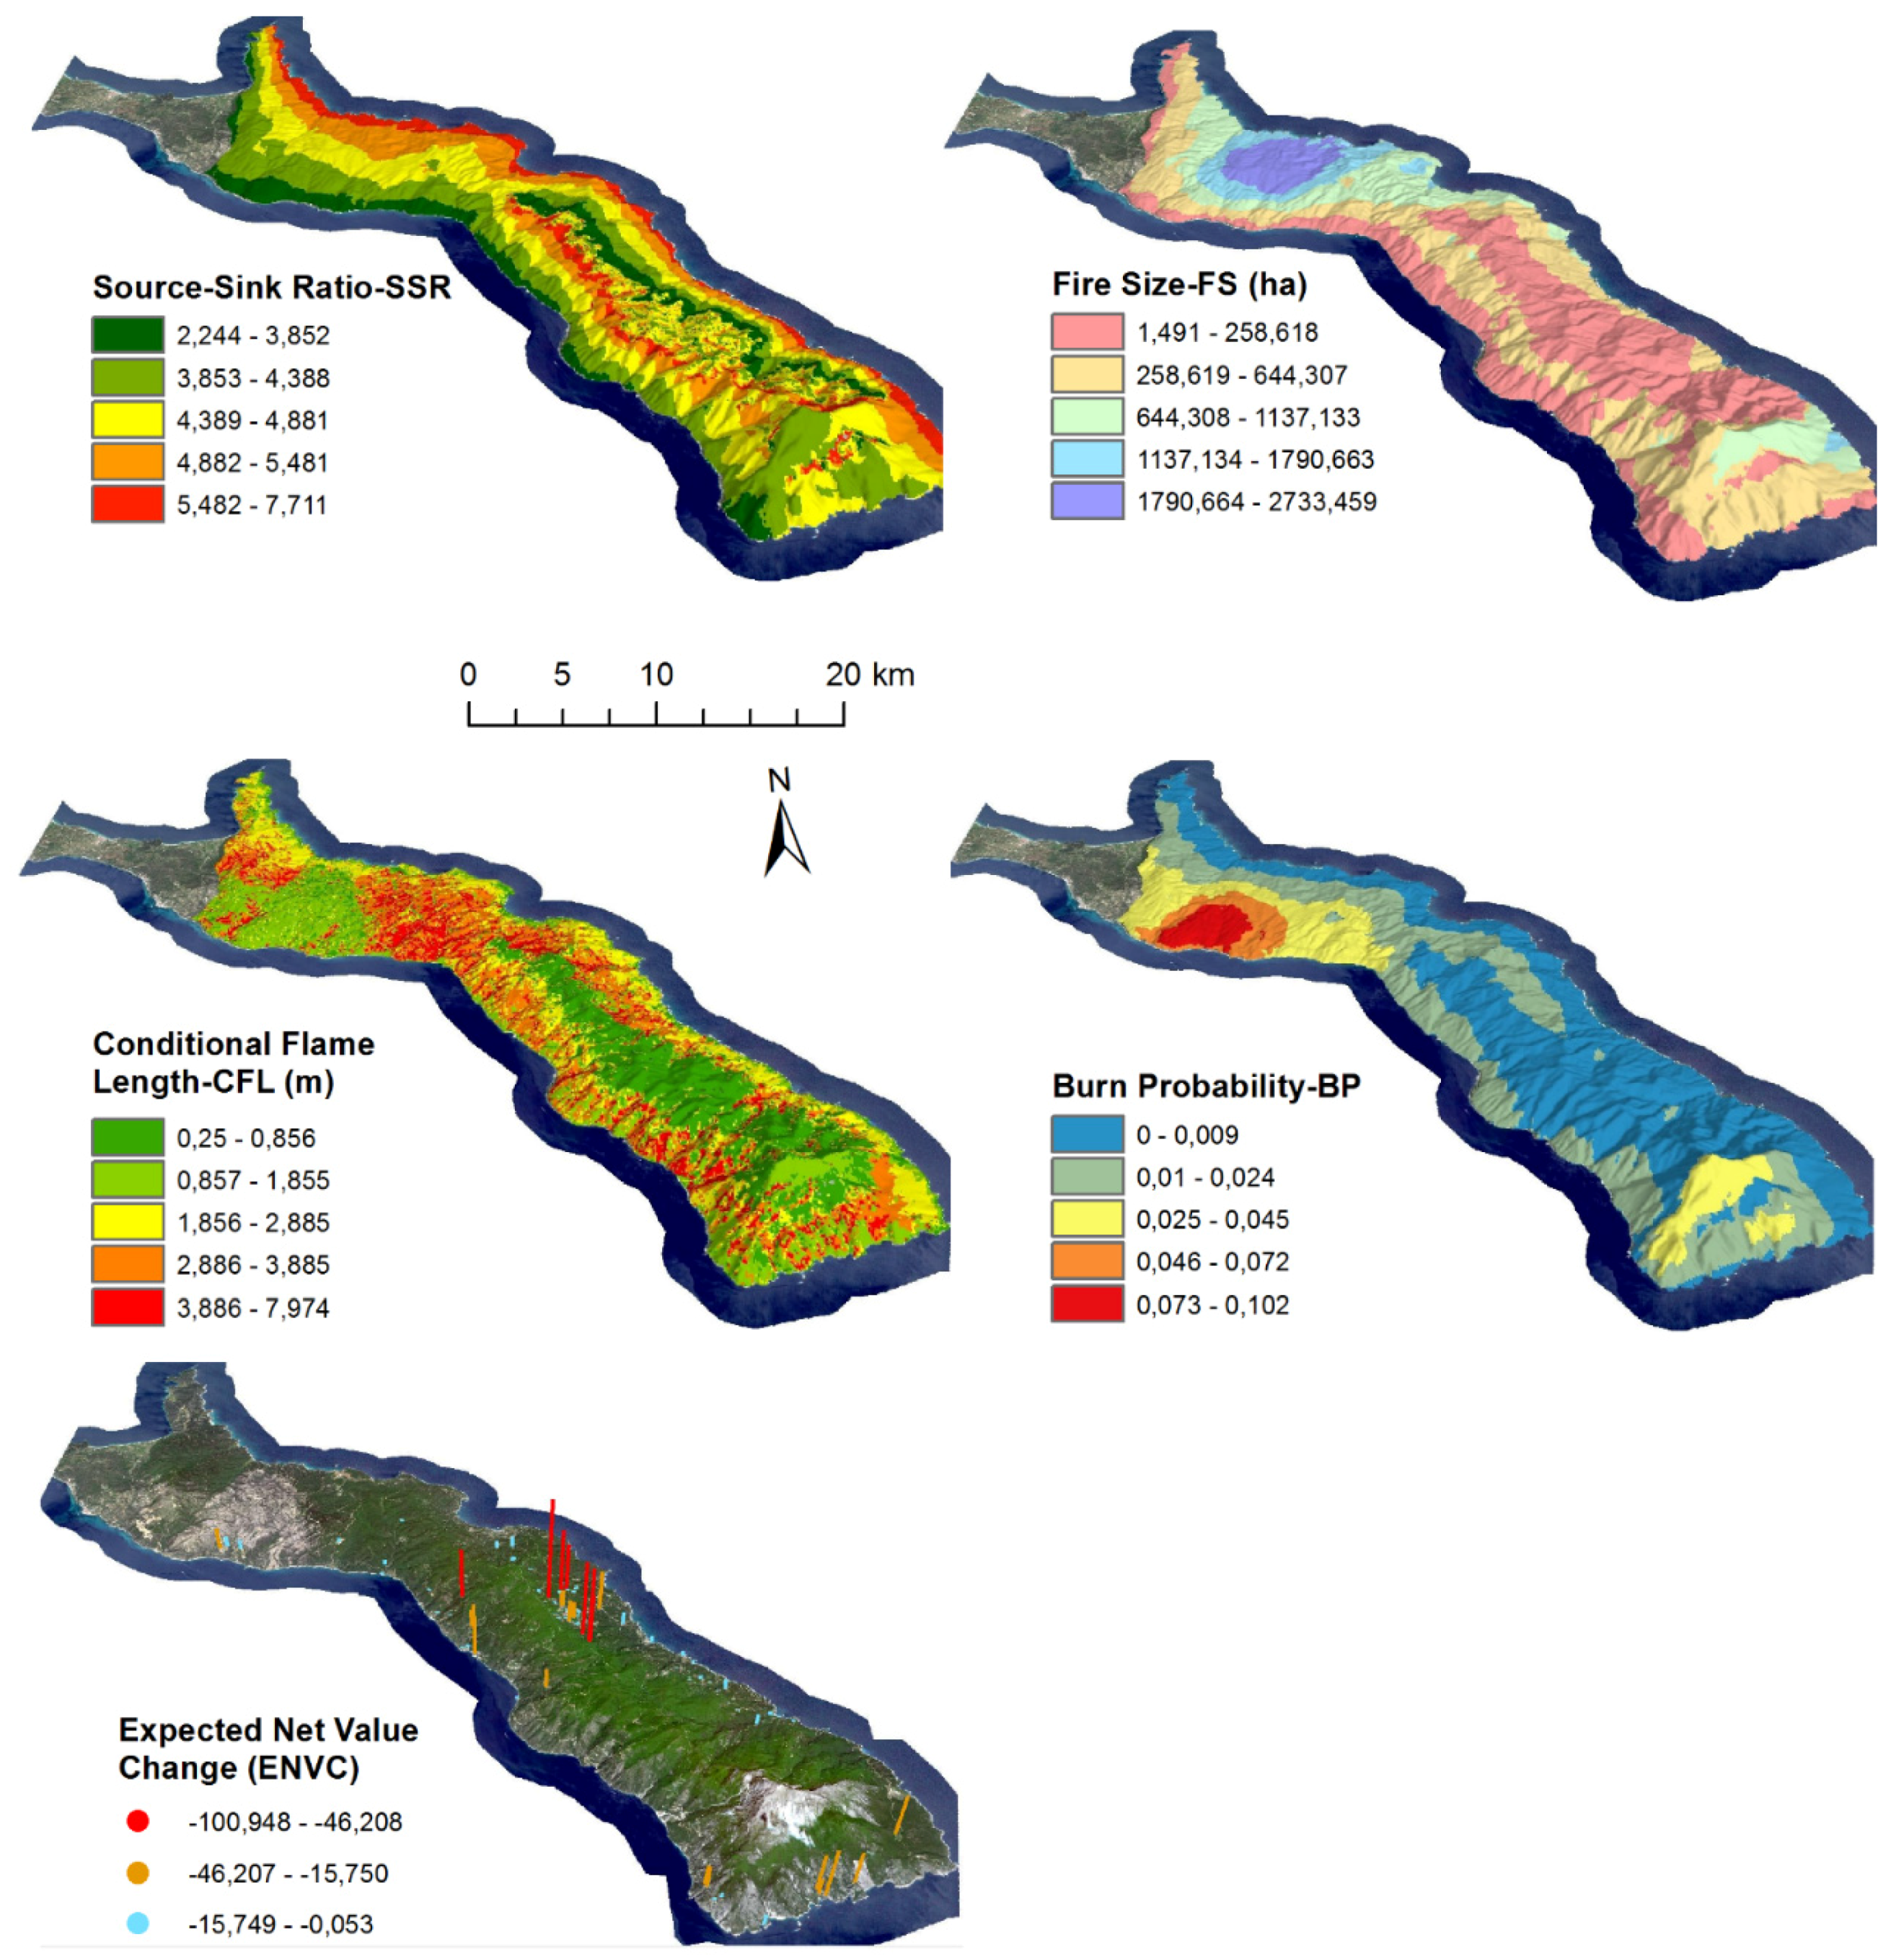
Fire simulation outputs for burn probability, conditional flame length, fire size, and source-sink ratio (
Figure 8) revealed complex patterns that were generally related to the dominant fuel type. Areas with high BP were found in several locations mainly in the northwest parts, although the largest concentration was in the understory of Aleppo pine forests and the two shrublands fuel types, where heavy fuel loads created conditions favorable for large fire growth. BP was lower in and around areas that had been recently burned numerous times by wildfires, especially in the vicinity of the sparse shrublands region. Spatial patterns in conditional flame length presented similar to BP spatial patterns and showed that the shrublands fuel types exhibited higher CFL. Recently burned areas and the litter of broadleaved and conifer fuel types showed lower values (<2.5 m) due to the low values of fuel load found in these fuel types. Sharp transitions in CFL were directly related to changes in fuel type extent, especially where dense shrublands transitioned into areas with sparse shrublands. The FS map showed the area burned from each ignition point. The FS data (ha) were smoothed with a nearest neighbor procedure to fill intervening areas that did not receive an ignition. The spatial patterns in fire size reflected fuel along the north direction, and the highest values were associated with large areas of contiguous fuel. Sharp transitions in FS were observed where non-burnable features (e.g., barren, rocks, structures) prevented fire propagation. Many of the large fires were generated by ignitions on the north portion of the study area, which is comprised of large areas of Aleppo pine stands with a shrub understory and high predicted fire spread rates. The smaller fires resulted from ignitions adjacent to non-burnable lands. The simulation outputs for SSR ratio suggested that several regions of the study area were sinks (small SSR)
versus sources (large SSR). Sink areas for fire were evident around non-burnable features that prevented fire growth across the landscape. These areas received fire from the surrounding landscape, but ignitions did not generate large fires. Areas with heavy fuel load located in the south of non-burnable features were source areas. These latter areas generally occurred on the south side of non-burnable features. A large part of relatively high SSR was observed for the northeast part of the study area, where ignitions generated large fires in areas of high burn probability.
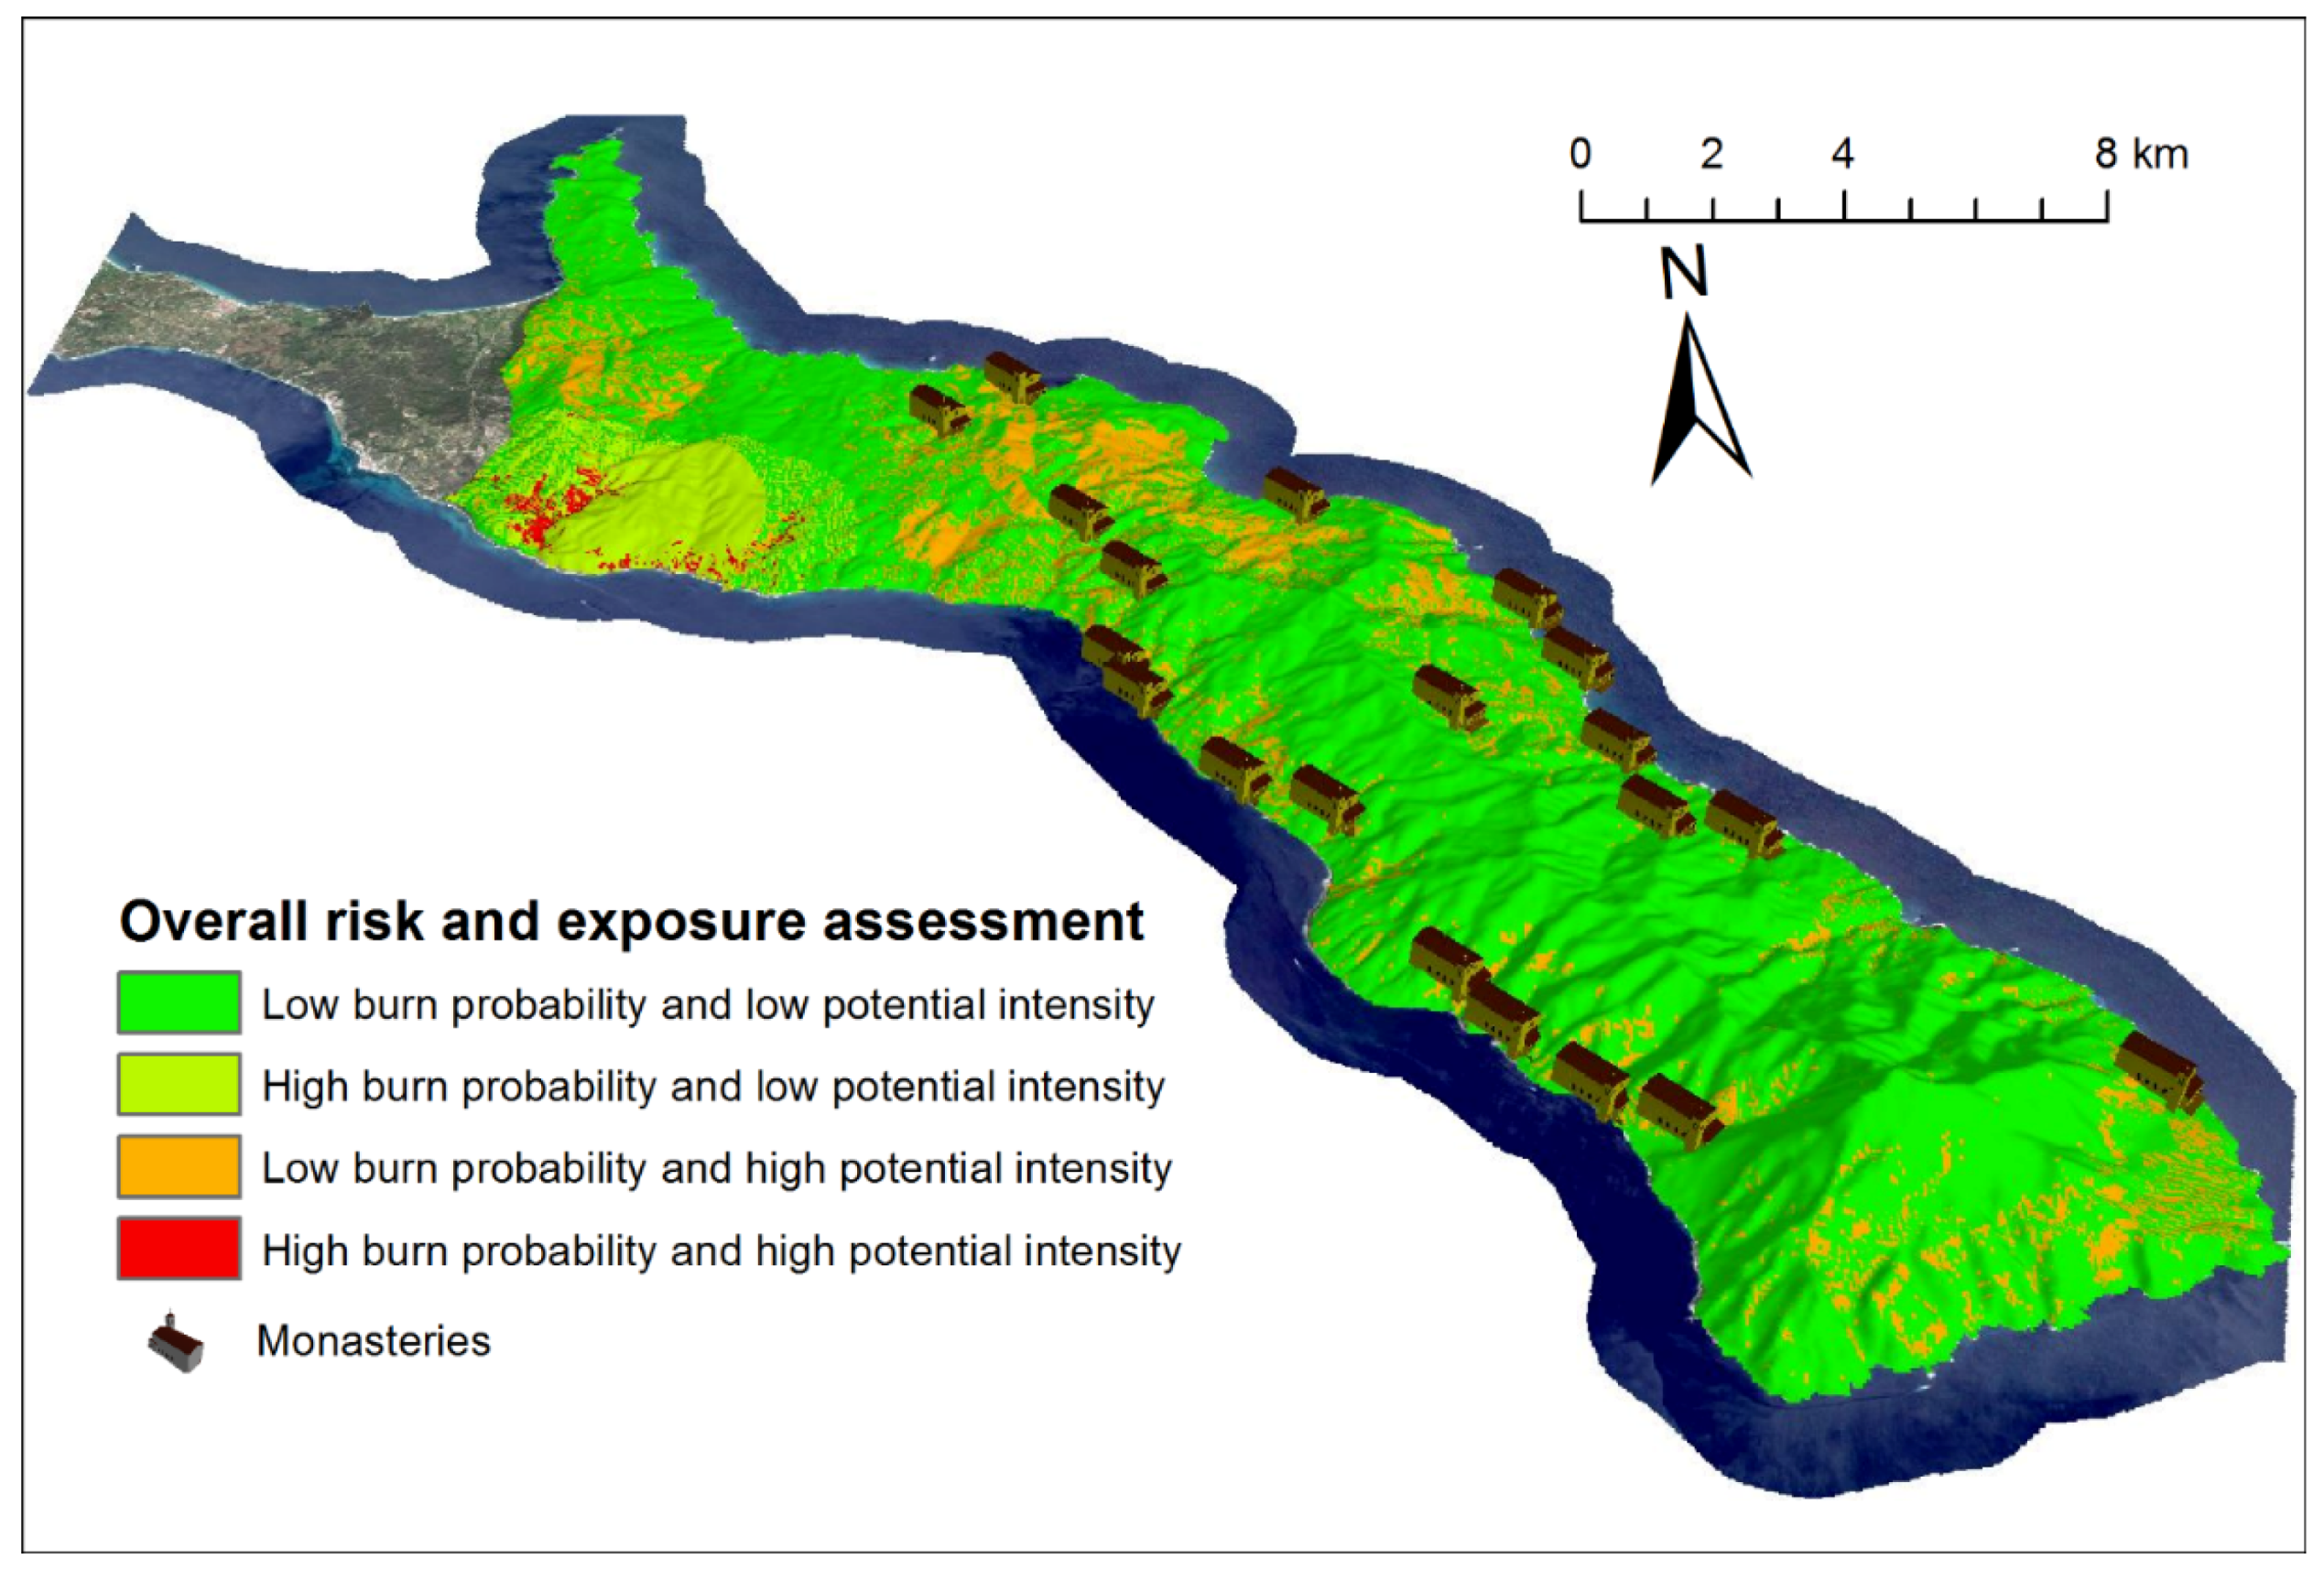
Wildfire exposure analysis, which assesses relative risk in terms of likelihood (burn probability) and potential intensity (mean conditional flame length), for the individual structures of Mt Athos is shown in
Figure 9. The map was analyzed into four fire exposure classes. Most of the structures are allocated in the low fire exposure class, thus revealing that they are not posing strong loss potential from wildfires. However, a few structures appear in the other classes without following a particular pattern. The 20 UNESCO main monasteries are located in areas with low burn probability potential. However, for some of them (nine of the 20), if ignition occurs, highly intense and severe fires are expected. The spatial extent of eNVC in each scenario is also shown in
Figure 8. Seven structures face severe loss, while the majority (85) of the structures present damage risk lower than −15.749.
By employing the current wildfire risk approach, it became possible to determine the important scale-related factors that drive wildfire likelihood. The multi-simulation approach used here helped to account simultaneously for weather, wind, and ignition effects on fire’s spread. In the case of weather and wind, these factors can either be based on actual data, can represent extreme cases, or may be assessed using future weather predictions from models. Additionally, the method generated fine-scale measurements of fuel types by using very high resolution imagery data, which allowed the accurate mapping of the fuel types’ spatial extent in the area. Based on this knowledge of the spatial extent of the fuels, national authorities and fire managers can design fire prevention, detection, suppression, and fire effects assessment strategies, such as the use and distribution of available firefighting resources, fuel treatment practices, and fire tower and water tank construction, as well as be able to trace gas emissions and monitor post-fire vegetation recovery [
40].
Vaillant
et al. [
31] and van Wilgen
et al. [
32] validated fire behavior prediction simulations in areas different from those where the models were originally developed. They concluded that specific, customized models need to be developed to account for both the fuel characteristics and the high heterogeneity of Mediterranean vegetation. Arca
et al. [
41] also suggested that localized, site-specific fuel models give more reliable and accurate fire predictions using the FlamMap simulator. The dense shrubland fuel type demonstrated the most severe fire potential in all burning scenarios due to the heavier fuel load. The litter of broadleaved and conifer forests fuel types produced low-intensity fires due to the reduced fuel load. The simulation results showed a strong effect of the fuel models on BP, FS, and CFL; in particular, the combined effect of the dense shrublands and the low-elevation pine forest areas and complex topography on CFL was relevant, especially in the northwestern part of the study area, while herbaceous fuels were in general characterized by lower CFL but higher BP. The high exposure to severe and large fires seen in the simulations highlighted the need for fuel treatments and fire management activities in specific locations. Regarding the features of the Mt. Athos landscape, different spatial patterns were observed in the study area, with few patches where high values of BP and average FS were strongly correlated. In these areas, potential issues such as fire threat as a direct risk to structures due to fire size and intensity and to related effects are expected. The incidence of high-intensity fires close to structures could be a serious safety threat to the resident monks and to visitors. The results of the study can assist in the identification and monitoring of specific areas and can be useful in applying fuel treatment and evacuation strategies in order to avoid the entrapment of people in the areas with the highest wildfire exposure. This is very important considering the fact that in past years the study area faced severe wildfires that damaged Mt. Athos’ structures.
The estimation of potential transmission of fire risk according to the SSR showed that areas with high SSR generated large fires relative to the frequency that they burned and can be considered precursor areas for large fires. On the contrary, sinks are areas that burned from fires originating elsewhere relative to the amount of fire they contribute to the larger landscape [
30]. Fire mitigation strategies located in source areas have a higher potential to transmit fire that could lead to severe impacts to high resource values found in the area. Wildland regions located in sink areas are more fire prone and thus potentially impacted by fires that originate elsewhere. SSR values showed large variation around fuel breaks (
i.e., bare soil, structures,
etc.) and no correlation between BP, CFL, and FS.
The spatial intersection of highly valued resources and assets such as the Mt. Athos structures of the study area with pixel-based burn probability estimates enables the quantification of the UNESCO structures’ exposure to wildfire. Spatially explicit burn probability is increasingly applied to assess the wildfire risk to highly valued resources and assets and to justify the development of mitigation strategies [
42,
43,
44,
45,
46,
47].
Calkin
et al. [
7] presented four basic actions for the reduction of risk of structures loss as a result of wildfires: 1) the reduction of wildfire occurrence, 2) the reduction of wildfire size and intensity, 3) the reduction of human development in fire-prone areas, and 4) an increase in a structure’s resistance to ignition. The results of the current study can be incorporated in a synergetic manner with fire occurrence data and monasteries’ ignition resistance standards to allow the development of an integrated wildland-structural fire management concept for the Mt. Athos peninsula. This approach is feasible since the area is not threatened by any development. Additionally, the creation of maps comprising structures’ conjunction and fuel characteristics would substantially help in fire risk mitigation efforts [
48]. Advances in remote sensing and spatial analysis have facilitated detailed structure mapping and analysis by expanding the data and methods available to analysts.
Increasing wildfire risk due to climate change will become a challenge for forest and fire management. The outputs of the current study, coupled with future regional climate models, can be used to address potential future changes of fire regimes, including increasing wildfire severity, shifts in fire risk distributions and, ultimately, implementing adaptive forest and fuel management options. These could include modifications of forest structures for reducing fire risk potential, e.g., by prescribed burning, thinning, pruning, understory biomass removal, or controlled grazing [
49].
Overall, the fire risk maps generated in this study provided a quantitative assessment of wildfire exposure at a scale that is not possible through other approaches such as, for instance, analyzing ignition data without taking into account fire spread and intensity at landscape level, a common approach for most of the fire risk studies found in the Mediterranean Basin [
50]. This work can provide useful guidelines for policy makers and land managers to use in identifying residential areas at risk and selecting the most appropriate prevention and mitigation activities to protect cultural heritage assets from wildfire losses. Furthermore, the use of high-resolution satellite datasets for the implementation of the approach will allow fine-scale fire simulation and risk evaluation. The approach used in this study can be transferred to other Euro-Mediterranean UNESCO World Heritage Properties and other protected areas. The fuel and forest types described here are classified according to the European Forest Types classification of the European Environmental Agency [
51] and are readily available across Europe.
5. Conclusions
This study assessed four important wildfire risk component values, Burn Probability (BP), Conditional Flame Length (CFL), Fire Size (FS), and Source-Sink Ratio (SSR), and investigated the potential effects for a selected UNESCO protected area in Greece. Localized fuel models have been developed based on extensive fieldwork and have been mapped by data fusion from high spatial resolution RapidEye imagery and multi-temporal Landsat 8 scenes acquired throughout the four seasons of the year. An object-based approach and a random forest classifier were employed for efficient information extraction.
The ideal segmentation level parameters identified based on overall classification accuracies were very similar to the settings identified by manual-based image segmentation. The information content of the Landsat 8 images was important for the classification process, as indicated by the random forest classifier.
Site-specific fuel models should be adopted to provide more reliable spatial fire risk predictions, especially in the case of the fragmented and heterogeneous Mediterranean landscape. FlamMap simulations resulted in high fire risk in the shrublands and Aleppo pine fuel types under typical summer conditions in the area. Furthermore, wildfire risk and exposure of the structures located in the area has been determined and provided an overall fire risk assessment of the cultural values.
Outputs created from this study can be used as valuable components of judicial short and long-term wildland fire prevention and management in cultural heritage sites anywhere in the world. Further studies of fire risk methods in the field are necessary in order to validate and calibrate the outcomes of the FlamMap fire simulators, especially in Mediterranean vegetation conditions. The proposed methodology could assist the authorities of Southern European countries in the enhancement of knowledge, understanding, and capacity to manage wildfire prevention, preparedness, response, and recovery. The methodology therefore contributes to sustainable management and conservation of cultural heritage properties in Europe by improved wildfire mitigation concepts.


