Communication

Investigating Potential Toxicity of Leachate from Wood Chip Piles Generated by Roadside Biomass Operations

1
British Columbia Ministry of Forests, Lands & Natural Resource Operations, Forest Science, 4th floor. 499 George Street, Prince George, BC V2L 1R5, Canada
2
Natural Resources and Environmental Technology, College of New Caledonia, 22 Avenue, Prince George, BC V2N 1P8, Canada
3
British Columbia Ministry of Forests, Lands & Natural Resource Operations, Water Stewardship Division, 5th flr. 499 George Street, Prince George, BC V2L 1R5, Canada
4
British Columbia Ministry of Environment, Ecosystems Protection and Sustainability Branch, 4300 North Road, Victoria, B.C. V8Z 5J3, Canada
*
Author to whom correspondence should be addressed.
Forests 2016, 7(2), 40; https://doi.org/10.3390/f7020040
Submission received: 2 November 2015 / Revised: 26 January 2016 / Accepted: 1 February 2016 / Published: 9 February 2016

Abstract

:
Roadside processing of wood biomass leaves chip piles of varying size depending upon whether they were created for temporary storage, spillage, or equipment maintenance. Wood chips left in these piles can generate leachate that contaminates streams when processing sites are connected to waterways. Leachate toxicity and chemistry were assessed for pure aspen (Populus tremuloides Michx.), lodgepole pine (Pinus contorta Dougl.), hybrid white spruce (Picea engelmannii × glauca Parry), and black spruce (Picea mariana (Mill.) Britton) as well as from two wood chipping sites using mixes of lodgepole pine and hybrid or black spruce. Leachate was generated using rainfall simulation, a static 28-day laboratory assay, and a field-based exposure. Leachate generated by these exposures was analyzed for organic matter content, phenols, ammonia, pH, and toxicity. Findings indicate that all wood chip types produced a toxic leachate despite differences in their chemistry. The consistent toxicity response highlights the need for runoff management that will disconnect processing sites from aquatic environments.

1. Introduction

Wood is the most prominently used renewable energy source on the planet owing to its broad availability and usage across a range of technologies including direct incineration and production of bio-oils [1]. Commercial development of wood biomass as an energy source is increasing owing to public and policy concerns over the reliance on fossil fuels for energy in light of climate change [2]. In British Columbia, wood biomass as an energy source is supported by the desire to utilize a substantial feedstock of standing dead pine trees no longer suitable for saw-log production following a mountain pine beetle epidemic [3]. Wood biomass energy technology, production capacity, and economic sustainability studies are prominent, but the influence of biomass operations on environmental sustainability requires more attention [2]. This paper addresses the potential aquatic effects of wood biomass operations by investigating the chemistry and aquatic toxicology of leachate generated from biomass chip piles.
Wood leachate studies have primarily focused on log storage yards that produce large quantities of leachate due to the high volume of wood stored and the frequent watering of logs required to prevent them from cracking or succumbing to biological attack [4]. A synthesis by Hedmark and Scholz [5] notes that log-yard leachate is variable amongst tree species and that it generally increases with the amount of water the wood has contacted. Although some chemical differences existed among tree species, all leachate generated by log piles was found to have high organic matter levels and correspondingly high chemical oxygen demand (COD), both of which are known to decrease oxygen levels in receiving waters [5]. Tao et al. [6] noted that within species, there may be a difference based upon age; leachate generated from fresh piles of cedar waste (Thuja plicata Don ex D. Don), trimmings, off-specification wood chips, shredded bark and roots, and sawdust was light colored, acidic, with high oxygen demand and toxicity, while 1.5-year-old cedar piles produced darker leachate that was less acidic with lower oxygen demand and toxicity.
Leachate generation can occur when logs are stored prior to processing, a time period that may extend weeks to months after harvesting [7]. During processing, wood chip piles can be created by spillage, regular cleaning of grinding equipment, and for storage when large chip piles are left on-site in response to market condition or processing capabilities. Although these piles vary in size, they will contribute leachate to local soils and runoff unless they are spread or removed [8]. Runoff is particularly important for aquatic environments because roadside processing can increase the probability of leachate reaching ditches and subsequently streams.
Previous work has found that leachate can degrade receiving environment water quality and is toxic to aquatic life [7,9]. Machrafi et al., [10] also document terrestrial toxicity, noting that bark-covered areas in Quebec remained free of vegetation many years after harvesting due to toxic phenols in soil that took 20 years to degrade. The aquatic response to leachate may be due to COD, phenols, organic compounds, or resin acids such as isopimaric acid (IA) and dehydroabietic acid (DHAA) [5]. Ecotoxicology studies of pulp mill effluent have determined that IA is the most toxic of the group of acutely toxic resin acids [11,12,13] but it is the rarest. DHAA, in contrast, is one of the least toxic but it is often identified in pulp & paper toxicology literature because it is the most soluble resin acid [13,14] and can be reduced to retene, which is also toxic to aquatic organisms [15].
Leachates are also problematic in biomass combustion because of the inorganic constituents that they contain [16]. In the presence of alkali, sulfur, carbonates and silica, turning wood and agroresidues into renewal biofuel comes with technical difficulties. Among others, combustion of leachates creates ash-related problems [17] and produces emission of acid gas [18], contributing to reduced thermal conversion efficiency. As a result, different methods are currently in use to treat biomass leachates such as reverse osmosis [19], washing the raw fuels with water [20,21] and using additives [22].
The work presented here complements and adds to the information provided by previous studies because it is operationally focused and assesses leachate generation across a variety of sub-boreal tree species used for biomass energy production. The objective of this work is to identify leachate characteristics across tree species commonly used in biomass operations and to identify the toxicity of leachate generated at field sites, in static solution, and in simulated short-duration rain events.

2. Experimental Section

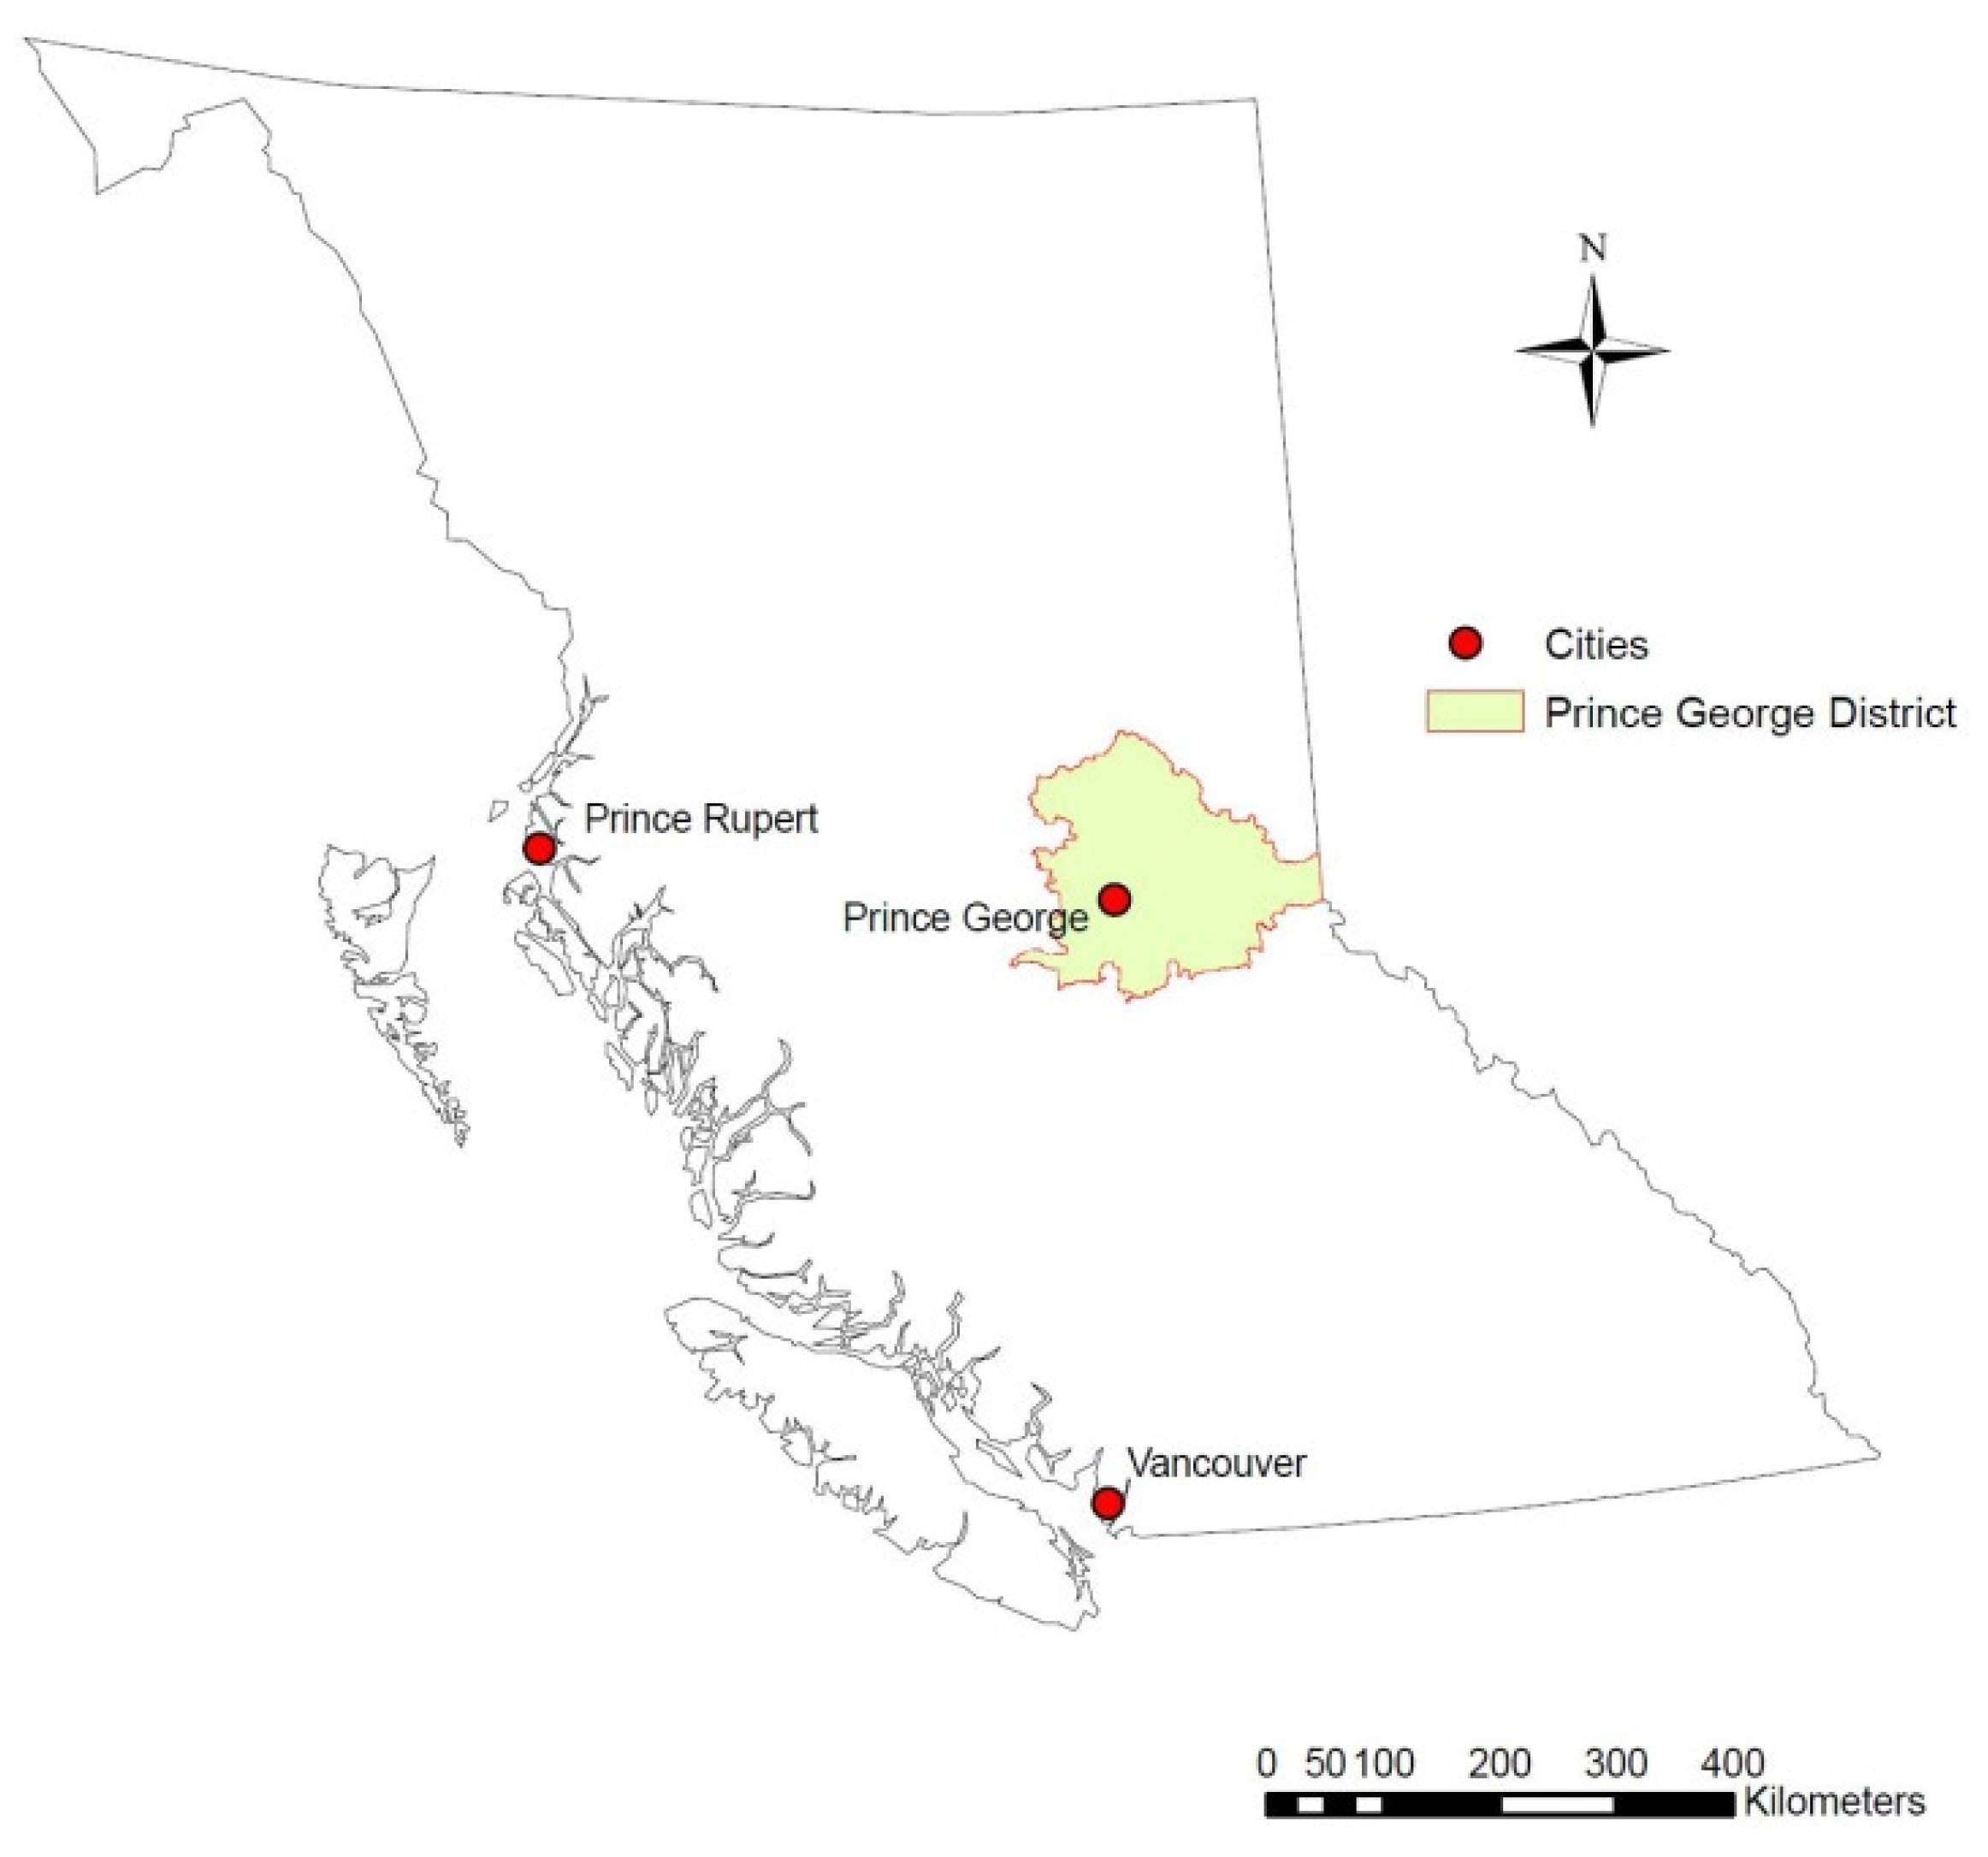
2.1. Collection of Wood Chip Samples

Wood chip samples were gathered from tree species common to the Prince George Forest District and typically used as biomass fuels (Figure 1). Although regionally focused, the study area is representative of the interior sub-boreal forest. Chips were collected directly from wood chipping forest operation sites in the Prince George Forest District.
Figure 1. Location map showing the Prince George Forest District within the province of British Columbia.
Forests 07 00040 g001
Operational field trial locations were established in co-operation with a local biomass operator. Lodgepole pine and spruce logs were randomly chosen from decked logs in an approximately 90%:10% proportion of species observed at the block level. Trees were chipped into two (322 L) uncovered plastic horse-watering trough containers with bottom drain plugs at each of two mountain pine beetle salvage block locations, herein named Muldowan 18 and Moldowan 22. Due to mechanical issues, two different screen sizes were used during processing, with a 10-cm screen at the Moldowan-18 and a 5-cm screen at the Moldowan-22 station. Although the source material is similar between Moldowan 18 and 22, the difference in wood chip size can influence leachate generation. The smaller wood chips have a larger surface area to volume ratio and may consequently produce leachate more readily and of higher concentration, particularly under short duration exposure during the rain event simulations. Hedmark and Scholz [5] noted that leachate levels increased with the amount of water in contact with wood.
Wood chipped for the laboratory studies was gathered from debris piles in two separate mountain pine beetle salvage blocks 20 km north of Prince George (Figure 1). Tree stems were removed from the pile and identified as lodgepole pine, hybrid spruce, or black spruce using bark and needles. Aspen was identified by bark alone. These stems were chipped using an unscreened Vermeer 1000 chipper.

2.2. Leaching Fluids and Leachate Generation

Operational samples were left in two open 322-L containers in the field at each site. Containers sat above ground and were exposed to natural weather conditions from the winter of 2010 until the fall of 2012. Samples were collected after spring melt as well as late summer and fall rains over the 23-month period. During sample collection, the entire volume of leachate contained in each container was removed.
Leachate was generated in the laboratory using de-ionized water in a static exposure and rainfall simulation experiment. The static exposure consisted of placing 2 kg of wood chips in a polypropylene 1-cm opening mesh bag in 18 L of water for 28 days at room temperature and ambient light. The quantity of chips and water selected follows the 9:1 ratio of water to wood recommended by Taylor et al. [23]. Static exposure tests were completed using duplicate samples of lodgepole pine, hybrid spruce, black spruce, and aspen. separately chipped. Water samples were drawn weekly to provide information on short-term chemistry and toxicity signals.
A portable rainfall simulator [24] was used to generate a heavy rainfall event of approximately 100 mm·h−1. Duplicate samples of dry chips of lodgepole pine, hybrid spruce, black spruce, and aspen as well as the two operational sites were exposed to the rain event after which they were placed in water and then exposed to another rain event to simulate a saturated response to rainfall.

2.3. Chemical and Toxicity Analysis

Operational site leachate samples were collected in phosphate-free soap-washed 20-L plastic containers with lids. Sub-samples were collected from the 20-L containers in the laboratory using sterilized 120-mL amber glass (for phenol analysis) or acid-washed plastic (for all other analyses) bottles by dipping the bottle into the container after mixing the solution. Bottles were inserted in an inverted position until mid-depth where they were then turned right-side up to collect the sample. Static test leachate samples were collected in the same manner as operational samples because the wood chip samples were placed in 20-L buckets.
Simulated rainfall samples were collected from a receiving bin below the wood chip sample that was exposed to rainfall. Once collected, all samples were stored at 4 °C until they were shipped with ice to commercial laboratories for analyses using standard techniques and detectable thresholds as identified in Table 1. Quality assurance and control protocols included the submission of blank samples, duplicates, and spiked samples. Microtox™ analysis used the luminescent bacterium Vibrio fischeri and processing followed standard techniques at dilutions of 0%, 10.2%, 20.4%, 40.9%, and 81.8% [25]. For this study, Microtox™ tests were used to determine the effective concentration of leachate that reduced the bacterial population by 50% within 15 min. Toxicity was then inferred by the concentration required to cause population reduction, the lower the leachate sample concentration required, the higher its toxicity.
Statistical analyses involved comparison of samples using the Kruskal-Wallis or Mann-Whitney test for non-parametric data [26] in Systat 12™ while figures were constructed using SigmaPlot™.
Table 1. Analytical techniques and detection limit where applicable.
ParameterAnalytical TechniqueDetection Limit
pHElectrometric Method (SM-4500H+B)
True ColorVisual Comparison Method (SM-2120B)100 Color units
Total Organic CarbonPersulfate-Ultraviolet or Heated-Persulfate Oxidation Method (SM 5310 C)5.0 mg·L−1
Chemical Oxygen DemandClosed Reflux, Colorimeter (SM-5220D)20 mg·L−1
AmmoniumAutomated Phenate Method (SM-4500NH3G)0.005 mg·L−1
Resin AcidsExtraction and Gas Chromatography (STL SOP-00152)
PhenolsDirect Photometric Method (SM 5530)0.01 mg·L−1
MicrotoxBiological Test Method: Toxicity Test Luminescent Bacteria, 1/RM/24: Environment Canada

3. Results and Discussion

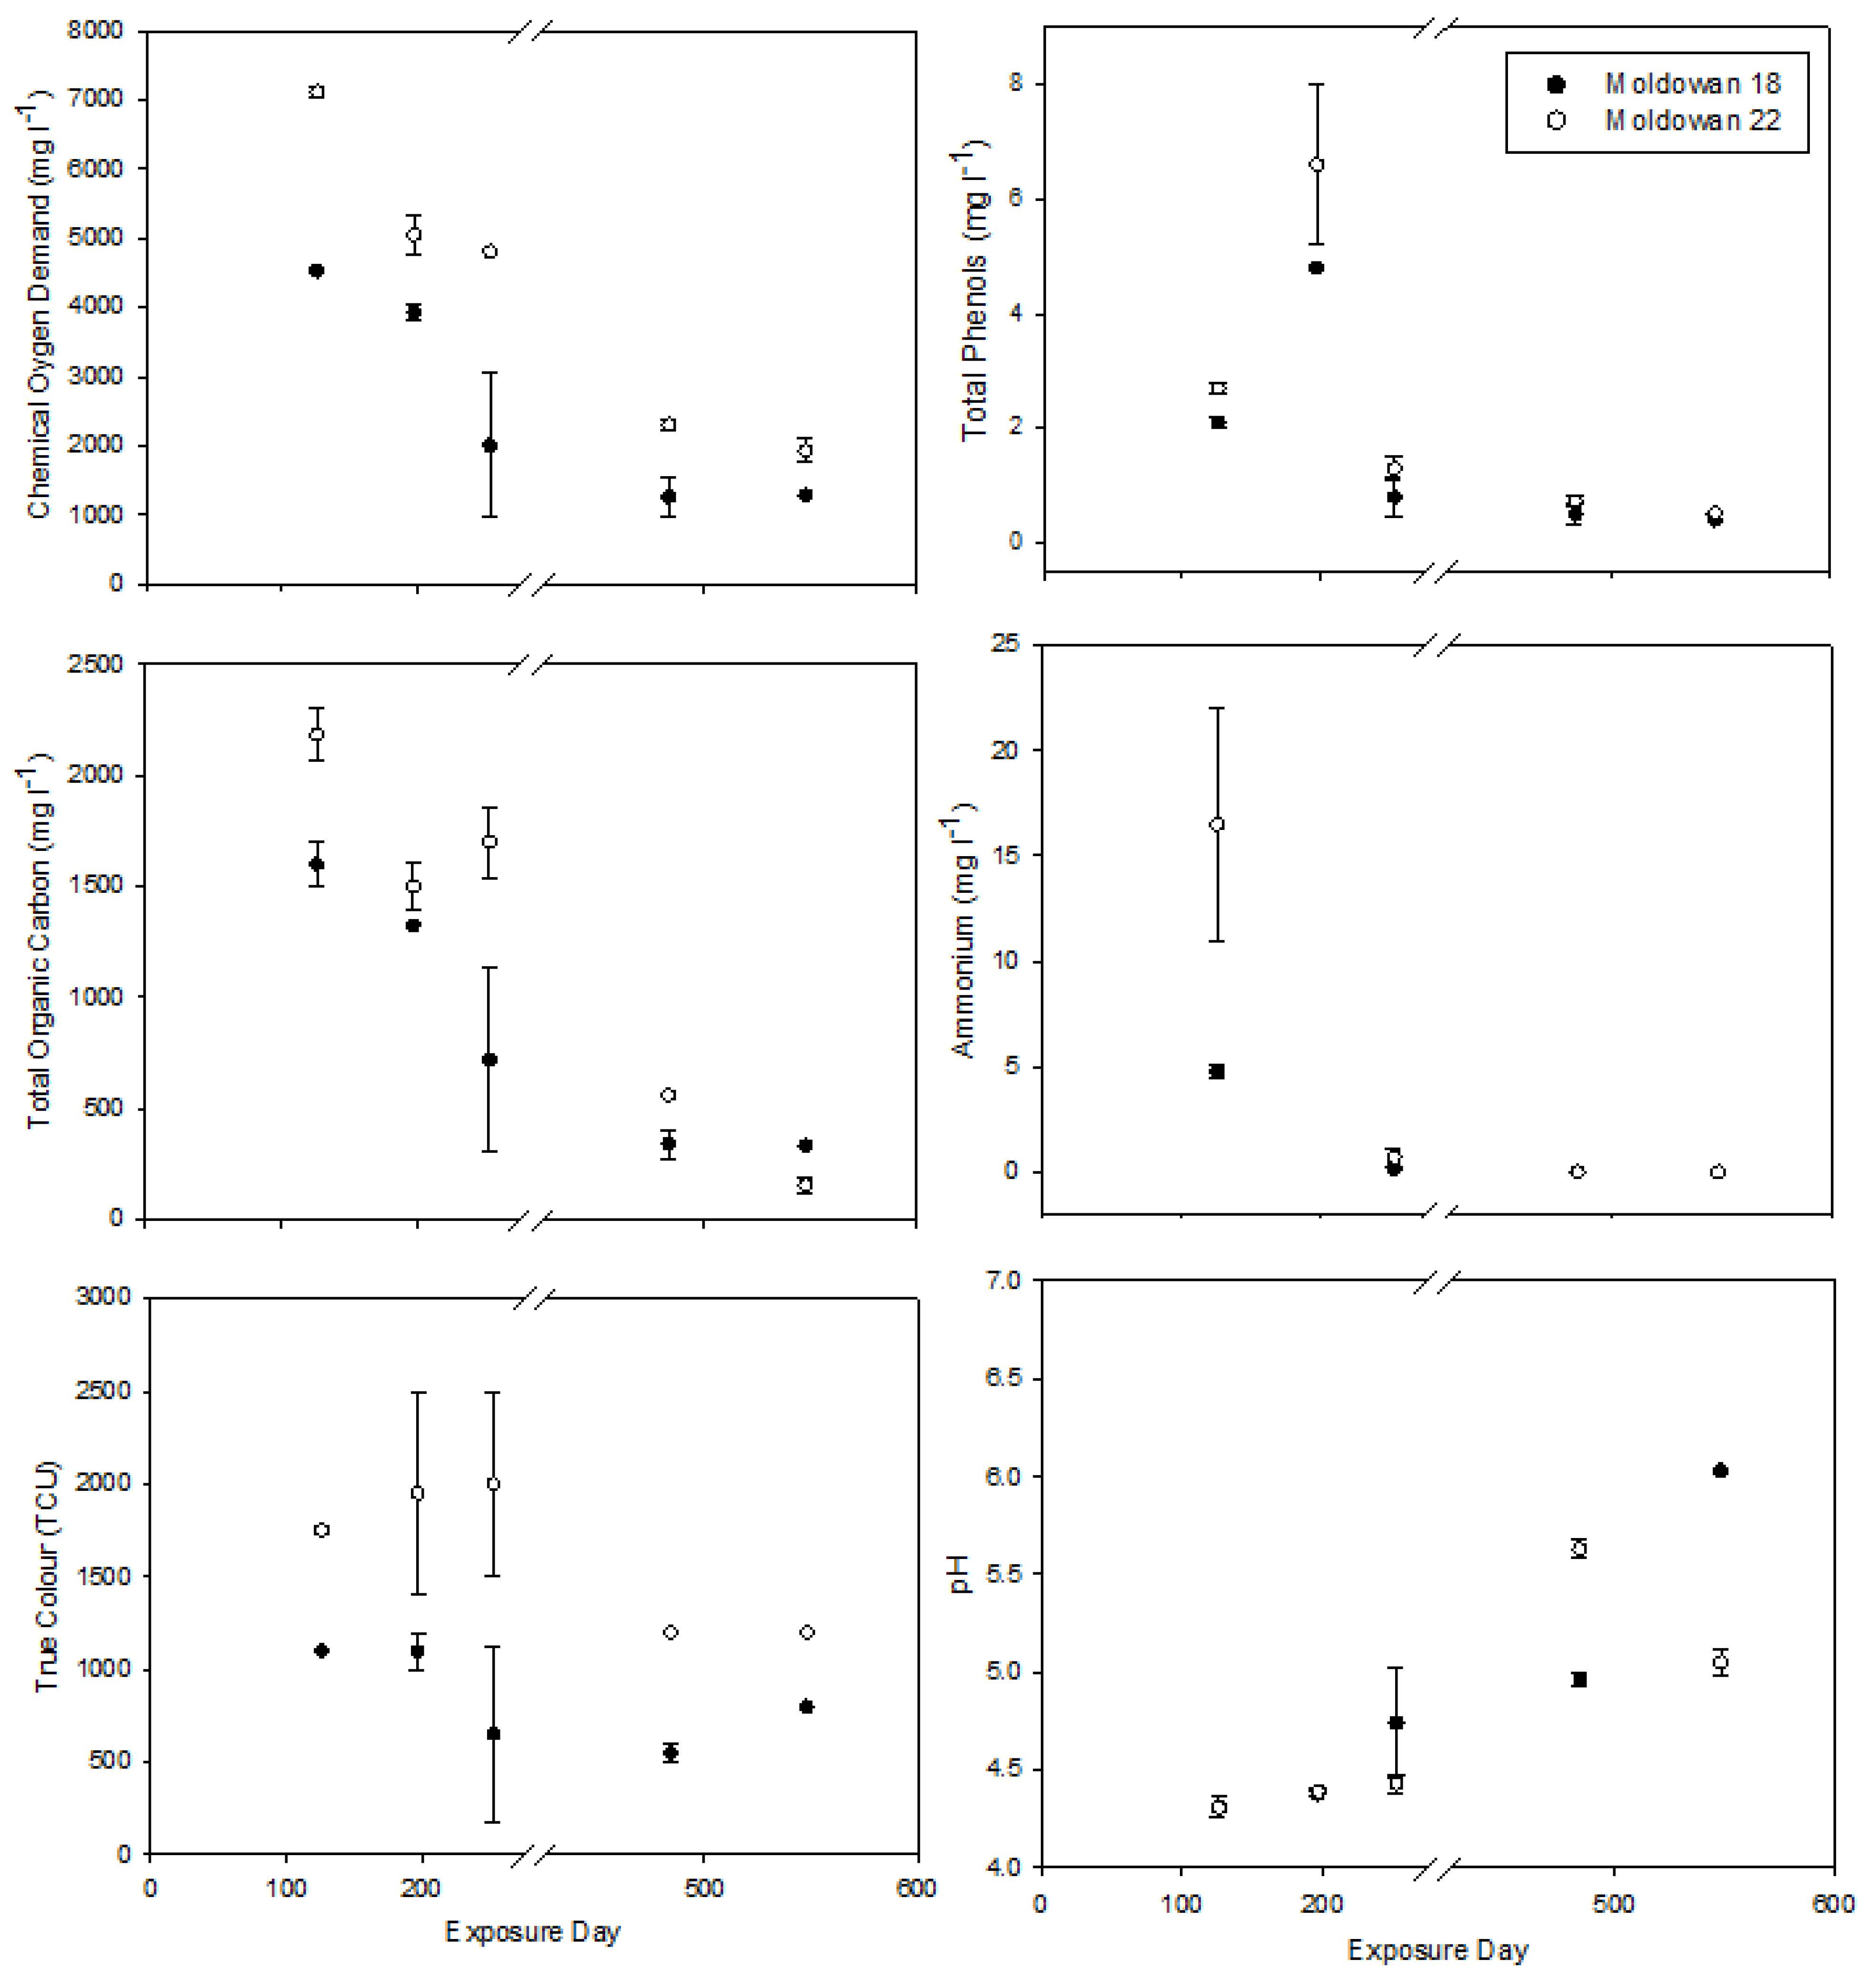
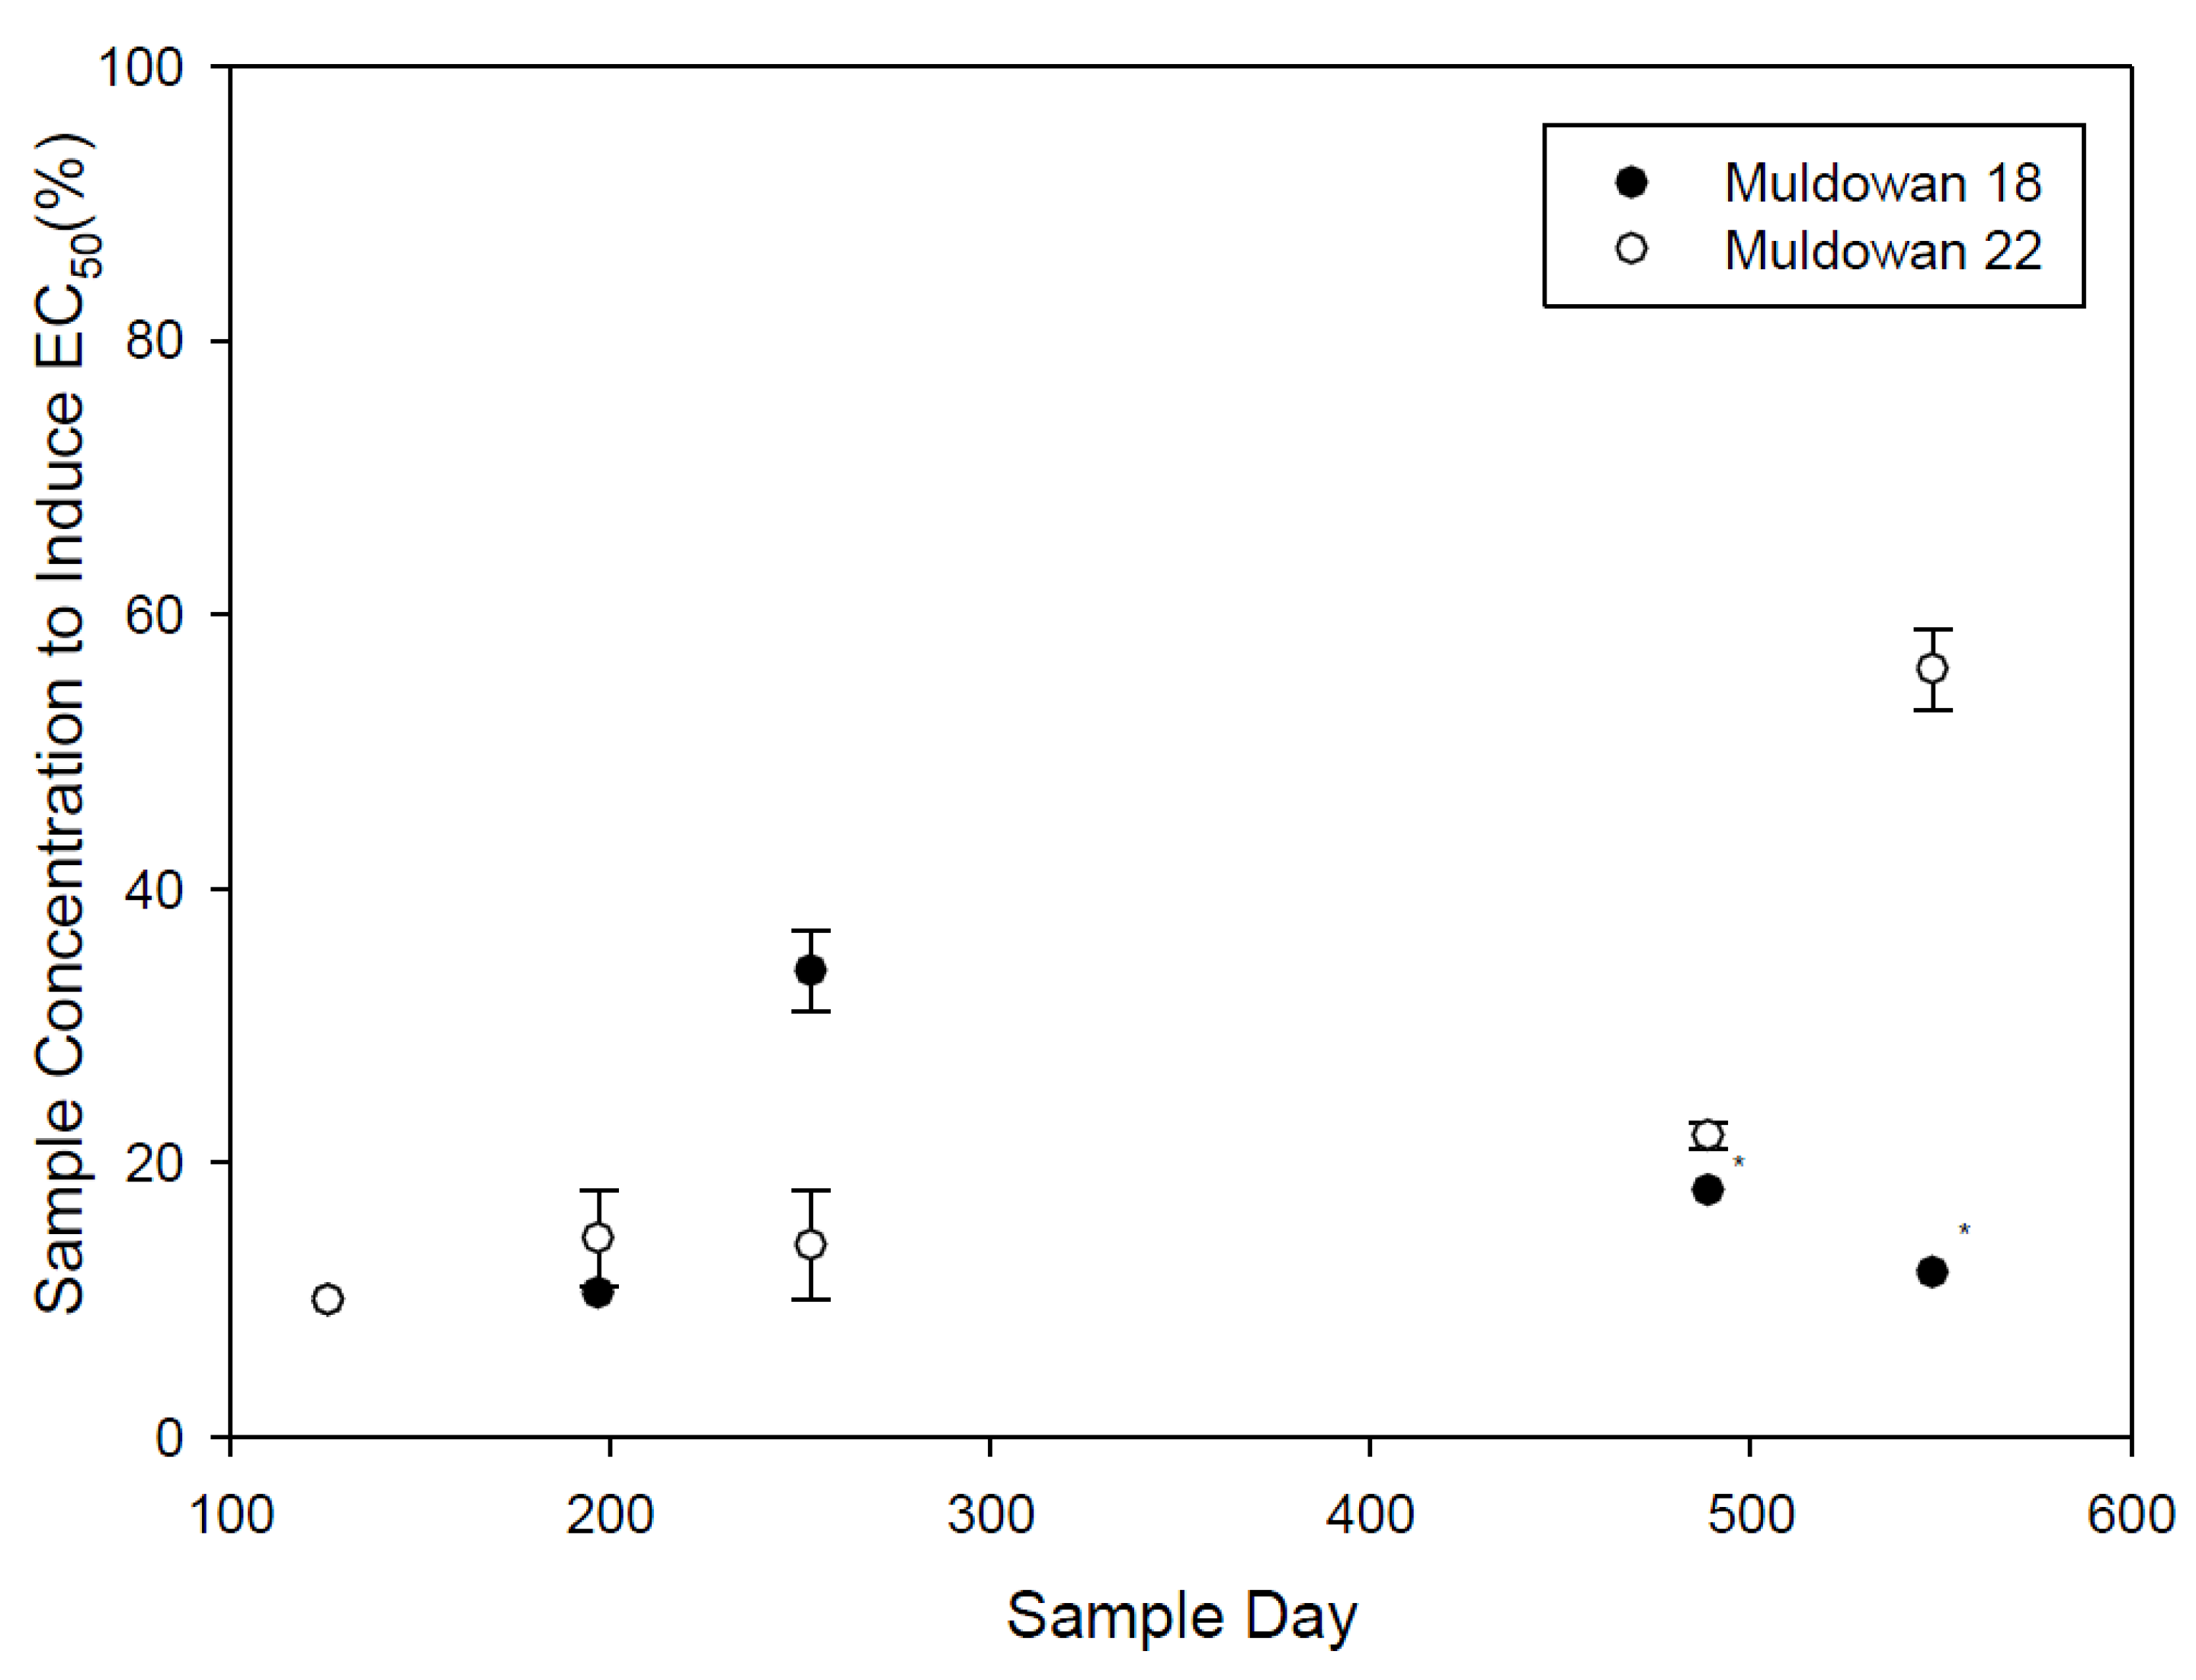
3.1. Operational Samples
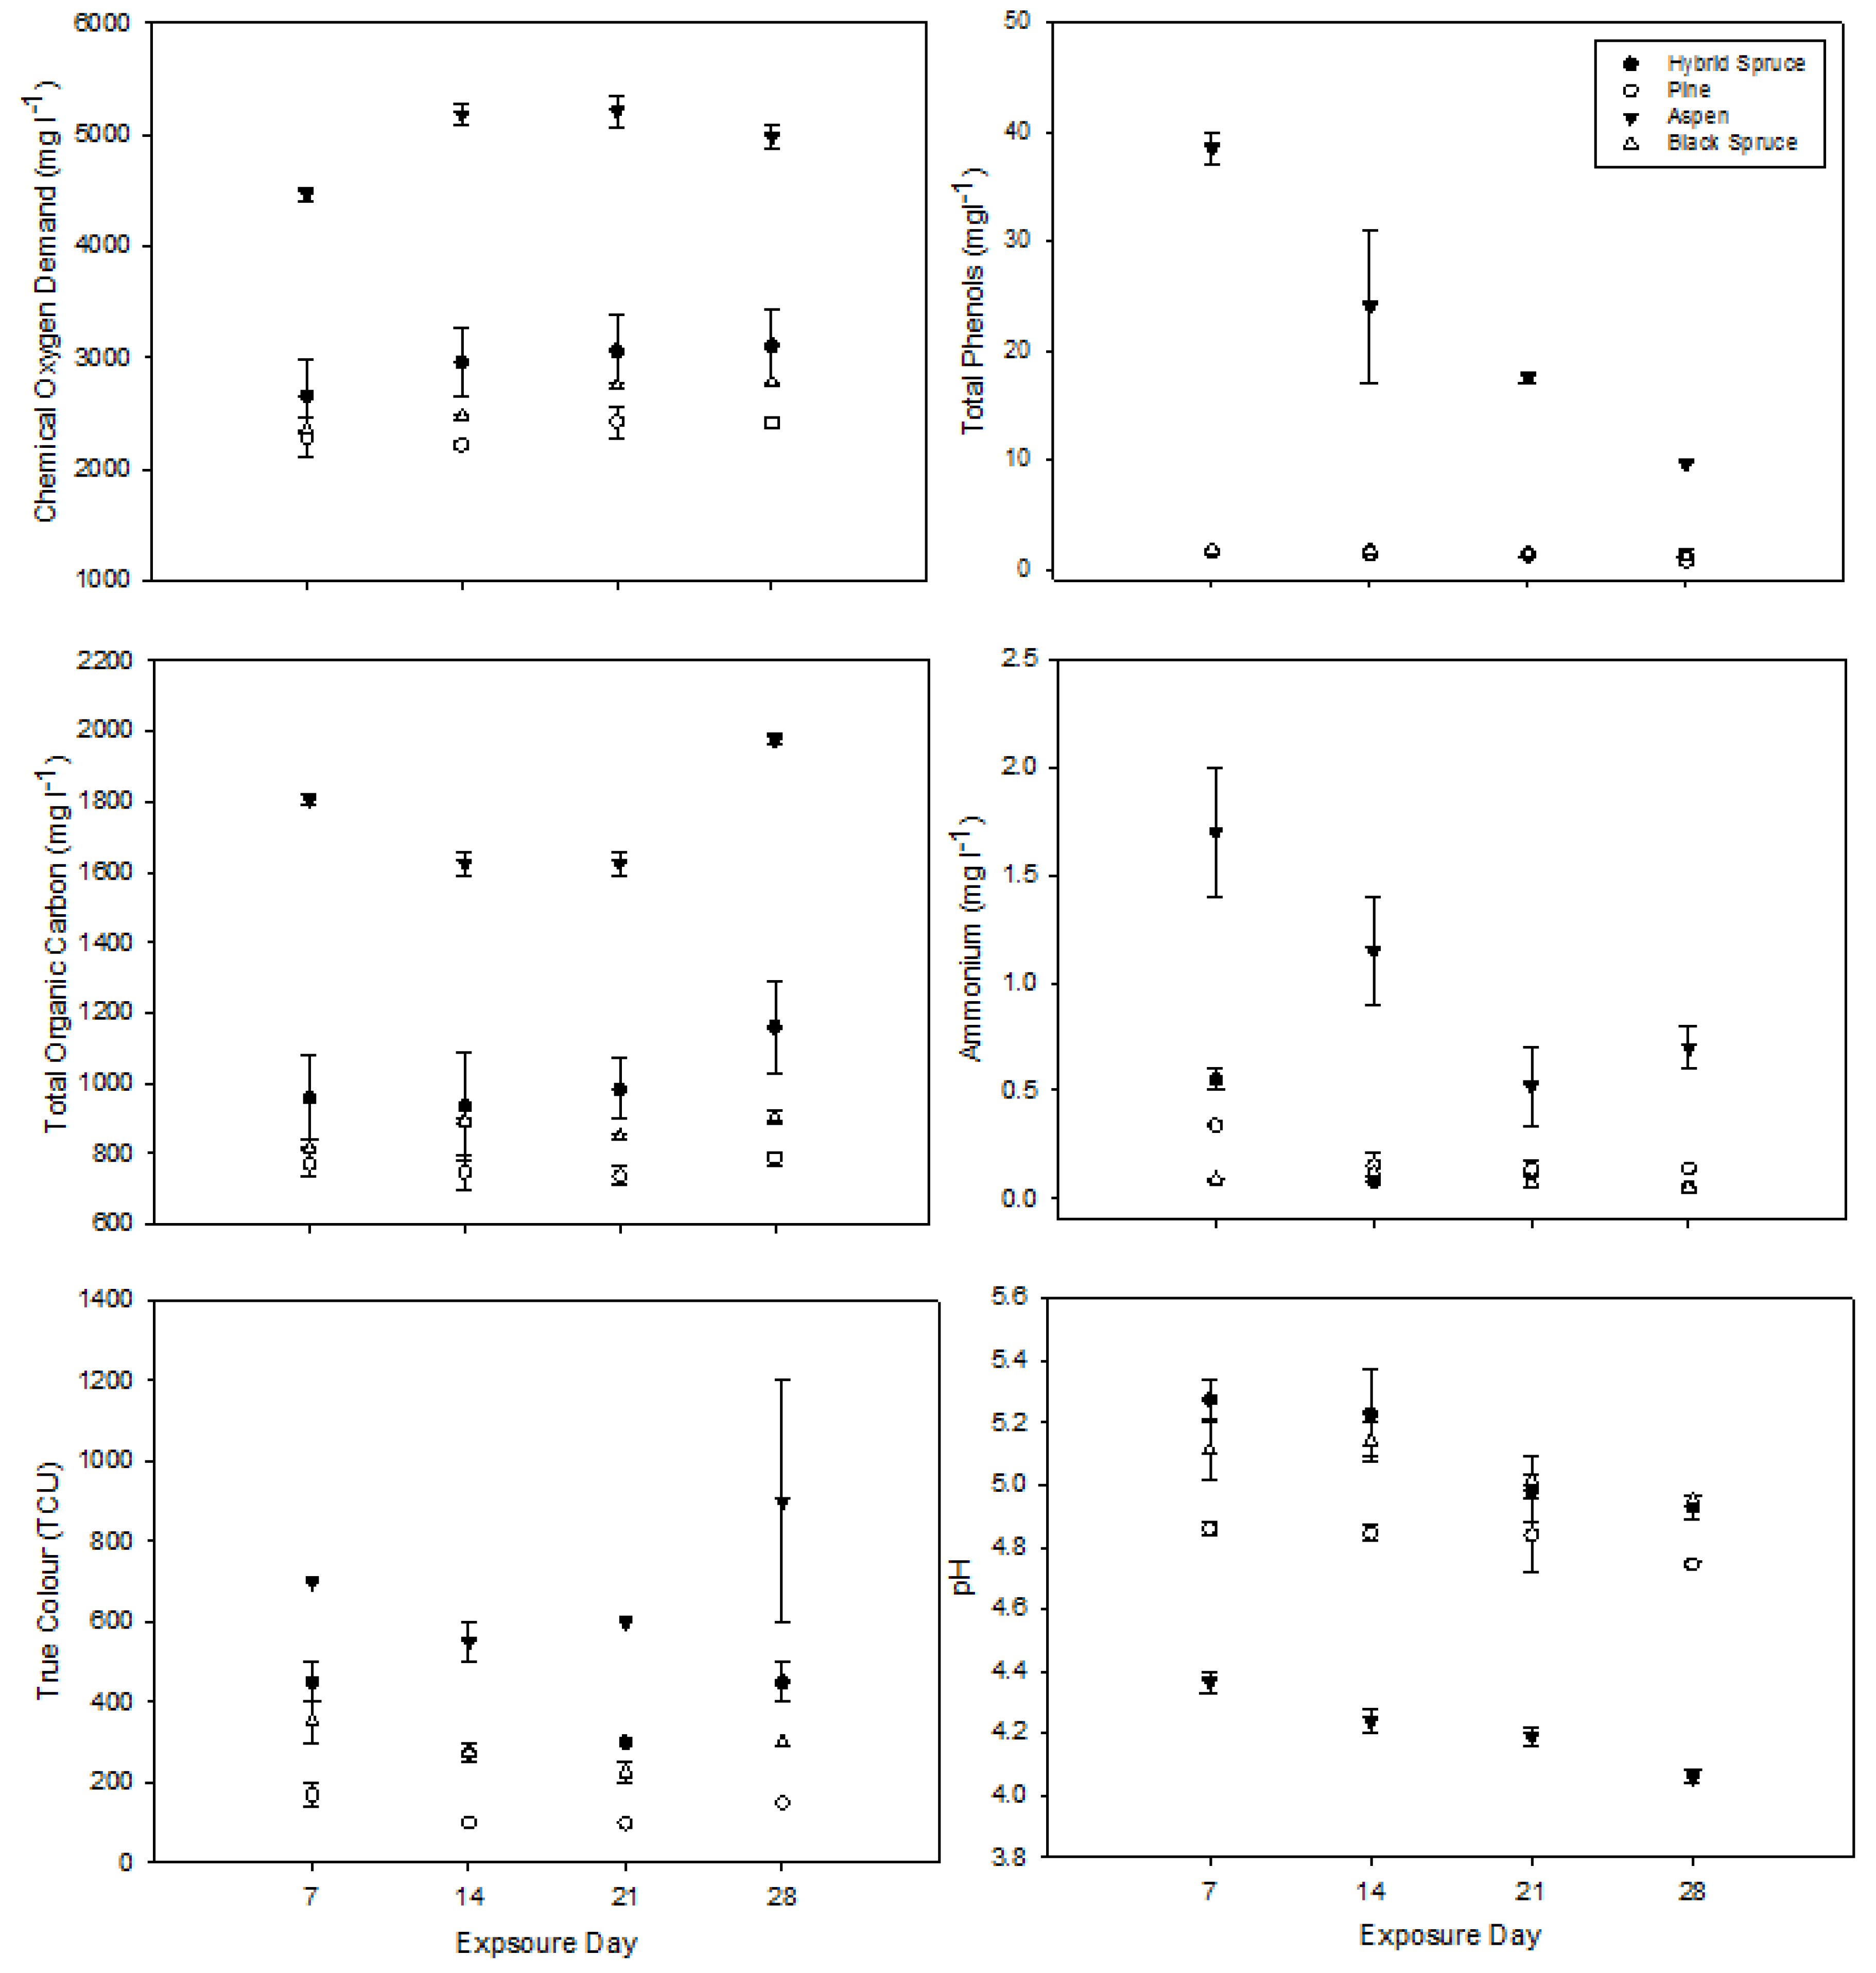
Operational samples showed some difference in chemistry between parameters and sites over the 548-day exposure period (Figure 2). The COD levels in leachate samples drawn from larger chips at Muldowan 18 are significantly lower than those those drawn from the smaller chips at Muldowan 22 (Mann-Whitney U = 18.0, p = 0.03). There is also a temporal decline with final COD levels that are approximately 25% those of the initial readings. Higher surface area to volume ratio of the smaller chips contributed to greater COD at Muldowan 22 [27]. Elevated COD levels are associated with increased toxicity as shown by previous work with aspen leachate [7,23], pulp mill effluent [28,29] and municipal landfill leachates [28,30]. True color also differed between sites, with the smaller chips from Muldowan 22 producing more highly colored leachate than the larger chips from Muldowan 18 (Mann-Whitney U = 1.00, p = 0.001) Although there were no significant difference in phenols between samples, there was an increase in phenols at both sites during the first spring sampling followed by a decreased over the remaining sampling period. The spring sample was collected after snowmelt when the majority of chips in the container were underwater and contributing leachate to the solution. Hedmark and Scholz [5] identified that leachate increased with more exposure of wood to water while Taylor and Carmichael [7] noted a positive correlation between the generation of aspen leachate and precipitation. The remaining parameters of ammonia and pH showed no difference between sites but generally followed similar trends of decreasing ammonia and increasing pH over time. The latter observation is similar to findings from Taylor et al. [23], who noted pH levels in aspen leachate became less acidic with increased exposure time.
Figure 2. Operational site leachate conditions during the 548-day exposure period. Error bars represent standard error (n = 2).
Forests 07 00040 g002
Organic compounds decreased over the exposure period but remained quite high (COD > 1000 mg·L−1, TOC > 500 mg·L−1 and color > 500 TCU). Accordingly, remnant chip piles from spillage or equipment cleaning can be a long-term source of dissolved organics to receiving streams; high concentrations of organic compounds in streams may lower dissolved oxygen levels. High COD [31] or COD in combination with other chemical concentrations [32] is associated with aquatic toxicity.
Due to the availability of only one toxicity sample for Muldowan 18 during the final two sample dates, no statistical analysis was conducted; however, it can be seen that there is some variability between samples but not an obvious pattern. Although statistical comparison is not possible, it is noteworthy that all samples collected over the 580 days of exposure produced a toxic response within the 15-min test period (Figure 3). Accordingly, it is reasonable to suggest that residual chip piles can produce toxic leachate for close to two years following biomass operations, if not longer. Similarly, Taylor and Carmichael [7] noted that an 18-m3 aspen log pile produced toxic leachate after two years and that only 10% of leachable material had been removed from the pile over the two-year exposure period. Although our piles consisted of chips not logs, and conifers not angioperms, and were considerably smaller at approximately 0.33 m3, our findings agree with others and indicate the potential for leachate generation where wood chip or log piles exist.
Figure 3. Microtox EC50 for operational samples, error bars are standard error (n = 2), last two sample periods for Muldowan 18 only consisted of 1 sample.
Forests 07 00040 g003

3.2. Static Samples

Coniferous leachate chemistry was relatively consistent over the 28-day exposure period with pine samples generally being lower than the two spruce samples for all parameters (Figure 4). Aspen leachate was significantly higher for all measured parameters except pH, which was significantly lower than any of the coniferous samples (Figure 4, Table 2). Aspen phenols, pH, and ammonium decreased over the 4-week sampling period. All leachate samples showed a consistent toxicity response over the 4-week period, with each sample being toxic at concentrations less than 10% by volume.
Figure 4. Static leachate chemical conditions over the 28-day sample period. Bars represent standard error (n = 2).
Forests 07 00040 g004
Table 2. Kruskal-Wallis summary statistics to identify differences between tree species across the 4-week sample period (df = 3).
ParameterKruskal-Wallis Test and p-ValueSum of Ranks
Total Organic CarbonK − W = 25.98, p = 0Aspen > Black Spruce > Hybrid Spruce > Pine
Chemical Oxygen DemandK − W = 23.01, p = 0Aspen > Hybrid Spruce > Black Spruce > Pine
True ColorK − W = 27.07, p = 0Aspen > Hybrid Spruce > Black Spruce > Pine
PhenolK − W = 25.24, p = 0Aspen > Black Spruce > Pine > Hybrid Spruce
AmmoniaK − W = 19.3, p = 0Aspen > Hybrid Spruce > Black Spruce > Pine
pHK − W = 23.01, p = 0Hybrid Spruce > Black Spruce > Pine > Aspen

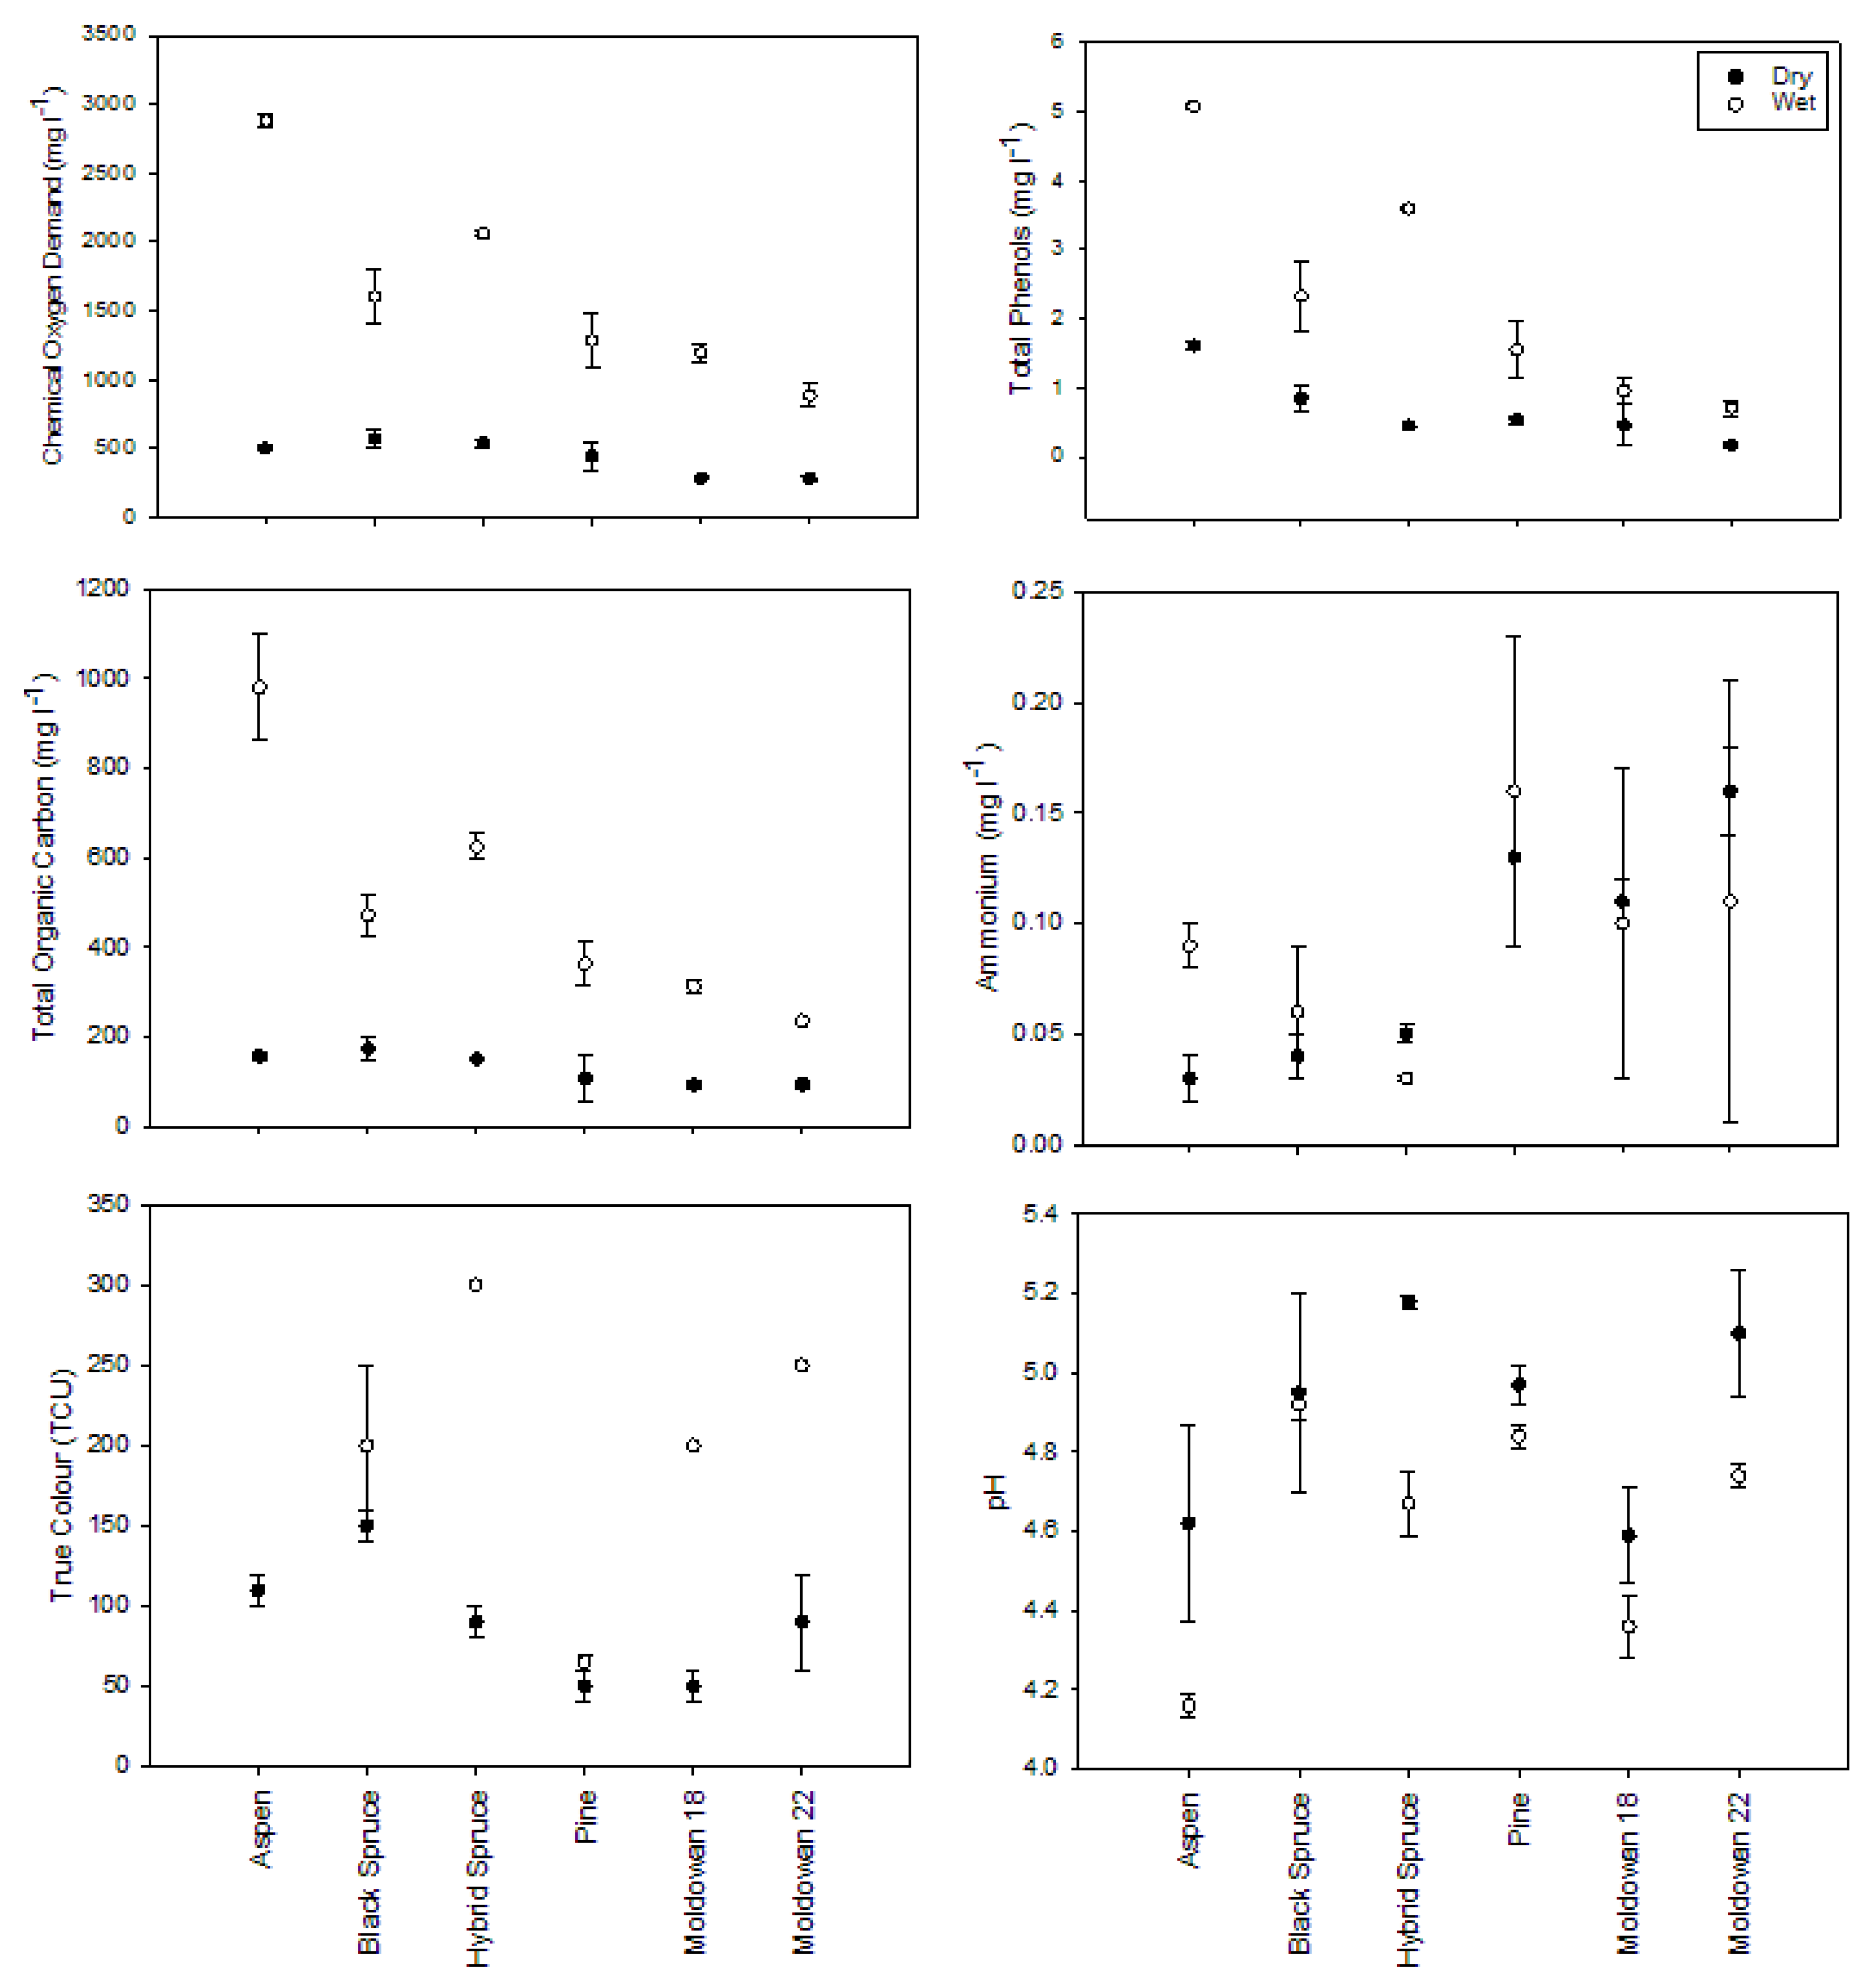
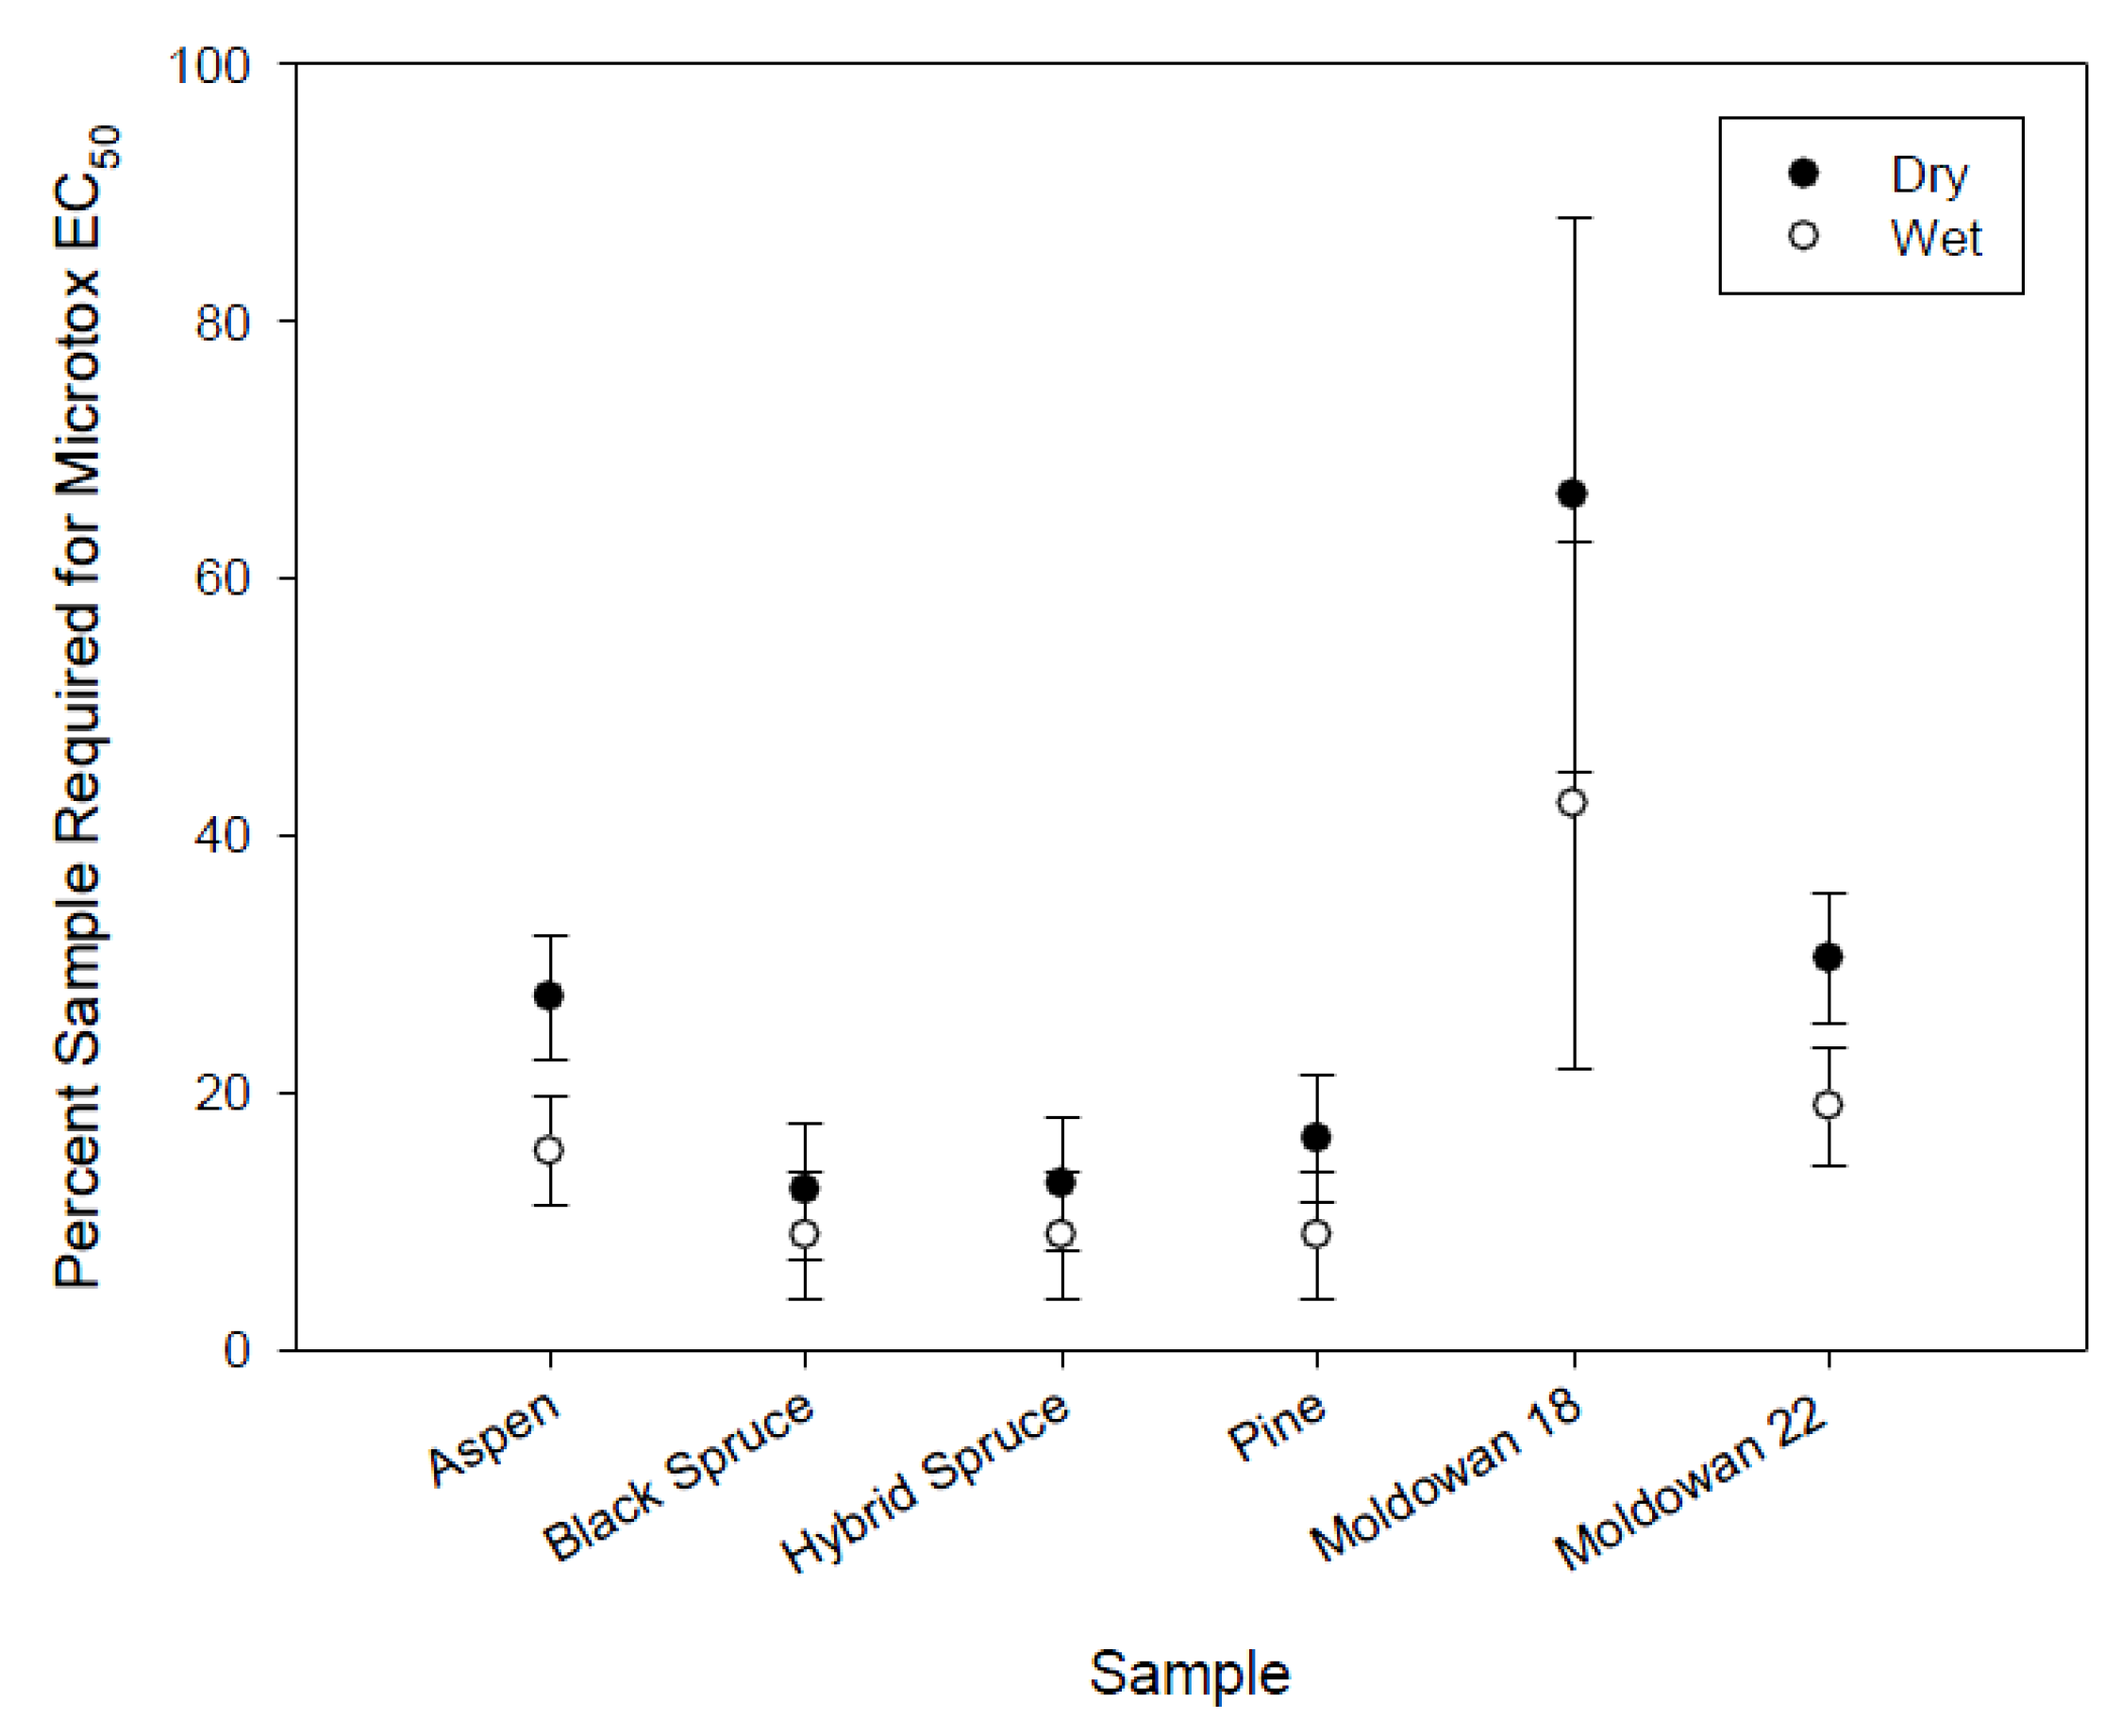
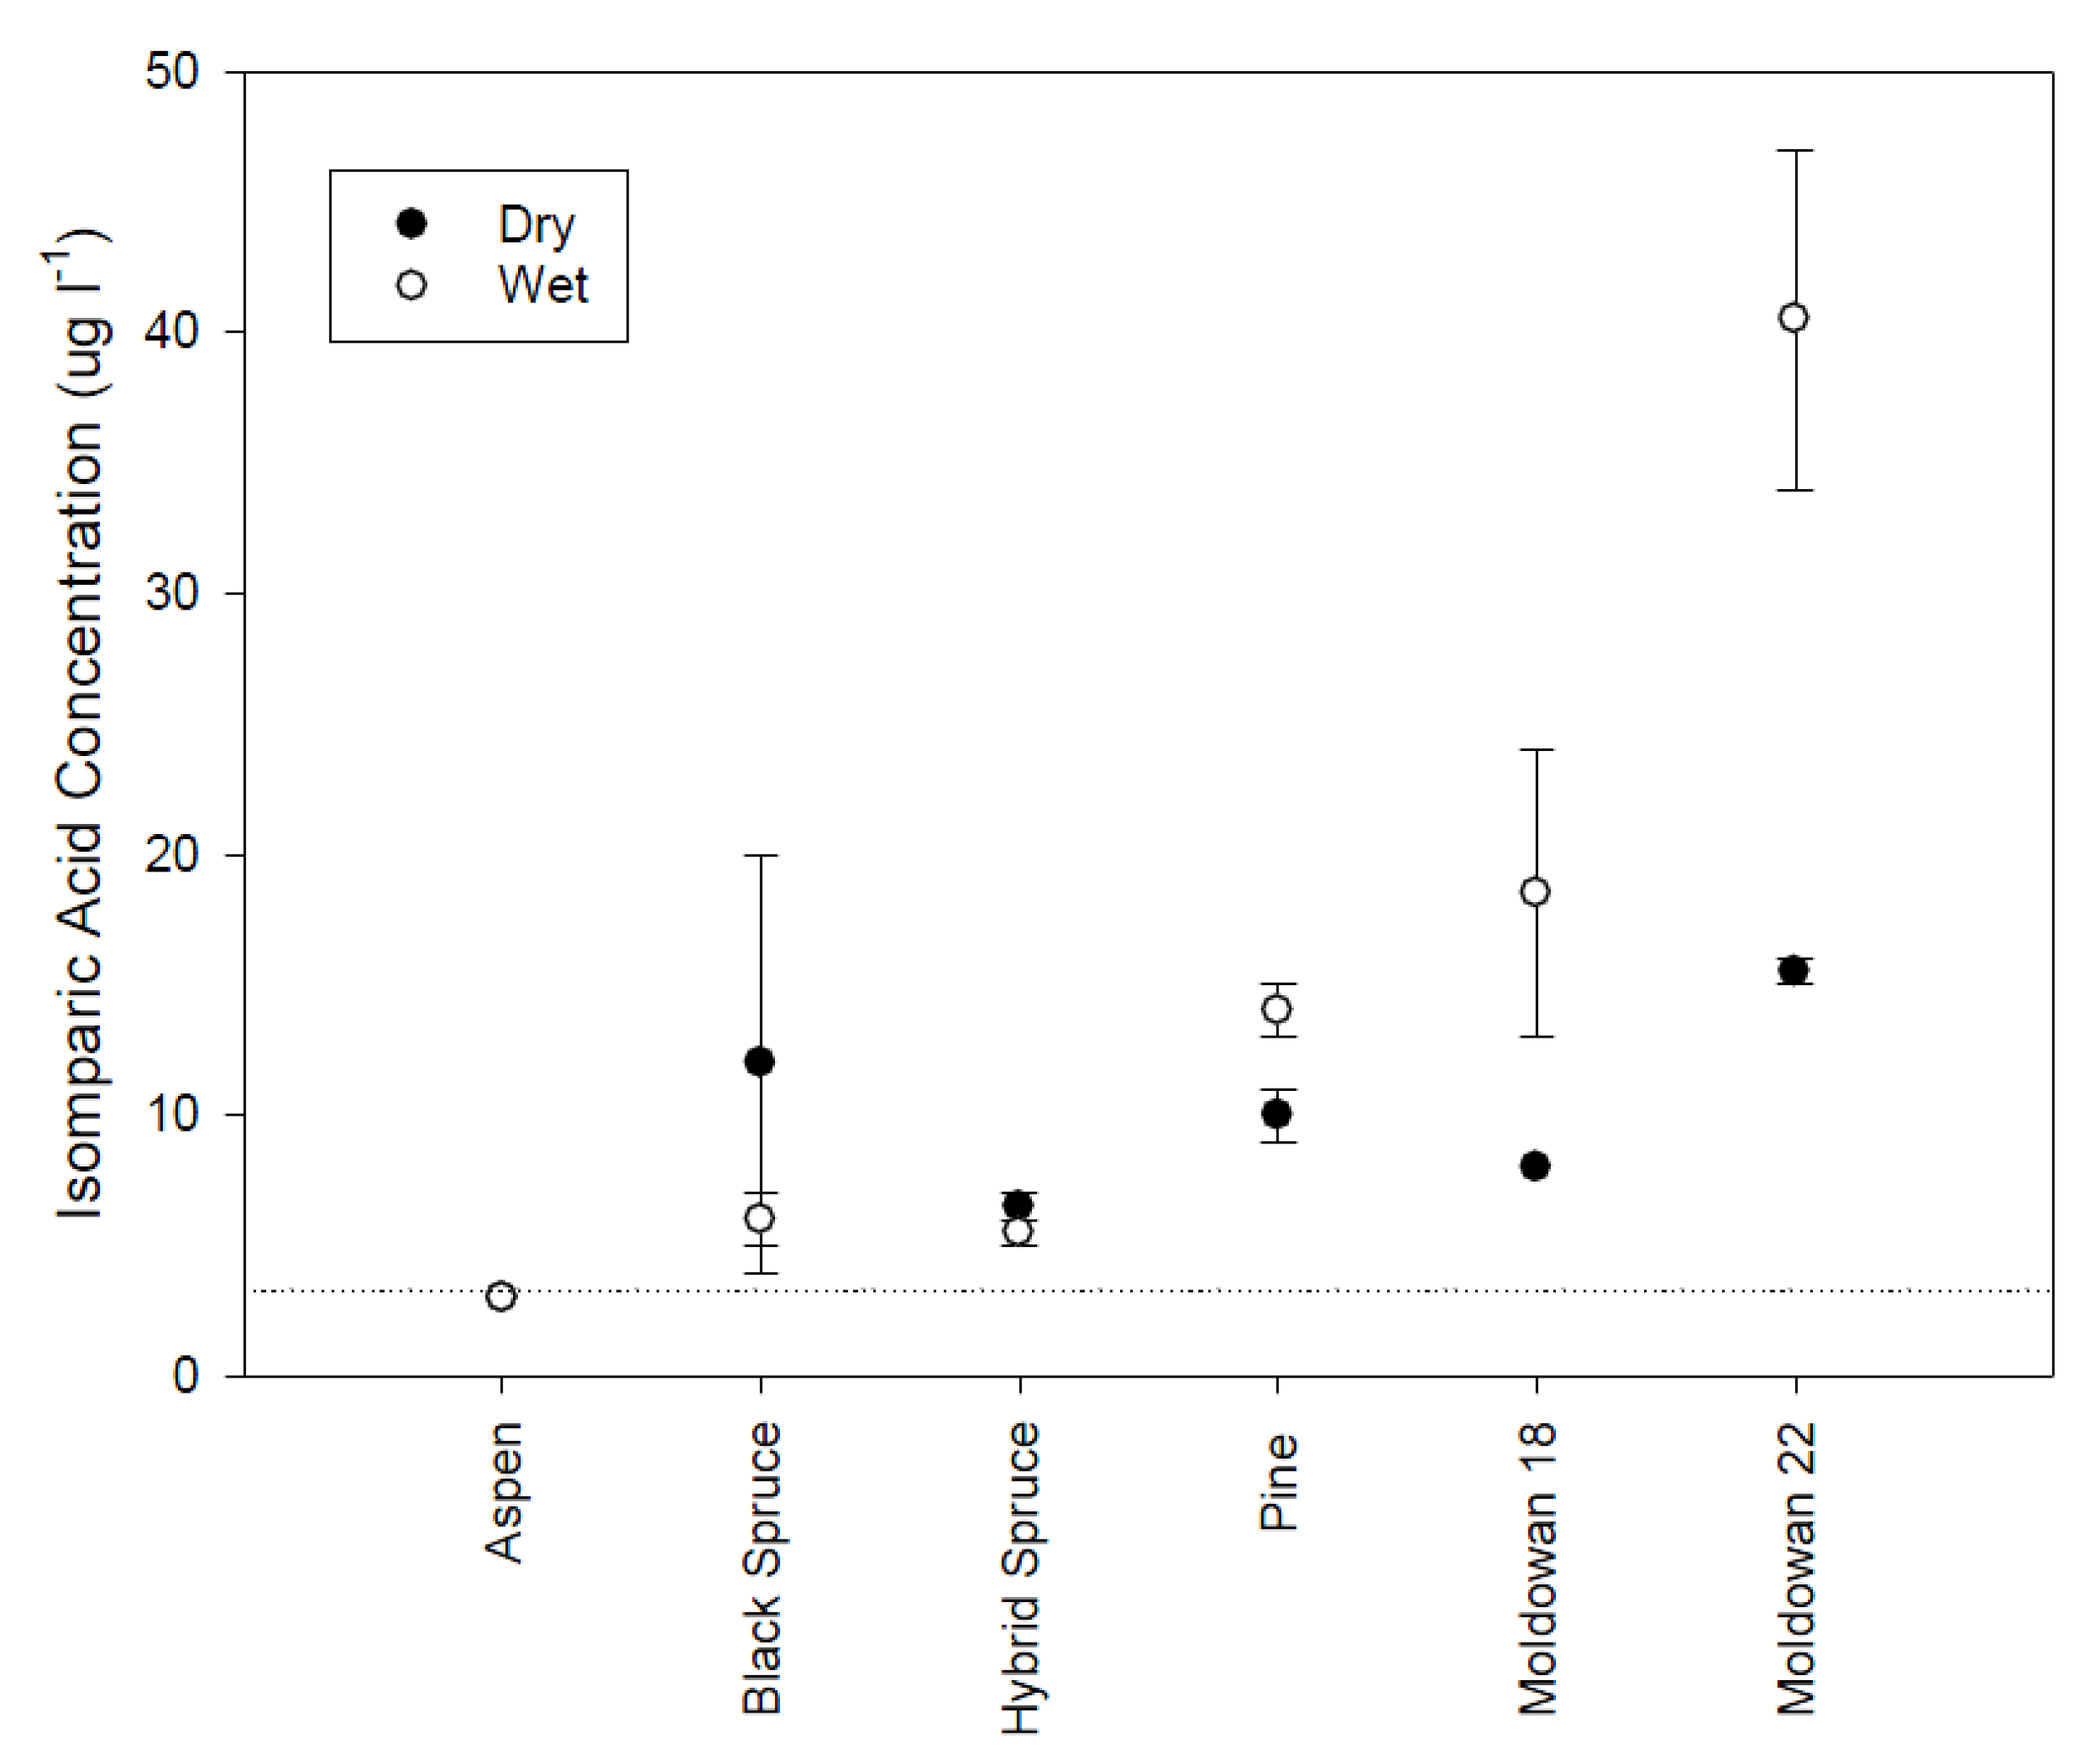
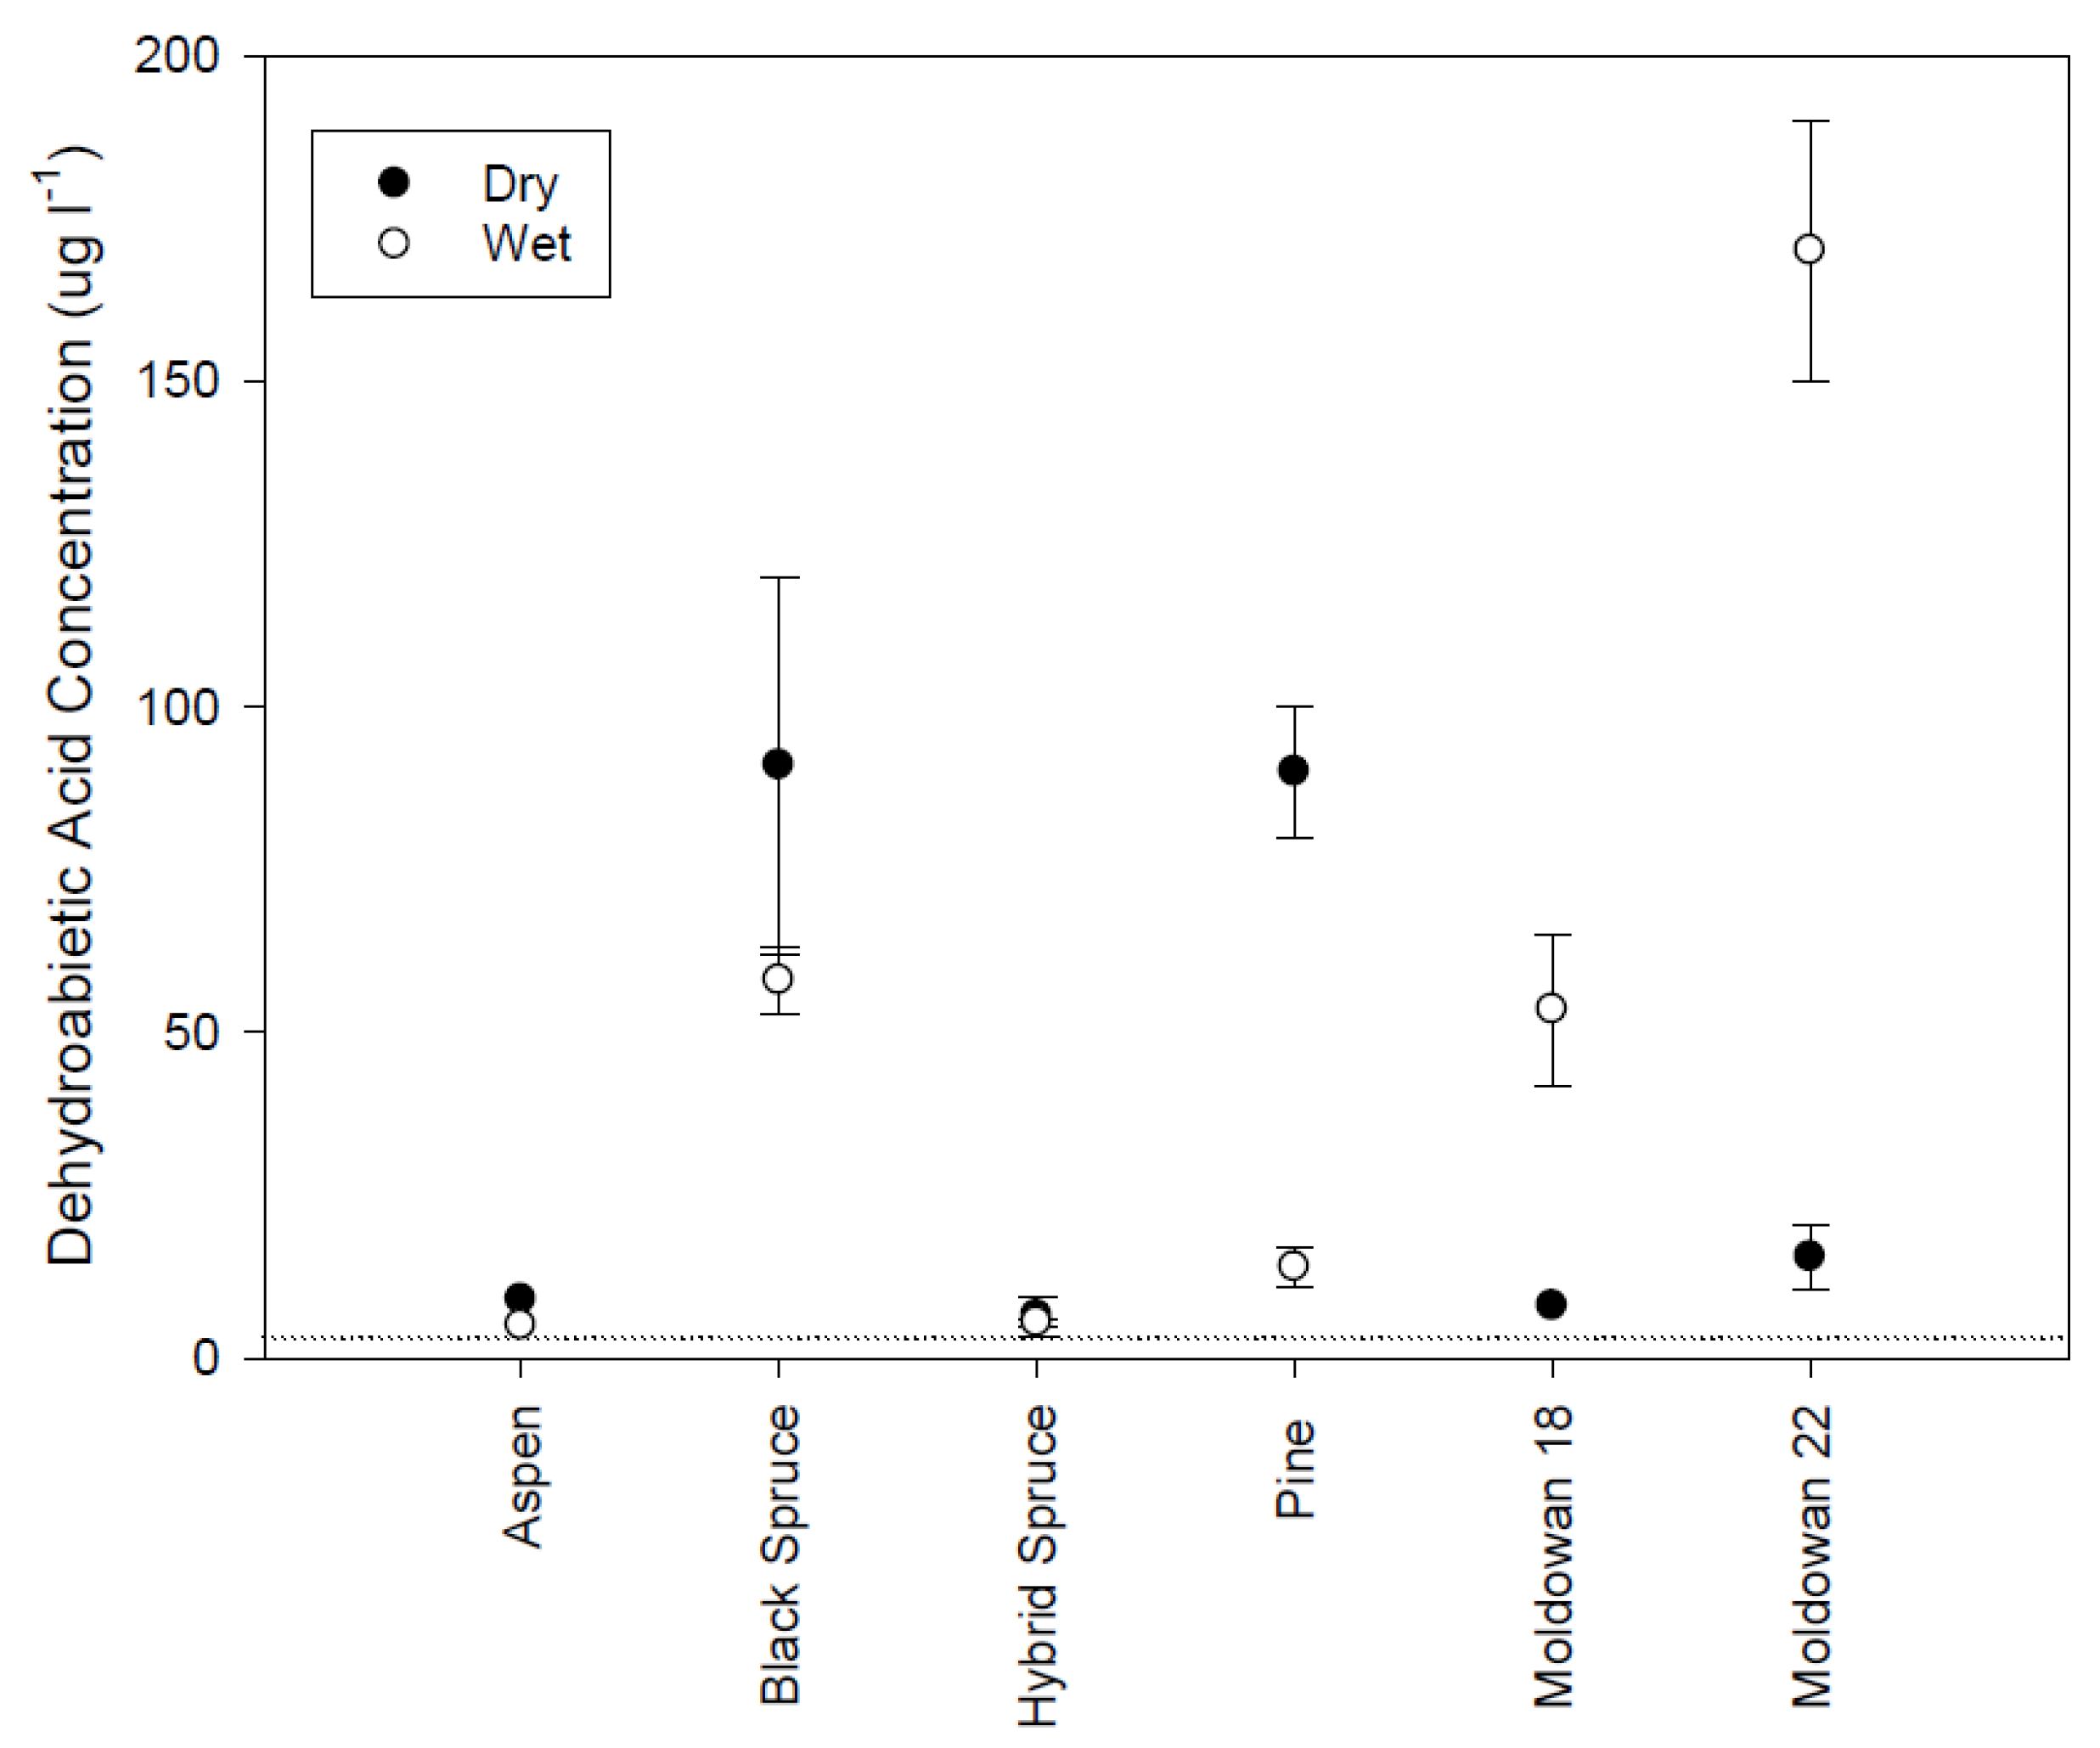
3.3. Rainfall Simulations

Wood chip moisture levels increased considerably over the 1-h rainfall event with an observed range of approximately 19% to 28% moisture increase by volume (Table 3). Aspen moisture level increase was less than that of the coniferous species. Pine showed the highest increase in moisture content by species and the operational samples all exhibited the highest starting moisture content for the wet sample run. Coniferous wood chips generally lost a small amount of moisture compared to their starting condition over the course of the wet sample run (Table 3). This observation appears to be counterintuitive but may be due to differences between deciduous and coniferous wood chips as well as the loss of moisture by coniferous wood chips inside the pile that were not being wetted by precipitation during the rainfall simulation. Wet chip samples generally produced a leachate that had higher concentrations of measured chemical characteristics except for ammonia where data were variable and standard errors overlap (Figure 5), but not all differences were statistically significant (Table 4). In the dry condition, wood chips produced leachate that was relatively similar across tree species whereas in the wet condition, aspen leachate was generally of higher concentration for each parameter except pH, which was lower; true color was not measured.
Table 3. Wood chip moisture mean levels for dry and saturated runs as well as moisture gained (n = 10) in the rainfall simulation experiment. Value provided in parentheses is the standard error.
SampleConditionStarting Moisture (%) *Moisture Gained (%)
Moldowan 18Dry0.028.0
Moldowan 18Saturated36.6 (5.4)−1.3
Moldowan 22Dry0.019.8
Moldowan 22Saturated37.1 (1.9)0.1
PineDry0.027.2
PineSaturated34.2 (3.7)−2.4
Hybrid SpruceDry0.020.5
Hybrid SpruceSaturated34.2 (0.7)−2.9
Black SpruceDry022.3
Black SpruceSaturated33.3 (2.6)−1.0
AspenDry0.019.2
AspenSaturated30.4 (1.5)5.3
* Immediately following drying, wood chips had starting moisture levels of 0% but are expected to equilibrate to 3%–5% upon cooling and exposure to atmosphere.
Table 4. Mann-Whitney U-Test statistic and p-value for wet and dry samples.
ParameterMann-Whitney U test and p-Value
Total Organic CarbonMann-Whitney U = 0, p =0
Chemical Oxygen DemandMann-Whitney U = 0, p = 0
True ColorMann-Whitney U = 0, p = 0
PhenolMann-Whitney U = 41, p = 0.001
AmmoniaMann-Whitney U = 128, p = 1
pHMann-Whitney U = 174, p =0
Coniferous leachate samples generated from wet and dry wood chips were similar across species except for the low color values in pine compared to spruce and mixed samples. Overall, the leachate chemical composition generated from these 1-h rainfall simulations was of the same magnitude as the operational samples and was also similar to the 28-day static samples.
There was no significant difference in the toxicity of leachate between dry and wet exposures within tree species (Figure 6) or among tree species. However, the dry-chip Muldowan 18 leachate samples required a higher concentration to induce toxicity compared to the wet sample as well as all other samples. As noted earlier, this may be the result of differences in chip size. Muldowan 18 chips were larger than Muldowan 22 chips and produced leachate that was of a slightly different chemical composition as noted for both COD and color.
Figure 5. Rainfall simulation leachate chemical conditions for dry and wet wood chips. Bars represent standard error (n = 2).
Forests 07 00040 g005
Isopimaric (IA) and dehydrobietic acid (DHAA) responded similarly to the rainfall simulation conditions. DHAA concentrations were higher than IA levels (Figure 7 and Figure 8). Isopimaric acid concentrations differed significantly across tree species with higher concentrations originating from the operational and pine wood chips than the spruce and aspen samples (H(5) = 17.84, p = 0.003). There was no significant difference in IA levels between wood chip moisture conditions (Mann-Whitney U = 64.50, p = 0.66). Aspen did not have detectable levels of isopimaric acid while coniferous samples were similar but the highest concentrations were found in the operational samples, particularly when leachate was generated from wet chips. DHAA concentrations were also significantly different across tree species (H(5) = 18.93, p = 0.002) with aspen and hybrid spruce exhibiting the lowest concentrations while Muldowan 18 black spruce and pine had the highest. Although DHAA concentrations appear to be higher for dry chips, there is no significant difference (Mann-Whitney U = 80, p = 0.64). Isopimaric and DHAA levels are similar to the concentrations previously identified as initiating a toxicity response [12,13] and likely influenced the toxicity response for rainfall samples.
Figure 6. Microtox EC50 mean values for rainfall simulation including standard error bars (n = 2).
Forests 07 00040 g006
Figure 7. Mean isopimaric acid concentrations and standard error (n = 2) for different tree species and wood chip moisture conditions. Dashed line represents limit of detection.
Forests 07 00040 g007
Figure 8. Mean dehydrobaietic acid concentrations and standard error (n = 2) for different tree species and wood chip moisture conditions. Dashed line represents limit of detection.
Forests 07 00040 g008

4. Conclusions

Six types of wood chips were assessed over an array of tests during this study. Aspen chips produced the most acidic leachate with higher organic, phenolic, and ammonia concentrations compared to the coniferous and mixed samples. Coniferous samples showed some subtle differences with the spruce samples being more similar to each other than they were to pine. Regardless of the treatment type, i.e., operational, static, or rainfall simulation, the wood chip source produced leachate that was toxic to V. fischeri in Microtox™. Resin acid concentrations for isopimaric and DHAA, both known to be highly toxic, were lowest in aspen. This indicates that either the high organic component of the leachate or the combination of organic compounds and resin acids is responsible for the toxicity response. Consequently, by analogy residue, the storage chip piles, which tend to have higher quantities of wood chips than those used here, have the capacity to release leachate quickly and for an extended period of time. These findings indicate the need for chip piles and their leachate runoff to be disconnected from streams by diverting ditch lines and potential sites of surface runoff during development and maintenance activities.

Acknowledgments

The authors would like to acknowledge funding provided by a BC Government Innovative projects fund. We would also like to thank Eiji Matsuzaki for field support. We would also like to thank Ljiljana Knezevic for providing field sites as well as Pine Star and IFS for processing wood samples for this study.

Author Contributions

John Rex and Stephane Dube conceived and designed experiments; John Rex and Phillip Krauskopf performed the experiments; John Rex and Phillip Krauskopf analyzed the data; all authors contributed to writing the paper.

Conflicts of Interest

The authors declare no conflict of interest.

References

  1. Food and Agricultural Organization of the United Nations. Forests and Energy: Key Issues; FAO Forestry Paper 154; FAO: Rome, Italy, 2008; p. 73. [Google Scholar]
  2. Janowik, M.K.; Webster, C.R. Promoting ecological sustainability in woody biomass harvesting. J. For. 2010, 108, 16–23. [Google Scholar]
  3. Stennes, B.K.; McBeath, A. Bioenergy Options of Woody Feedstock: Are Trees Killed by Mountain Pine Beetle in British Columbia a Viable Bioenergy Resource? Pacific Forestry Centre: Victoria, BC, Canada, 2006; p. 38. [Google Scholar]
  4. Orban, J.L.; Kozak, R.A.; Sidle, R.C.; Duff, S.J. Assessment of relative environmental risk from logyard run-off in British Columbia. For. Chron. 2002, 78, 146–151. [Google Scholar] [CrossRef]
  5. Hedmark, Å.; Scholz, M. Review of environmental effects and treatment of runoff from storage and handling of wood. Bioresour. Technol. 2008, 99, 5997–6009. [Google Scholar]
  6. Tao, W.; Hall, K.J.; Masbough, A.; Frankowski, K.; Duff, S.J. Characterization of leachate from a woodwaste pile. Water Qual. Res. J. Can. 2005, 40, 476–483. [Google Scholar]
  7. Taylor, B.R.; Carmichael, N.B. Toxicity and chemistry of aspen wood leachate to aquatic life: Field study. Environ. Toxicol. Chem. 2003, 22, 2048–2056. [Google Scholar] [CrossRef] [PubMed]
  8. Kabzems, R.; Dube, S.; Curran, M.; Chapman, B.; Berch, S.; Hope, G.; Kranabetter, M.; Bulmer, C. Maintaining Soil Productivity in Forest Biomass Chipping Operations Best Management Practices for Soil Conservation; Forest Science Program: Victoria, BC, Canada, 2011; p. 10. Available online: www.for.gov.bc.ca/hfd/pubs/Docs/En/En98.htm (accessed on 8 August 2015).
  9. Libralato, G.; Losso, C.; Ghirardini, A.V. Toxicity of untreated wood leachates towards two saltwater organisms (Crassostrea gigas and Artemia franciscana). J. Hazard. Mater. 2007, 144, 590–593. [Google Scholar] [CrossRef] [PubMed]
  10. Machrafi, Y.; Prévost, D.; Beauchamp, C.J. Toxicity of phenolic compounds extracted from bark residues of different ages. J. Chem. Ecol. 2006, 32, 2595–2615. [Google Scholar] [CrossRef] [PubMed]
  11. Wilson, A.E.; Moore, E.R.; Mohn, W.W. Isolation and characterization of isopimaric acid-degrading bacteria from a sequencing batch reactor. Appl. Environ. Microbiol. 1996, 62, 3146–3151. [Google Scholar] [PubMed]
  12. Peng, G.; Roberts, J.C. Solubility and toxicity of resin acids. Water Res. 2000, 34, 2779–2785. [Google Scholar] [CrossRef]
  13. Lahdelma, I.; Oikari, A. Resin acids and retene in sediments adjacent to pulp and paper industries. J. Soil. Sediment. 2005, 5, 74–81. [Google Scholar] [CrossRef]
  14. Liss, S.N.; Bicho, P.A.; Saddler, J.N. Microbiology and biodegradation of resin acids in pulp mill effluents: A minireview. Can. J. Microbiol. 1997, 43, 599–611. [Google Scholar] [CrossRef] [PubMed]
  15. Makris, S.P.; Banerjee, S. Fate of resin acids in pulp mill secondary treatment systems. Water Res. 2002, 36, 2878–2882. [Google Scholar] [CrossRef]
  16. Jenkins, B.M.; Bakker, R.R.; Wei, J.B. On the properties of washed straw. Biomass Bioenergy 1996, 10, 177–200. [Google Scholar] [CrossRef]
  17. Miles, T.R.; Miles, T.R., Jr.; Baxter, L.L.; Bryers, R.W.; Jenkins, B.M.; Oden, L. Boiler deposits from firing biomass fuels. Biomass Bioenergy 1996, 10, 125–138. [Google Scholar] [CrossRef]
  18. Khan, A.A.; de Jong, W.; Jansens, P.J.; Splietoff, H. Biomass combustion in fluidized bed boilers: Potential problems and remedies. Fuel Process. Technol. 2009, 90, 17–46. [Google Scholar] [CrossRef]
  19. Rajabzadeh, A.R.; Ruzich, N.; Zendehbouhdi, S.; Rahbari, M. Biomass leachate and nutrient recovery using reverse osmosis: Experimental study and hybrid artificial neural network modeling. Energy Fuels 2012, 26, 7155–7163. [Google Scholar] [CrossRef]
  20. Jenkins, B.M.; Baxter, L.L.; Miles, T.R., Jr.; Miles, T.R. Combustion properties of biomass. Fuel Process. Technol. 1998, 54, 17–46. [Google Scholar] [CrossRef]
  21. Vamvuka, D.; Zografors, D.; Alevizoz, G. Control methods for mitigating biomass ash-related problems in fluidized beds. Bioresour. Technol. 2008, 99, 3534–3544. [Google Scholar] [CrossRef] [PubMed]
  22. Steenari, B.M.; Lundberg, A.; Pettersson, H.; Wilewska-Bien, M.; Andersson, D. Investigation of ash sintering during combustion of agricultural residues and effect of additives. Energy Fuels 2009, 23, 5655–5662. [Google Scholar] [CrossRef]
  23. Taylor, B.R.; Goudey, J.S.; Carmichael, N.B. Toxicity of aspen wood leachate to aquatic life: Laboratory studies. Environ. Toxicol. Chem. 1996, 15, 150–159. [Google Scholar] [CrossRef]
  24. Clarke, M.A.; Walsh, R.P. A portable rainfall simulator for field assessment of splash and slopewash in remote locations. Earth Surf. Process. Landf. 2007, 32, 2052–2069. [Google Scholar] [CrossRef]
  25. Environment Canada. Biological Test Method: Toxicity Test Using Luminescent Bacteria; Report EPS 1/RM/24; Environment Canada: Ottawa, Canada, 1992; p. 75. [Google Scholar]
  26. Sokal, R.R.; Rohlf, F.J. The Principles and Practice of Statistics in Biological Research, 3rd ed.; W.H. Freeman & Co.: New York, NY, USA, 1994; p. 880. [Google Scholar]
  27. McLuaghan, P.G.; Almashqabeh, O. Effect of media type on dissolved organic carbon release from woody filtration media. Bioresource. Technol. 2009, 100, 1020–1023. [Google Scholar] [CrossRef] [PubMed]
  28. Muna, A.; Sreekrishnan, T.R. Aquatic toxicity from pulp and paper mill effluents: A review. Adv. Environ. Res. 2001, 5, 175–196. [Google Scholar]
  29. Thompson, G.; Swain, J.; Kay, M.; Forster, C.F. The treatment of pulp and paper mill effluent: A review. Bioresour. Technol. 2001, 77, 275–286. [Google Scholar] [CrossRef]
  30. Bernard, C.; Colin, J.R.; Anne, I.D.D. Estimation of the hazard of landfills through toxicity testing of leachates: 2. Comparison of phsico-chemical charactersitics of landfill leachates with the toxicity determined with a battery of tests. Chemosphere 1997, 35, 2783–2796. [Google Scholar] [CrossRef]
  31. Hao, O.J.; Shin, C.J.; Lin, C.F.; Jeng, F.T.; Chen, Z.C. Use of microtox tests for screening industrial wastewater toxicity. Water Sci. Technol. 1996, 34, 43–50. [Google Scholar] [CrossRef]
  32. Gutierrez, M.; Etxebarria, J.; de las Fuentes, L. Evaluation of wastewater toxicity: Comparative study between Microtox® and activated sludge oxygen uptake inhibition. Water Res. 2002, 36, 919–924. [Google Scholar] [CrossRef]

