Article

Long-Term (13 Years) Decomposition Rates of Forest Floor Organic Matter on Paired Coniferous and Deciduous Watersheds with Contrasting Temperature Regimes

Department of Natural Resources and Environmental Sciences, MS 186, University of Nevada, Reno, NV 89557, USA
Forests 2016, 7(10), 231; https://doi.org/10.3390/f7100231
Submission received: 15 July 2016 / Revised: 27 September 2016 / Accepted: 30 September 2016 / Published: 12 October 2016

Abstract

:
Two sets of paired watersheds on north and South facing slopes were utilized to simulate the effects of temperature differences that are on the scale of those expected with near-term climatic warming on decomposition. Two watersheds were pine plantations (Pinus strobus L.) and two were mature deciduous forests established at similar elevation ranges and precipitation at the Coweeta Hydrologic Laboratory, but they differed in slope aspect (north vs. South facing), solar radiation, and litter temperature by about 2.0 °C. Nylon netting was placed on plots each year for 13 years and litterfall was measured. This time span in which decomposition rate was measured encompassed the time until less than 8% of the initial C remained. Decomposition rates of foliar litter were significantly faster on the slightly warmer watersheds, in both the coniferous and deciduous forests (Analysis of Variance). The turnover rate (year−1) was 0.359 (±0.006) for the South facing vs. 0.295 (±0.011) for the North facing coniferous watersheds, and 0.328 (±0.011) vs. 0.297 (±0.012) for the corresponding deciduous watersheds. Turnover rates of pine vs. deciduous broadleaf litter over 13 years were not significantly different because of the high proportion of relatively refractory Quercus spp. in the deciduous litterfall and because of a trend towards convergence of the rates after two years. After a greater decomposition rate in the first year or two, years 2–13 fit a negative exponential curve well (a timespan not well represented in literature) and there was only a small accumulation of humus older than 13 years. The fate of C in litterfall in the South facing deciduous forest was as follows: 14.3% was lost as leaching of dissolved organic C, 2.2% was lost as downward fine particulate matter flux from the bottom of the forest floor, 78.2% was mineralized (by mass balance), leaving only 5.4% of foliar litter after 13 years of decomposition. In these soils with a mor type O horizon, there was evidence that translocation of DOC and in-situ root production must be more important sources of mineral soil organic matter than downward migration of particulate humus.

1. Introduction

Plant detritus deposited on the forest floor serves to temporarily store carbon and nutrients and perhaps serves as a source of organic matter to the mineral soil. These functions are generally expected to decrease with increases in temperature projected with climatic warming. It has long been recognized that one of the results of global climatic warming would be increased rates of decomposition of sequestered soil organic matter and that the loss of stored C would have a positive feedback on the climatic warming effects of CO2 [1,2]. Additionally, increased precipitation may also tend to increase decomposition while warming may also increase plant productivity [1]. Many approaches have been used to quantify the effects of soil warming but most can be categorized as: (1) using latitudinal gradients of temperature [3,4]; (2) using altitudinal gradients [5,6]; (3) manipulation such as warming cables or infra-red lighting [7,8]; or (4) controlled incubations that can more easily separate responses to temperature and moisture [9]. Studies along latitudinal and elevational gradients often must account for differences in precipitation, parent material, and vegetation [5]. At the other end of the spectrum, laboratory studies may be more controlled but less natural and, by necessity, of shorter duration.
The paired watershed experimental approach was originally designed by forest hydrologists to hold such variables as elevation, precipitation, slope, aspect, and parent material constant, while forest treatments were tested over a long period of time. The technique has a long history of utilization for investigation of biochemistry, vegetation manipulation, and succession. One disadvantage of the technique is the lack of random distribution of treatments among replicates [10]. This study exploited differences in slope aspect, originally used for studying stream flow in order to contrast the well-known effects of radiation on slopes, to investigate long-term decomposition. The manipulation of species in plantation forestry, invasions of exotic species, and succession can also have effects on soil organic matter storage through differences in litter chemistry [4,11,12,13]. Changes in the range of dominant species with climatic warming may also influence soil organic matter [9]. In the paired watersheds used in this study, two pine plantations were established on north and South facing watersheds, and planted in the same density, with the same species (Pinus strobus) at the same time [10]. Subsequently, these served as the subject of classical studies of the modelling of water yield and evapotranspiration. The same experimental watershed approach can also be exploited for elements of global change that were unknown at the time they were planned.
Another major goal of this study was to link the study of litter decomposition in its transition to humus. Humus has a usefully vague definition, but it is generally recognized that it is important in the transformation of detritus into soil organic matter with very different properties, such as long-term carbon storage, sustained nutrient release, acidity, and other properties associated with humic substances [4]. It is often regarded as much more refractory than younger forest floor material and the time it takes to develop is difficult to quantify. Downward migration of fine particulate humus might also be a possible input to the mineral soil. Investigating the transition of litter into humus is difficult because of the long time required which is well beyond the time scale of most research projects. However, the U.S. Long Term Ecological Research Program provides an environment for such studies [10].
In this study the following hypotheses were evaluated:
(1)
South facing watersheds (both pine and deciduous) have slightly faster rates of forest floor turnover than the paired North facing watersheds,
(2)
the forest floor in the pine watershed decomposes significantly slower than that in the paired deciduous watershed (as expected because of the high lignin content of the pine litter),
(3)
decomposition rates of “humus” (arbitrarily defined as over 75% decomposed) were much lower than those of newer litter,
(4)
a large stock of humus C older than 13 years (i.e., lying below the oldest net in this study) remains on the surface of the mineral soil, and
(5)
downward migration of fine particulate C from the forest floor into the mineral soil is a very small proportion of litterfall (arbitrarily defined as less than 5%).

2. Materials and Methods

2.1. Site Description

The research sites were two Pinus strobus pine plantations established in 1956 and 1957 on Watersheds (WS) 1 and 17, and two mixed deciduous forested watersheds WS 2 and WS 18 at the Coweeta Hydrologic Laboratory (Otto, NC, USA), a Long Term Ecological Research site of the National Science Foundation. The climate is near the borderline between Marine, Humid, Temperate and Marine, Humid, Subtropical [10]. A detailed description can be found in [10]. The most pertinent background measurements are described in Table 1. Temperature at the soil surface and 20 cm below the surface have only been available since August 2015, after the period of the study, but are included to show the effect of radiation on the soil surface temperature (Coweeta Long Term Ecological Research continuously streaming data, [14]). The temperature probe for the North facing deciduous WS at 20 cm soil depth indicated similar average temperatures to the soil surface probe. Probes were not installed on the pine watersheds, but Table 1 shows that the potential insolation was 85% and 16.6% greater, respectively, in the dormant and growing seasons on the South facing vs. the North facing slopes.
The two deciduous forests had been selectively cut in the 1920s and represent relatively mature mixed hardwood forests of the Appalachian region [10]. There is no reason to suspect that the forest floor development has been disturbed since that time. Land use on the four watersheds had been similar prior to establishment of the pine plantations [10]. The species composition of the deciduous watersheds can be described as mixed oak-hickory-maple forest with fairly high diversity [13]. The vegetation, litterfall, and primary productivity of the North facing deciduous WS was described in detail by Day and Monk [16] and Monk and Day [17] when it was one of the sites of the International Biological Programme. Soils of the four watersheds in the vicinity of the plots were similar: fine, loamy, micaceous or parasequic, mesic Typic Hapludults [18].
In 1970–1971 litterfall was measured on the North facing pine WS as 388 g·m−2·year−1, 318 g·m−2·year−1 of which was foliar [18]; given that this measurement is similar to ours, it is believed that the litterfall was in an approximate steady state, or at least that no long-term trends were evident. Many other measurements of litterfall have been made on all four watersheds and they indicate no long-term trend [17,18,19]. Earthworms are not common in the forests [10].
Selected subsamples from alternate years from the litter from the North facing pine WS were used in a study of 13C Nuclear Magnetic Resonance (NMR) spectra, humic substance development, and a comparison of carboxylic acid loss rate with general decomposition rate [20].

2.2. Separation of Annual Litter Layers and Calculation of Decomposition Rate

A 91 cm by 91 cm square of nylon mesh, with holes measuring 1 × 2 mm was placed on five plots in each of the four watersheds each year for 13 years, using the technique of Jorgenson et al. [21]. At the conclusion, n = 5 plots for all watersheds except the South facing pine WS, where one plot was lost to tree-fall. The autumn-subsequent summer litterfall was the layer delineated each year. A 15 cm high “fence” of screen surrounded each plot to prevent movement of litter by wind. A pliant nylon mesh was chosen because it allowed litter to lie in a natural manner, in contrast to a stiffer fiberglass window screen which might artificially elevate the layers after 13 nets were laid down. Litterfall was measured in plastic baskets beside each plot in the first litterfall period and again during the 13th year so that the Olson equation [22] could be used to analyze the turnover rate. Litterfall in the last year was used as the litter input. Measurement of decomposition rate by this method requires a litterfall rate that is either known for each year or which remains constant over the period [21]. All annual layers were separated and collected giving 13 years of separated, annual layers. When the litter was harvested, even in the advanced stages of decay, the particles were bound together by a network of either living or dead mycelia. The decision to terminate the study at 13 years was because the oldest layers had decayed to humus that appeared to be less than 10% of the initial and enabled measurement of the advanced stages of humification in detail.
Litter from each annual layer was separated, air dried, and weighed. Woody material and cone debris was separated from foliar litter and weighed separately. Only the foliar component of the litter was analyzed in this paper. Subsamples were ground in a Wiley Mill for analysis. Subsamples were also dried at 70 °C and then combusted to determine moisture content and ash-free dry mass. Carbon and nitrogen content were measured using a Perkin-Elmer 6400 C-H-N analyzer (Norwalk, CT, USA) as a % of mass at 70 °C. The mass of C per m2 for each layer was then calculated as (Equation (1)):
% C × (g subsample 70 °C/g air dry subsample) × (mass air dried litter/area of net in m2)
Then (Equation (2))
the % C remaining in layer of age t = 100 × [(g C in layer of age t/m2)/(g C in litterfall/m2)].

2.3. Standing Stock of Forest Floor Humus Older than 13 Years

In order to evaluate hypothesis 4, after carefully lifting the oldest net delineating the litter 13 years of age from that lying beneath it, the remaining humus lying on top of the A horizon soil was collected with a soft brush and dustpan. The surface of the loamy A horizon mineral soil was cohesive enough so that it was not substantially disturbed and it was described as having a “clear smooth boundary” between the O and A horizons [18] and the transition fit the definition of a mor humus. However, to minimize the measurement of any A horizon mineral soil, a subsample was analyzed for C content. Roots were also removed since the objective was to measure O horizon humus originating from aboveground litterfall. The g·C/m2 gathered by this technique is referred to in the text as the standing stock of forest floor humus older than 13 years.

2.4. Evaluation of Fine Particle Migration Downwards

Measurement of decomposition rate using this technique depends on the assumption that the migration of fine particles through the nets and annual layers was small. The flux of fine particulate matter through the net was measured by placing 56 mm Whatman glass fiber filter discs just below the undersurface of the nets at the beginning or the last year. The discs were placed under layers of 1, 2, 3, 4, 5, 6, 9, 11, and 13 year old litter in a non-overlapping arrangement so that they would represent the cumulative flux from all annual layers above each filter disc. However, only the data for the filters under the bottom net are shown in this paper. One set of filter discs was removed after 14 days to serve as a control for the chance that the disturbance in placing the filters would cause deposition of particles on the surface. This proved to be negligible. A second set of filters was left in place for one year. They were collected carefully and wrapped in aluminum foil. The filters were dried at 105 °C, weighed to the nearest 0.1 mg, combusted at 450 °C, and the loss of weight was measured. The organic C deposited on the filter was estimated as 54% of the loss of mass on combustion based on the correlation of loss of ash-free dry mass vs. C content based on C analyses of the litter. The C deposited on the control filters was subtracted. In the laboratory, the ability of the moist filters to absorb droplets of water clinging to particles of litter touching the filter was tested and they appeared to not repel droplets of water.

2.5. Comparison of Species Composition of Litterfall, and Lignin Content of Litterfall in the Two Deciduous Watersheds

In order to evaluate Hypotheses 1 and 2, it was necessary to establish whether a difference in species on the North facing vs. the South facing deciduous watersheds might be the cause of differences in decomposition. Litterfall from each plot was sorted by species and weighed. A study by Cromack and Monk [19] gave data on one year decomposition rates of most of the major species along with lignin, nitrogen, and phosphorus contents of senesced litter and was done on the North facing pine and deciduous watersheds. They also used a representative mixture of species for one set of decomposition studies. These data were used with the percentages of each species to calculate a hypothetical first year decomposition rate for the species mixture in the plots used in this study. The proportion of each species in each plot from the current study was multiplied by decomposition rate (k) from Cromack and Monk’s study [19] and a weighted average hypothetical decomposition rate was calculated for the mixture of species in each plot. These were then averaged for the watershed. The lignin to nitrogen ratio was also calculated for the mixture of species on each watershed. These data from the Cromack and Monk [19] study on the North facing pine and deciduous watersheds were the same as one of the two datasets included in the analysis of Melillo et al. [23] who first proposed the lignin to nitrogen ratio as a predictor of decomposition rate.
Concentrations of Mn and other metals in the litter and humus horizons of the two deciduous watersheds were measured by Berish and Ragsdale [24]. The concentration of Mn averaged 1.1 and 1.7 mg/g for the litter and humus horizons, respectively. Most of this Mn (82% to 98%) was available, as measured by a weak acid extraction.

2.6. Mathematical Models and Statistical Tests

To evaluate hypothesis 1, the turnover rate as given by Olson [22] was used: Equation (3)
litterfall/forest floor mass = turnover rate (years)
This study used units of g·C/m2, and the forest floor mass was the total from 1 to 13 years of age. Excluding the mass older than 13 years made very little difference as shown in the Results. The litterfall was not added to the forest floor mass in the denominator because it heavily weighted the data toward the anomalously high loss during the first year. The turnover rate provided a better test for our hypothesis than curve fitting because all of the 13 years accumulation provided a larger sample size, eliminating year to year variation.
A two-way unbalanced Analysis of Variance (ANOVA) was used to test Hypothesis 1, where the dependent variable was turnover rate and the independent variables were slope aspect (either N. or South facing) and species (either pine or deciduous), and the sample size n = 5 for all watersheds except the South facing pine WS, where n = 4. IBM SPSS Statistics for Windows, Version 21.0 was used for all statistical tests, and the general linear models procedure was used for ANOVA [25].
Decomposition curves were expressed as percentage of litterfall for each plot and fit to a two phase exponential decay model [4] (Equation (4))
[(100 − a) × e−k1 t] + [a × e−k2 t]
where “a” represents the percentage of one of the components (the “slow” component), 100 − a represents the percentage of the other component (i.e., the “fast” component, k1 and k2 are two exponential decay coefficients, the t is the time in years). This equation “fixes” the overall intercept at 100% which Adair et al. [26] suggested was important. Iterative non-linear curve fitting was used to calculate a, k1, and k2, which also addresses some statistical concerns of Adair et al. [26], but is also necessary in the case of this model. Also tested was a simple one component exponential decay model on all curves, but in all cases the Akaike Information Criterion gave significantly higher values with the two component model [25]. This occurred because the first year’s decomposition rate was considerably higher than the 12 succeeding years.

2.7. Tests of Differences on Rate Coefficients

Differences in turnover rate due to temperature were fit to the van’t Hoff Q10 equation: (Equation (5))
Q10 = (R2/R1) 10/(T2 − T1)
where Q10 is the proportional change in k due to a 10 °C increase in T, R1 and R2 are regression-derived estimates of turnover, and T1 and T2 are the two temperatures [6].
Rate coefficients fit to the decomposition curves were tested with two-way ANOVA or a paired t-test in the case of paired comparisons. For examining possible variations in decomposition rate or mass of C remaining in different age increments, the ages were divided into four categories: 0–2 years, 3–5 years, 6–13 years, and older than 13 years. The categories were based on subsequent curve fitting, the resemblance of the 6–13 years category to humus, and the oldest age delineated (13 years). Thus, the decomposition rates coefficients of using data from only years 6–13 were used as a way to test Hypothesis 3 by comparing them to the coefficients derived from all years.
Another way to compare differences in the early decomposition rate is simply to compare the percentage remaining at year 2 using two-way ANOVA. This measure was statistically more reliable than testing differences in the parameters “a” and k1 in Equation (4) since these two parameters were inversely dependent and had high standard errors of the mean.
A test of Hypothesis 4 was done by calculating the average mass of C older than 13 years for each watershed and comparing that to the mass litterfall. Attempts were not made to test differences between watersheds because the plot to plot variability was too great to find small differences.

3. Results

3.1. Effects of Slope Aspect and Species Composition

The turnover rate of the forest floor was significantly different between the two South facing and two North facing watersheds (Table 2). The two-way ANOVA showed that slope aspect (South facing vs. North facing) was highly significant (p = 0.0002). The mean difference in turnover rate was 27% greater for the South facing pine watershed, and 10.4% greater for the South facing deciduous watershed. Contrary to hypothesis 2, the species effect was not significant. On the North facing watersheds, the turnover rate of the pine and deciduous forest floor was surprisingly similar. Substituting the values in Table 2, and the soil surface temperatures in Table 1 (2 degrees difference), into the Equation (5), gave a mean Q10 of 2.1 for the average of the pine and deciduous watershed turnover rates.

3.2. Rates of Decomposition

The time course of decomposition is shown in Figure 1. It is important to note the long duration and that each year carries equal weight in the curve fit to the model. The decomposition rate in the first year is obviously greater than that for the subsequent years. The meanings of the “a” and k1 terms in the two phase decay model are largely determined by the first and second year data and the standard error of the parameter k1 is large. The values of k1 also mean that only about 10% of the “fast” component (1 − a) are left by year 2. A better test of the initial rates of decomposition is simply a two-way ANOVA of the % C remaining after two years, using the data points shown in Figure 1. This ANOVA showed a significant effect of aspect (p = 0.002) and a small (4.4 in units of % C remaining) species effect of borderline significance (p = 0.06). This small initial difference in pine vs. deciduous decomposition where the % C remaining was slightly greater for pine than for deciduous litter was manifested only in initial rates and disappeared with time as shown by the overall turnover rate in Table 2.

3.3. Decomposition Rates of Older Humus

Hypothesis 3, that decomposition rates of “humus” were much lower than those of newer litter, was tested by contrasting the rate coefficients of the initial, the entire “slow” phase, and the data from the oldest seven years. The decomposition rate coefficients of the “slow” fraction tended to have low standard errors because they are determined by trend of about 11 years (Table 3) but are all clearly lower than the initial rates (an average decomposition k of 0.43 for the first two years). However, did the rates continue to slow as the litter reached the “humus” stage? An age of 6–13 years was chosen based on the resemblance to the Oe and Oa horizons (using the U.S. Department of Agriculture system), and was a time range when most plots had less than 25% of the original C remaining. The decomposition k rates are shown in Table 4. Comparison of the k values shows that the rates in years 6–13 were not, in general, lower than for the entire “slow” fraction (Table 3). A paired t-test of the differences in the two rates for each watershed showed that the rates were not significantly lower in the 6–13 years period (one-tailed test). In three of four watersheds the rates were even higher, although the R2 values were lower for the 6–13 year period. The plots had an average of 22.5% C remaining at 6 years and only 6.8% remaining at 13 years, and spatial variability was high. However, the rates clearly declined from the initial rates (years 1–2), which is the time span of most litter decomposition experiments.

3.4. Accumulation of Humus Older than 13 Years

There was not a large stock of humus on the surface of the mineral soil that was older than 13 years. Thus, Hypothesis 4 was not supported. Table 5 shows the stock of humus (g·C/m2) older than 13 years and its equivalent in units of % of C in litterfall. The percentage of litterfall is no more than the amount that was present in the last annual layer (12–13 years old). Plot to plot variability was too great to test differences between watersheds. However, the mean values demonstrate that there was no large accumulation of humus older than 13 years above the mineral soil.
We can extrapolate from the exponential decay equation to estimate the time until this layer becomes insignificant. If we arbitrarily define “insignificant” as less than 0.5% of litterfall, and extrapolate using the k for the North facing pine watershed from Table 4, then the older than 13 years layer would be less than 0.5% of litterfall at age 22 years. The mean residence time would be 3.9 years in addition to the 13 years it had already undergone, for a total of about 17 years. This compares with an age of 34 years since the establishment of the pine plantations and at least 70 years since the deciduous watersheds were logged [10].

3.5. Fluxes of Fine Particulate Matter

Fluxes of fine particulate matter C were small in proportion to the mass of the forest floor lying above the 13th year layer (Table 6). In comparison to litterfall, they were a small proportion. In units of g/m2 C, they ranged from 0.3 to 5.1 g/m2.

3.6. Species Differences between the Two Deciduous Watersheds

There were no differences in composition of species in litterfall on the N. and South facing deciduous watersheds in terms of those that may be expected to be slow or fast to decompose (Table 7). First, dominance was fairly evenly distributed among four species on each watershed that comprised more than 10% of litterfall. Decomposition k values for most of the species are drawn largely from the study of Cromack and Monk [19] to compare the hypothetical rates of decomposition expected for the species mixture. Of the two species with the highest percentages on both watersheds, Q. velutina is slow to decompose while A. rubrum is fast to decompose, and they have comparable percentages on both watersheds. When a weighted k for each watershed is predicted, the values are remarkably similar: 0.70 and 0.72, for the S. and North facing deciduous WSs, respectively. The two pine watersheds were both planted with P. strobus which has an expected low k associated with a high lignin:N ratio. The values for lignin and % N from literature sources will be reviewed in the Discussion section.

4. Discussion

4.1. General

Several of the advantages of a long-term study of forest floor decomposition are: (1) the ability to link the phases of litter decomposition (1–3 years in most studies) to the decomposition of the humus phase; (2) the ability to distinguish effects that may only persist in short vs. long-term phases of decomposition; (3) to actually date and evaluate the accumulation of the well-decomposed humus; (4) evaluate the loss of forest floor nutrients that are in the mineralization stage (although those are not reported here). Fortunately, this study was able to span the time from litterfall until the resulting humus had almost completely decomposed, a time that would have been impossibly long in colder regions of the earth, or may have been less easily interpreted in tropical regions with high termite activity or even temperate regions with earthworm activity.

4.2. Temperature Effects

The small but significant increase in turnover rate on both South facing watersheds, as compared to North facing watersheds, was consistent with what might be expected with a 2 °C difference in litter temperature compared to the North facing slope. Although it was impossible to continuously measure litter and soil temperature in the plots during the study, the continuous monitoring on both the S. and North facing deciduous watersheds has consistently shown a difference in temperature in all seasons. The differences corresponded to a Q10 of 2.1 which is well within the range of Q10 values from a number of litter decomposition studies that were cited by Bothwell et al. [6], including Scowcroft et al. [27], Giardina et al. [2] for soil C efflux, and Hyvonen et al. [28] for wheat straw. Bothwell et al. [6] used the elevation gradient approach but was able to choose sites that gave a narrow range of precipitation, and they noted many studies in which moisture was a confounding variable (e.g., [5]). One of the advantages of the paired watershed approach was that they were similar in elevation and precipitation and both North facing watersheds abutted one another, as did both South facing watersheds (Table 1). Precipitation did average 10.4% less on the two South facing watersheds but this difference, if significant, would tend to work in the opposite direction from the observed differences in turnover rate. It is also possible that the more direct radiation on the litter layer on the South facing watershed might make it dryer on the surface, but the relatively high precipitation rates may ameliorate this factor. One of the advantages of this study is that it not only measured differences in short term decomposition rates but also showed higher C pools in nearly the entire forest floor.
One other aspect of the study suggests that there was no long-term pool of very old humus (older than 13 years) that serves as a very long-term storage of C, unlike what is often assumed for soils. This suggests that a future increase in temperature of about 3 °C would simply lead to a lower mass of the forest floor of similar magnitude to the differences observed between the current N. and South facing watersheds. If we substitute the “slow” decomposition k values and litterfall rates into Olson’s equation for the time to reach a 95% steady state forest floor mass [22], then the times are on the order of 15–20 years, which is less than the time since the last disturbances, so it was likely the forest floor C was near steady state on all watersheds. However, theses “steady state” masses are likely to decline as long-term temperatures rise. Succession in the pine forest is also a factor affecting litterfall.

4.3. Kinetics of Litter vs. Humus Mineralization

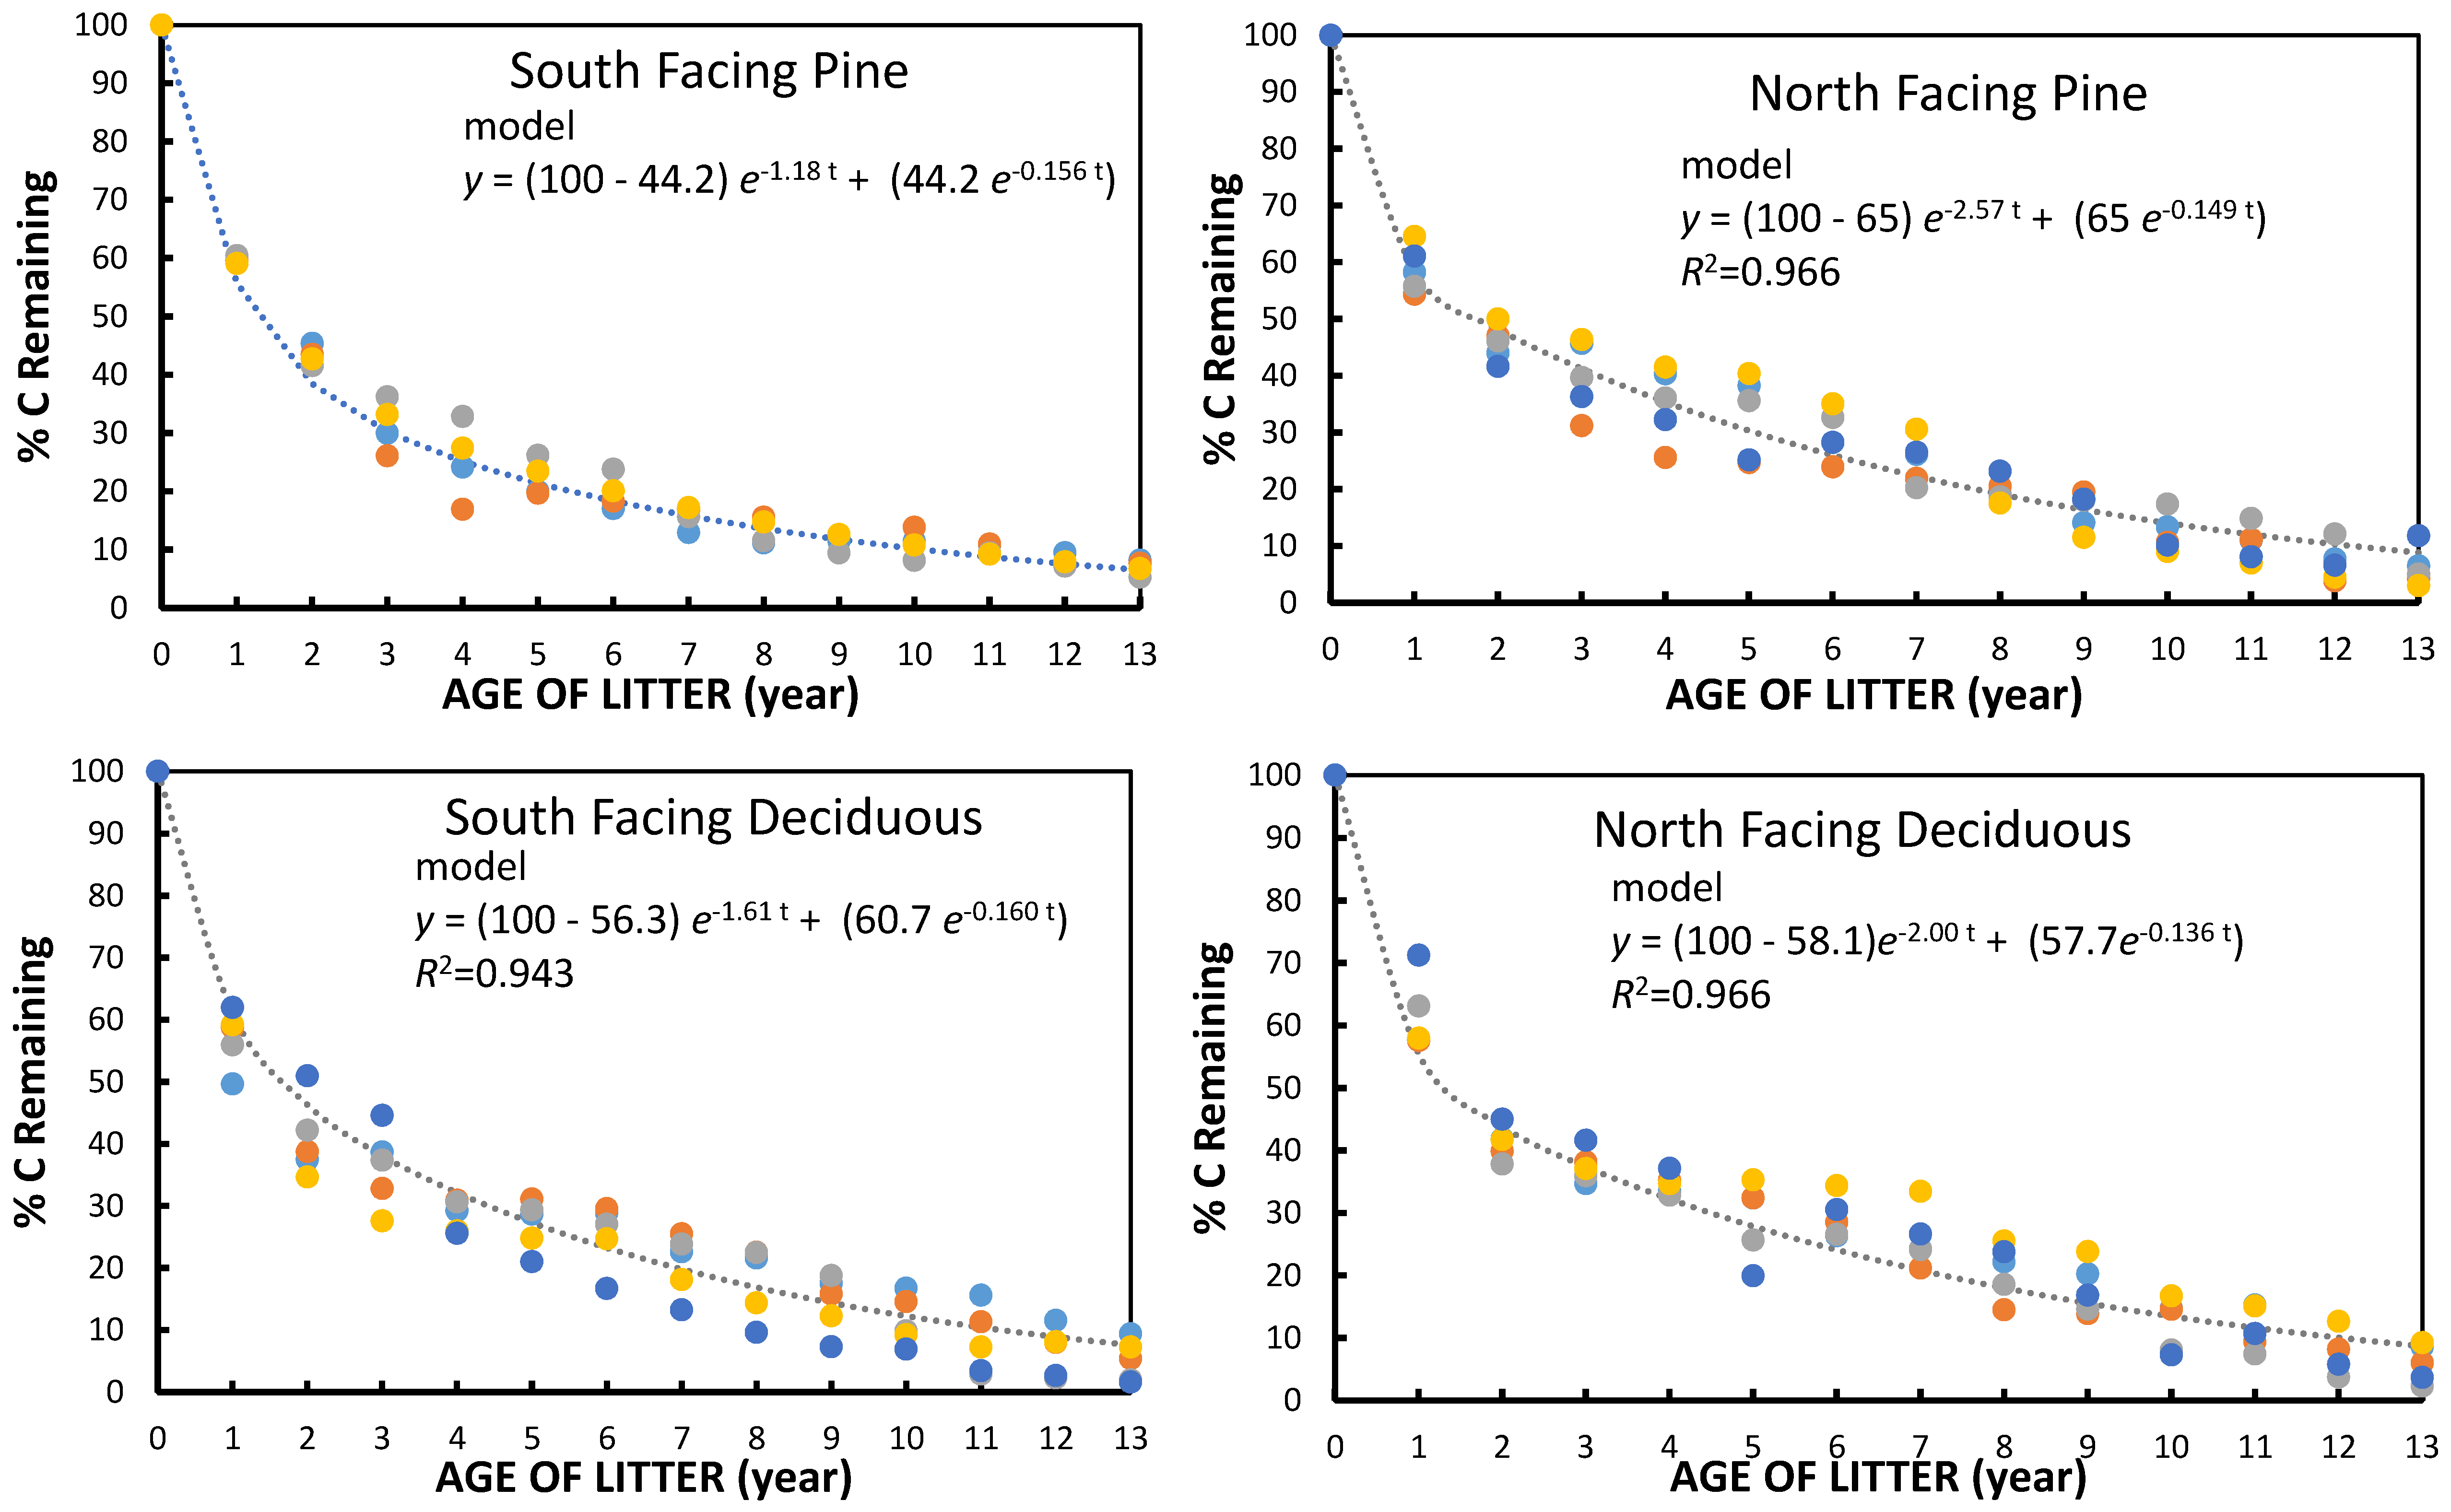
One of the most important findings of the study was that the exponential rates of decomposition did not continue to decrease after the first couple of years. The substrate was presumably getting lower in quality. A previous study of chemical functional group content using 13NMR and humic substance content in subsamples taken from the North facing pine WS plots showed C in fresh litter contained 15.6% humic substances (mostly polyphenols and fulvic acid) [20]. However, that percentage grew to 39.5% of the C by 13 years, indicating a decline in substrate quality [20]. However, in units of g/m2, the humic substance fraction declined in mass from year 1 to 13, suggesting that after one year there were enzyme systems at work that could degrade humic substances and probably the lignin that initially comprised 31% [19] of the mass of the senescent pine litter (Table 5). Thus, even in the intermediate stages of decomposition there were already microorganisms degrading “low quality” substrate and these were sufficient to prevent a large decline in decomposition rate in the “humus” phase. There was no indication that decomposition rate declined almost to a stop at any point.
The oldest net provided a rare opportunity to delineate the humus that had accumulated on the forest floor that was older than 13 years. It is possible that a portion of the material was fine particles that had migrated downward, but the presence of the 13 year old layer in most plots suggested there would be a small 14th and 15th year layer as well. This layer had the appearance of Oa horizon material (humus). This older humus was only 0.7% to 1.9% of the forest floor C mass in the two deciduous watersheds and 2.4% to 2.7% in the two pine watersheds. It was remarkable that at least some of this material was a layer of recently shed pine needles or deciduous litter when the first net had been laid down 13 years before.
However, there are other sites where long-term accumulation of stable humus occurs, as documented by Berg and McClaugherty [4]. They give an extensive discussion of the question “Does humus accumulate and where?”. In one example of very deep accumulations of O horizon litter and humus on boreal forested islands, roots and ericoid mycorrhizae have been shown to account for a large proportion of the accumulated organic matter, in part because the rooting zone was above the very deep mineral soil boundary [29]. In the case of the Coweeta site, it has a humid temperate/subtropical climate, the soil never freezes, and the soils are not extremely nutrient poor [13], factors that Berg and McClaugherty discuss in relation to properties that may lead to the development of extremely refractory humus layers. Mn concentrations in the litter of the two deciduous watersheds averaged 1.1 mg/g for litter and 1.7 mg/g for humus [24]. Mn concentrations may be critical for Mn dependent lignin and humic acid peroxidation [30,31]. The range in the deciduous litter and humus was intermediate compared to the ranges of most concentrations of the litter in the late stages of decomposition in the study of Berg et al. (1–2 mg/g) which showed a relationship with mass loss in the later stages of decomposition [30].
There have been other long-term studies that have comparable results for long-term kinetics. In the 10 year litterbag LIDET study [32] mass remaining over a period of time was shown for litterfall from a group of four to five species in multiple different deciduous and coniferous forest sites across a climatic gradient. The % mass remaining for the mean of the deciduous forest sites was quite similar to the data in Figure 1 up until six to seven years. Thereafter, the decomposition curve in the LIDET study tended to “level” out to a greater extent in the last three to four years whereas the curve from Figure 1 of this study continued its trend. We might attribute some of this difference to the use of weight remaining in the LIDET study while this study used % C remaining. The percentage of ash became more concentrated in the latter years and would have obscured the observed continued decomposition of C. Also, the Coweeta site had a climatic index [32] higher than the two other deciduous forest sites in the LIDET study. The mean decomposition rates for the litter incubated in temperate coniferous forests were lower than those for pine litter in this study, but again, the Coweeta site tended to be warmer that the sites in the LIDET study.
Binkley [33] used the same technique (developed by Jorgensen et al. [20]) with a Pinus taeda forest floor over 10 years and found that 30% of the organic matter remained after 10 years, giving a k rate of −0.166. This rate was lower than that for the South facing pine decomposition rate at Coweeta where at 10 years only about 11% of the C remained. Binkley’s rate coefficient (k), however, was similar to our “slow” fraction rate. However, the study showed a continuation of the decomposition rate during the latter phases, as was the case for the Coweeta study.

4.4. Species Differences

Many studies have identified important differences in decomposition rates characteristic of different dominant species and the effect on O horizon C stock [34]. For example, in a study of a common garden, experiment plantations of 14 different tree species in Poland demonstrated some fairly large differences on both O and mineral horizon carbon stocks under different species [13]. Augusto et al. [35] used a meta-analysis of the number of studies including common garden studies comparing the influence of evergreen gymnosperm and deciduous angiosperm species. They found that while litterfall was comparable, forest floor mass was higher in most evergreen gymnosperm forests with some exceptions. However, they speculated that while deciduous angiosperm litter may exhibit faster decomposition in the early stages, it could enable greater stabilization in the late stages (see also similar conclusions by Prescott [36]).
In the Coweeta study, the species composition on the paired watersheds was intentionally manipulated by planting two pine plantations adjacent to two non-manipulated deciduous tree dominated watersheds. The basis for the hypothesis that the turnover rate for the pine forest floor would be lower was based on the findings of other studies that Pinus strobus had a relatively low first year decomposition rate, a relatively high lignin content, and a relatively high ratio of lignin to N compared to most deciduous species in the same studies (see Table 7) [19,37]. In the common garden experiment in Poland, two of the highest accumulations of O horizon carbon were under the two pine species [13]. In the case of the Coweeta study the effect of pine vs. deciduous forest was insignificant. In the Coweeta study, however, two of the most common species were Quercus velutina and Quercus prinus, both with relatively low first year decomposition rates in other studies [18] and Table 7. In the Polish common garden, Quercus rubra (in the same subgenus as Quercus velutina) had large O horizon C stocks that were similar to the two Pinus species. Quercus prinus also had a relatively high ratio of lignin to N in the study of Cromack and Monk [19]. Not all Quercus species have a uniformly low rate of decomposition, as shown by the decomposition rates from Cromack and Monk [19] and the accumulation of O horizon of Quercus species in the common garden experiment in Poland (Quercus robar vs. Quercus rubra) [13].
There was no a priori reason that the species mixture on the North and South facing deciduous watersheds would confound the difference in turnover rate due to temperature differences. The applicability of the prediction of the weighted average species decomposition calculation (Table 2) was supported by the fact that Cromack and Monk’s [19] mixed species litterbag exhibited almost the same decomposition rate (see Table 7). One co-dominant species in the Coweeta deciduous forest was Acer rubrum, which had one of the highest first year decomposition rates in the study of Cromack and Monk [19], and also had the highest content of water soluble C (40.7% of initial C as opposed to an average of 27.2% for weighted species mix) in the study of Qualls et al. [38]. Acer rubrum was almost equally important in the two deciduous watersheds, and that factor, along with the similar distribution of oaks, helped make the predicted decomposition rate shown in Table 7 on the two deciduous watersheds similar. The importance of Acer rubrum in forest floor decomposition was shown by Alexander [12] who showed changes on forest floor biomass with succession to Acer rubrum dominance in the central hardwoods forest of the U.S. In addition, Ma et al. [39] predict a major shift from oak-hickory dominance to maple dominance in the central hardwoods forest of the U.S. due to climate change and fire suppression. Because so much of the initial decomposition rate of Acer rubrum is due to its high soluble organic C content, it is possible that C is simply translocated to the mineral soil where it can be adsorbed and perhaps become more resistant to decomposition. Nevertheless, the impact of climatic warming on O horizon C storage can be influenced not only by warming but by shifts in species range.

4.5. The Fate of Litterfall on a Deciduous Forest Watershed

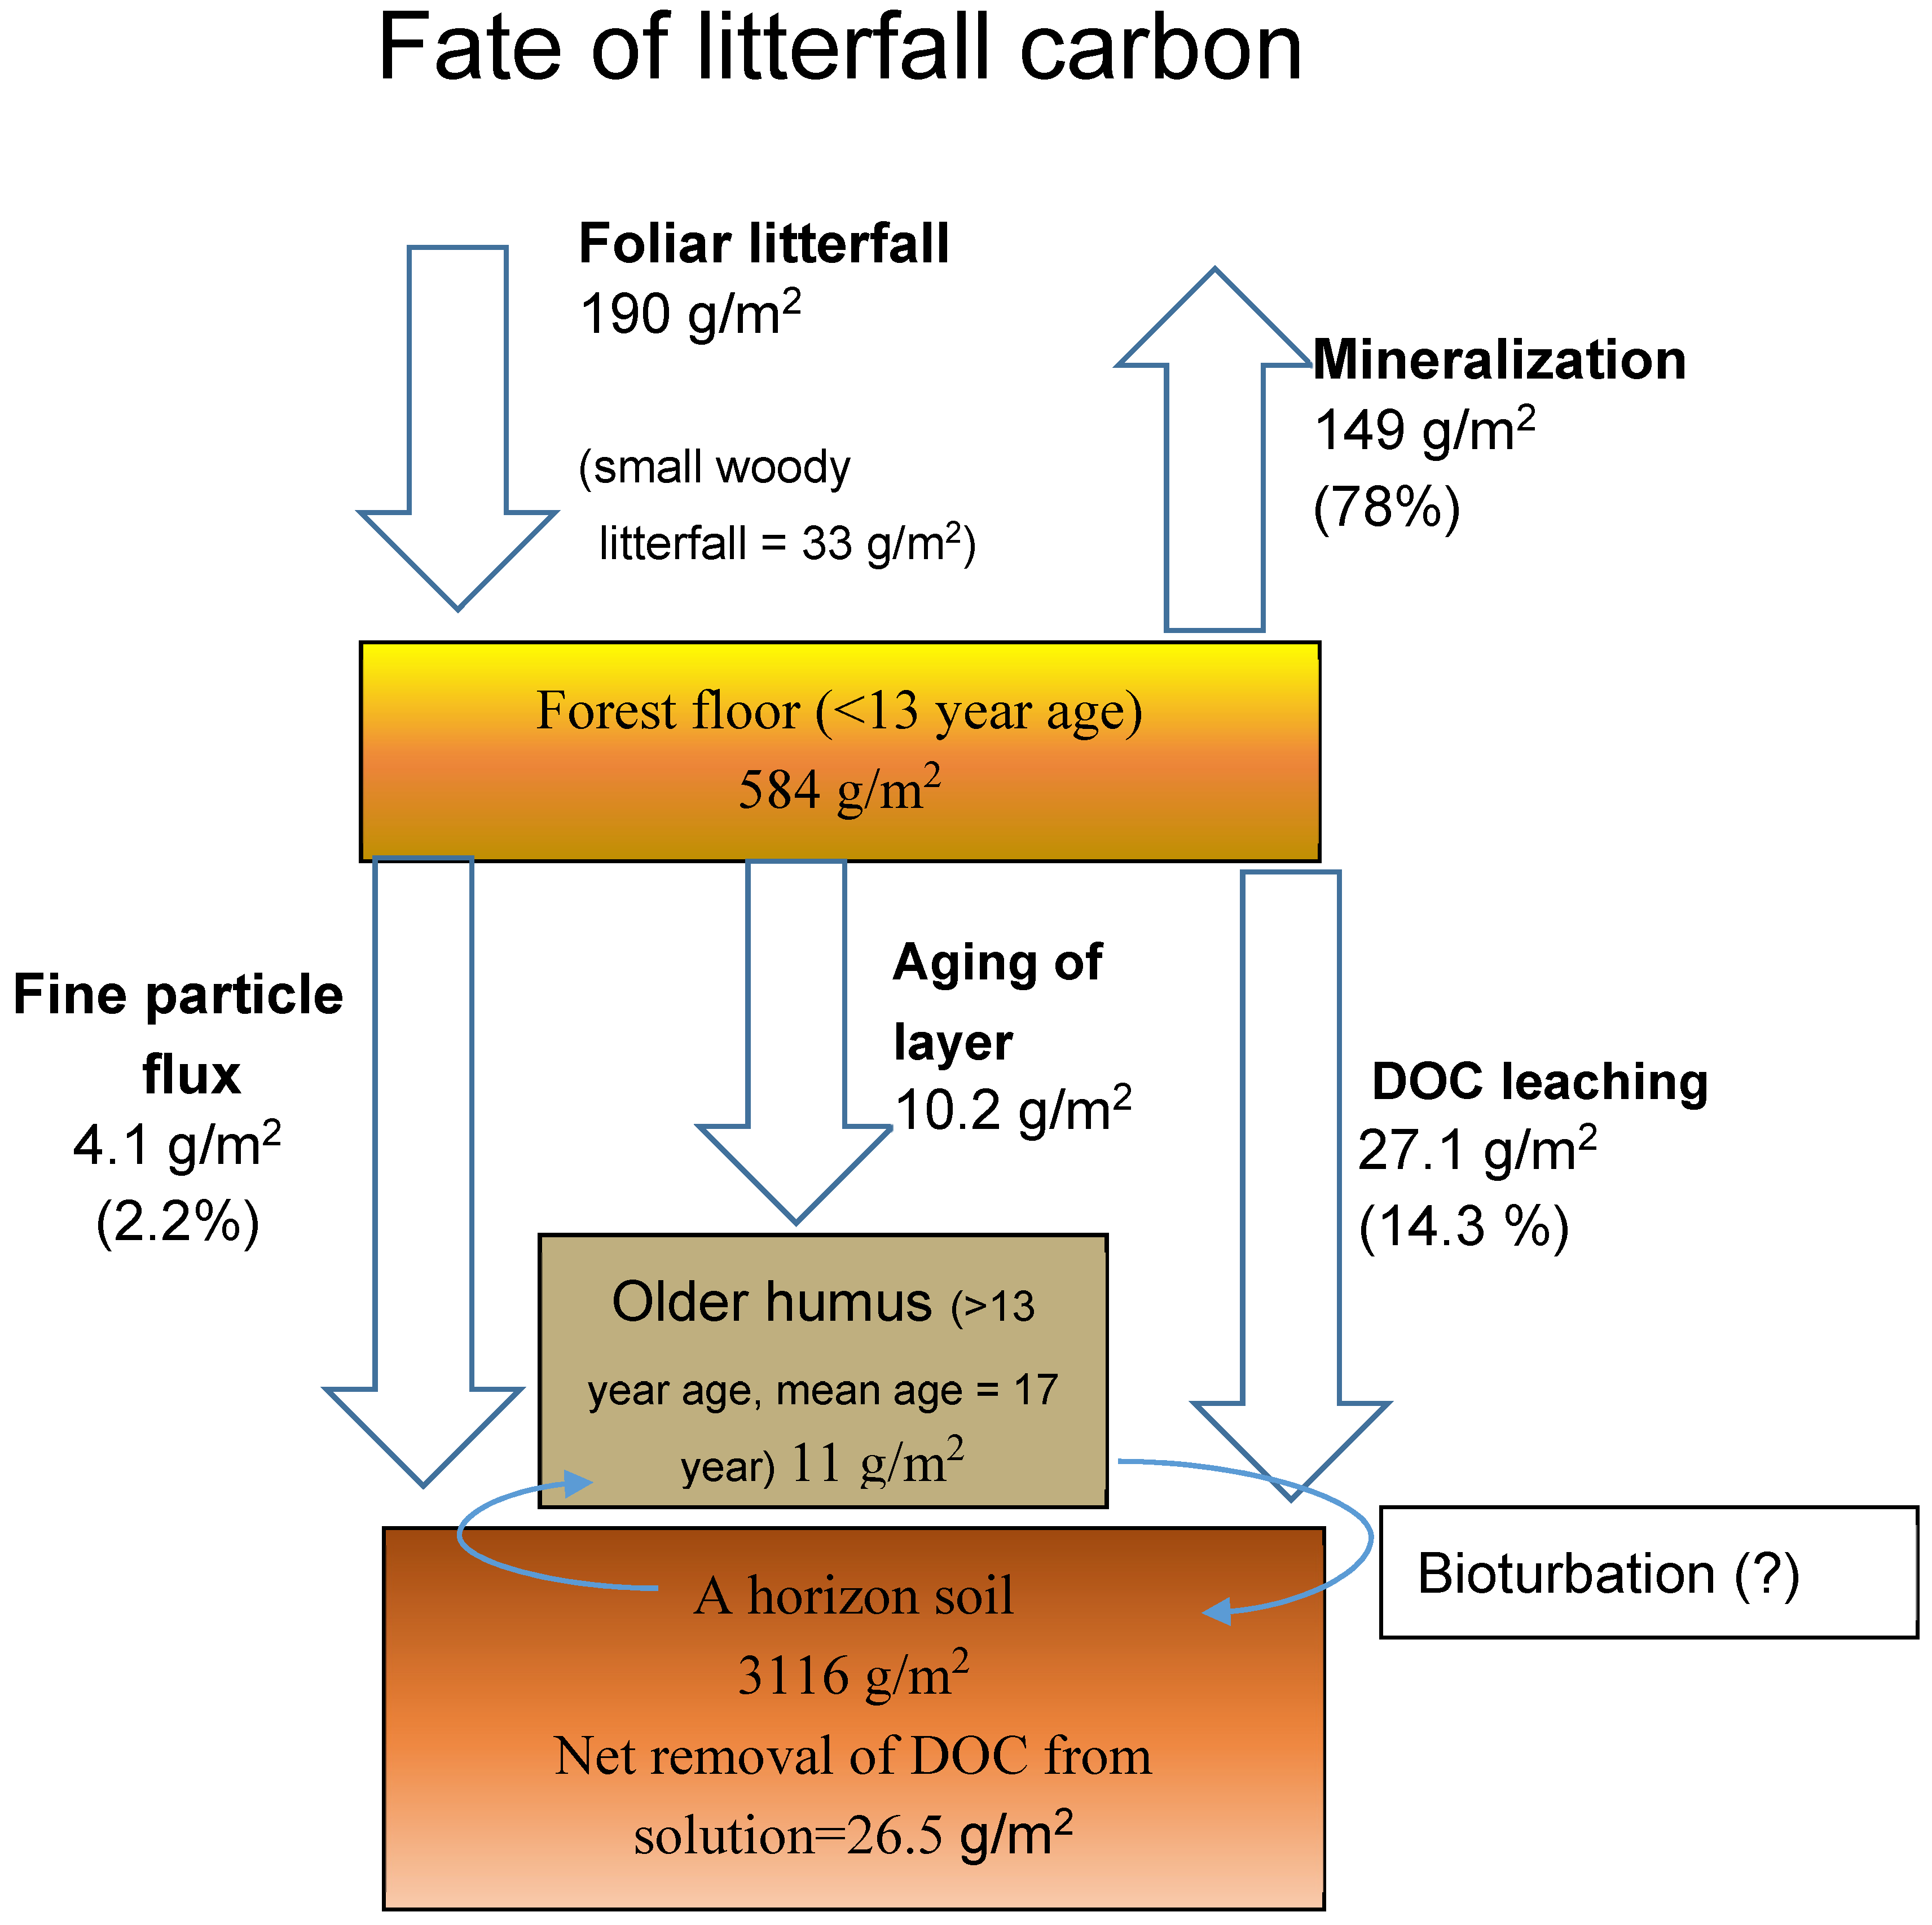
The South facing deciduous watershed was chosen to compile a summary of the stocks and fluxes of the forest floor based on measurements summarized in the Tables of this paper. In addition, there were also detailed measurements of dissolved organic C (DOC) flux from the forest floor on the South facing deciduous WS and measurements of the stock of C in the A horizon available from other studies. Figure 2 places the forest floor inputs, outputs, and stocks in a quantitative perspective.
The diagram indicates the following major points:
(1)
The mean residence time of the whole forest floor was 3.1 years.
(2)
Only 1.9% of the whole forest floor (O horizon) is more than 13 years old, and there was no large accumulation of older humus.
(3)
Fine particle fluxes onto the surface or into the A horizon were significant but small compared to litterfall (2.2% compared to litterfall), the mass of the forest floor, and the leaching of DOC.
(4)
The net flux of DOC from the forest floor is by far the largest input into the A horizon.
(5)
The net deposition of DOC in the A horizon (influx minus efflux) is a major fate for litterfall and was 18% as large as mineralization (measured by difference).
(6)
C storage in the A horizon was 84% of that in the O and A horizons combined.
A few qualifications should be noted about the budgetary diagram (Figure 2). First, the mineralization represents only the C flux from the forest floor and not the mineral soil. It is expected that the CO2 flux from the mineral soil and root respiration may be much larger. Also, the forest floor mass represents mass in summer before the next autumnal litterfall, and is the annual minimum. That factor should be noted when comparing the mass of forest floor to other literature. This paper concentrates on foliar litter masses and does not include woody litter, but the small woody litterfall is indicated in the diagram to put it in perspective. Some small proportion of the DOC flux and fine particle flux, however, could originate from woody litter. The arrows for DOC leaching and fine particle flux are shown bypassing the thin layer of older humus simply for clarity in the diagram, but likely traverse the layer. Bioturbation was not explicitly measured in this study, and so is indicated by arrows with a question mark instead of a quantity.
The small transfer of particulate C into the A horizon and the small size of the older humus layer suggest that transport of DOC and deposition of root litter may be more important as origins for the C in the A horizon. Where earthworms are common, bioturbation has a dramatic effect in the redistribution of O horizon organic matter into the mineral soil [13]. However, earthworms were not common in these acidic soils [10] and macroscopic bioturbation was not obvious with the mor O horizon and the clear smooth boundary between the O and A horizon. However, other types of litter and soil fauna such as enchytraeids, collembollans, millipedes, mites, and nematodes have been found to be abundant [10,19]. The translocation and adsorption of refractory DOC from the forest floor to the mineral soil may be a means for enhancing the residence time [42].

5. Conclusions

Emphasis in this study was on long-term decomposition dynamics followed until decomposition was almost 95% complete, in particular, comparing the kinetics of litter and humus decomposition.
The study found increased turnover rates on South facing compared to North facing slopes and these were consistent with differences in soil surface temperatures. These may be comparable to increases in forest floor turnover rates to be expected with rising temperatures. The study suggested that the C stored in the forest floor would re-equilibrate to lower stocks comparable to the differences found in this study, given similar temperature differences. However, changing precipitation patterns may also be likely to affect forest floor decomposition.
In following the decomposition process into the advanced stages it was found, contrary to expectations, that there were only small, very old (>13 years) stocks of humus. Only by following the kinetics for more than a decade was it possible to determine that after two to three years decomposition rates continued at comparable rates during the humus stage. This ability to measure decomposition into its final stages was of course a function of the humid temperate to subtropical climate which favored “intermediate” rates of decomposition compared to boreal or tropical climates.

Acknowledgments

This project was supported by grants BSR-850124 and BSR-8514328 from the U.S. National Science Foundation. I also thank Bruce L. Haines, Wayne T. Swank, and other Coweeta Long Term Ecological Research Program scientists who supplied a great deal of supporting data. This research was also partially supported by a National Science Foundation award DEB-0823293 from the Long Term Ecological Research Program to the Coweeta LTER Program at the University of Georgia. Any opinions, findings, conclusions, or recommendations expressed in the material are those of the author and do not necessarily reflect the views of the National Science Foundation or the University of Georgia.

Conflicts of Interest

The author declares no conflict of interest.

References

  1. Zhou, T.; Shi, P.; Hui, D.; Luo, Y. Global pattern of temperature sensitivity of soil heterotrophic respiration (Q10) and its implications for carbon-climate feedback. J. Geophys. Res. 2009, 114, G02016. [Google Scholar] [CrossRef]
  2. Giardina, C.P.; Litton, C.M.; Crow, S.E.; Asner, G.P. Warming-related increases in soil CO2 efflux are explained by increased below-ground carbon flux. Nat. Clim. Chang. 2014, 4, 822–827. [Google Scholar] [CrossRef]
  3. Gholz, H.L.; Wedin, D.A.; Smitherman, S.M.; Harmon, M.E.; Parton, W.J. Long-term dynamics of pine and hardwood litter in contrasting environments: Toward a global model of decomposition. Glob. Chang. Biol. 2000, 6, 751–765. [Google Scholar] [CrossRef]
  4. Berg, B.; McClaugherty, C.A. Plant Litter. Decomposition. Humus Formation. Carbon Sequestration, 3rd ed.; Springer: Berlin, Germany, 2014; p. 315. [Google Scholar]
  5. Salinas, N.; Malhi, Y.; Meir, P.; Silman, M.; Cuesta, R.; Huaman, J.; Salinas, D.; Huaman, V.; Gibaja, A.; Mamani, M.; et al. The sensitivity of tropical leaf litter decomposition to temperature: Results from a large-scale leaf translocation experiment along an elevation gradient in Peruvian forests. New Phytol. 2011, 189, 967–977. [Google Scholar] [CrossRef] [PubMed]
  6. Bothwell, L.D.; Selmants, P.C.; Giardina, C.P.; Litton, C.M. Leaf litter decomposition rates increase with rising mean annual temperature in Hawaiian tropical montane wet forests. Peer J. 2014, 2, e685. [Google Scholar] [CrossRef] [PubMed] [Green Version]
  7. Rustad, L.E.; Campbell, J.L.; Marion, G.M.; Norby, R.J.; Mitchell, M.J.; Hartley, A.E.; Cornelissen, J.H.C.; Gurevitch, J. A meta-analysis of the response of soil respiration, net nitrogen mineralization, and aboveground plant growth to experimental ecosystem warming. Oecologia 2001, 126, 543–562. [Google Scholar]
  8. Updegraff, K.; Bridgham, S.D.; Pastor, J.; Weishampel, J.P.; Harth, C. Response of CO2 and CH4 emissions in peatlands to warming and water-table manipulation. Ecol. Appl. 2001, 11, 311–326. [Google Scholar]
  9. Zhou, W.; Hui, D.; Shen, W. Effects of soil moisture on the temperature sensitivity of soil heterotrophic respiration: A laboratory incubation study. PLoS ONE 2014, 9, e92531. [Google Scholar] [CrossRef] [PubMed]
  10. Swank, W.T.; Webster, J.R. Long-Term Response of a Forest Watershed Ecosystem: Clearcutting in the Southern Appalachians; Oxford University Press: New York, NY, USA, 2014; p. 247. [Google Scholar]
  11. Jacob, M.; Viedenz, K.; Polle, A.; Thomas, F.M. Leaf litter decomposition in temperate deciduous forest stands with a decreasing fraction of beech (Fagus sylvatica). Oecologia 2010, 164, 1083–1094. [Google Scholar] [CrossRef] [PubMed]
  12. Alexander, H.D. Increasing red maple leaf litter alters decomposition rates and nitrogen cycling in historically oak-dominated forests of the eastern U.S. Ecosystems 2014, 17, 1371–1383. [Google Scholar] [CrossRef]
  13. Mueller, K.E.; Hobbie, S.E.; Chorover, J.; Reich, P.B.; Eisenhauer, N.; Castellano, M.J.; Chadwick, O.A.; Dobies, T.; Hale, C.M.; Jagodziński, A.M.; et al. Effects of litter traits, soil biota, and soil chemistry on soil carbon stocks at a common garden with 14 tree species. Biogeochemistry 2015, 123, 313–327. [Google Scholar] [CrossRef]
  14. Coweeta Long Term Ecological Research. Continuously Streaming Data. Available online: http://cowddta.uga.edu/streaming (accessed on 9 October 2016).
  15. Nippgen, F.; McGlynn, B.L.; Emmanuel, R.; Vose, J. Watershed memory at the Coweeta Hydrologic Laboratory: The effect of past precipitation and storage on hydrologic response. Water Resour. Res. 2016, 52, 1673–1695. [Google Scholar] [CrossRef]
  16. Day, F.P.; Monk, C.D. Vegetation patterns on a southern Appalachian watershed. Ecology 1974, 55, 1064–1074. [Google Scholar] [CrossRef]
  17. Monk, C.D.; Day, F.P., Jr. Vegetation analysis, primary production and selected nutrient budgets for a Southern Appalachian oak forest: A synthesis of IBP studies at Coweeta. For. Ecol. Manag. 1985, 10, 87–113. [Google Scholar] [CrossRef]
  18. Soil Survey Staff. Soil Survey of Macon County, N.C.; US Department of Agriculture: Washington, DC, USA, 1996.
  19. Cromack, K.; Monk, C.D. Litter production, decomposition, and nutrient cycling in a mixed hardwood watershed and a white pine plantation. In Proceedings of the Mineral Cycling in Southeastern Ecosystems, Augusta, Georgia, 1–3 May 1974; Howell, F.G., Gentry, J.B., Smith, M.H., Eds.; Energy Research and Development Administration Symposium Series (Conf-740513). National Technical Information Service: Springfield, VA, USA, 1975. [Google Scholar]
  20. Qualls, R.G.; Takiyama, A.; Wershaw, R.L. Formation and loss of humic substances in the floor of a pine forest. Soil Sci. Soc. Am. J. 2003, 67, 899–909. [Google Scholar] [CrossRef]
  21. Jorgensen, J.R.; Wells, C.G.; Metz, L.J. Nutrient changes in decomposing loblolly pine forest floor. Soil Sci. Soc. Am. J. 1980, 44, 1307–1314. [Google Scholar] [CrossRef]
  22. Olson, J. Energy storage and the balance of producers and decomposers in ecological systems. Ecology 1963, 44, 322–331. [Google Scholar] [CrossRef]
  23. Melillo, J.M.; Aber, J.D.; Muratore, J.F. Nitrogen and lignin control of hardwood leaf litter decomposition dynamics. Ecology 1982, 63, 621–626. [Google Scholar] [CrossRef]
  24. Berish, C.W.; Ragsdale, H.L. Metals in low-elevation, Southern Appalachian forest floor soil. J. Environ. Qual. 1986, 15, 183–187. [Google Scholar] [CrossRef]
  25. IBM SPSS Statistics for Windows, version 21.0; IBM Corp: Armonk, NY, USA, 2012.
  26. Adair, E.C.; Hobbie, S.E.; Hobbie, R.K. Single-pool exponential decomposition models: Potential pitfalls in their use in ecological studies. Ecology 2010, 91, 1225–1236. [Google Scholar] [CrossRef] [PubMed]
  27. Scowcroft, P.; Turner, D.R.; Vitousek, P.M. Decomposition of Metrosideros polymorpha leaf litter along elevational gradients in Hawaii. Glob. Chang. Biol. 2008, 6, 73–85. [Google Scholar] [CrossRef]
  28. Hyvonen, R.; Ägren, G.I.; Dalias, P. Analysing temperature response of decomposition of organic matter. Glob. Chang. Biol. 2005, 11, 770–778. [Google Scholar] [CrossRef]
  29. Clemmensen, K.E.; Bahr, A.; Ovaskainen, O.; Dahlberg, A.; Ekblad, A.; Wallander, H.; Stenlid, J.; Finlay, R.D.; Wardle, D.A.; Lindahl, B.D. Roots and associated fungi drive long-term carbon sequestration in boreal forest. Science 2013, 339, 1615–1618. [Google Scholar] [CrossRef] [PubMed]
  30. Berg, B.; Steffen, K.; McClaugherty, C. Litter decomposition rate is dependent on litter Mn concentrations. Biogeochemistry 2007, 82, 29–39. [Google Scholar] [CrossRef]
  31. Keiluweit, M.; Nico, P.; Harmon, M.E.; Mao, J.; Pett-Ridge, J.; Kleber, M. Long-term litter decomposition controlled by manganese redox cycling. Proc. Natl. Acad. Sci. USA 2015, 112, E5253–E5260. [Google Scholar] [CrossRef] [PubMed]
  32. Parton, W.; Silver, W.L.; Burke, I.C.; Grassens, L.; Harmon, M.E.; Currie, W.S.; King, J.Y.; Adair, E.C.; Hart, S.C.; Brandt, L.A.; et al. Global-scale similarities in nitrogen release patterns during long-term decomposition. Science 2007, 315, 361–364. [Google Scholar] [CrossRef] [PubMed]
  33. Binkley, D. Ten-year decomposition in a loblolly pine forest. Can. J. For. Res. 2002, 32, 2231–2235. [Google Scholar] [CrossRef]
  34. Vesterdal, L.; Clarke, N.; Sigurdsson, B.D.; Gundersen, P. Do tree species influence soil carbon stocks in temperate and boreal forests? For. Ecol. Manag. 2013, 309, 4–18. [Google Scholar] [CrossRef]
  35. Augusto, L.; De Schrijver, A.; Vesterdal, L.; Smolander, A.; Prescott, C.; Ranger, J. Influences of evergreen gymnosperm and deciduous angiosperm tree species on the functioning of temperate and boreal forests. Biol. Rev. 2015, 90, 444–466. [Google Scholar] [CrossRef] [PubMed]
  36. Prescott, C.E. Litter decomposition: What controls it and how can we alter it to sequester more carbon in forest soils? Biogeochemistry 2010, 101, 133–149. [Google Scholar] [CrossRef]
  37. Knoepp, J.D.; Vose, J.M.; Swank, W.T. Nitrogen deposition and cycling across an elevation and vegetation gradient in southern Appalachian forests. Int. J. Environ. Stud. 2008, 65, 389–408. [Google Scholar] [CrossRef]
  38. Qualls, R.G.; Haines, B.L.; Swank, W.T. Fluxes of dissolved organic nutrients and humic substances in a deciduous forest ecosystem. Ecology 1991, 72, 254–266. [Google Scholar] [CrossRef]
  39. Ma, W.; Liang, J.; Cumming, J.R.; Lee, E.; Welsh, A.B.; Watson, J.V.; Zhou, M. Fundamental shifts of central hardwood forests under climate change. Ecol. Model. 2016, 332, 28–41. [Google Scholar] [CrossRef]
  40. Swank, W.T.; Reynolds, L.J.; Vose, J.M. Appendix data. In Atmospheric Deposition and Forest Nutrient Cycling: A Synthesis of the Integrated Forest Study; Johnson, D.W., Lindberg, S.E., Eds.; Ecological Series 91; Springer: New York, NY, USA, 1991; pp. 583–609. [Google Scholar]
  41. Qualls, R.G.; Haines, B.L.; Swank, W.T.; Tyler, S.W. Retention of dissolved organic nutrients by a forested ecosystem. Biogeochemistry 2002, 61, 135–171. [Google Scholar] [CrossRef]
  42. Qualls, R.G.; Bridgham, S.D. Mineralization rate of 14C labeled dissolved organic matter from leaf litter in soils from a weathering chronosequence. Soil Biol. Biochem. 2005, 37, 905–916. [Google Scholar] [CrossRef]
Figure 1. Decomposition of forest floor C as a percentage of litterfall C: pine plantation watersheds. Colors of points indicate individual plots.
Forests 07 00231 g001
Figure 2. The fate of litterfall carbon in the South facing deciduous forest floor. Standing stocks and fluxes are shown as g·C/m2 (per year). In parenthesis, the fluxes are shown as a percentage of litterfall rate. All fluxes and stocks are for foliar litterfall, except that small woody litterfall is also indicated separately. Mineralization was estimated by the balance of all other fluxes. The arrow from the forest floor (0–13 years) to the “Older humus” represents the mass of the layer of the 13th year being transferred to the “older than 13 years humus”. The net DOC (dissolved organic C) leaching flux is taken from Qualls et al. [38] which was done on the same watershed. The net DOC leaching flux was calculated as the flux from the forest floor minus DOC flux in throughfall so as to represent the net amount of C originating from the forest floor. Bioturbation of C between the forest floor and the A horizon was not quantified in the study and so is shown as a question mark. Soil C in the A horizon for the South facing deciduous WS is cited from Swank at al. [40] and the net removal of DOC from solution flowing through the A horizon is from Qualls et al. [41] but it includes some portion originating from throughfall.
Forests 07 00231 g002
Table 1. Characteristics of the four paired watersheds used in this study.
Watershed Name117218
AspectSouth facingNorth facingSouth facingNorth facing
VegetationPine plantationPine plantationDeciduousDeciduous
Mean Elevation (m)834894853821
Mean Precipitation (cm)172197178193
Growing season potential insolation (kWh/m2)1384118714041218
Dormant season potential insolation (kWh/m2)927500982568
Mean Air Temp. 1 m aboveground (°C)N.A.N.A.14.013.9
Mean Soil Surface Temperature (°C)N.A.N.A.14.5812.54 **
Mean Soil Temp. 20 cm depth (°C)N.A.N.A.14.3712.44 **
Mean precipitation and insolation are taken from Nippgen et al. [15], and are for the period 1991–2011. Soil and air temperatures are from the Coweeta LTER online streaming data portal and are from 25 August 2015 to 24 August 2016. The difference in soil surface temperature on the North facing and South facing slopes of the deciduous watersheds (WSs) were tested by a paired t-test, calculating the difference in temperature between the two at each time (mean ΔT = 2.04 ± 0.2 °C). The paired t-test indicated a highly significant difference (p < 0.01, signified by **). The designation N.A. means no sensors were available.
Table 2. Turnover rates (litterfall C mass/sum of C in mass of ages 1–13 years).
WatershedPineDeciduous
South facing0.359 (±0.006) a,*0.328 (±0.011)
North facing0.295 (±0.011)0.297 (±0.012)
ANOVAM.S. **p
Species0.0011p = 0.16
Aspect0.0114p = 0.0002
Interaction0.0013p = 0.13
a (±standard error of the mean); * n = 4, n = 5 for all others.** mean squared error
Table 3. Exponential decay rates of “slow” fraction.
PineDeciduous
South facing0.156 (±0.008)0.160 (±0.012)
North facing0.149 (±0.009)0.136 (±0.014)
Table 4. Exponential decomposition k values for years 6–13.
WatershedkR2 *
South facing pine0.1170.65
North facing pine0.2570.76
South facing deciduous0.2790.50
North facing deciduous0.3260.69
* For all regressions p < 0.05.
Table 5. Accumulation of forest floor C older than 13 years.
Watershedg·C/m2 (±SE)% of C in Litterfall (±SE)
South facing pine17.0 (±5.3)7.1 (±2.4)
North facing pine17.8 (±8.1)5.9 (±2.6)
South facing deciduous11.2 (±4.3)4.3 (±2.4)
North facing deciduous5.8 (±2.2)3.2 (±1.2)
Table 6. Downward fluxes of C in fine particles from the bottom net. Data show that there was no large flux of fine particulate C into the mineral soil.
Watershedg·C/m2 (±SE)% of C in Forest Floor above (±SE)
South facing pine1.6 (±2.9)0.12 (±0.003)
North facing pine0.3 (±0.2)0.025 (±0.02)
South facing deciduous4.1 (±2.2)0.54 (±0.004)
North facing deciduous5.1 (±0.21)0.47 (±0.10)
Table 7. Species composition in litterfall on the two deciduous watersheds and the inferred similarity of the mixture of species specific decomposition rates found by Cromack and Monk [18] on the North facing deciduous WS as indicated by the “weighted decomposition k”.
SpeciesSouth Facing WS (% of Litterfall)North Facing WS (% of Litterfall)1st Year k from Literature a% N% PLignin (%)Lignin/N Ratio
Quercus velutina23.019.00.62----
Acer rubrum17.919.60.771.20.1412.710.6
Carya spp.4.922.40.971.20.1616.914.1
Quercus alba18.90.20.721.00.1717.217.2
Quercus coccinia12.55.10.730.90.1216.718.6
Quercus prinus0.414.50.611.20.1225.521.3
Nyssa sylvatica9.32.90.59----
Other spp. b5.94.20.70----
Pinus strobus09.10.460.90.113134.4
Fagus grandiflora6.70.10.601.0-2222.0
Ulmus sp.0.52.00.70----
Cornus florida00.71.261.4-3.92.8
Liriodendron tulipifera00.2-1.0-16.616.6
Hardwood mix b--0.70----
Weighted decomposition k a0.700.72-----
a k is the first year decomposition constant cited mainly from Cromack and Monk [19]. % N, % P, and lignin contents are from the same source; b Other species were assumed to have a k value of 0.70 based on the “Hardwood mix” litterbag experiment on the North facing deciduous WS by Cromack and Monk [19].

