1. Introduction
Prolonged below-normal precipitation and above-normal temperatures from 1998–2004 led to drought over an extensive swath of the Northern Hemisphere mid-latitudes, with a significant tree dieback in many of the wooded areas in the American Southwest. Fifteen months of depleted soil water content resulted in significant mortality of the dominant overstory of piñon pine (
Pinus edulis Engelm
.) [
1,
2,
3]. A similar event occurred in northern New Mexico in the 1950s when the ecotone between semiarid ponderosa pine forest and piñon-juniper woodland shifted location extensively (2 km or more) and rapidly (<5 years) through ponderosa pine mortality in response to a severe drought [
4], and more recently, similar drought-related mortality in ponderosa pine and mixed conifer forests has also been reported [
5,
6].
Most tree death is episodic and irregular [
7]; this is especially true in dieback cases. These essentially episodic but unpredictable events appear to occur somewhat regularly throughout geologic time. The causes of dieback are case by case due to the differing conditions of each area, but long-term climatic change has been suggested as a major cause of stand-level dieback [
8].
The invasion of woody species into areas they did not historically inhabit and the general increase of tree density in areas already forested have created greater water stress in many areas of the American Southwest. This in turn could mean that the water stress caused by drought would be exacerbated due to the excess amount of woody species. For ponderosa pine, the spatial pattern of mortality corresponded directly to elevation/moisture gradients. Mortality of ponderosa pine was apparently widespread on drier, lower-elevation sites across the drought-affected region. Moreover, the effects of the drought have persisted. There is little evidence of ponderosa pine re-establishment in recent decades in spite of favorable climatic conditions [
9]. In northern Arizona and northern New Mexico, a more recent drought caused substantial tree dieback in many species, with piñon pine being the most affected [
1,
10,
11]. The proximal cause of the mortality for most of the trees was apparently infestation by bark beetles; such outbreaks are tightly tied to drought-induced water stress [
1]. It was found that piñon pine seedlings exhibited the lowest levels of mortality during severe drought while mature tree mortality exceeded 50%. Aerial surveys of the Southwest in 2003 showed that 12,191 km
2 of piñon and ponderosa pine had experienced substantial mortality, correlated with abnormally low precipitation and high temperatures. Piñon pine mortality greatly exceeded juniper mortality during 1996 and 2002 [
11]. It was hypothesized that such high mortality could result in bottleneck events that reduce genetic variation or favor drought-adapted genotypes [
10], and that this rapid die-off could have a number of important, interrelated ecological implications such as large changes in carbon stores and dynamics, near-ground solar radiation, runoff and erosion, genetic structure of the dominant tree species, and land surface microclimate feedbacks to the atmosphere. Such rapid shifts in vegetation may represent abrupt, rapid, and persistent shifts not only in ecotones but also in dominant vegetation cover and associated ecosystem processes [
1].
The Los Alamos region, located on the eastern slopes of the Jemez Mountains of northern New Mexico and relatively free of human-caused disturbance, contains a large elevational gradient of habitats, has a history of strong environmental assessment, and has an abundance of available data on both vegetation structures and meteorology [
12,
13].
We assessed the mortality of ponderosa pine (Pinus ponderosa Dougl. Ex Laws.) and spruce-fir (Picea A. Dietr.-Abies Mill.) communities in the Los Alamos regions of northern New Mexico during the 2000–2003 drought period, as well as the effect of mechanical thinning on ponderosa pine mortality. Our hypotheses were that the different communities would have different mortalities in response to a drought event and that mechanical thinning in the ponderosa pine community would reduce the mortality caused by increased soil water competition during the drought.
2. Materials and Methods
2.1. Study Area
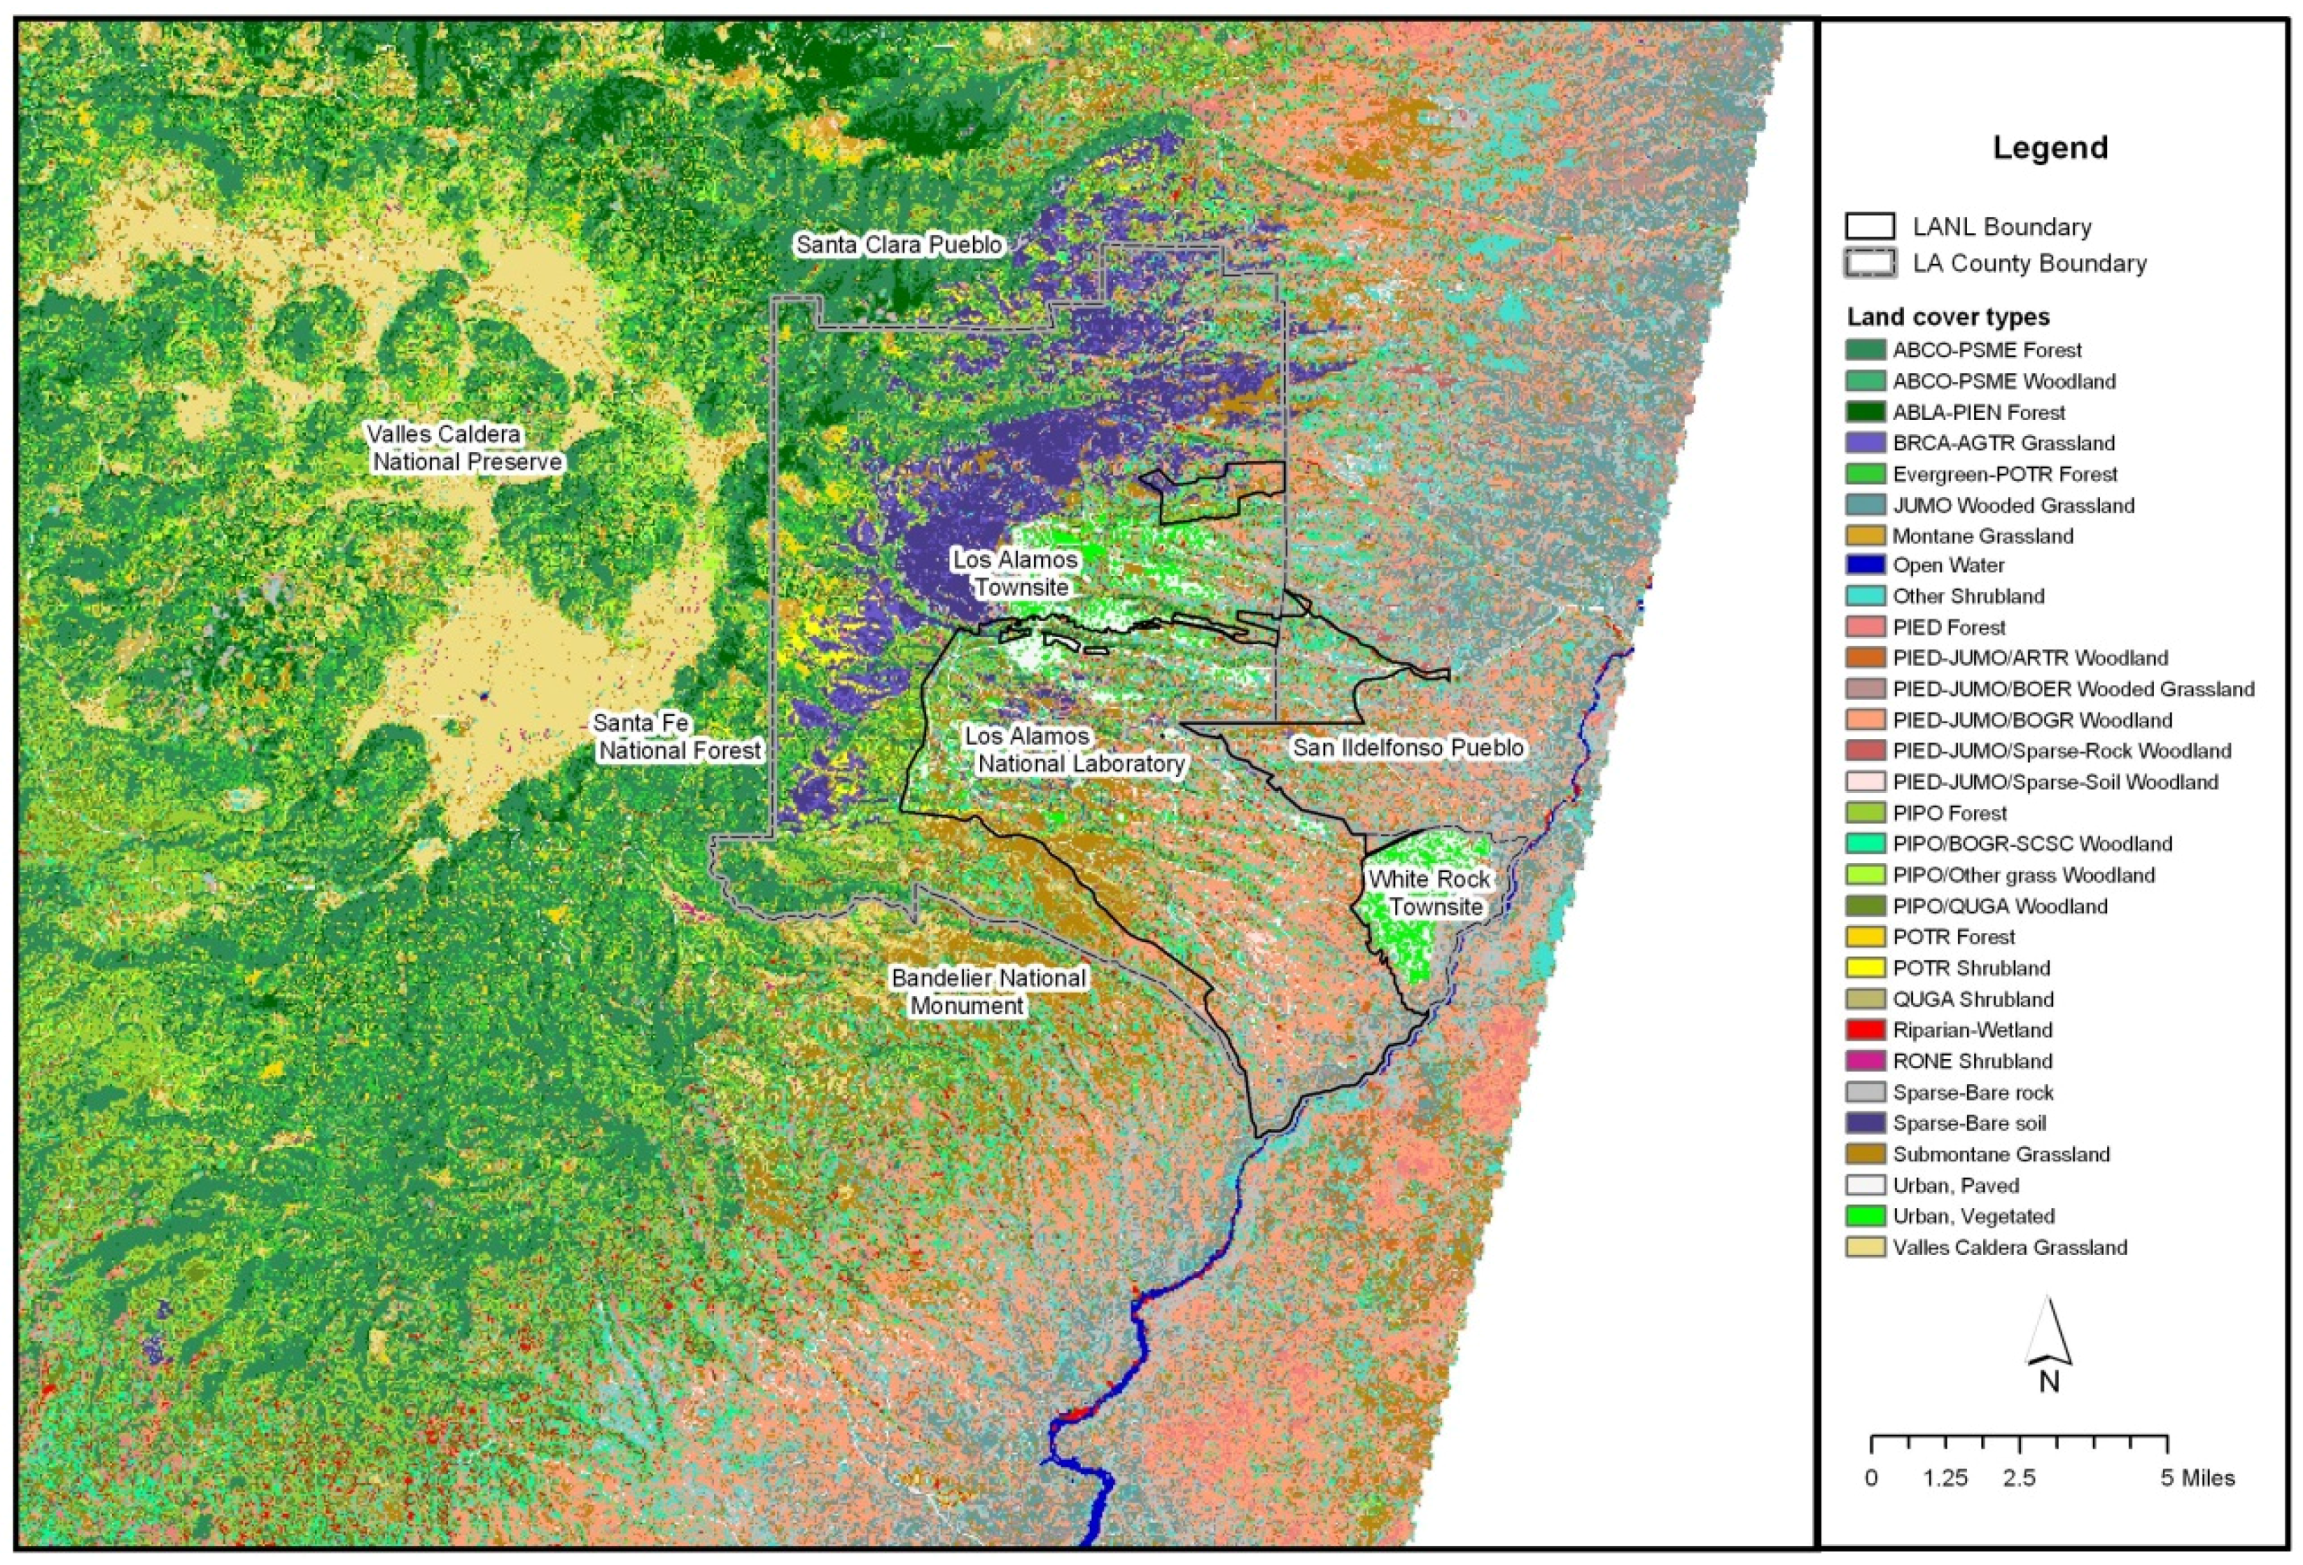
The study area was in the eastern portions of the Jemez Mountains and the adjacent Pajarito Plateau. This includes the Los Alamos National Laboratory (LANL), the Los Alamos townsite, White Rock and surrounding environs (
Figure 1). In addition to LANL, the major landowners and land managers of this region include the Santa Fe National Forest, Bandelier National Monument, Los Alamos County, the Pajarito Ski Area and the Valles Caldera National Preserve. Approximately 29,542 ha (73,000 ac) are within this region. The area descends into White Rock Canyon and borders the Rio Grande to the east. To the west, Los Alamos County ascends to the Sierra de Los Valles, a segment of the rim of the Valles Caldera, remnants of an ancient volcano. In between White Rock Canyon and the Sierra de Los Valles, the highly dissected Pajarito Plateau is the dominant landform. The eastern border of the county is at its lowest elevation, approximately 1631 m (5350 ft). The highest peak is Pajarito Mountain, at 3182 m (10,441 ft).
In general, the precipitation increases with elevation in the Los Alamos region
. At the lowest elevations in White Rock Canyon, the annual precipitation is approximately 241 mm (9.5 inches), at higher elevations in the Sierra de los Valles, the annual precipitation averages 762 mm (30 inches) or more. During the winter months, annual snow depths at higher elevations can exceed 127 cm (50 inches). The precipitation levels can vary widely from year to year [
14]. Annual precipitation levels at Los Alamos range from 173 mm to 770 mm (6.8 inches to 30.3 inches). Snowfall also varies considerably from year to year, from the minimum of 236 mm to 3891 mm (9.3 inches to 153.2 inches).
Significant increases in temperatures and decreases in total precipitation occurred during the drought, even though no significant reductions in annual snow pack were found.
2.2. Vegetation Types
From low to high elevations, the predominant vegetation types in this study area consist of juniper savannas, piñon-juniper woodlands, ponderosa pine forests, mixed-conifer forests, and spruce-fir forests [
15,
16]. Aspen forests and a variety of grasslands and shrublands may also be found. Areas that were severely burned by the Cerro Grande Fire during the late spring of 2000 were bare ground or sparse vegetation immediately after that fire, but recovered to grasslands or shrublands within a few years [
17].
2.3. Field Methods
The field methods described here are synthesized from previous work in the area [
12,
13]. We conducted stratified random sampling, using multi-spectral, remotely sensed and digital elevation model (DEM) data to identify potential plot locations within the targeted communities as shown in
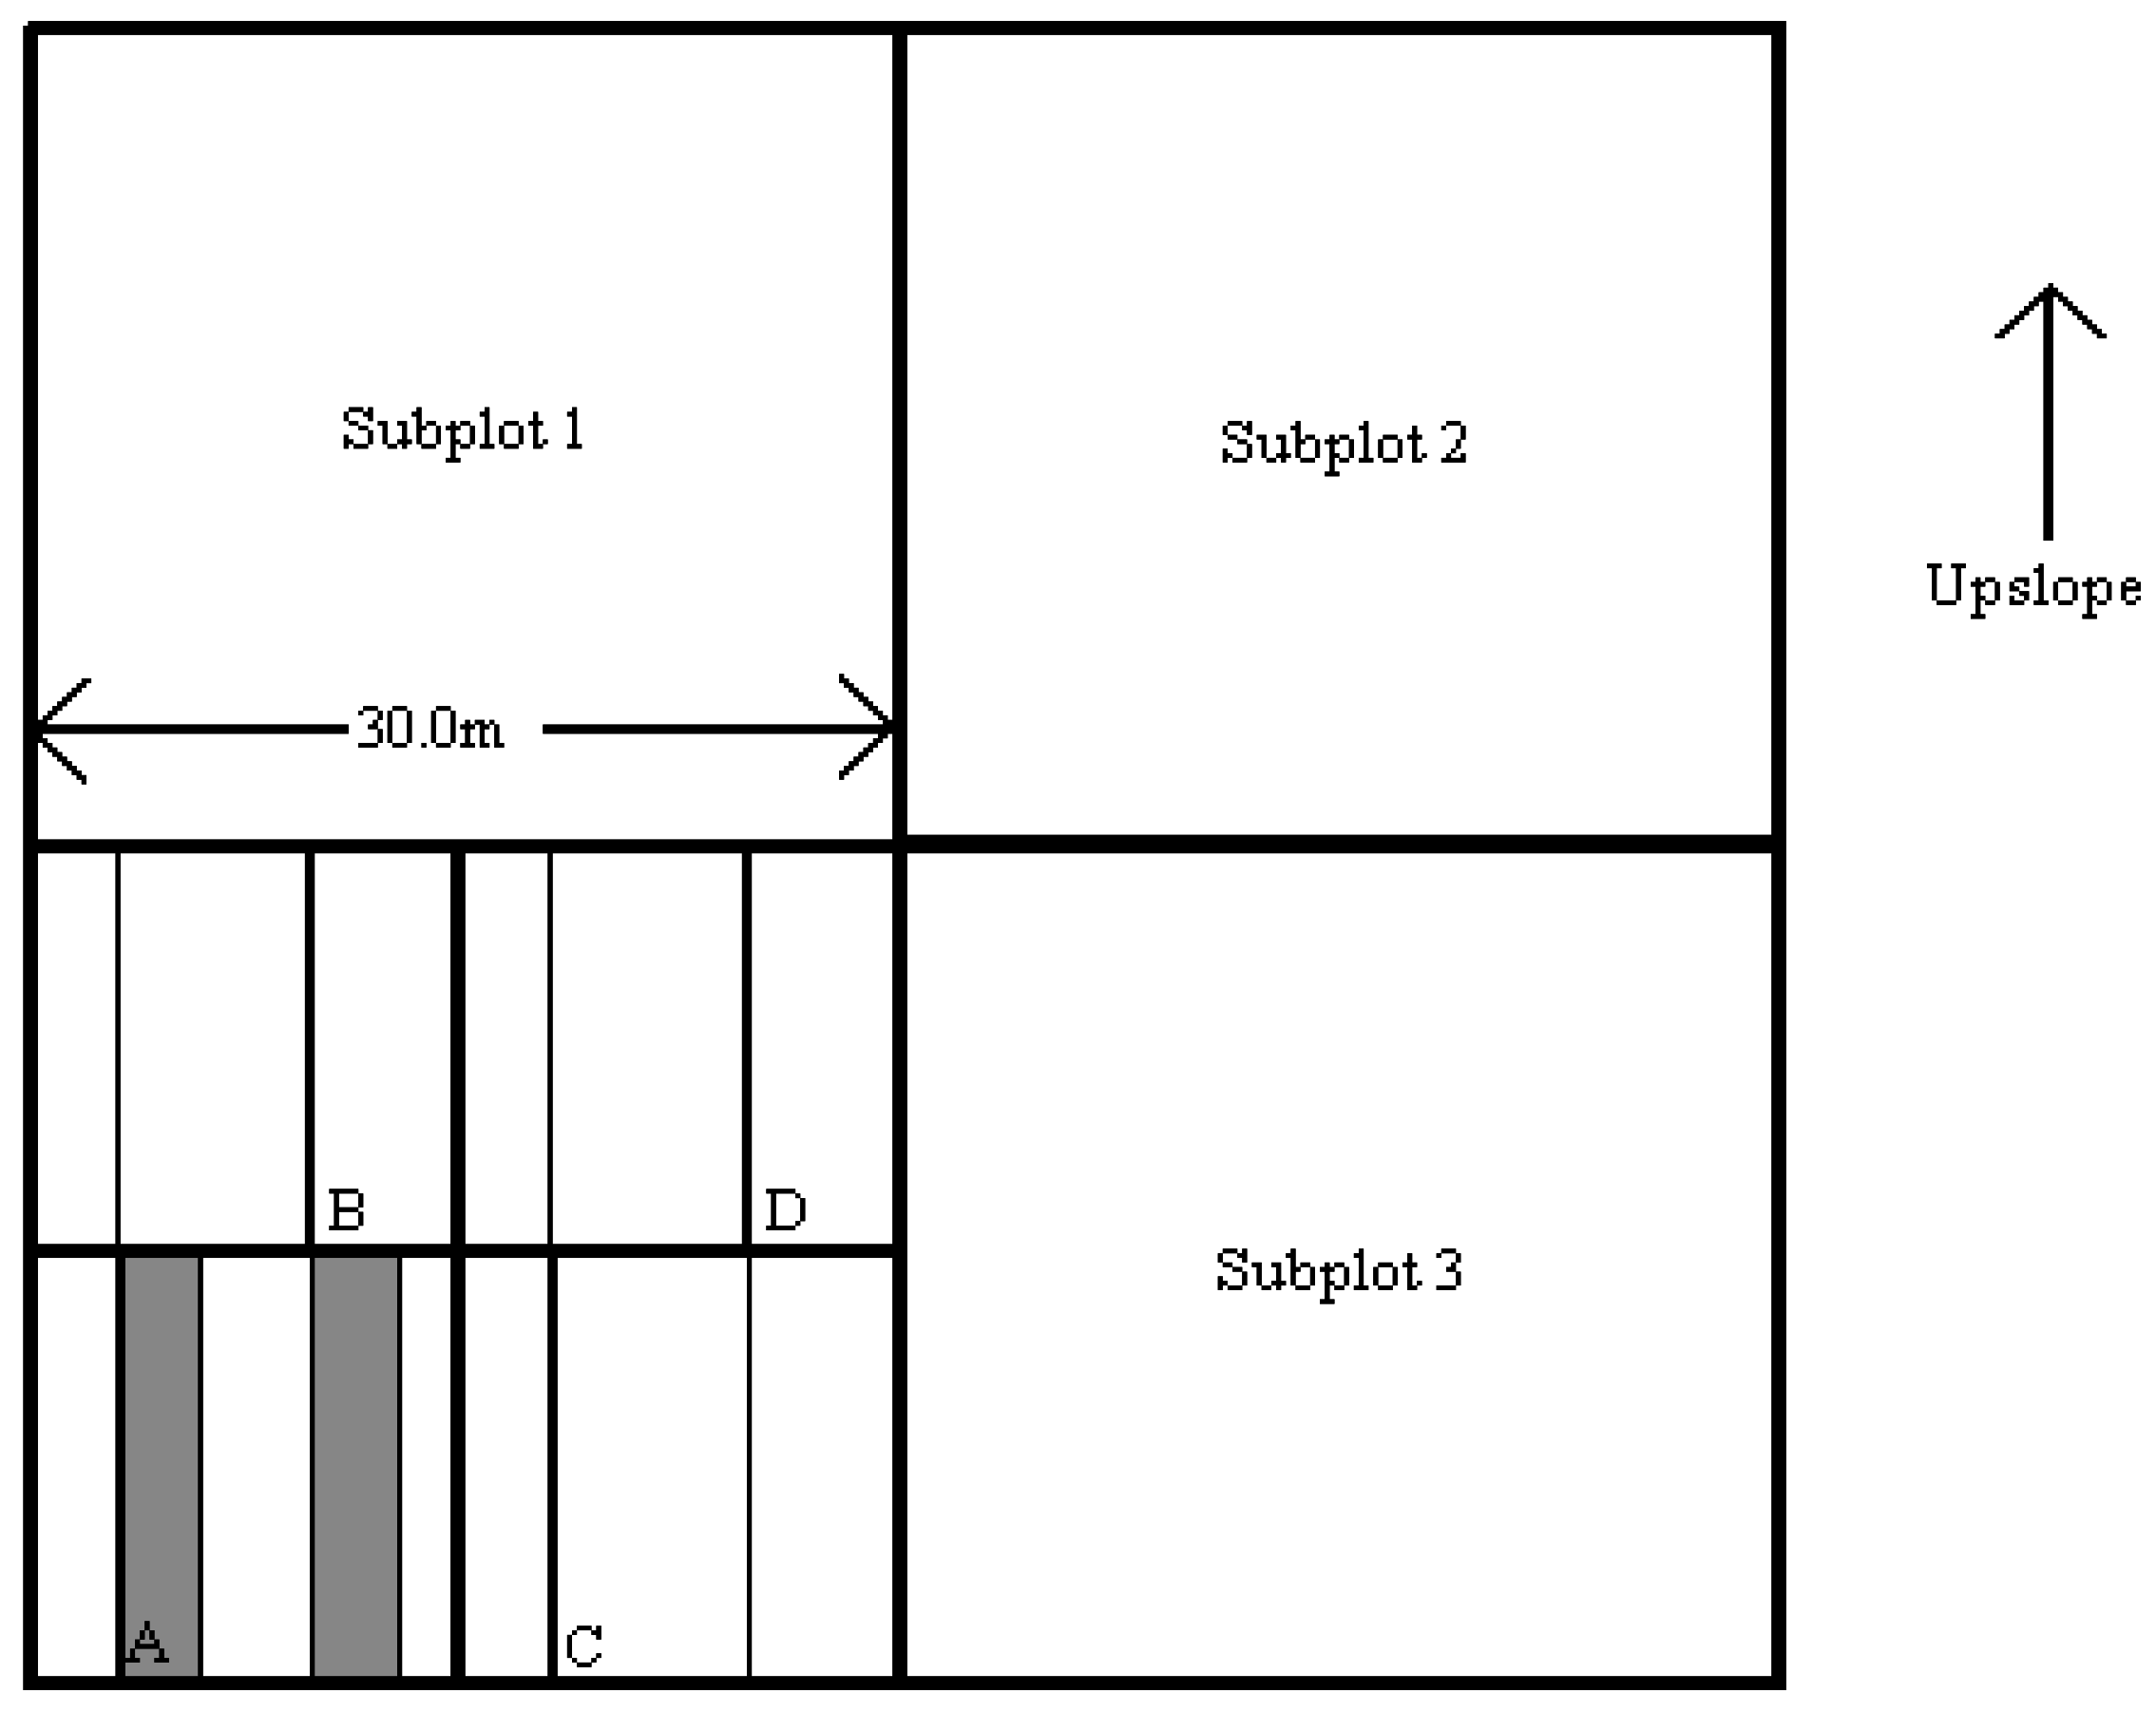
Figure 1. Following the automated stratification procedure, individual sites were selected for further analysis on the ground. Each site was checked to verify the homogeneity of topographic, soil and vegetation conditions over a distance on 60 m in all four cardinal directions. If these conditions were not met, the site was rejected and either a new randomly selected point was located in the field or the original point was replaced by the nearest homogeneous area of vegetation. A nested, randomized plot layout and sampling design was utilized. This was accomplished by defining a macroplot that consisted of four subplots (
Figure 2). The macroplot consisted of a square area, 60 m on each side, and oriented parallel to the slope contours. The horizontal and vertical compass bearings, as well as their respective back bearings, were recorded. The plot center was permanently marked with rebar.
The subplots were numbered sequentially in a clockwise direction, with the subplot number 1 located in the upper left corner of the macroplot. In this fashion, subplot 1 and subplot 2 were always upslope, whereas subplot 3 and subplot 4 were always downslope. Two of these subplots were randomly selected for further sampling.
Each of the two subplots selected for sampling was further divided into quads and three of the four quads were randomly selected for detailed sampling. Trees taller than 3 m (10 ft) tall and other overstory characteristics were measured in each quad of the two subplots. Most of the other parameters and site descriptors were measured in the quad, in strip plots, or along line transects within the quad.
To optimize the sampling of shrubs and small trees that were less than ten feet tall, a system of strip plots was selected. This was accomplished by assessing the density of shrubs and small trees in the less than 3 m size height class and selecting an appropriate strip plot scheme. More compact combinations of strip plots and sub-strip plots were used for plots with numerous seedlings, saplings and small shrubs. Moderate combinations were used for typical forested conditions. Extensive combinations of strip plots and sub-strip plots were used for sparsely forested or non-forested plots that had few seedlings, saplings or small shrubs. Using the optimal plot size that was selected and recorded, two line transects were constructed in each quad and used to construct the strip plots. In Quad A, the first (left) line transect was used to create the first strip plot (A), and in Quad B, the second (right) line transect was used to create the second strip plot (B). In either case, this is done with a 15-m tape that extended from the lower boundary of the quad to the upper boundary. The 15-m tape was parallel to its companion line-transect tape and was separated by a distance as prescribed by the size of the strip plot, 1 m, 2 m, or 3 m (
Figure 3).
2.4. Sampling Methods
Sampling occurred between 1998 and 2005 to capture a range of years, overlapping the drought in question. All plots overstory densities ranged from 500–800 trees per hectare, depending on the community type and site conditions. Thinning targets ranged from 50–1500 trees per hectare, again depending on which community was thinned. Thinned plots were within management areas to be thinned, and occurred across the range of years. They were not set up as paired to non-thinned plots, nor was proximity to unthinned plots measured.
From the center of each subplot, the slope (%), aspect (degrees), elevation (m above MSL), topographic position (ridge, upper slope, mid slope, lower slope, bench or flat, or drainage bottom), plus horizontal and vertical configuration (convex, concave, straight, or undulating) were recorded. Strip plots were used to sample all trees and shrubs that met specific height criteria. The strip plots were used to sample all trees and shrubs taller than 0.6 m but shorter than 3 m in height. Information recorded for each individual includes the species, live or dead status and total height. Overstory trees and shrubs were defined as those that were ≥3 m tall. Overstory was recorded by species and either live or dead. For dead trees, the species, diameter at breast height (DBH), and the total height were recorded. For each live tree, the previous information was always collected and the number of multiple stems, if any, was also recorded. DBH were recorded to the centimeter and height to the decimeter.
2.5. Data Summarization and Analysis
Thirty plots representing unthinned ponderosa pine forests and sixteen plots representing spruce-fir forests were analyzed, as well as sixteen plots for thinned ponderosa pine forests. Sixteen plots were used for direct measurement of spruce-fir drought mortality. Only prominent tree species within each of these vegetation types were analyzed. For ponderosa pine forests, this was limited to ponderosa pine; for spruce-fir forests, this was limited to corkbark fir (Abies lasiocarpa (Hook.) Nutt.), white fir (A. concolor (Gord. And Glend.) Hildebr.), Engelmann spruce (Picea engelmanni Parry ex. Engelm.), quaking aspen (Populus tremuloides Michx.), and Douglas-fir (Pseudotsuga menziesii (Mirb). Franco). The spruce-fir data were also broken down into the two major habitat types, (Picea engelmanni/Erigeron eximius Greene, Engelmann spruce/forest fleabane) Pien/Erex and (Abies lasiocarpa/Vaccinium myrtillus L., subalpine fir/myrtleleaf blueberry) Abla/Vamy.
Each tree sampled in the plot was categorized into species, live or dead status, and height and/or diameter size. For trees less than or equal to 3 m (10 ft), height was used, as defined by the following upper boundaries of each class: 0.3 m (1 ft), 0.6 m (2 ft), 2 m (6 ft), and 3 m.
For trees taller than 3 m (10 ft), DBH size classes were used, as defined by the following upper boundaries of each class: 10 cm (4 inches), 20 cm (8 inches), 30 cm (12 inches), 40 cm (16 inches), 50 cm (20 inches), 60 cm (24 inches), 71 cm (28 inches), 81 cm (32 inches), and ≥81 cm.
These data were collected and organized by subplot. A mean percent mortality was calculated for each species and size class per subplot. Thus, a zero represented zero percent mortality. Plots were organized by the year of the sample. The plot samples were also categorized by premortality (before 2002) and postmortality (2002 and later).
A two-sample one-tailed
t test and a Wilcoxon paired-sample one-tailed
t test was used to determine if there were any significant increases in tree mortality with respect to drought response. For the Wilcoxon paired-sample one-tailed
t test, the earliest eight samples were compared with the eight post drought samples. This was because there was no geographic or numerical bias and this limits the effect of the upcoming drought on the pre-drought data. These tests produced
P values small enough to shield the study from Type I error. The same techniques were also used to compare the drought response in both thinned and un-thinned areas to determine if thinning relieved the trees of enough competition to reduce mortality. Further, Canonical Correspondence Analysis (CCA) was used to interpret the weather’s effect on each of the ecozones. CCA analysis was carried out using PC-ORD Version 5 software [
18], using calendar year data.
3. Results
3.1. Mortality
With the exception of the smallest class, all size classes (0–40 cm DBH) as well as the largest class of unthinned ponderosa pine were found to have significantly greater mortality post-drought. Since no significant differences with respect to pre and post-drought measurements for thinned ponderosa pine were found (
Table 1), CCA analyses were not run. However, Wilcoxon paired-sample one-tailed
t tests found significantly greater mortality post-drought (
Table 2).
The only size classes that were found to be significantly different with respect to mortality pre and post-drought in spruce-fir were the DBH size classes of 20–30 and 30–40 cm (
Table 1), with greater mortality recorded post-drought. While no size classes were found to be significant for the Abla/Vamy Habitat Type, the 10–20, 20–30, and 30–40 cm size classes were found to be significantly greater post-drought in the Pien/Erex habitat yype (
Table 3).
The only size class for white fir that was found to have significantly greater mortality post-drought was the 10–20 cm DBH class, for Engelmann spruce, only the 20–30 cm class, and for Douglas-fir, only the 0–10 cm class. No size classes for aspen were found to be significantly different (
Table 4).
3.2. Measurement of Drought Induced Mortality
While total mortality of all trees in the Spruce-fir communities ranged from 2.3%–5.4% across the five species, the percent mortality that was drought induced ranged from 21.7% to 75.0% for the conifer species but only 8.5% for aspen (
Table 5).
3.3. Canonical Correspondence Analysis
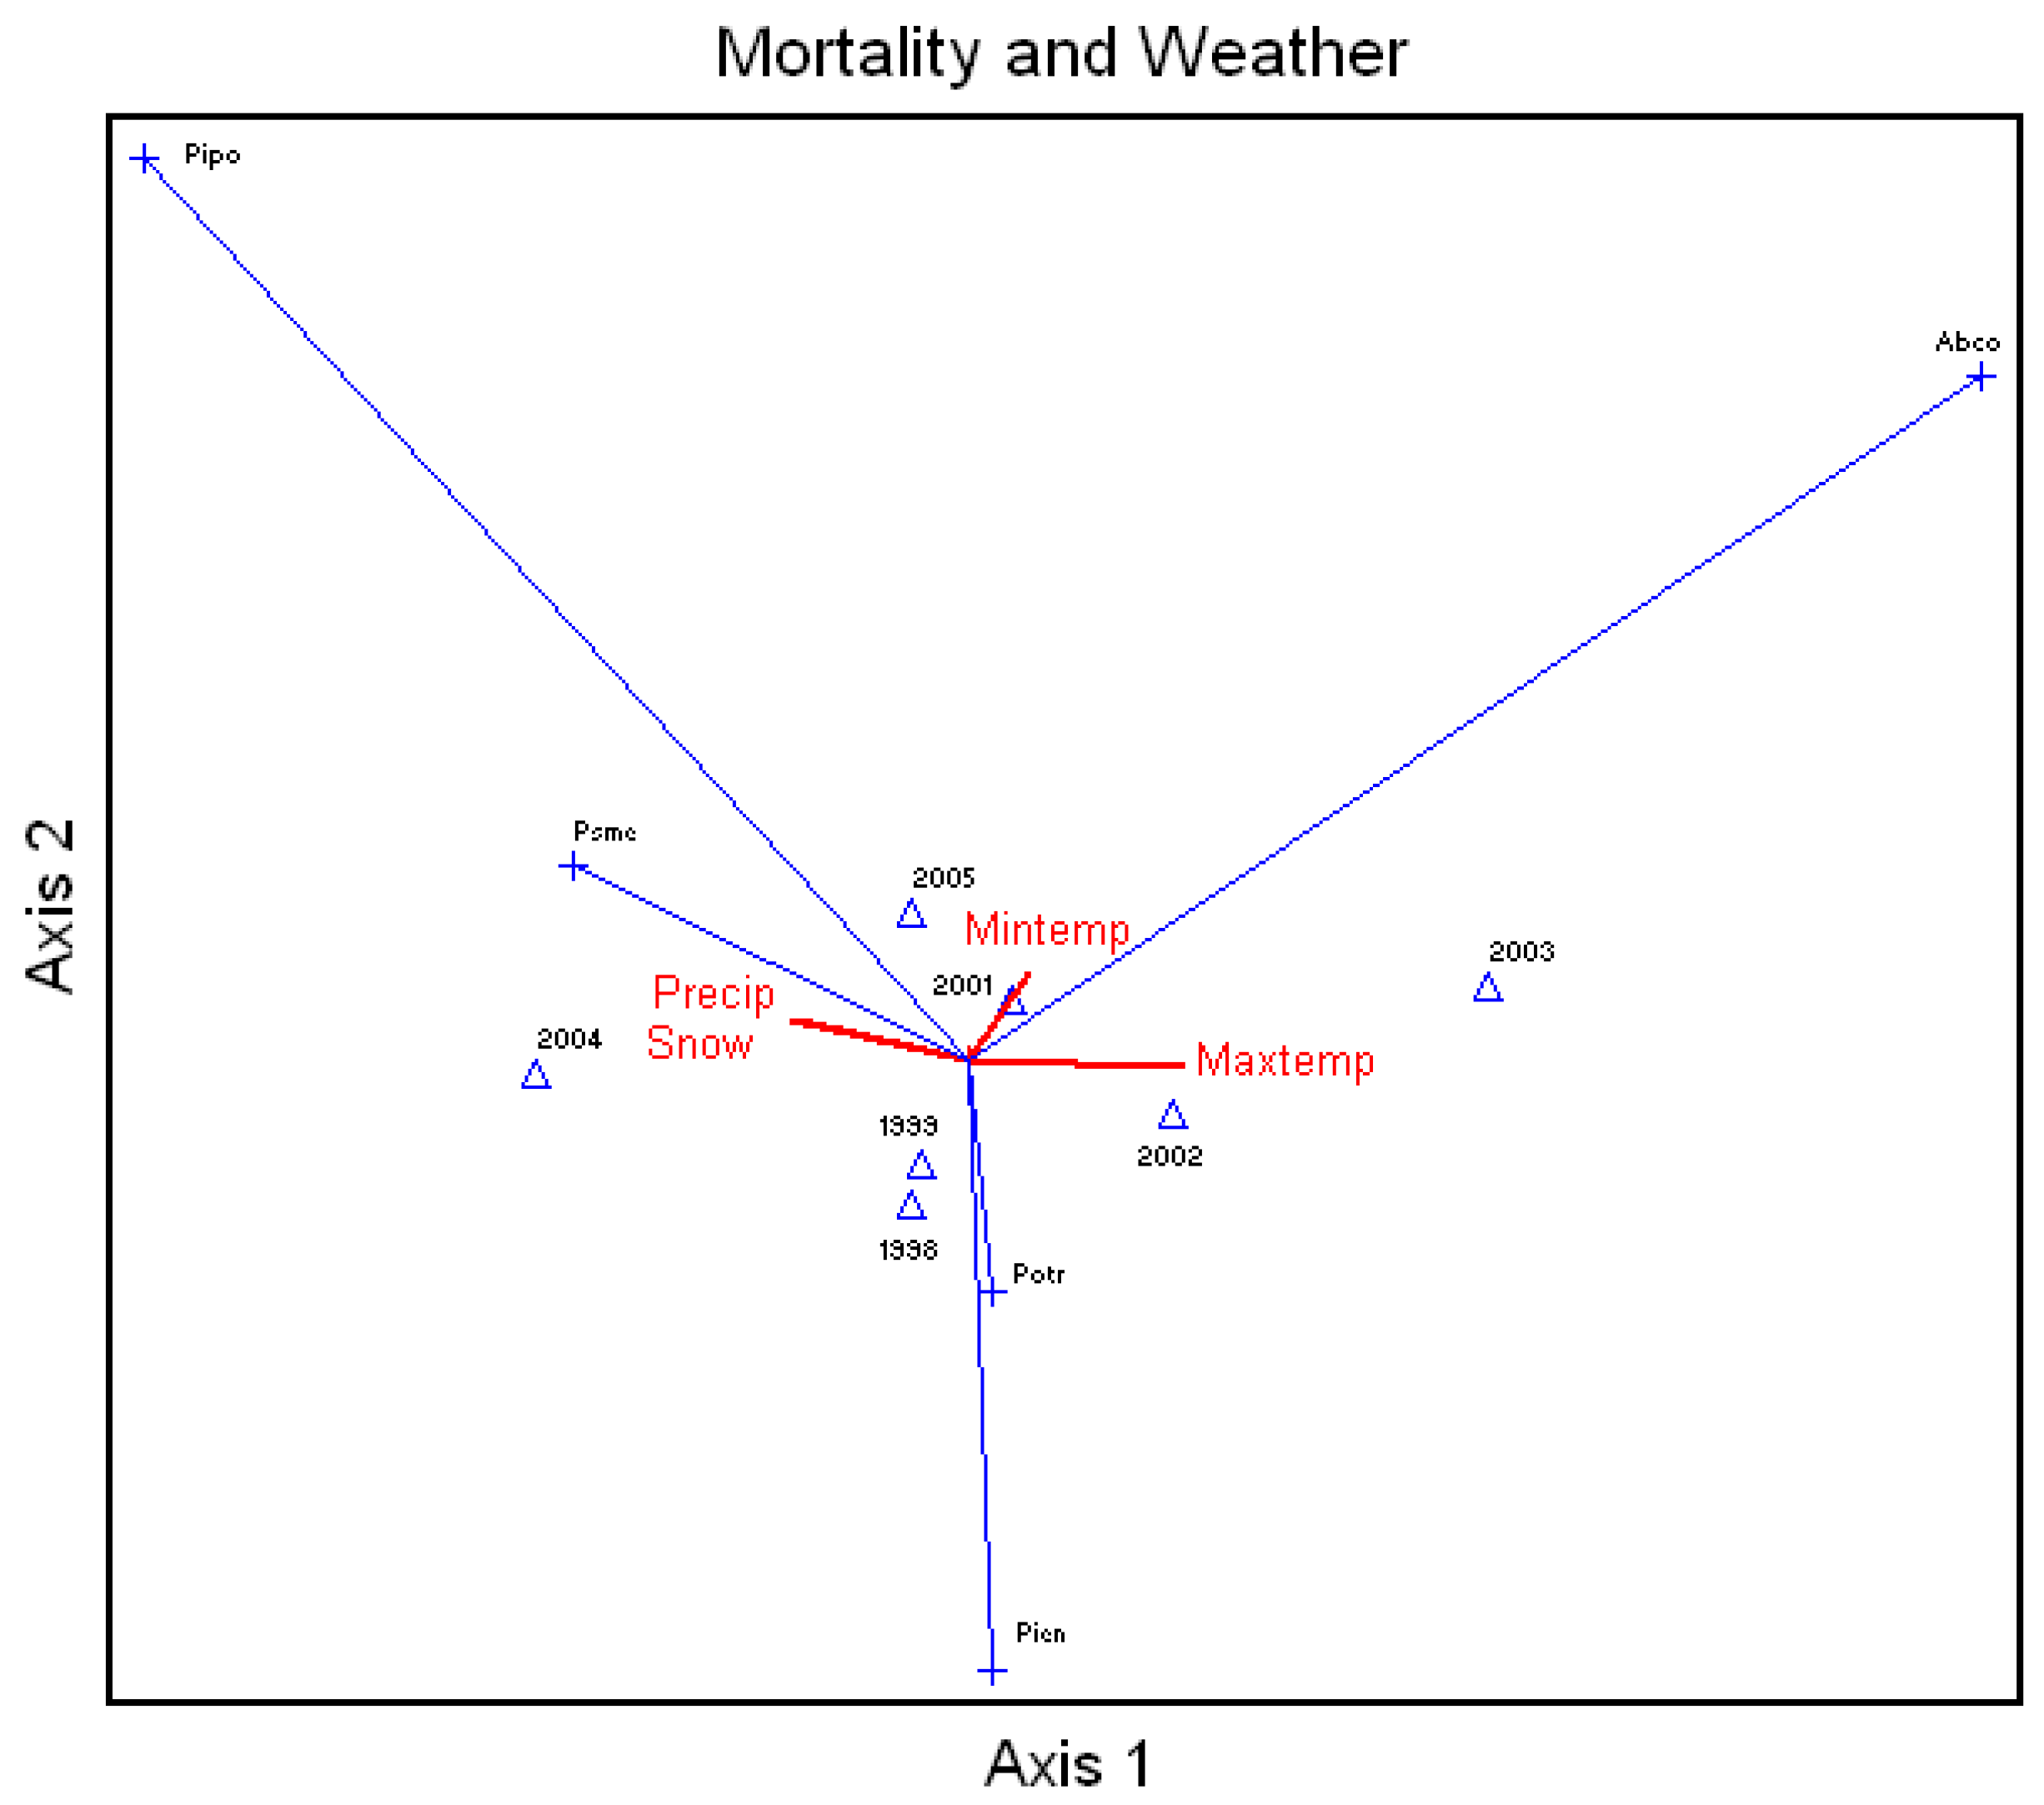
Average percent mortality of all species (annual mortality) correlated to the annual (calendar year) snow, rainfall, and average daily maximum and minimum temperatures showed that unthinned ponderosa pine mortality was highly related to rainfall and snow (
Figure 4). Douglas-fir mortality was to a lesser extent further related to snow and rainfall, and white fir mortality was highly related to increases in temperatures. Aspen and Engelmann spruce did not show much correlation due to high pre-drought mortalities.
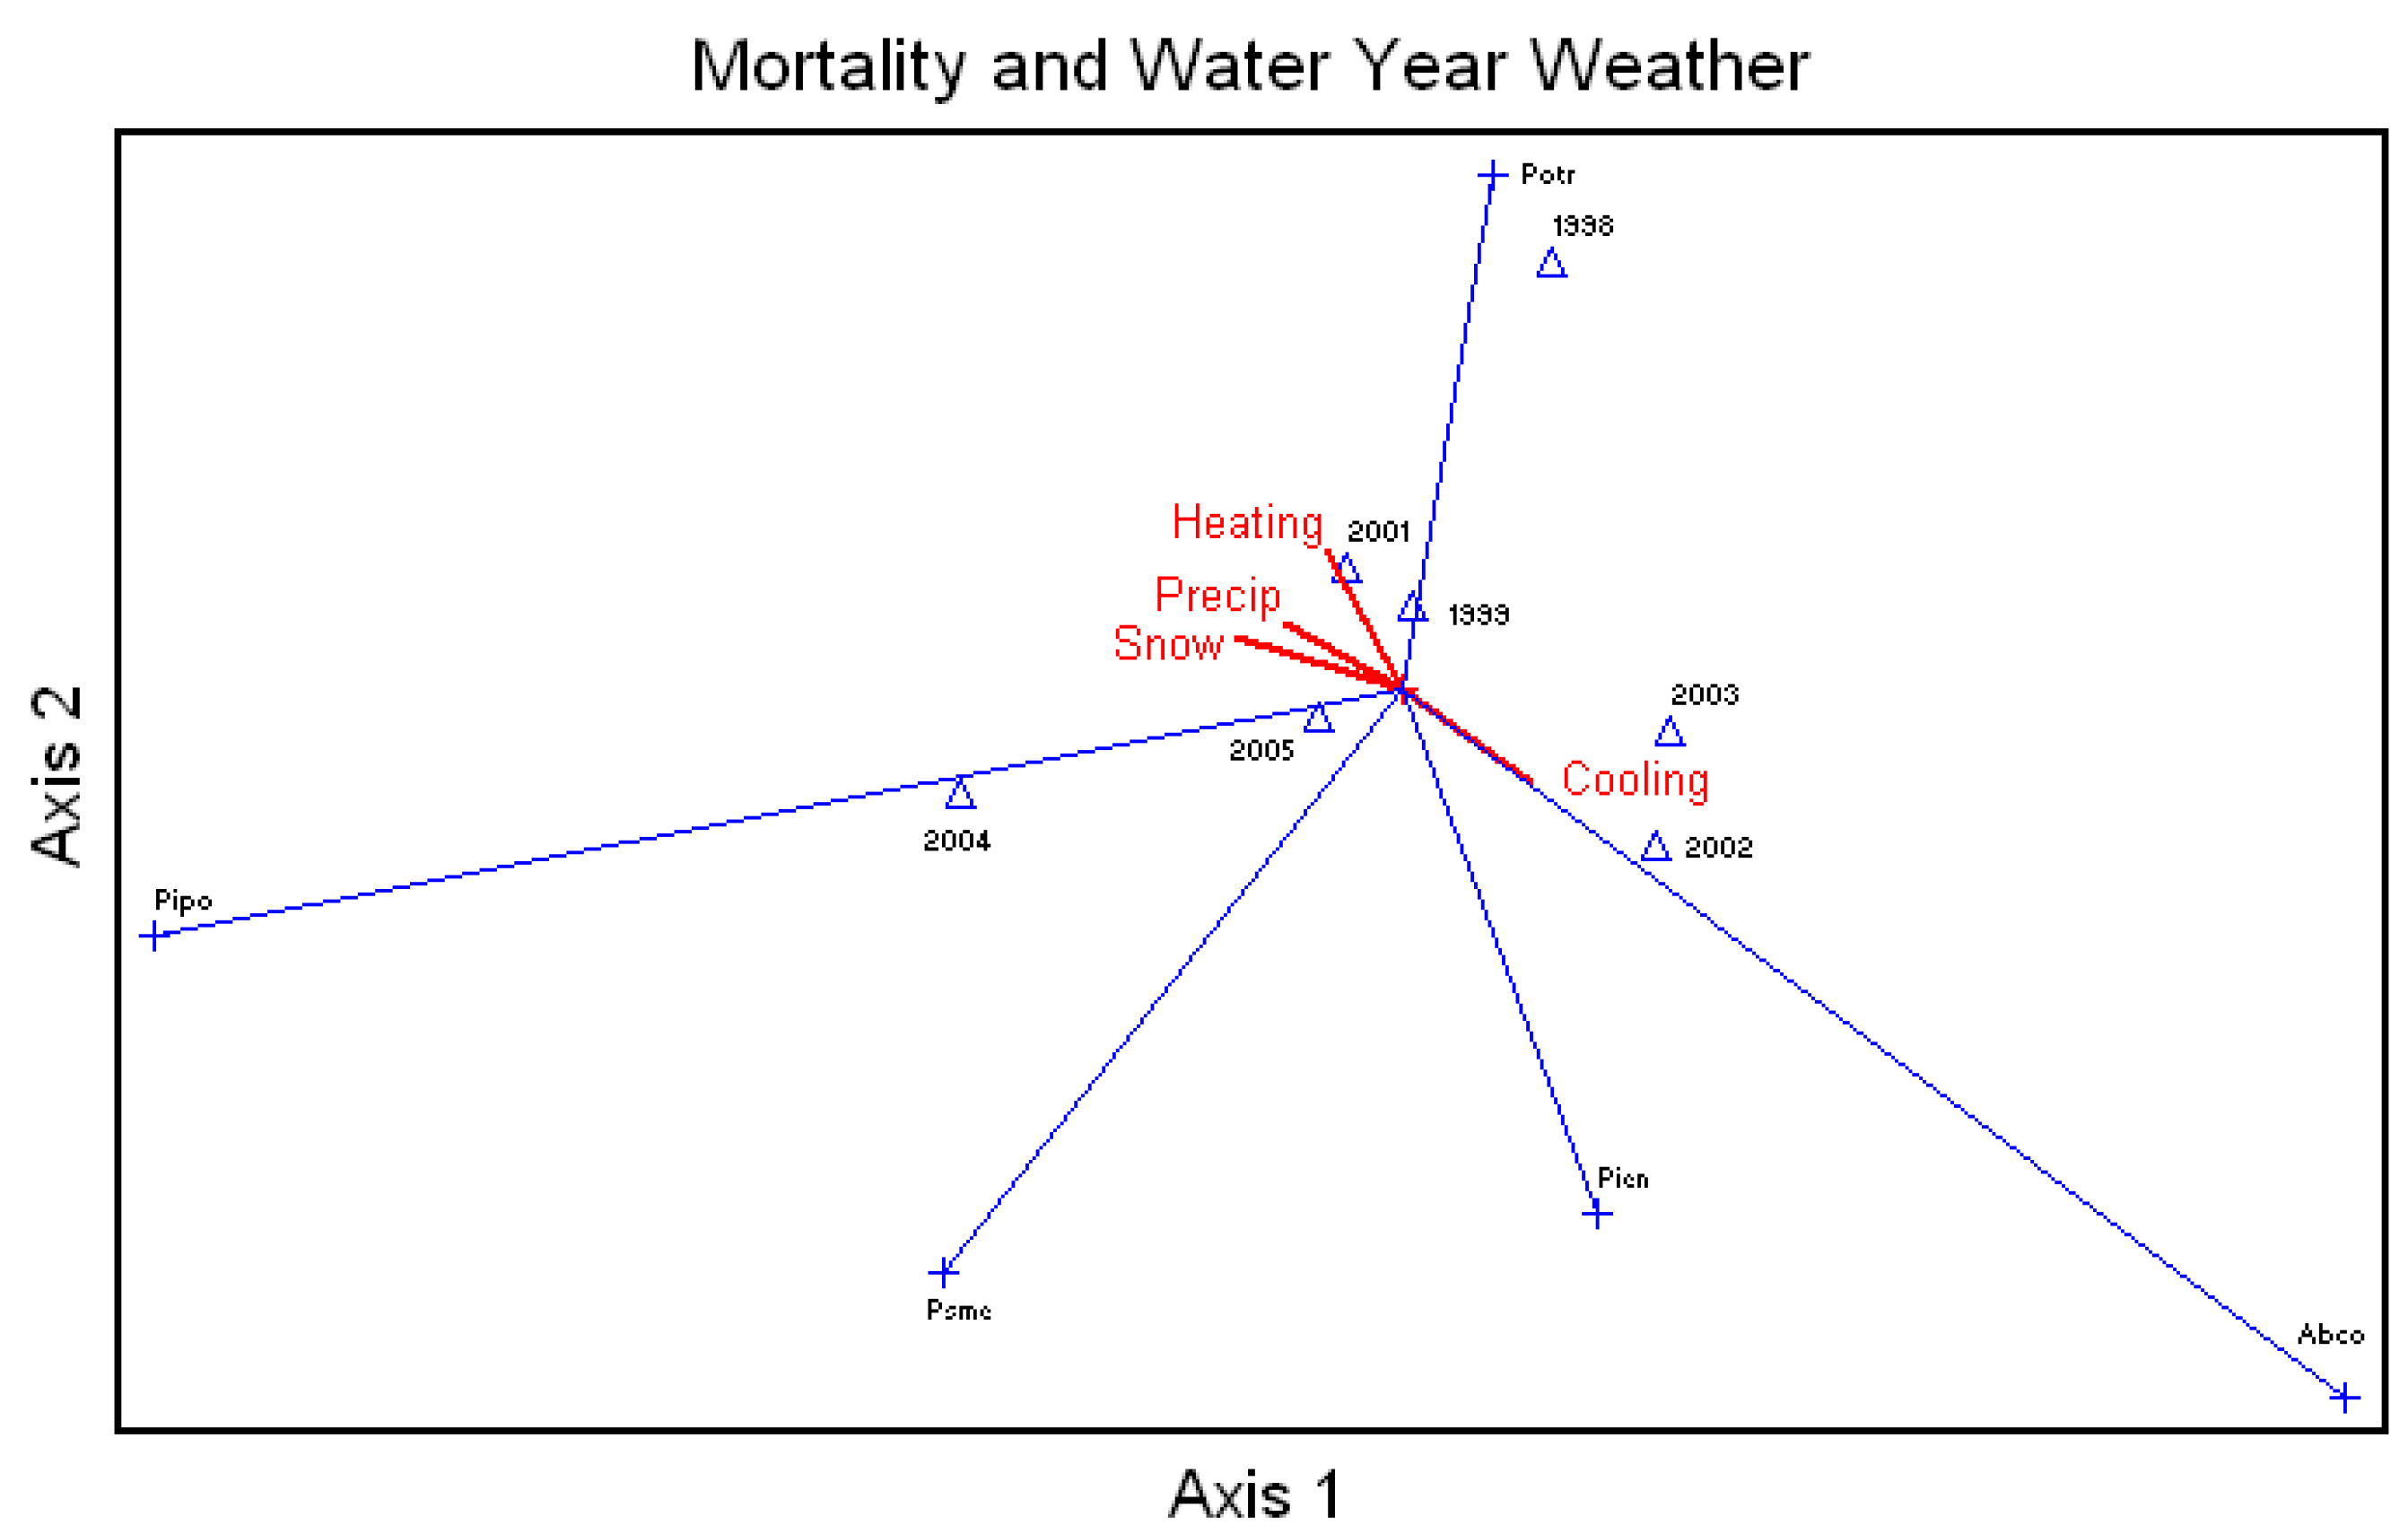
Average percent mortality of all species was correlated to the annual water year snow, rainfall, and number of heating and cooling degree-days (
Figure 5). Unthinned ponderosa pine mortality, and Douglas-fir to a lesser extent, were highly related to rainfall and snow. White fir mortality was highly related to increases in temperatures, and aspen showed a relationship with heating days. Engelmann spruce showed a positive relationship with cooling days.
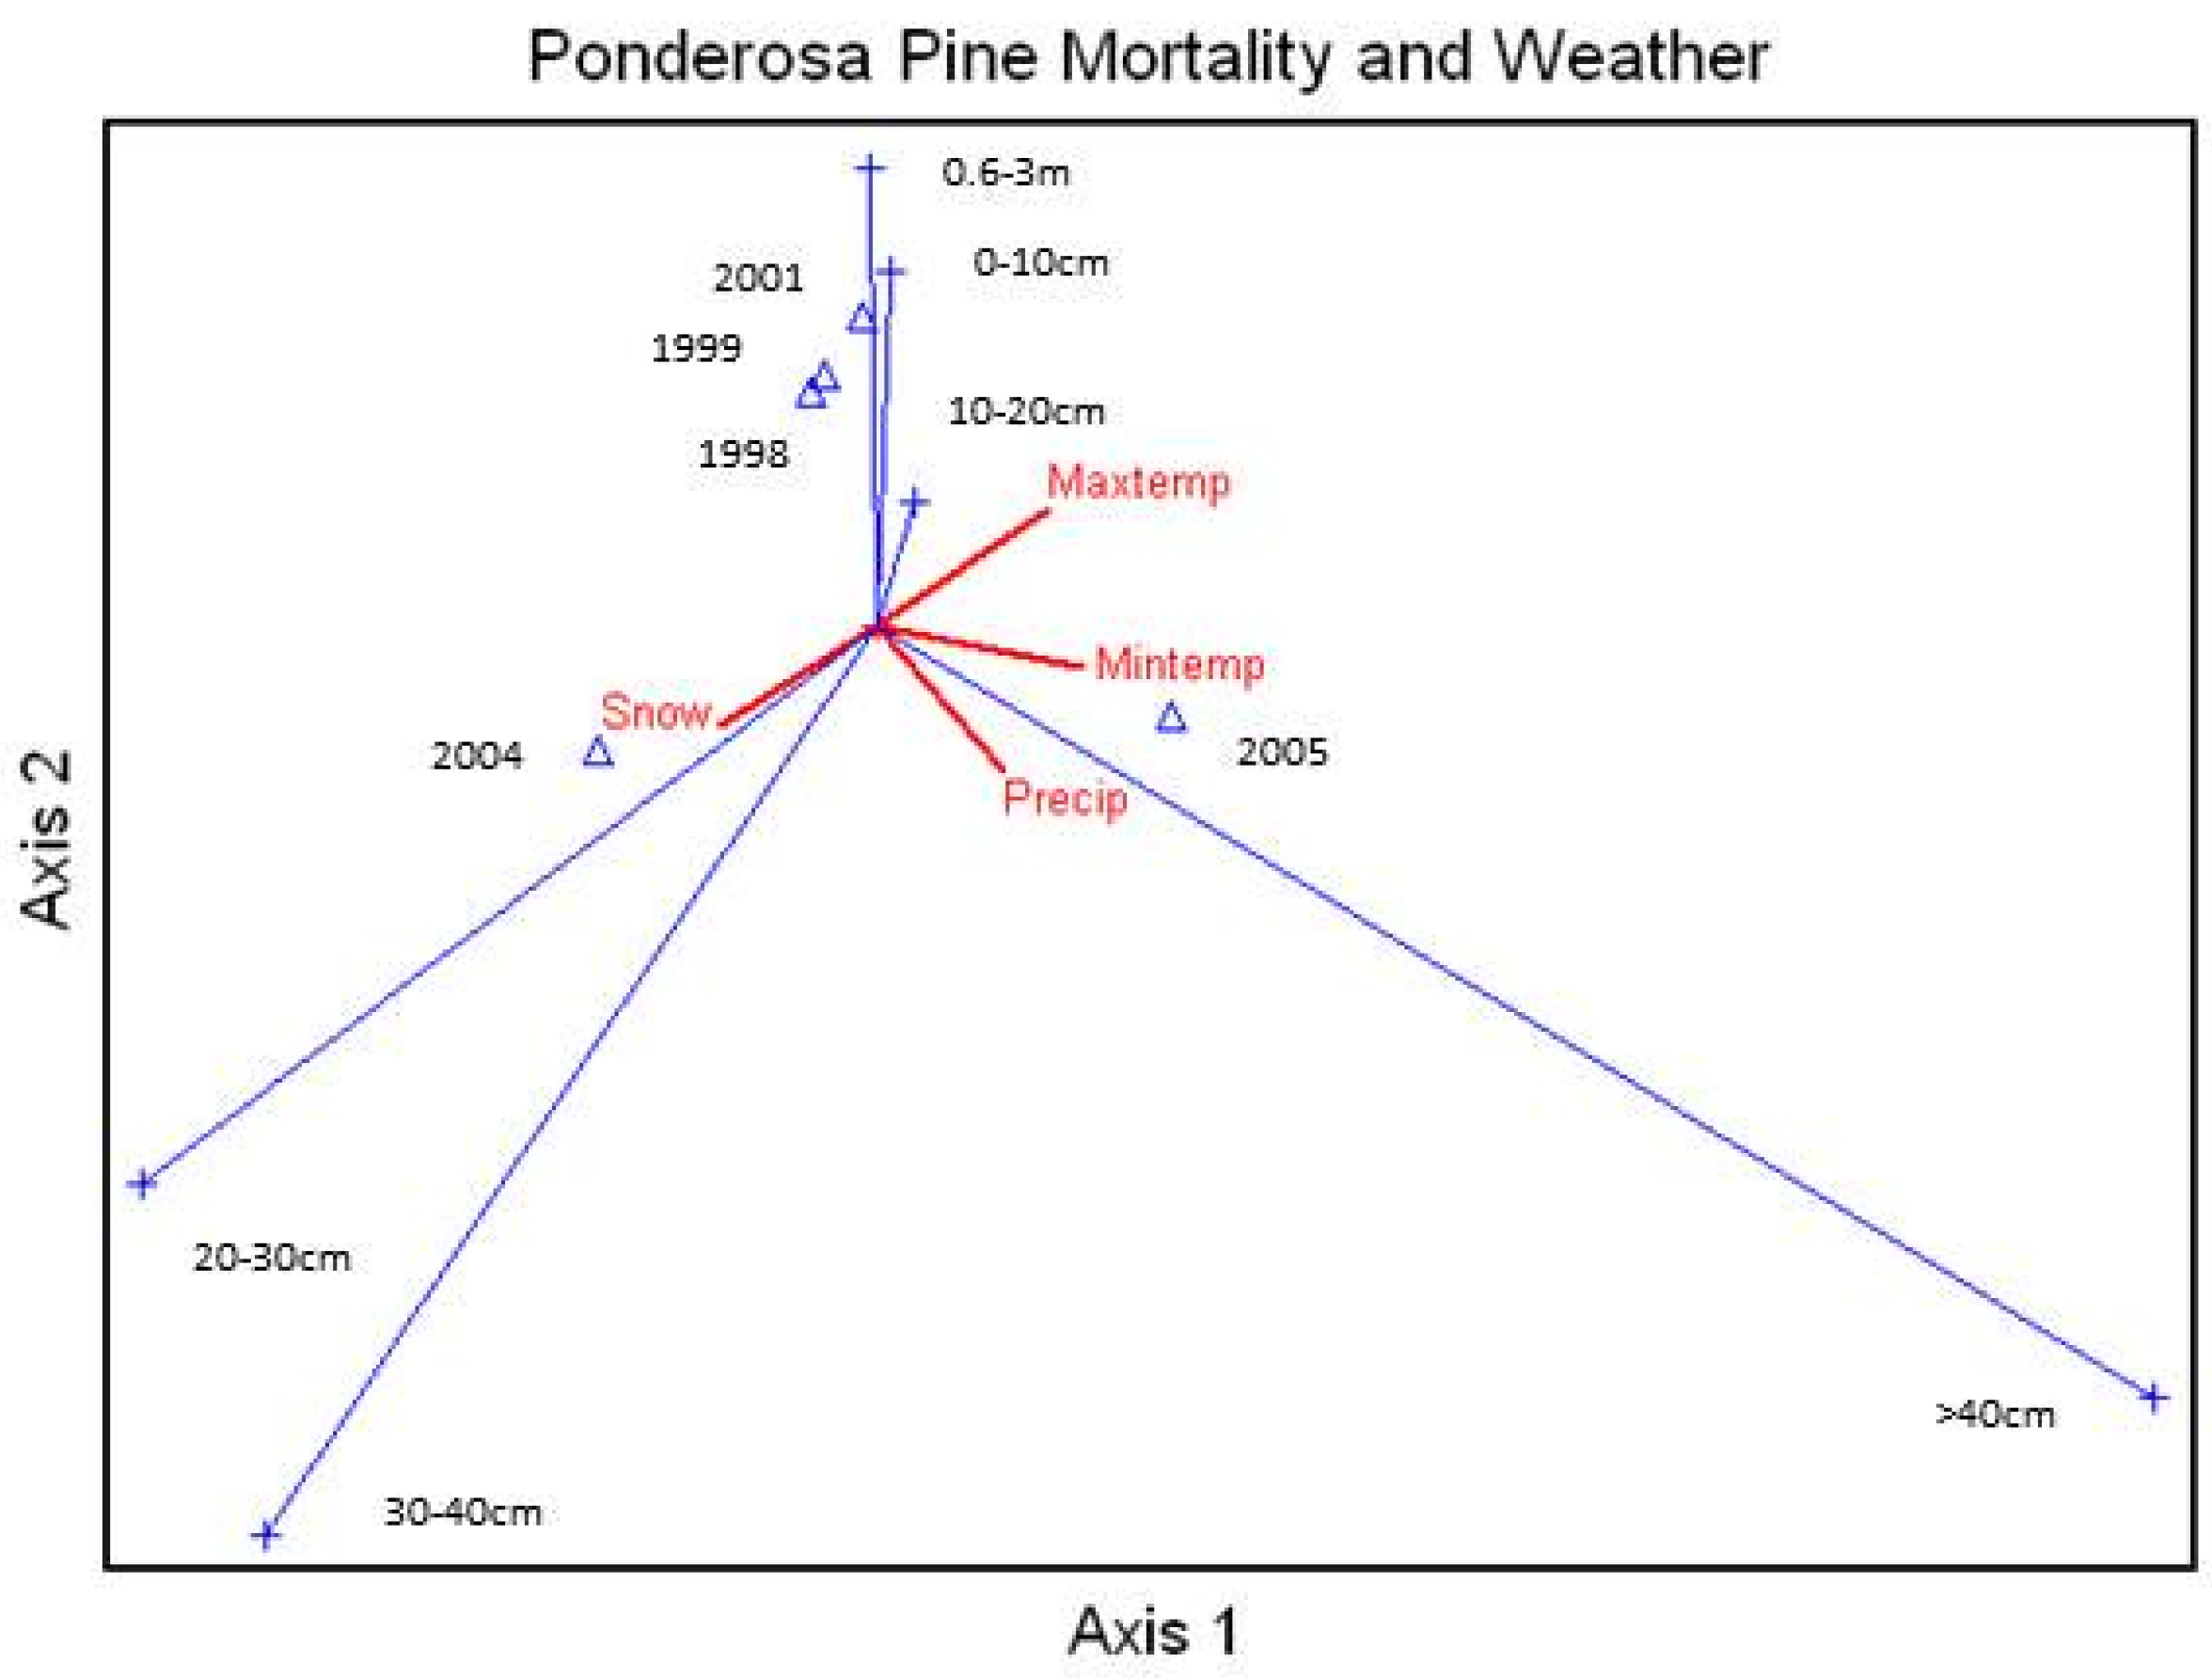
Average percent mortality of unthinned ponderosa pine size classes was correlated to the annual (calendar year) snow, rainfall, and average daily maximum and minimum temperatures (
Figure 6), and the mortality in the larger size classes was highly related to rainfall and snow. The three smallest size classes showed some relationship with maximum temperature.
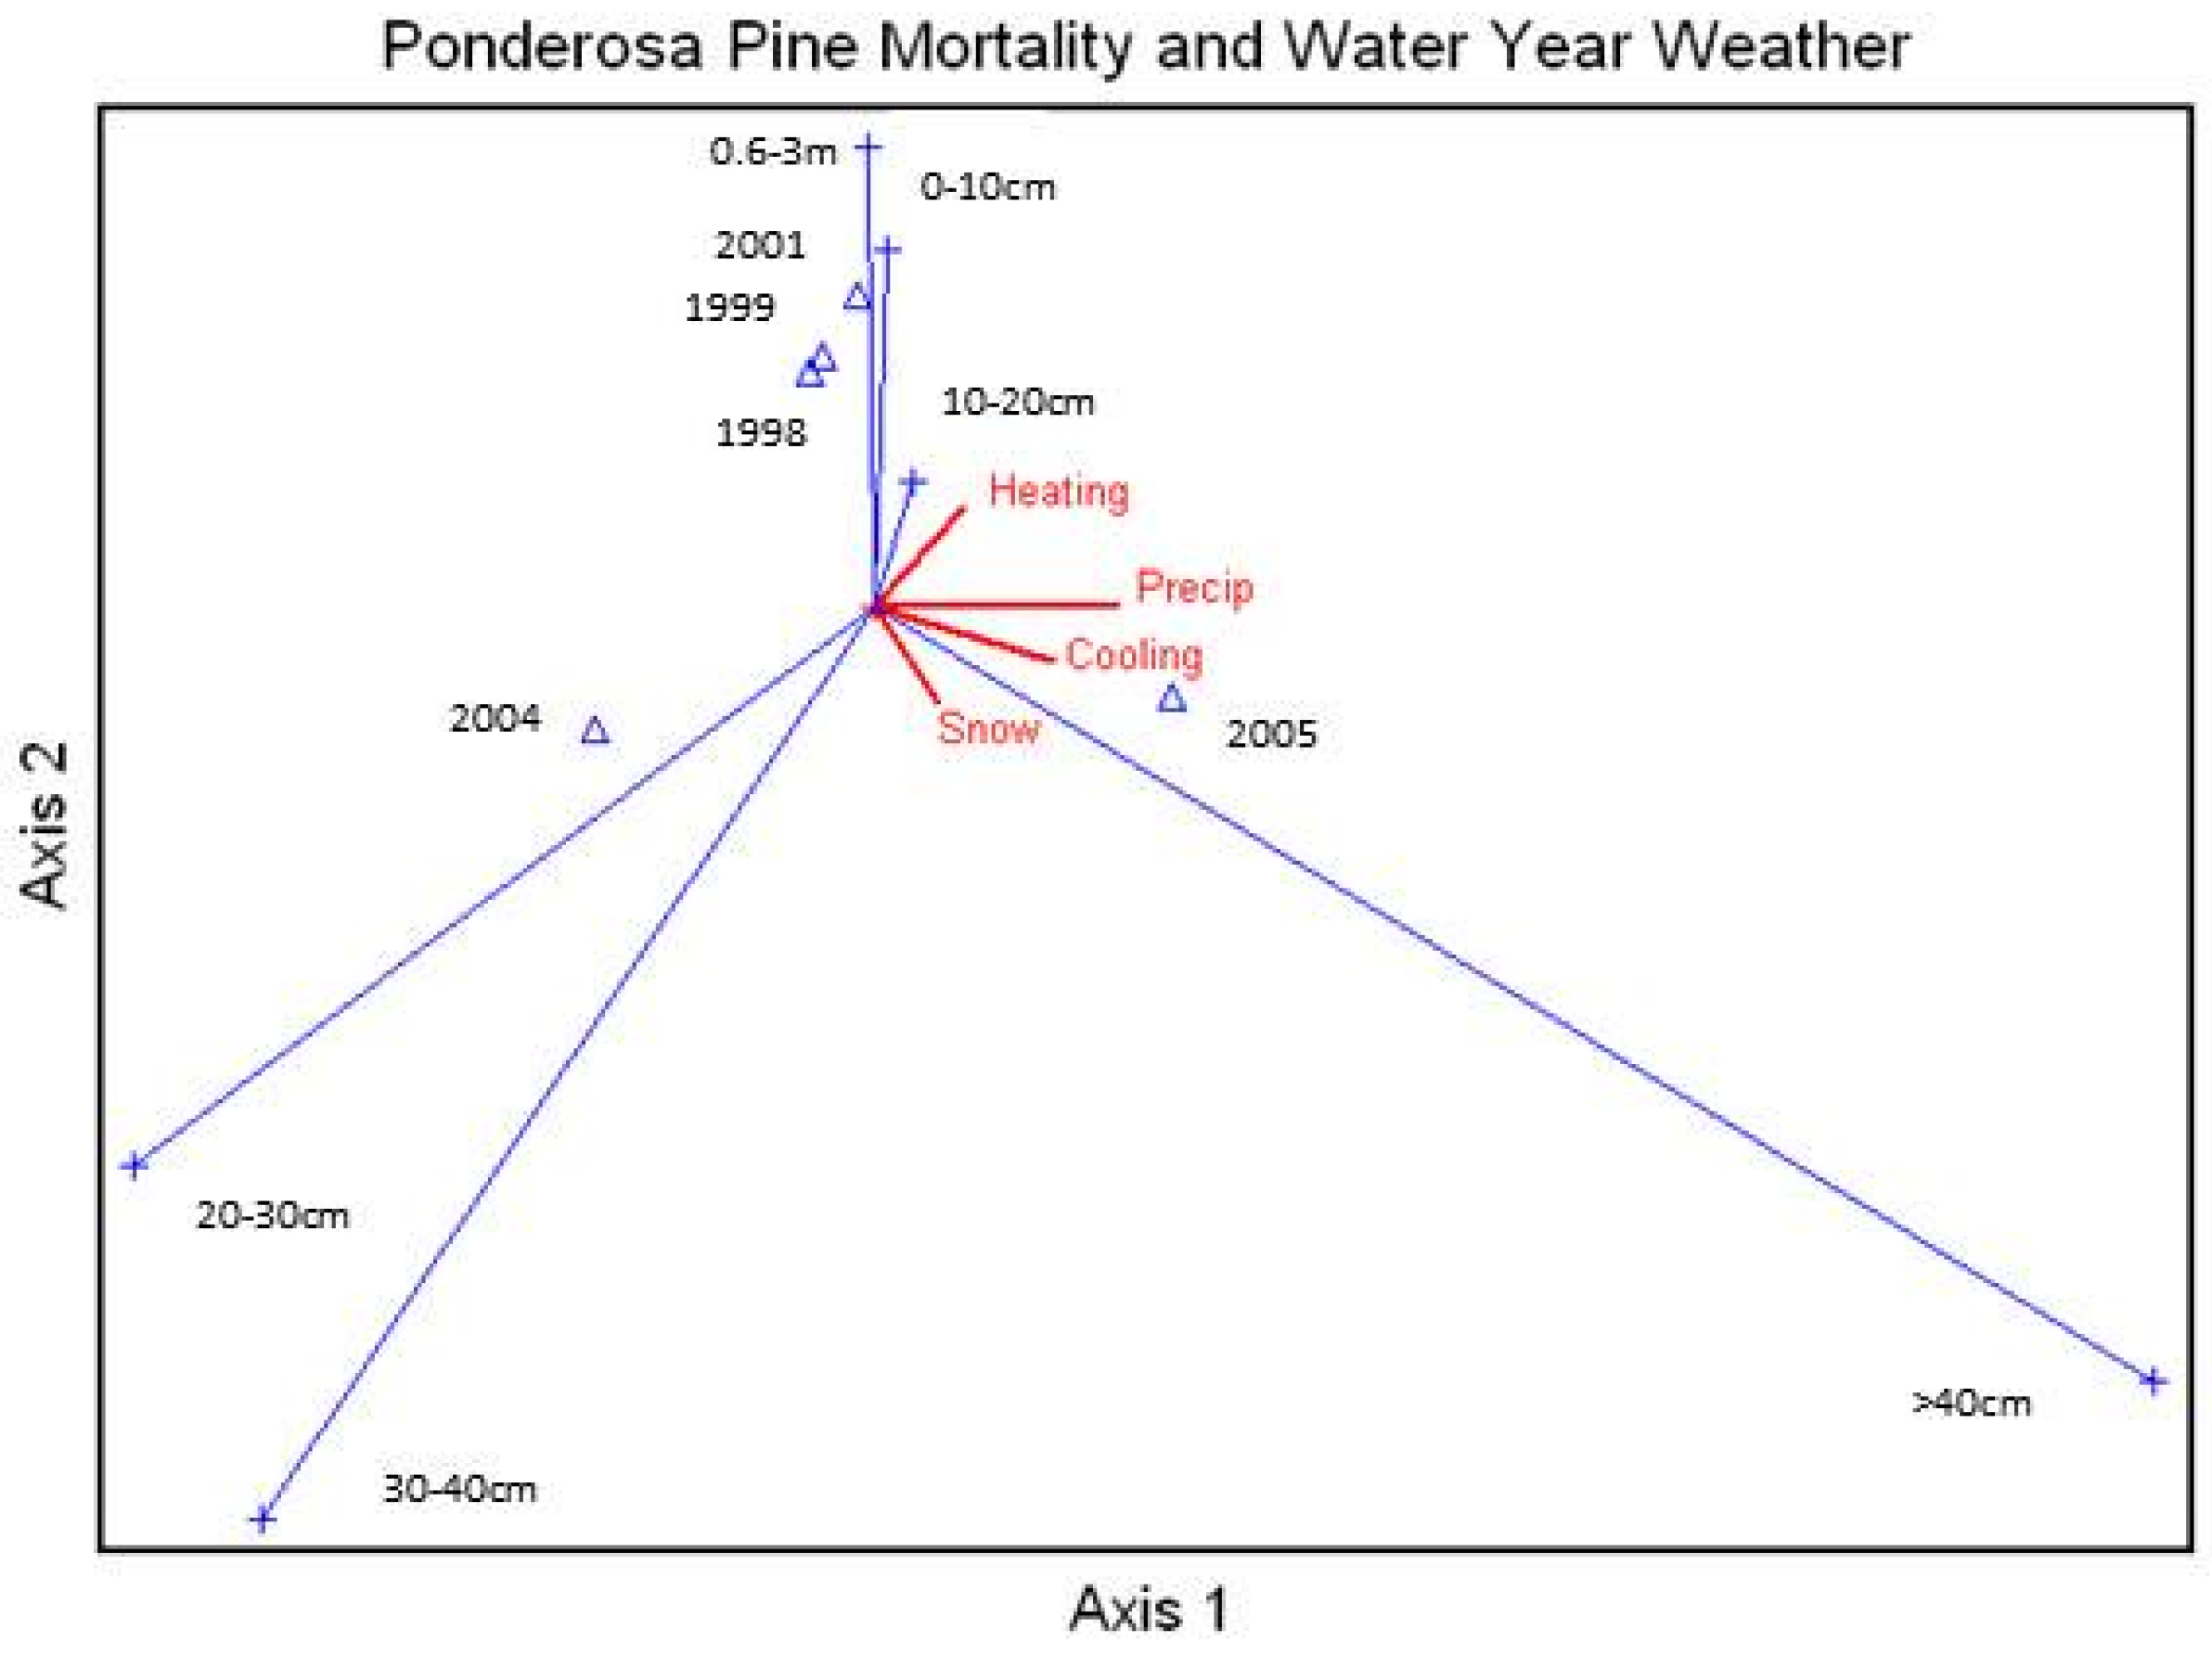
Average percent mortality of unthinned ponderosa pine size classes was correlated with the annual water year snow, rainfall, and number of heating and cooling degree-days (
Figure 7), with the largest size class heavily affected by snow, rainfall, and the number of cooling days. This ordination also showed a relationship between snowfall and the larger size classes.
4. Discussion
There were substantial differences in the pre-drought stands and the post-drought unthinned ponderosa pine stands. The average percent mortality was approximately ten percent higher in the post-drought stands, with larger ponderosa pine trees more significantly impacted by the drought. The drought had a significant impact on ponderosa pine mortality. The primary factors influencing the mortality were decreases in precipitation and increases in temperature. There were no significant differences in the pre-drought stands and the post-drought thinned ponderosa pine stands. This is very different from the unthinned ponderosa pine data, suggesting that the thinning process significantly reduced ponderosa pine mortality.
When analyzed by size class, irrespective of species, the data showed significant differences in the 20–30 and 30–40 cm DBH size classes, but not for ponderosa pine. The main difference between the two sets of data is that the spruce-fir data showed substantial mortality in the pre-drought years. There are several potential reasons for this occurrence. The stands in the spruce-fir sites were characteristically denser than the ponderosa pine sites and were therefore already experiencing more competition. The spruce-fir sites were at the stage of stand development where a second phase stem exclusion process was becoming more pronounced. The first stage occurred earlier in stand development, where overtopped or suppressed trees had died. Now, older trees were again experiencing competition stress. As a result, successional changes were still occurring in the spruce-fir stands whereas most of the ponderosa pine stands were older and showing fewer successional changes. There was substantial mortality recorded in both pre and post-drought years, possibly a product of ongoing successional processes. As a whole, this ecozone did react to the drought although in a more understated way when compared to ponderosa pine or piñon pine/juniper [
1].
When the spruce-fir data were broken down into the two major habitat types, the Pien/Erex habitat type showed some significant differences while the Abla/Vamy habitat type did not. The mortality increases in the 10–20, 20–30, and 30–40 cm size classes were significantly different in the Pien/Erex habitat type. The difference in mortality significance between the two habitat types is most likely due to their respective positions along the elevational gradient of the area. The Pien/Erex habitat type is usually situated in the lower areas of the Spruce-fir ecosystem and is therefore more susceptible to drought-induced influences while the Abla/Vamy habitat type is usually situated in the higher areas.
The only significant differences in mortality for the individual species were for 0–10 cm in Douglas-fir, 10–20 cm class in white fir, and 20–30 cm class in Engelmann spruce. There was substantial pre-drought mortality, especially in the smaller size classes. This is most likely due to the increased competition for resources in the stands and therefore increased stress on the trees. The most interesting feature of the aspen data set is the large amount of mortality in both pre and post-drought years. There was 85% average mortality in the pre-drought size class of 0–10 cm DBH and 48% average mortality in the pre-drought size class of 10–20 cm DBH. The reason for the high pre-drought mortality is most likely due to the fact that aspen is an early successional species, and it appeared to be suffering from competition from encroaching, slower growing later successional species. There were large percentages of dead trees that were killed by the drought (>20%) for all species except aspen. Aspen’s small percent of dead trees killed by the drought is most likely due to pre-drought mortality. Aspen did have the largest total percent drought mortality. This is most likely due to a smaller total number of aspen trees, aspen’s short lifespan, and also the encroachment of later successional species such as Engelmann spruce and white fir.
There was a strong correlation between ponderosa pine and Douglas-fir mortality and precipitation. Mortality increased with a decrease in precipitation, but there was a time lag between initial mortality (drought), recorded mortality (data collection), and the increase in precipitation post-drought. Mortality in the white fir followed average minimum and maximum temperatures with a large portion of the mortality recorded in 2003 and 2005, when the temperatures were highest. Both aspen and Englemann spruce’s mortality vectors followed decreases in average minimum temperature. This is due to both species having substantial mortality in the pre-drought measurements. Like aspen, much of the Engelmann spruce was at mid-succession. This resulted in relatively higher mortality in the smaller size classes of Engelmann spruce. Most of the mortality recorded in Engelmann spruce was recorded in the later years when temperatures had dropped after the drought.
Mortality in ponderosa pine and Douglas-fir were heavily influenced by precipitation and snow, with decreases in precipitation resulting in increases in mortality. White fir and Engelmann spruce mortality followed increases in cooling days. It would seem to be counterintuitive, but this is due to the hottest years having the most cooling degree days; more days with an average temperature above 65 °F.
It has been estimated that almost 90 percent of the total annual water yields in the Rocky Mountain Region, which includes Arizona and New Mexico, are derived from snowmelt [
19]. These results also show the relationship between tree health and the monsoonal season. In some cases in southwestern US and northwestern Mexico, over half the water used by vegetation may come from the monsoonal rains. This shows that nearly all size classes in ponderosa pine are heavily affected by water year snowfall. The largest size classes show evidence of lag time in response to water year snowfall.
5. Conclusions
The significant differences in drought-induced mortality by the different size classes within the different species were an important result of this study. As the region experiences a greater number and intensity of drought events, major changes in the regional forest structure in the future most likely will occur, with cascading impacts on wildlife, water, and the public. While tree dieback is a natural occurrence, human involvement in the management of forested areas has changed the interaction between the vegetation and its environment [
20]. In the American Southwest, issues such as timber management, fire exclusion, overstocked stands, livestock grazing, and climate change have all contributed to a movement away from historic conditions in these areas [
21]. Drought played a significant role in unthinned ponderosa pine mortality in northern New Mexico. This is no surprise as it has been estimated that snowpack in the Rockies can contain approximately 5,103,630 acre-feet (6.3 billion cubic meters) of water [
22]. While the pre and post-drought measurements were highly significant in the unthinned plots, the analysis of the thinned data showed no significance at all. This is an important implication because it shows that upon the onset of a drought, the overstory mortality can be reduced through mechanical thinning.
The drought increased all of the mortality percentages in spruce-fir with the exception of the two smallest size classes. The main difference between the ponderosa pine data and the spruce-fir data is that spruce-fir had substantial amounts of pre-drought mortality. The Pien/Erex habitat type had significant increases in mortality, suggesting that this habitat type is more susceptible to drought.
Precipitation was highly correlated with the mortality in the larger size classes of ponderosa pine as well as Douglas-fir. The species that characteristically occupy higher elevations such as white fir and Engelmann spruce were most heavily affected by temperature changes. Lag times between the stress event and actual death were evident in the ordination but the conclusions are clear. It may be possible to lessen the mortality in future dieback events through a systematic reduction of stressors such as overpopulation of trees through mechanical thinning or the use of prescribed fire.
Acknowledgments
We thank Scot Johnson, the Environmental Data and Analysis Group Leader, at Los Alamos National Laboratory for the meteorological data and the Division of Environmental Science in the Arthur Temple College of Forestry and Agriculture at Stephen F. Austin State University for financial support. We also thank anonymous reviewers for their recommendations to improve this manuscript.
Author Contributions
Oswald supervised the overall project and the development of this manuscript, Dugan performed most of the field work, data analysis and initial drafting of this manuscript. Balice supervised the field work in New Mexico, and provided expertise of the area and access to LANL facilities, and Unger provided technical expertise in the development of the manuscript.
Conflicts of Interest
The authors declare no conflicts of interest.
Appendix A.
Table A1.
Plant species that are common in land cover classes of the Jemez Mountains in northern New Mexico.
Table A1.
Plant species that are common in land cover classes of the Jemez Mountains in northern New Mexico.
| Code | Scientific Name | Common Name |
|---|
| ABCO | Abies concolor | White fir |
| ABLA | Abies lasiocarpa | Subalpine fir |
| ACGL | Acer glabrum | Mountain maple |
| ACMI | Achillea millefolium | Western yarrow |
| AGTR | Agropyron trachycaulum | Slender wheatgrass |
| ANPA | Antennaria parvifolia | Small-leaf pussytoes |
| ARFR | Artemisia franserioides | Ragweed sagebrush |
| ARLU | Artemisia ludoviciana | Louisiana wormwood |
| ARTR | Artemisia tridentata | Big sagebrush |
| ARUV | Arctostaphylos uva-ursi | Kinnikinnik |
| ATCA | Atriplex canescens | Four-wing saltbush |
| BADI | Bahia dissecta | Yellow ragweed |
| BOER | Bouteloua eriopoda | Black grama |
| BOGR | Bouteloua gracilis | Blue grama |
| BLTR | Blepharoneuron tricholepis | Pine dropseed |
| BRCA | Bromus carinatus | Mountain brome |
| BRCI | Bromus ciliatus | Fringed brome |
| CAGE | Carex geophila | White Mountain sedge |
| CAMI | Carex microptera | Small-wing sege |
| CAOC | Carex occidentalis | Western sedge |
| CAUT | Carex utriculata | Northwest Territory sedge |
| CEMO | Cercocarpus montanus | Mountain mahogany |
| CHNA | Chrysothamnus nauseosus | Chamisa |
| CHVI | Chrysopsis villosa | Hairy golden aster |
| CLPS | Clematis pseudoalpina | Rocky Mountain clematis |
| DAPA | Danthonia parryi | Parry’s danthonia |
| DECA | Deschampsia caespitosa | Tufted hairgrass |
| EREX | Erigeron eximius | Forest fleabane |
| ERFO | Erigeron formosissimus | Beautiful fleabane |
| FAPA | Fallugia paradoxa | Apache plume |
| FEAR | Festuca arizonica | Arizona fescue |
| FEID | Festuca idahoensis | Idaho fescue |
| FEOV | Festuca ovina | Sheep fescue |
| FETH | Festuca thurberi | Thurber fescue |
| FRVE | Fragaria vesca | Woodland strawberry |
| FRVI | Fragaria virginiana | Mountain strawberry |
| GECA | Geranium caespitosum | Rose crane’s bill |
| HOVU | Hordeum vulgare | Barley |
| JUBA | Juncus balticus | Baltic rush |
| JUMO | Juniperus monosperma | One-seed juniper |
| KONI | Koeleria nitida | Junegrass |
| LAAR | Lathyrus arizonicus | Arizona lathyrus |
| LOMU | Lolium multiflorum | Italian ryegrass |
| LUCA | Lupinus caudatus | Spurred lupine |
| MUMO | Muhlenbergia montana | Mountain muhly |
| MUWR | Muhlenbergia wrightii | Spike muhly |
| OPER | Opuntia erinacea | Grizzly-bear prickly-pear cactus |
| PAMY | Pachystima myrsinites | Mountain lover |
| PIEN | Picea engelmannii | Engelmann spruce |
| PIED | Pinus edulis | Piñon |
| PIFL | Pinus flexilis | Limber pine |
| PIPO | Pinus ponderosa | Ponderosa pine |
| POFE | Poa fendleriana | Mutton grass |
| POFR | Potentilla fruticosa | Shrubby cinquefoil |
| POHI | Potentilla hippiana | Woolly cinquefoil |
| POPA | Poa palustris | Fowl bluegrass |
| POPR | Poa pratensis | Kentucky bluegrass |
| POTR | Populus tremuloides | Quaking aspen |
| PSME | Pseudotsuga menziesii | Douglas fir |
| PSMO | Pseudocymopterus montanus | Yellow mountain parsley |
| PTAQ | Pteridium aquilinum | Bracken fern |
| QUGA | Quercus gambelii | Gambel oak |
| QUUN | Quercus undulata | Wavy leaf oak |
| RHTR | Rhus trilobata | Skunkbush sumac |
| RICE | Ribes cereum | Wax currant |
| RONE | Robinia neomexicana | New Mexico locust |
| SAEX | Salix exigua | Coyote willow |
| SCSC | Schizachyrium scoparium | Little bluestem |
| SMST | Smilacina stellata | Star Solomon’s plume |
| STCO | Stipa comata | Needle and thread |
| THFE | Thalictrum fendleri | Fendler meadowrue |
| THTR | Thelesperma trifidum | Green thread |
| VAMY | Vaccinium myrtillus | Myrtle-leaf blueberry |
| VIAM | Vicia americana | American vetch |
References
- Breshears, D.D.; Cobb, N.S.; Rich, P.M.; Price, K.P.; Allen, C.D.; Balice, R.G.; Romme, W.H.; Kastens, J.H.; Floyd, L.M.; Belnap, J.; et al. Regional vegetation die-off in response to global-change-type drought. Proc. Natl. Acad. Sci. USA 2005, 102, 15144–15148. [Google Scholar] [CrossRef] [PubMed]
- Shaw, J.D.; Steed, B.E.; DeBlander, L.T. Forest Inventory and Analysis (FIA) Annual Inventory Answers the Question: What is happening to Pinyon-Juniper Woodlands. J. For. 2005, 103, 280–286. [Google Scholar]
- Meddens, A.J.H.; Hicke, J.A.; Macalady, A.K.; Buotte, P.C.; Cowles, T.R.; Allen, C.D. Patterns and causes of observed pinon pine mortality in the southwestern United States. New Phytol. 2015, 206, 91–97. [Google Scholar] [CrossRef] [PubMed]
- Allen, C.D.; Breshears, D.D. Drought-induced shift of a forest-woodland ecotone: Rapid landscape response to climate variation. Proc. Natl. Acad. Sci. USA 1998, 95, 14839–14842. [Google Scholar] [CrossRef] [PubMed]
- Kane, J.M.; Kolb, T.E.; McMillin, J.D. Stand-scale tree mortality factors differ by site and species following drought in southwestern mixed conifer forests. For. Ecol. Manage. 2014, 330, 171–182. [Google Scholar] [CrossRef]
- Ganey, J.L.; Vojta, S.C. Tree mortality in drought-stressed mixed conifer and ponderosa pine forests, Arizona, USA. For. Ecol. Manag. 2005, 261, 162–168. [Google Scholar] [CrossRef]
- Franklin, J.F.; Shugart, H.H.; Harmon, M.E. Tree Death as an Ecological Process. BioScience 1987, 37, 550–556. [Google Scholar] [CrossRef]
- Redmond, D.R. Studies in forest pathology XV. Rootless, mycorrhiza, and soil temperatures in relation to birch dieback. Can. J. Bot. 1955, 33, 595–627. [Google Scholar]
- Puhlick, J.L.; Laughlin, D.C.; Moore, M.M. Factors influencing ponderosa pine regeneration in the southwestern USA. For. Ecol. Manag. 2012, 264, 10–19. [Google Scholar] [CrossRef]
- Ogle, K.; Whitham, T.G.; Cobb, N.S. Tree-Ring Variation in Pinyon Predicts Likelihood of Death Following Severe Drought. Ecology 2000, 81, 3237–3243. [Google Scholar] [CrossRef]
- Mueller, R.C.; Scudder, C.M.; Porter, M.E.; Trotter, R.T., III; Gehring, C.A.; Whitham, T.G. Differential tree mortality in response to sever drought: Evidence for long-term vegetation shifts. J. Ecol. 2005, 93, 1085–1093. [Google Scholar] [CrossRef]
- Balice, R.G.; Miller, J.D.; Oswald, B.P.; Edminster, C.; Yool, S.R. Forest Surveys and Wildfire Assessment in the Los Alamos Region; 1998–1999; LA-13714-MS; Los Alamos National Laboratory: Los Alamos, NM, USA, 2000. [Google Scholar]
- Balice, R.G. Fire Hazard Assessment Field Methods; LA-UR 10-07994; Los Alamos National Laboratory: Los Alamos, NM, USA, 2005. [Google Scholar]
- Balice, R.G.; Ferran, S.G.; Foxx, T.S. Preliminary Vegetation and Land Cover Classification for the Los Alamos Region; LA-UR-97-4627; Los Alamos National Laboratory: Los Alamos, NM, USA, 1997. [Google Scholar]
- McKown, B.; Koch, S.W.; Balice, R.G.; Neville, P. Land Cover Classification Map for the Eastern Jemez Region; LA-14029; Los Alamos National Laboratory: Los Alamos, NM, USA, 2003. [Google Scholar]
- Balice, R.G. A Preliminary Survey of Terrestrial Plant Communities in the Sierra de Los Valles; LA-13523-MS; Los Alamos National Laboratory: Los Alamos, NM, USA, 1998. [Google Scholar]
- Balice, R.G.; Bennett, K.D.; Wright, M.A. Burn Severities, Fire Intensities and Impacts to Major Vegetation Types from the Cerro Grande Fire; LA-14159; Los Alamos National Laboratory: Los Alamos, NM, USA, 2004. [Google Scholar]
- McCune, B.; Mefford, M.J. PC-ORD, Multivariate Analysis of Ecological Data, version 5; MjM Software: Gleneden Beach, OR, USA, 2006. [Google Scholar]
- Troendle, C.A. The Potential for Water Yield Augmentation from Forest Management in the Rocky Mountain Region. J. Am. Water Res. Assoc. 1983, 19, 359–373. [Google Scholar] [CrossRef]
- Mueller-Dombois, D. Canopy Dieback and Successional Processes in Pacific Forests. Pac. Sci. 1983, 37, 317–325. [Google Scholar]
- Ernst, R.; Pieper, R.D. Changes in Piñon-Juniper Vegetation: A Brief History. Rangelands 1996, 18, 14–16. [Google Scholar]
- Ffolliott, P.F.; Gottfried, G.J.; Baker, M.B., Jr. Water yield from forest snowpack management: Research findings in Arizona and New Mexico. Water Resour. Res. 1989, 25, 1999–2007. [Google Scholar] [CrossRef]
Figure 1.
The eastern Jemez Mountains, including the region of interest in this study. The abbreviated species in the legend are included within the list of species in
Appendix A (
Table A1). Source: [
10].
Figure 1.
The eastern Jemez Mountains, including the region of interest in this study. The abbreviated species in the legend are included within the list of species in
Appendix A (
Table A1). Source: [
10].
Figure 2.
Representative macroplot layout and subplot numbering scheme. The macroplot scale is 60 m by 60 m. The subplots are numbered sequentially in clockwise direction beginning with the upslope-left subplot. The quads are numbered sequentially in a clockwise direction. The layout of subplots 1, 2 and 3 are similar.
Figure 3.
General layout of line transects and strip plots for a representative subplot.
Figure 3.
General layout of line transects and strip plots for a representative subplot.
Figure 4.
Canonical Correspondence Analysis Ordination on average percent mortality of all species measured in the study area by year and correlated to the calendar year snow (Snow) and rainfall (Precip) and average daily maximum (Maxtemp) and minimum (Mintemp) temperatures. Xxxx = year, Abco = Abies concolor, Pipo = Pinus ponderosa, Potr = Populus tremuloides, Psme = Pseudotsuga menziesii, Pien = Picea engelmannii.
Figure 5.
Canonical Correspondence Analysis Ordination for average percent mortality of all the species by year and correlated to the water year snow (Snow) and rainfall (Precip) and the number of heating (Heating) and cooling (Cooling) degree days., Abco = Abies concolor, Pipo = Pinus ponderosa, Potr = Populus tremuloides, Psme = Pseudotsuga menziesii, Pien = Picea engelmannii.
Figure 6.
Canonical Correspondence Analysis Ordination for average percent mortality of the different ponderosa pine size classes by year and correlated with the calendar year snow and rainfall and average daily maximum and minimum temperatures. Snow = Snow accumulation, Cooling = lower temperatures, Heating = warmer temperatures, Precip = precipitation amounts. xx-xxm = height class, xx-xxcm = diameter class.
Figure 7.
Canonical Correspondence Analysis Ordination for average percent mortality of all ponderosa pine size classes measured in the study area by year and correlated with the water year snow and rainfall and the number of heating and cooling degree days. Snow = Snow accumulation, Cooling = lower temperatures, Heating = warmer temperatures, Precip = precipitation amounts. xx-xxm = height class, xx-xxcm = diameter class.
Table 1.
Results for two-sample one-tailed t test run on unthinned ponderosa pine, thinned ponderosa pine, and Spruce-fir.
Table 1.
Results for two-sample one-tailed t test run on unthinned ponderosa pine, thinned ponderosa pine, and Spruce-fir.
| Ht./DBH Class | 0.6–3 m | 0–10 cm | 10–20 cm | 20–30 cm | 30–40 cm | >40 cm |
|---|
| Pre | Post | Pre | Post | Pre | Post | Pre | Post | Pre | Post | Pre | Post |
|---|
| Unthinned Ponderosa |
| Mean% Mortality | 10.4 | 18.2 | 10.0 | 19.0 | 5.6 | 17.1 | 1.2 | 11.4 | 0.2 | 11.7 | 2.3 | 13.5 |
| t-stat | −1.606 | −2.179 | −3.246 | −3.855 | −4.166 | −2.012 |
| t-stat 0.05 | 1.706 | 1.706 | 1.699 | 1.699 | 1.699 | 1.701 |
| p value | 0.10 > p > 0.05 | 0.0025 > p > 0.01 | p < 0.0005 | p < 0.0005 | p < 0.0005 | 0.05 > p > 0.025 |
| Thinned Ponderosa |
| Mean% Mortality | 0.0 | 0.0 | 0.0 | 4.8 | 0.0 | 16.6 | 0.0 | 3.8 | 0.0 | 1.7 | 0.0 | 8.2 |
| t-stat | 0.0 | −0.509 | −0.836 | −0.589 | −0.564 | −1.046 |
| t-stat 0.05 | 1.895 | 1.895 | 1.796 | 1.771 | 1.761 | 1.761 |
| p value | p < 0.25 | p < 0.25 | p < 0.25 | p < 0.25 | p < 0.25 | 0.10 > p > 0.05 |
| Spruce-fir |
| Mean% Mortality | 16.5 | 11.2 | 32.5 | 25.2 | 17.0 | 26.6 | 4.9 | 12.9 | 0.2 | 7.7 | 6.9 | 18.9 |
| t-stat | 0.046 | 0.766 | 01.47 | 1.673 | −1.885 | −2.053 | −1.34 |
| t-stat 0.05 | 1.685 | 1.673 | | 1.674 | 1.677 | 1.696 |
| p value | p < 0.25 | 0.25 > p > 0.1 | 0.1 > p > 0.05 | 0.05 > p > 0.025 | 0.25 > p > 0.1 | 0.10 > p > 0.05 |
Table 2.
Results for Wilcoxon paired-sample one-tailed T test run on ponderosa pine.
Table 2.
Results for Wilcoxon paired-sample one-tailed T test run on ponderosa pine.
| DBH Class | 0–10 cm | 10–20 cm | 20–30 cm | 30–40 cm |
|---|
| T+ | 3 | 1 | 3 | 3 |
| t-stat 0.05 | T0.05(1),8 = 5 | T0.05(1),8 = 5 | T0.05(1),8 = 5 | T0.05(1),8 = 5 |
| p value | p = 0.025 | p = 0.01 | p = 0.025 | p = 0.025 |
Table 3.
Results for two-sample one-tailed T test run on habitat type in the Spruce-fir zone.
Table 3.
Results for two-sample one-tailed T test run on habitat type in the Spruce-fir zone.
| Ht./DBH Class | 0.6–3 m | 0–10 cm | 10–20 cm | 20–30 cm | 30–40 cm | >40 cm |
|---|
| Pre | Post | Pre | Post | Pre | Post | Pre | Post | Pre | Post | Pre | Post |
|---|
| Abla/Vamy(16) |
| Mean% Mortality | 9.5 | 5.0 | 33.9 | 9.3 | 15.8 | 13.1 | 0.9 | 1.7 | 0.0 | 0.0 | 0.0 | 11.1 |
| t-stat | 0.470 | 0.216 | 0.380 | 0.984 | 0.0 | −0.500 |
| t-stat 0.05 | 1.943 | 1.782 | 1.782 | 1.771 | 0.860 | 2.920 |
| p value | p > 0.25 | p > 0.25 | p < 0.25 | p < 0.25 | p < 0.25 | p > 0.25 |
| Pien/Erex (48) |
| Mean% Mortality | 17.7 | 13.2 | 32.1 | 23.6 | 17.3 | 31.5 | 5.7 | 12.4 | 0.3 | 9.4 | 7.3 | 9.4 |
| t-stat | 0.535 | 0.771 | −1.749 | −1.722 | −2.025 | −1.296 |
| t-stat 0.05 | 1.696 | 1.683 | 1.681 | 1.684 | 1.685 | 1.688 |
| p value | p < 0.25 | 0.25 > p > 0.10 | 0.05 > p > 0.025 | 0.05 > p> 0.025 | 0.05 > p > 0.01 | p > 0.25 |
Table 4.
Results for two-sample one-tailed T test run on individual species in the Spruce-fir zone.
Table 4.
Results for two-sample one-tailed T test run on individual species in the Spruce-fir zone.
| Ht./DBH Class | 0.6–3 m | 0–10 cm | 10–20 cm | 20–30 cm | 30–40 cm | >40 cm |
|---|
| Pre | Post | Pre | Post | Pre | Post | Pre | Post | Pre | Post | Pre | Post |
|---|
| Engelmann Spruce |
| Mean% Mortality | 20.1 | 22.9 | 14.4 | 12.4 | 5.0 | 11.7 | 1.0 | 10.2 | 0.0 | 7.1 | 0.0 | 0.0 |
| t-stat | −0.251 | 0.406 | −1.394 | −2.158 | −1.075 | 0.0 |
| t-stat 0.05 | 1.796 | 1.761 | 1.761 | 1.761 | 1.771 | 1.771 |
| p value | p > 0.25 | p > 0.25 | 0.10 > p > 0.05 | 0.025 > p > 0.01 | 0.25 > p > 0.10 | p > 0.025 |
| Douglas-fir |
| Mean% Mortality | 7.8 | 5.0 | 5.4 | 27.3 | 3.9 | 16.3 | 5.6 | 23.2 | 0.0 | 0.0 | 19.4 | 36.1 |
| t-stat | 0.3 | −2.151 | −1.463 | −1.307 | 0.0 | −0.634 |
| t-stat 0.05 | 1.86 | 1.796 | 1.782 | 1.771 | 1.796 | 1.860 |
| p value | p < 0.25 | 0.05 > p > 0.025 | 0.10 > p > 0.05 | 0.25 > p > 0.15 | p < 0.25 | p > 0.25 |
| White fir |
| Mean% Mortality | 0.0 | 14.7 | 19.4 | 5.3 | 2.0 | 28.6 | NA | NA | NA |
| t-stat | −1.430 | 0.767 | −2.332 |
| t-stat 0.05 | 1.895 | 1.833 | 1.895 |
| p value | 0.10 > p > 0.05 | 0.25 > p > 0.10 | 0.025 > p > 0.01 |
| Aspen |
| Mean % Mortality | NA | 85.2 | 69.2 | 48.3 | 55.6 | 10.5 | 12.7 | NA | NA |
| t-stat | 1.045 | −0.660 | −0.303 |
| t-stat 0.05 | 1.782 | 1.761 | 1.761 |
| p value | 0.25 > p > 0.10 | p < 0.25 | p < 0.25 |
Table 5.
Direct measurement of drought-induced mortality for all Spruce-fir species in 2005.
Table 5.
Direct measurement of drought-induced mortality for all Spruce-fir species in 2005.
| Species | % of Mortality Induced by Drought | Total% Mortality |
|---|
| Corkbark fir | 75.0 | 2.3 |
| White fir | 25.0 | 1.7 |
| Engelmann spruce | 39.1 | 4.2 |
| Aspen | 8.5 | 5.4 |
| Douglas-fir | 21.7 | 3.0 |
© 2016 by the authors; licensee MDPI, Basel, Switzerland. This article is an open access article distributed under the terms and conditions of the Creative Commons Attribution (CC-BY) license (http://creativecommons.org/licenses/by/4.0/).


