Article

Loblolly Pine Productivity and Water Relations in Response to Throughfall Reduction and Fertilizer Application on a Poorly Drained Site in Northern Florida

1
School of Forest Resources and Conservation, University of Florida, Gainesville, FL 32611, USA
2
Department of Forest Engineering, Resources, and Management, Oregon State University, Corvallis, OR 97331, USA
3
Environmental Sciences Division, Oak Ridge National Laboratory, Oak Ridge, TN 37831, USA
4
Department of Forestry and Environmental Resources, North Carolina State University, Raleigh, NC 27606, USA
*
Author to whom correspondence should be addressed.
Forests 2016, 7(10), 214; https://doi.org/10.3390/f7100214
Submission received: 21 July 2016 / Revised: 2 September 2016 / Accepted: 15 September 2016 / Published: 26 September 2016

Abstract

:
Loblolly pine (Pinus taeda L.) forests are of great ecological and economic value in the southeastern United States, where nutrient availability frequently limits productivity. The impact of fertilizer application on the growth and water relations of loblolly pine has been investigated by numerous studies; however, few field experiments have examined the effects of drought. Drought is of particular interest due to the potential for climate change to alter soil water availability. In this study, we investigated the impact of fertilizer application and a 30% reduction in throughfall on loblolly pine productivity, transpiration, hydraulic conductance, and stomatal conductance. The study was installed in a ten-year-old loblolly pine plantation on a somewhat poorly drained site in northern Florida. Throughfall reduction did not impact tree productivity or water relations of the trees. This lack of response was attributed to abundant rainfall and the ability of trees to access the shallow water table at this site. Fertilizer application increased basal area production by 20% and maximum leaf area index by 0.5 m2∙m−2, but it did not affect whole-tree hydraulic conductance or the sensitivity of stomatal conductance to vapor pressure deficit. During the spring, when leaf area and vapor pressure deficit were high, the fertilizer-only treatment increased monthly transpiration by 17% when compared to the control. This relationship, however, was not significant during the rest of the year.

1. Introduction

The concentration of carbon dioxide (CO2) and other greenhouse gases in the Earth’s atmosphere have increased markedly due to the combustion of fossil fuels and land use changes. The concentration of atmospheric CO2 has increased from 280 parts per million (ppm) to over 400 ppm since the start of the Industrial Revolution [1,2]. Climate change simulations using the assumptions of the Intergovernmental Panel on Climate Change A2 scenario, which represents a largely business-as-usual future, suggest that the southeastern U.S. will experience an increase in average temperature of 2.5 to 4.7 °C by 2085 [3]. Estimates for changes in precipitation for this region are much less certain and range from a 22% reduction to a 9% increase in summertime (June, July, August) precipitation by 2070–2099 [3]. Increased average temperature and potential decreases in precipitation would decrease soil water availability and increase vapor pressure deficits (D). These changes could influence the carbon gain and water use of loblolly pine (Pinus taeda L.) plantations due to the sensitivity of stomatal conductance to these variables.
Loblolly pine accounts for 84% of all seedlings planted in the southeast United States (U.S.) and is the nation’s leading timber species [4,5]. Within its native range, which extends from Texas eastward to Florida and northward to Delaware, there are approximately 12 million hectares of loblolly pine plantations [4,6]. These plantations have tremendous ecological and economic value. Southeastern forests sequester 76 Tg of carbon each year, which represents 13% of regional greenhouse gas emissions [7], and they play an important role in regulating water quality and yield [8,9]. Forestry is vital to the economy of the South, providing 5.5% of the jobs and 7.5% of the industrial output [10].
The productivity of loblolly pine plantations is often limited by the availability of essential nutritional elements, especially phosphorus and nitrogen [11]. As a result, the application of fertilizer to these systems has become a common practice and has been shown to increase stemwood production and leaf area index (LAI) on a diversity of sites [11,12,13]. The increases in LAI associated with fertilizer application have also been shown to increase stand water use [14,15,16]. As the climate of the southeastern U.S. begins to change the impact of fertilizer application on the water relations of loblolly pine plantations will be of particular interest due to their extent and role in regulating watershed yield [9,17].
Several studies have investigated the impact of genetics, fertilizer application, and irrigation on the growth and water relations of loblolly pine [15,16,18,19,20], but few have investigated the influence of reduced water availability on these factors [21]. Given the economic and ecologic importance of loblolly pine forests, it is important to understand how potential changes in precipitation will impact their growth and water relations and how these responses interact with soil nutrient availability. The overall objective of this study was to investigate the influence of throughfall reduction and fertilizer application on loblolly pine productivity, transpiration, whole-tree hydraulic conductance, and sensitivity of canopy-level stomatal conductance to D. To meet these objectives a replicated throughfall reduction by fertilizer application experiment was installed in a loblolly pine plantation in northern Florida.

2. Materials and Methods

2.1. Study Design

This study took place at the Pine Integrated Network: Education, Mitigation, and Adaptation Project (PINEMAP) throughfall × fertilizer application study in Taylor County, Florida (30°12′22″ N, 83°52′12″ W). The study design is replicated at sites in Georgia, Oklahoma, and Virginia (see Will et al. [22] for details). The site is located on a Melvina-Moriah-Lutterloh soil complex which is characterized as a somewhat poorly drained fine sand [23]. The site was planted in the winter of 2003–2004 with a seed orchard mix of St. Joe Timber Company open-pollinated, genetically improved stock at a spacing of approximately 1.8 × 3.0 m.
The study design is a randomized complete block containing two levels of fertilizer application and throughfall reduction in a 2 × 2 factorial arrangement, with four replicate blocks. Blocks were selected by minimizing the variability of plot-level basal area. Plots treated with fertilizer received 224N, 27P, 56K (kg·ha−1) and 22.4 kg·ha−1 of a micronutrient blend consisting of 6% sulfur, 5% boron, 2% copper, 6% manganese, and 5% zinc [22]. Fertilizer was applied by hand in April 2012. Plots treated with throughfall reduction received a 30% exclusion of incoming throughfall. A 30% reduction in throughfall was selected as this represented the extreme for predicted changes in drought severity within the United States at the time the study was established [24]. Throughfall exclusion construction was completed in April 2012. The factorial design results in four individual treatment types. The treatment types were:
(1)
Control (C): ambient throughfall, no fertilizer application
(2)
Throughfall Reduction (TR): 30% throughfall reduction, no fertilizer application
(3)
Fertilizer application (F): ambient throughfall, fertilizer application
(4)
Fertilizer application and Throughfall Reduction (TR+F): 30% throughfall reduction, fertilizer application.
All measurements were taken in 14.6 × 16.8 m measurement plots. The mean number of trees within measurement plots was 47. Measurement plots were surrounded by a 6 m treated buffer on all sides, followed by an additional 9.1 m buffer around the treatment plot. The gross area of the measurement and treated plots were 0.025 ha and 0.047 ha, respectively. All plots received a broadcast application of 140 mL∙ha−1 of metsulfuron methyl and 4 L∙ha−1 of glyphosate to remove competing vegetation prior to treatments being applied. An inventory of all trees in measurement plots was conducted in the dormant season of 2011–2012 to assess baseline conditions. There were no significant differences in the basal area, mean diameter at breast height (DBH, 1.37 m), height, or trees per hectare (p > 0.05) among treatments at this time. Additional inventories were conducted in the dormant season of 2012–2013 and 2013–2014 to assess the impact of treatments on stand growth. Inventories included measurements of DBH and total tree height. The sapwood area of all trees was estimated using an allometric equation relating sapwood area to DBH as reported in Gonzalez-Benecke and Martin [19]. In the original publication the equation was misreported as the sign of the intercept was incorrect. The corrected equation is:
ln ( A S ) = - 15 . 347 + 2 . 185   ln ( DBH )
where AS is stem sapwood area in m2 and DBH is expressed in mm.

2.2. Throughfall Exclusion Design

Throughfall exclusion troughs were installed parallel to pine rows and were constructed using pressure-treated lumber and 0.3 mm extrusion laminate plastic sheeting with 2 layers of U.V. stabilized coextruded polyethylene and a high strength cord grid (Poly Scrim 12, Global Plastic Sheeting Inc., San Diego, CA, USA). Each throughfall exclusion structure contained two 0.5 m wide troughs separated by a 0.4 m opening. The opening between the exclusion troughs was designed to allow some throughfall to access the area beneath each trough in order to reduce soil moisture heterogeneity. Exclusion structures were approximately 0.9 m in height at the low end and 1.4 m on the high end. PVC pipes and polyethylene drainage pipes were installed at the low end to remove the excluded throughfall from the gross plot area. The structures were installed such that 30% of the ground area was covered by troughs.

2.3. Meteorological and Soil Measurements

A weather station was installed on a tower above the stand in August of 2012 to measure photosynthetic photon flux density (PPFD) (PQS1- par quantum, Kipp and Zonen USA Inc., Bohemia, NY, USA), temperature and relative humidity (HMP45C, Campbell Scientific Inc., Logan, UT, USA) and precipitation (TE525MM-L, Texas Electronics Inc., Dallas, TX, USA). All sensors collected measurements every minute, and half-hour averages were stored on data loggers (CR10x, Campbell Scientific Inc.).
Soil volumetric water content was measured monthly from November 2013 to April 2014 using a Tektronix 1502B Metallic Time-Domain Reflectometer. Measurements were taken on tungsten inert gas (TIG) welding rods of varying lengths installed vertically into the soil. In each plot three pairs of TIG rods (30 cm, 60 cm, and 84 cm lengths) were installed at two locations. One set of TIG rods was installed in the tree row and another set between tree rows. In plots containing throughfall exclusions the set of TIG rods between the tree rows was placed directly under an exclusion trough. The location of the TIG rods in the tree row was randomly selected and the set of TIG rods between the trees rows were installed adjacent to this location. Measurements were converted to volumetric water content using the equation reported by Topp et al. [25]. The volumetric water content of the 30–60 cm (θ30–60) and 60–84 cm (θ60–84) soil regions was calculated as the difference of each reading from the reading of the next shallowest soil depth, assuming that the original reading represented the weighted average of the entire measured soil profile:
θ 30 60 = θ 0 60 ( 0 . 5 × θ 0 30 ) 0.5
θ 60 84 = θ 0 84 ( 0 . 7143 × θ 0 60 ) 0.2857
where θ0–60 is the volumetric water content of the 0–60 cm soil region and θ0–84 is the volumetric water content of the 0–84 cm soil region.
The volumetric water content of the top 20 cm of soil (θ20) was measured monthly from April 2013 to December 2013 using a Campbell Scientific CS620 water content sensor. Measurements were taken in the tree row, a quarter of the distance between tree rows, and half of the distance between tree rows. For plots with throughfall exclusion structures this represented readings in the tree row, at the edge of an exclusion trough and directly under a trough.
Soil bulk density and texture was measured in the top 20 cm of soil in the winter of 2012–2013 using a 150 cm3 soil bulk density sampler. Soil samples were collected for the 0–10 cm and 10–20 cm depths at three locations in each of the 16 plots. One sample was taken in the tree row, one was taken a quarter of the distance between tree rows, and one was taken half of the distance between tree rows. Soil samples were weighed after being oven-dried at 105 °C for 48 h. Bulk density was then calculated as soil dry weight divided by soil volume. To measure soil texture, samples were collected from eight random locations in each plot for each depth (0–10 cm and 10–20 cm). The eight samples were then randomly split into two groups for each depth and mixed, resulting in two samples per depth per plot. All samples where then homogenized, sieved to 2 mm, and roots and organic matter set aside. Forty grams of soil was taken from each sample for texture analysis using the hydrometer method outlined by Gee and Bauder [26].

2.4. Leaf Area Index, Specific Needle Area, and ANPP

Needlefall was collected approximately every four weeks from June 2012 to April 2015 from 12 0.5-m2 needlefall traps randomly located in each plot. After collection any non-needle material was removed from the sample and the remaining needles were oven dried for at least one week at 70 °C and weighed. Projected leaf area index (LAI) for each collection period was calculated from needlefall as described in Martin and Jokela [27]. This method also calculated daily LAI estimates.
Specific needle area was measured on 5 trees per plot. Ten fascicles were collected from the top third of the crown of each sample tree on 13 March 2014. Needles were cut to 10 cm and the radius of each needle in each of the 10 fascicles per tree was measured. For each individual needle the radius was measured on the two flat sides and then averaged. All needles were then dried at 65 °C for four days and weighed. Specific needle area was calculated as the ratio of the surface area of all needles measured for a given tree divided by the dry weight of all the measured needles.
Aboveground net primary productivity (ANPP) for the 2013 growing season was calculated as in Martin and Jokela [27]. Aboveground woody biomass increment was calculated using yearly inventory measurements and the allometric equations reported by Gonzalez-Benecke et al. [28]. Foliage biomass production was determined from needlefall data.

2.5. Sap Flow and Transpiration

Sap flux density (JS, g∙m−2∙s−1) was measured in the stem xylem on a subset of five trees per plot (80 trees in total) throughout 2013 using Granier-style heat dissipation sensors [29,30]. The temperature difference (ΔT) between these probes was measured every minute, and half hour averages were stored on data loggers. Values of ΔT were converted to JS using the empirical calibration developed by Granier [29] and confirmed by Clearwater et al. [31]:
J S = 119 × ( Δ T m Δ T Δ T ) 1 . 231
where ΔT is the instantaneous temperature difference between the reference and heated probes and ΔTm is the maximum temperature difference. Values of ΔTm were determined on nights when D was below 0.2 kPa for at least two hours, as there was little to no sap flow during these periods.
Measurement trees were selected in the spring of 2012 using the “quantiles of total” technique [32]. A summary of the minimum, maximum, and mean DBH of sap flow measurement trees at the start of 2013 is given in Table 1. All sensors were inserted into the north side of the tree and covered with reflective insulation to minimize the influence of solar radiation on the temperature of the stemwood. To account for radial variation in Js, the measurement trees closest to the quadratic mean diameter of 8 plots (2 per treatment) were outfitted with specialized probes to measure Js at the 2–4 cm and 4–6 cm depths from February 2014 to April 2014. These probes were constructed using longer needles of the same gauge and material as the needles used in 20 mm probes.
An equation was developed to correct estimates of JS measured in the outer 2 cm of sapwood to account for radial variation using the QT method described in Gonzalez-Benecke and Martin [19]. For trees outfitted with radial variation probes, corrected half-hourly estimates of transpiration (ERAD) were calculated by multiplying the JS measured in each region of sapwood (0–2 cm, 2–4 cm, and >4 cm) by the corresponding sapwood area of each region. Uncorrected transpiration estimates (E20) were then calculated by multiplying the entire sapwood area by the value of JS measured in the outer 2 cm of sapwood. A linear regression model was then developed to predict corrected transpiration estimates (ECOR) from E20, D, and PPFD:
ECOR = −0.00065 + 0.88497 × E20 + 0.0087 × D − 0.00001 × PPFD
This equation accounted for 99% of the variation in ECOR. The variables D and PPFD were included in this model as they have been shown to affect the radial pattern of sap flow in loblolly pine [19].
After accounting for radial variation, transpiration for each measurement tree was calculated by multiplying the corrected JS estimates by total sapwood area. Plot-level transpiration estimates were calculated by using the proportion of total sapwood area of measurement trees in a plot to the total sapwood area of all trees within a plot.
Gaps that occurred in the JS dataset due to sensor error and power failure were filled using a variety of models. Regression models were constructed for each individual measurement tree relating the JS of each tree to the overall mean JS of all trees within a given treatment. The R2 of these models ranged from 0.87 to 0.99 with a mean of 0.96. If a data gap existed for any individual tree while sensors in other trees of the same treatment were functioning properly, values of JS were filled using these regression equations. For the entire data set of all 80 trees, 21% of the JS data points were filled in this manner. If all of the sensors at the site were inoperable, due to power failure, then values of JS were filled from a nonlinear function which predicted JS from meteorological data. The R2 of these models ranged from 0.86 to 0.95 with a mean of 0.92. For the entire data set of all 80 trees, 14% of the JS data points were filled in this manner. Power failure occurred at the site during the entire month of December and values of JS were not calculated. For this month daily estimates of transpiration (EDay, mm) were filled using a model to predict EDay from meteorological data. The mean R2 of these models was 0.82.

2.6. Canopy-Level Stomatal Conductance

Canopy stomatal conductance (GC, mmol∙m−2∙s−1) was calculated using the simplified version of the Penman-Monteith equation reported in Samuelson et al. [33]:
G C = λ γ E L D ρ c p
where λ is the latent heat of vaporization (2465 J∙g−1), γ is the psychometric constant (65.5 Pa∙K−1), ρ is the density of air (1225 g∙m−3), cp is the specific heat of air (1.01 J∙g−1∙K−1), EL is transpiration per unit leaf area (mm∙m−2∙s−1), and D is vapor pressure deficit (Pa). Transpiration per unit leaf area was calculated by dividing canopy transpiration (mm∙s−1) by projected leaf area index. Values of GC were calculated only when D > 0.6 kPa due to errors associated with calculations of GC at low D [34].
The sensitivity of GC to changes in D was described by fitting two different models previously developed to describe this relationship. The first model is reported in Ewers et al. [35]:
G C = G Cref δ   lnD
where GCref is the maximum GC in mmol∙m−2∙s−1 at D = 1 kPa and δ is the slope of the boundary line of the relationship between GC and ln D (kPa). The second model is used in the Physiological Principles in Predicting Growth model (3-PG) to describe the sensitivity of GC to changes in D:
ln ( G C ) = ln ( MaxCond ) CoeffCond × D
where MaxCond is the maximum GC in m∙s−1 at D = 0 and CoeffCond defines stomatal response to D in mb−1 [36,37]. Both of the models were fit using the quantile regression procedure in SAS 9.3 with a quantile threshold of 0.98 (SAS Inc., Cary, NC, USA) [37].
Whole-tree hydraulic conductance (Ks, mol∙m−2∙s−1∙MPa−1) was calculated for individual trees as the slope of the linear regression of JS and leaf water potential (ΨL) [38]. Measurements of ΨL were taken on shoot tips every two to three months using a portable pressure chamber (PMS 1000, MPS Instrument Co., Corvallis, OR, USA). Two of the four blocks were sampled on each measurement date due to time limitations. Samples were taken from four sap flow trees per plot from pre-dawn to late afternoon on each measurement day. Measurements were taken at approximately 2 h intervals resulting in four to five measurements being completed for each tree on each day. Shoot tips were collected using a pole pruner and were stored in plastic bags with wet paper towels in order to minimize desiccation. All measurements were completed within 3 min of shoot excision. The hydraulic conductance of each tree was then calculated and used to produce plot level averages for statistical analysis.

2.7. Statistical Analysis

Analysis of variance was used to analyze the effects of treatments on growth and water relations traits, including Bonferroni adjustments. (PROC MIXED; SAS Institute Inc., Cary, NC, USA). The linear model for the analysis was:
Y ijk = μ + F i + TR j + FTR ij + B k + ε ijk
where Yijk is the parameter value of the plot with the ith level of fertilizer application (F) (0, 1), the jth level of throughfall reduction (TR) (0, 1), in the kth block (B) (1, 2, 3, 4) and μ is the population mean and εijk is the error term ~NID (0, σ2ε) (NID, normally and independently distributed). For a given main effect a value of 0 represented not receiving a treatment while a value of 1 represented receiving the treatment. Repeated measures analysis of variance was used to analyze time series data with an autoregressive covariance structure. Values of whole-tree hydraulic conductance were scaled to the plot level by averaging the values for the four trees measured in each plot. A significance level of p < 0.05 was used in all analyses.

3. Results

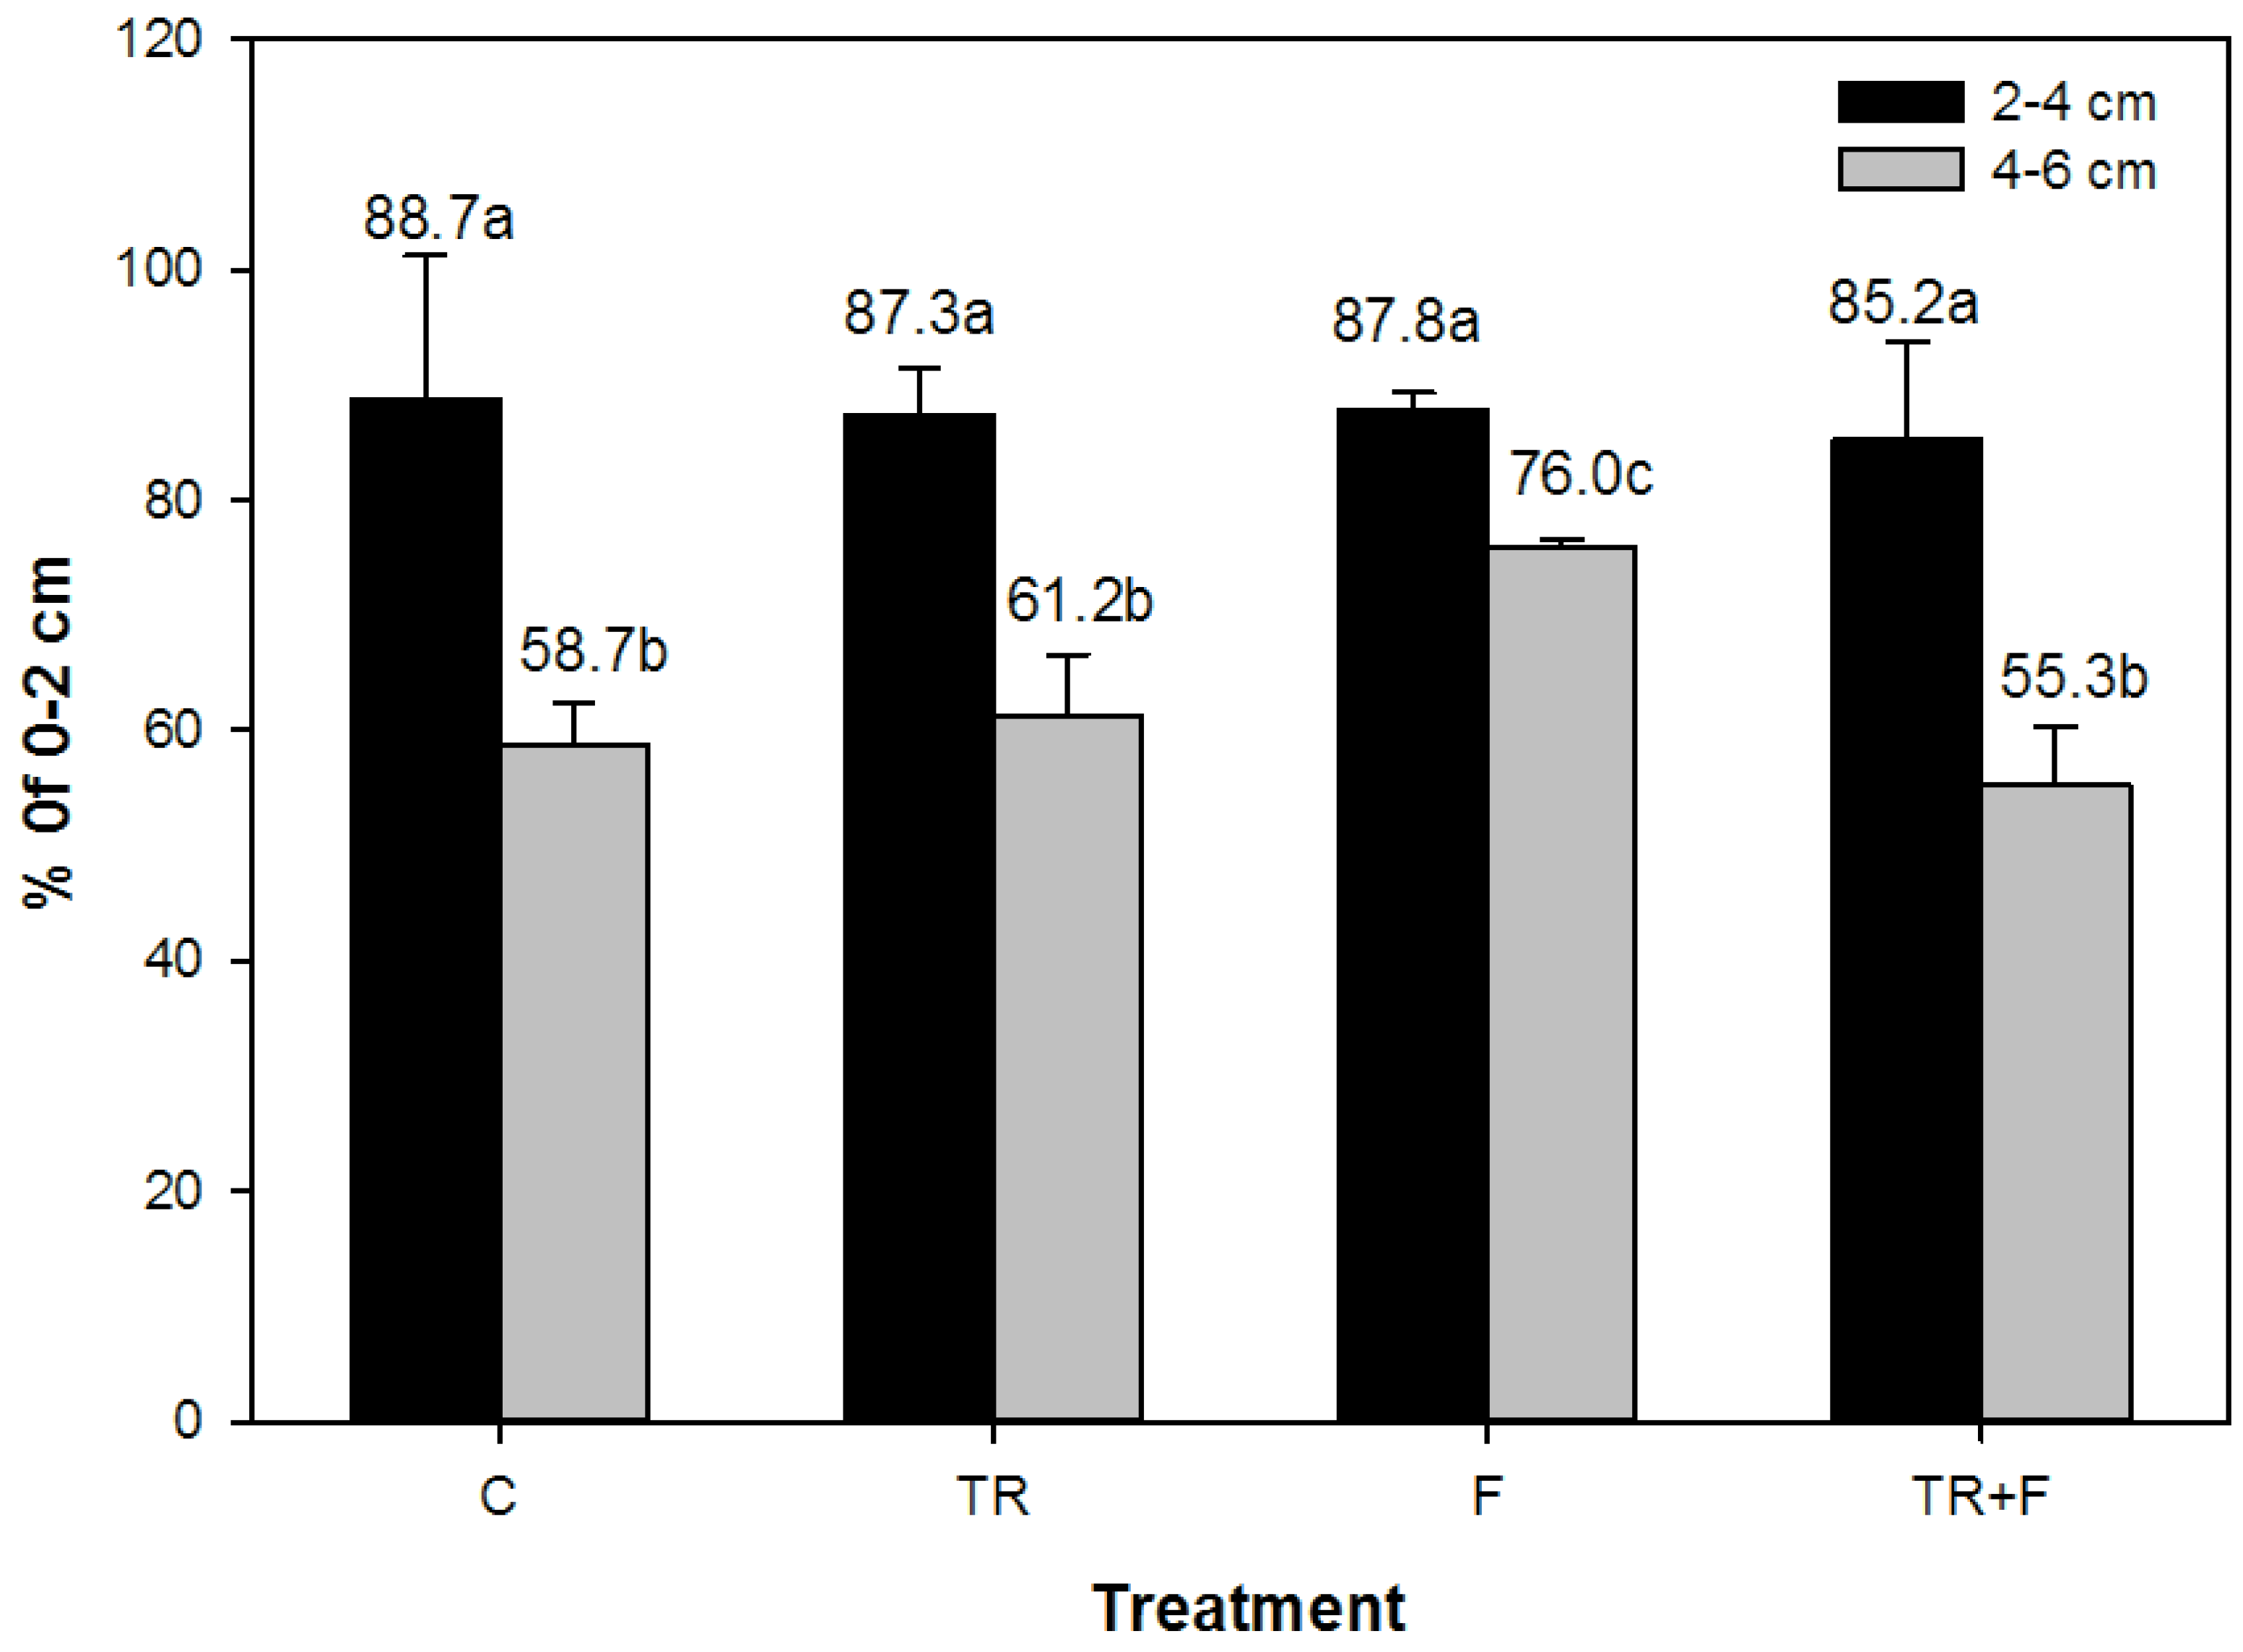
3.1. Soil Bulk Density, Texture, and Moisture

The bulk density and texture of the top 20 cm of soil was relatively consistent among treatments. The mean soil texture was 95% sand, 4% silt, and 2% clay. There were no differences in sand (p = 0.232) or silt (p = 0.198) content among treatments, but there were differences in clay content such that the TR+F treatment had significantly more clay content than the control (0.8% vs. 3.4%)(p = 0.025). There were no other differences among treatments in clay content (p > 0.11). Soil bulk density did not differ among treatments for the 0–10 cm (p = 0.220) or 10–20 cm (p = 0.429) depths and averaged 1.12 and 1.2 Mg∙m−3 respectively.
Throughfall reduction lowered the volumetric water content of the upper 20 cm of soil (θ0–20), but this effect was not apparent at deeper depths. Values of θ0–20 were reduced by a mean of 0.014 cm3H2O∙cm−3soil in response to throughfall reduction (p = 0.001). This estimate was calculated as the weighted mean of three θ0–20 measurements taken at different positions on each measurement date. When analyzed individually, throughfall reduction significantly decreased θ0–20 in the tree line by 0.01 cm3H2O∙cm−3soil (p = 0.030), at the edge of exclusion troughs by 0.023 cm3H2O∙cm−3soil (p = 0.002), and directly under exclusion troughs by 0.027 cm3H2O∙cm−3soil (p < 0.001). Throughfall reduction also lowered the volumetric water content of the soil region directly under exclusion troughs by 0.048 cm3H2O∙cm−3soil in the 0–30 cm soil depth (θ0–30, p ≤ 0.001) and by 0.032 cm3H2O∙cm−3soil in the 30–60 cm (θ30–60, p = 0.022) soil depth. There was no effect of throughfall exclusion on the soil moisture of the 60-84 depth (θ60-84, p = 0.084). When measured in the tree row, plots treated with throughfall exclusion had 0.032 cm3H2O∙cm−3soil less volumetric water content in the 30–60 cm depth (p = 0.022) while θ0–30 and θ60–84 were unaffected (p > 0.134).

3.2. LAI, Needlefall, and Growth

Projected leaf area index (LAI, m2·m−2) was greater in plots treated with fertilizer application in both the 2012 (p = 0.037) and 2013 (p < 0.001) growing seasons. Throughfall reduction did not significantly affect LAI. In both years LAI was at a maximum at the end of July and at a minimum at the beginning of March (Figure 1). Maximum values of LAI for fertilized and unfertilized plots were 3.7 and 3.4 in 2012 and 4.2 and 3.6 in 2013, respectively (Table 2). Total annual needlefall in 2013 was significantly greater (p < 0.001) in plots treated with fertilizer (6.5 Mg∙ha−1∙year−1) compared to untreated plots (5.5 Mg∙ha−1∙year−1, Table 2). Specific needle area was unaffected by both fertilizer application (p = 0.465) and throughfall reduction (p = 0.693). The mean specific needle area was 104.8 cm2∙g−1.
Basal area increment was greater in plots treated with fertilizer in both 2012 and 2013 (p = 0.007, p = 0.033) and was unaffected by throughfall reduction (p = 0.230, p = 0.576). Growth rates were higher in 2012 than in 2013 and ranged from 4.0 to 5.0 m2∙ha−1∙year−1 and 3.4 to 4.3 m2∙ha−1∙year−1 for each year, respectively (Table 2). The TR+F treatment had a lower absolute growth rate than the F treatment in both 2012 and 2013, but this difference was not significant (p = 0.298, p = 0.273). Height growth was unaffected by the treatments and averaged 1.4 m∙year−1.
Values of aboveground net primary production (ANPP) were 26.5, 28.1, 32.3, and 30.2 Mg∙ha−1∙year−1 for the C, TR, F and TR+F treatments respectively. There was a significant F×TR interaction for ANPP (p = 0.049) such that the ANPP of the F and TR+F treatments were both greater than the control (p < 0.001, p = 0.012), but only the F treatment was greater than the TR treatment (p = 0.006, Table 2). There was no difference between the F and TR+F treatments (p = 0.096).

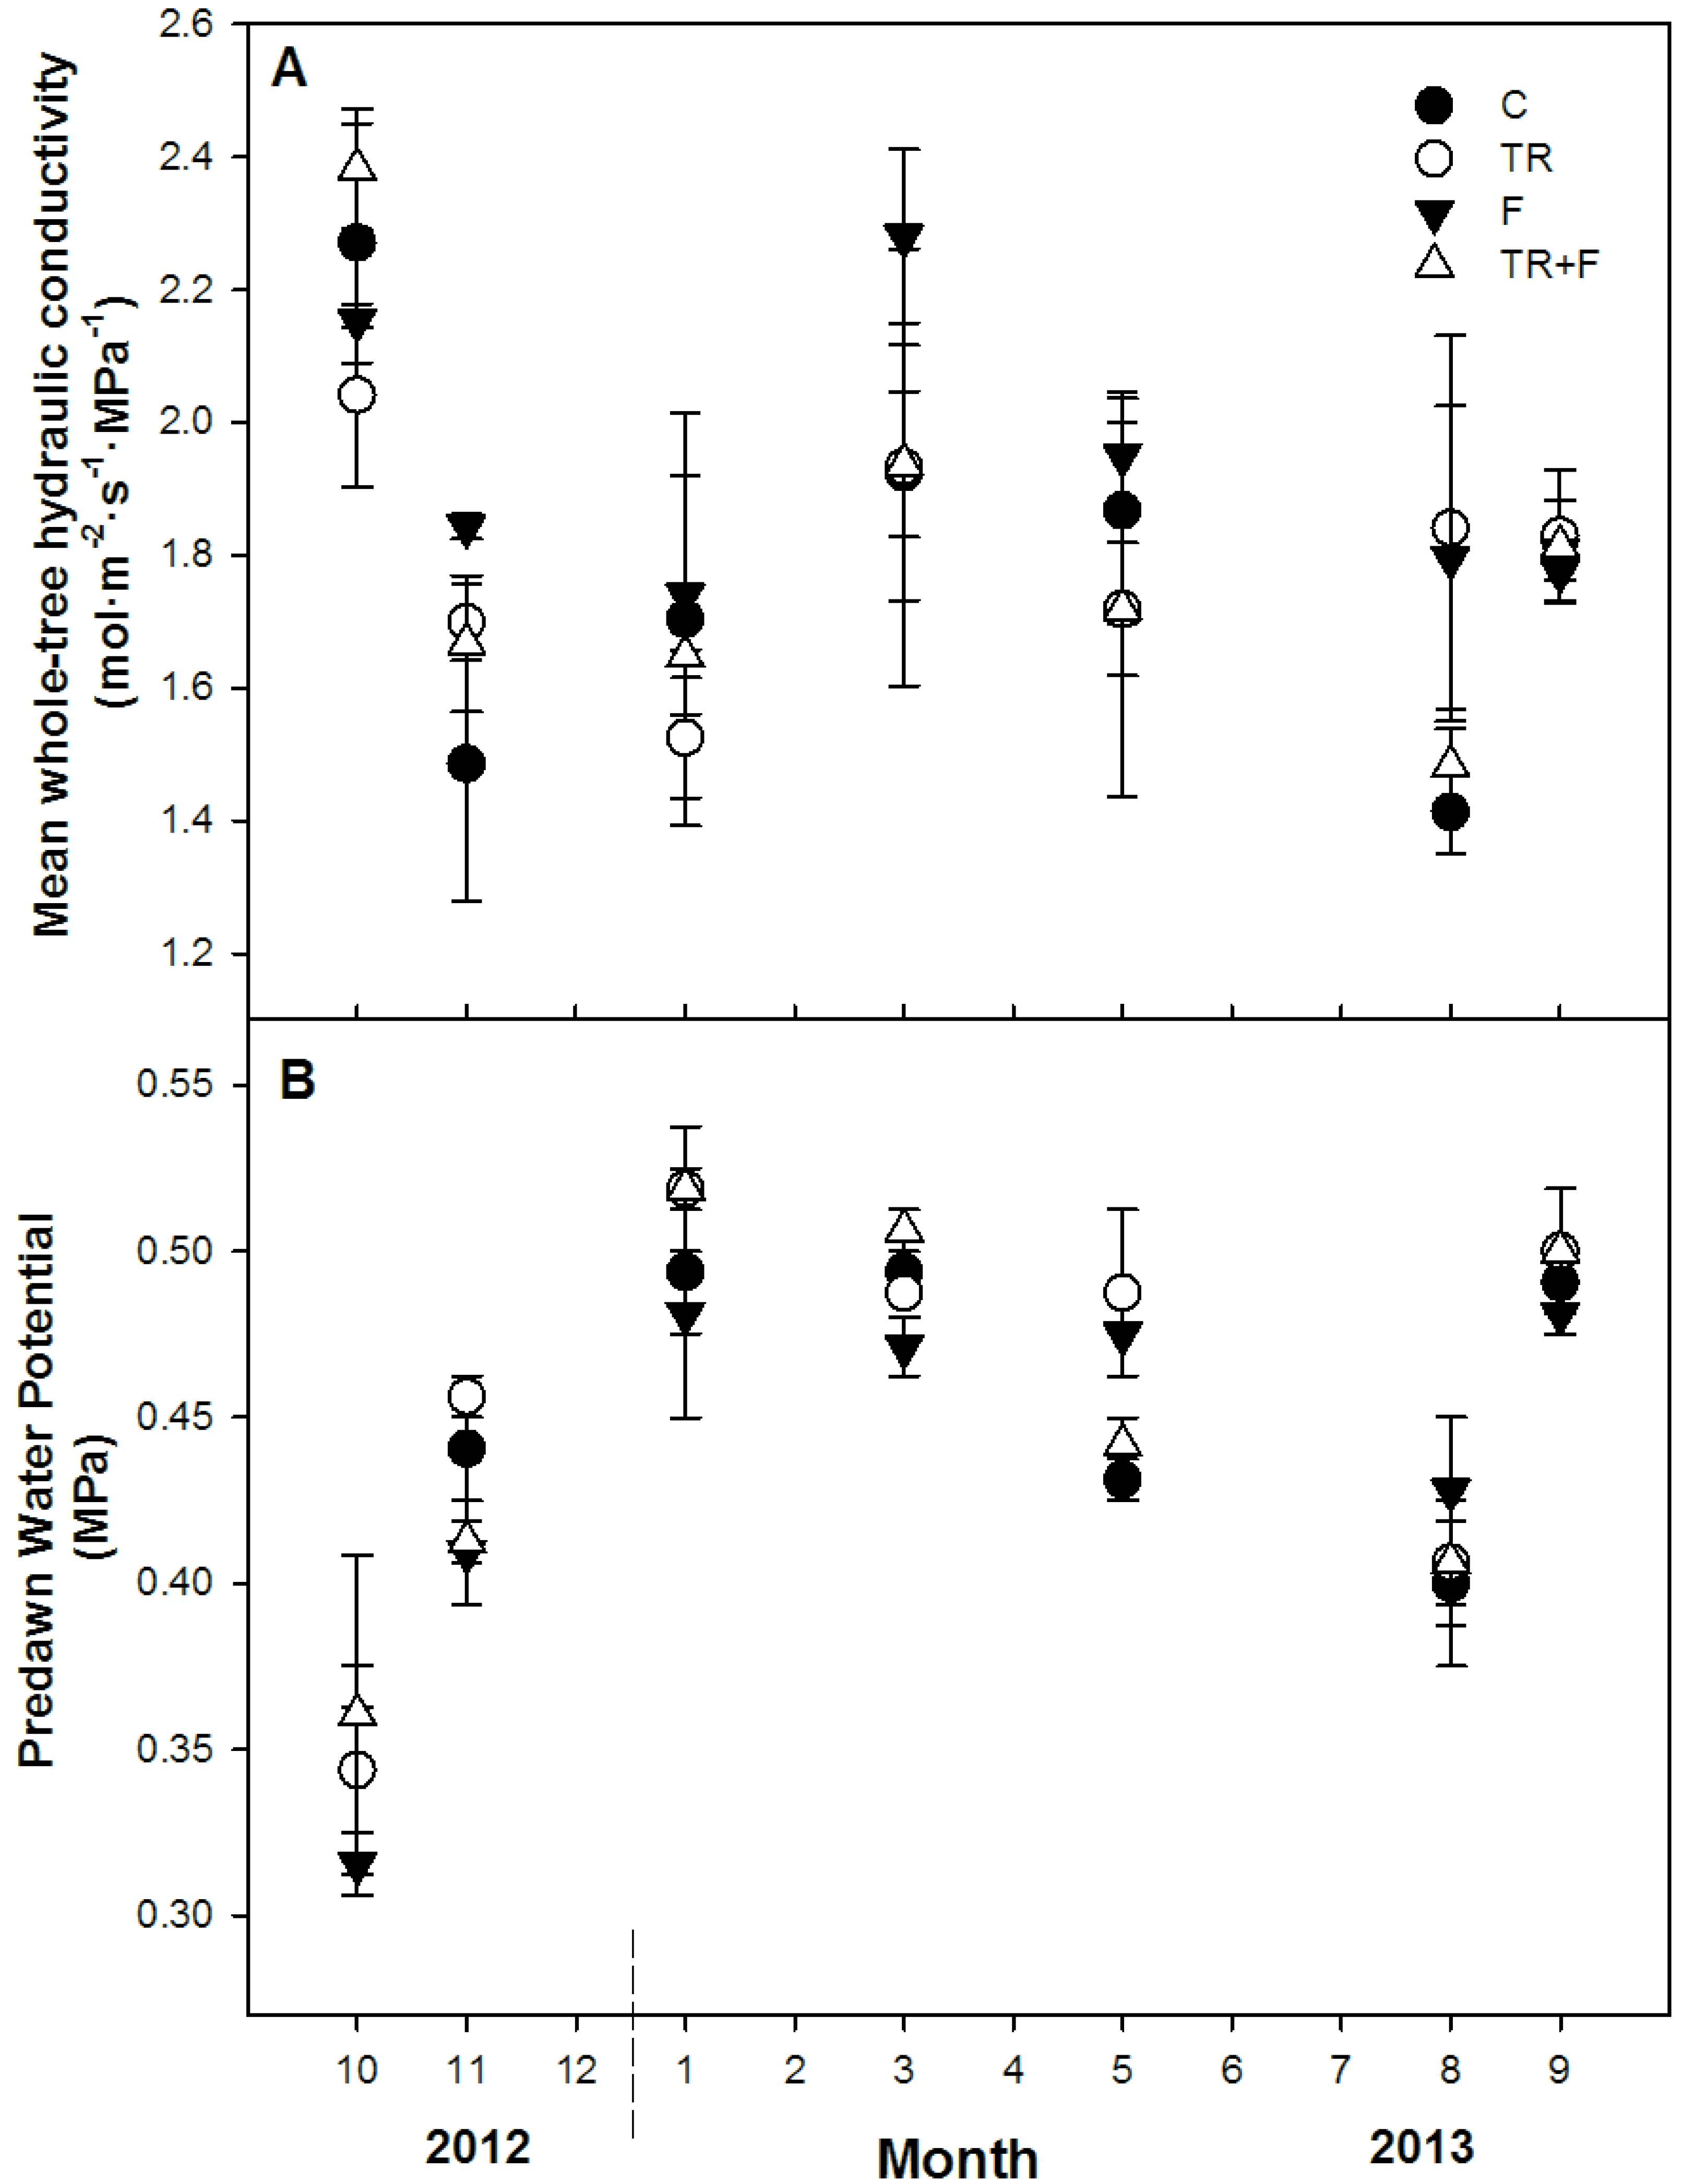
3.3. Whole-Tree Hydraulic Conductance

Whole-tree hydraulic conductance was not affected by fertilizer application (p = 0.276) or throughfall reduction (p = 0.425). There was, however, a significant effect of measurement date on Ks (p < 0.001, Figure 2). Throughout the measurement period Ks ranged from 1.63 mol·m−2·s−1·MPa−1 in August 2013 to 2.21 mol·m−2·s−1·MPa−1 in October 2012. Similar to Ks, pre-dawn water potential (Ψp) was not significantly affected by fertilizer application (p = 0.372) or throughfall reduction (p = 0.093), but did vary through time (p < 0.001). Values of Ψp ranged from −0.34 MPa to −0.53 MPa.

3.4. Radial Variation in Sap Flow
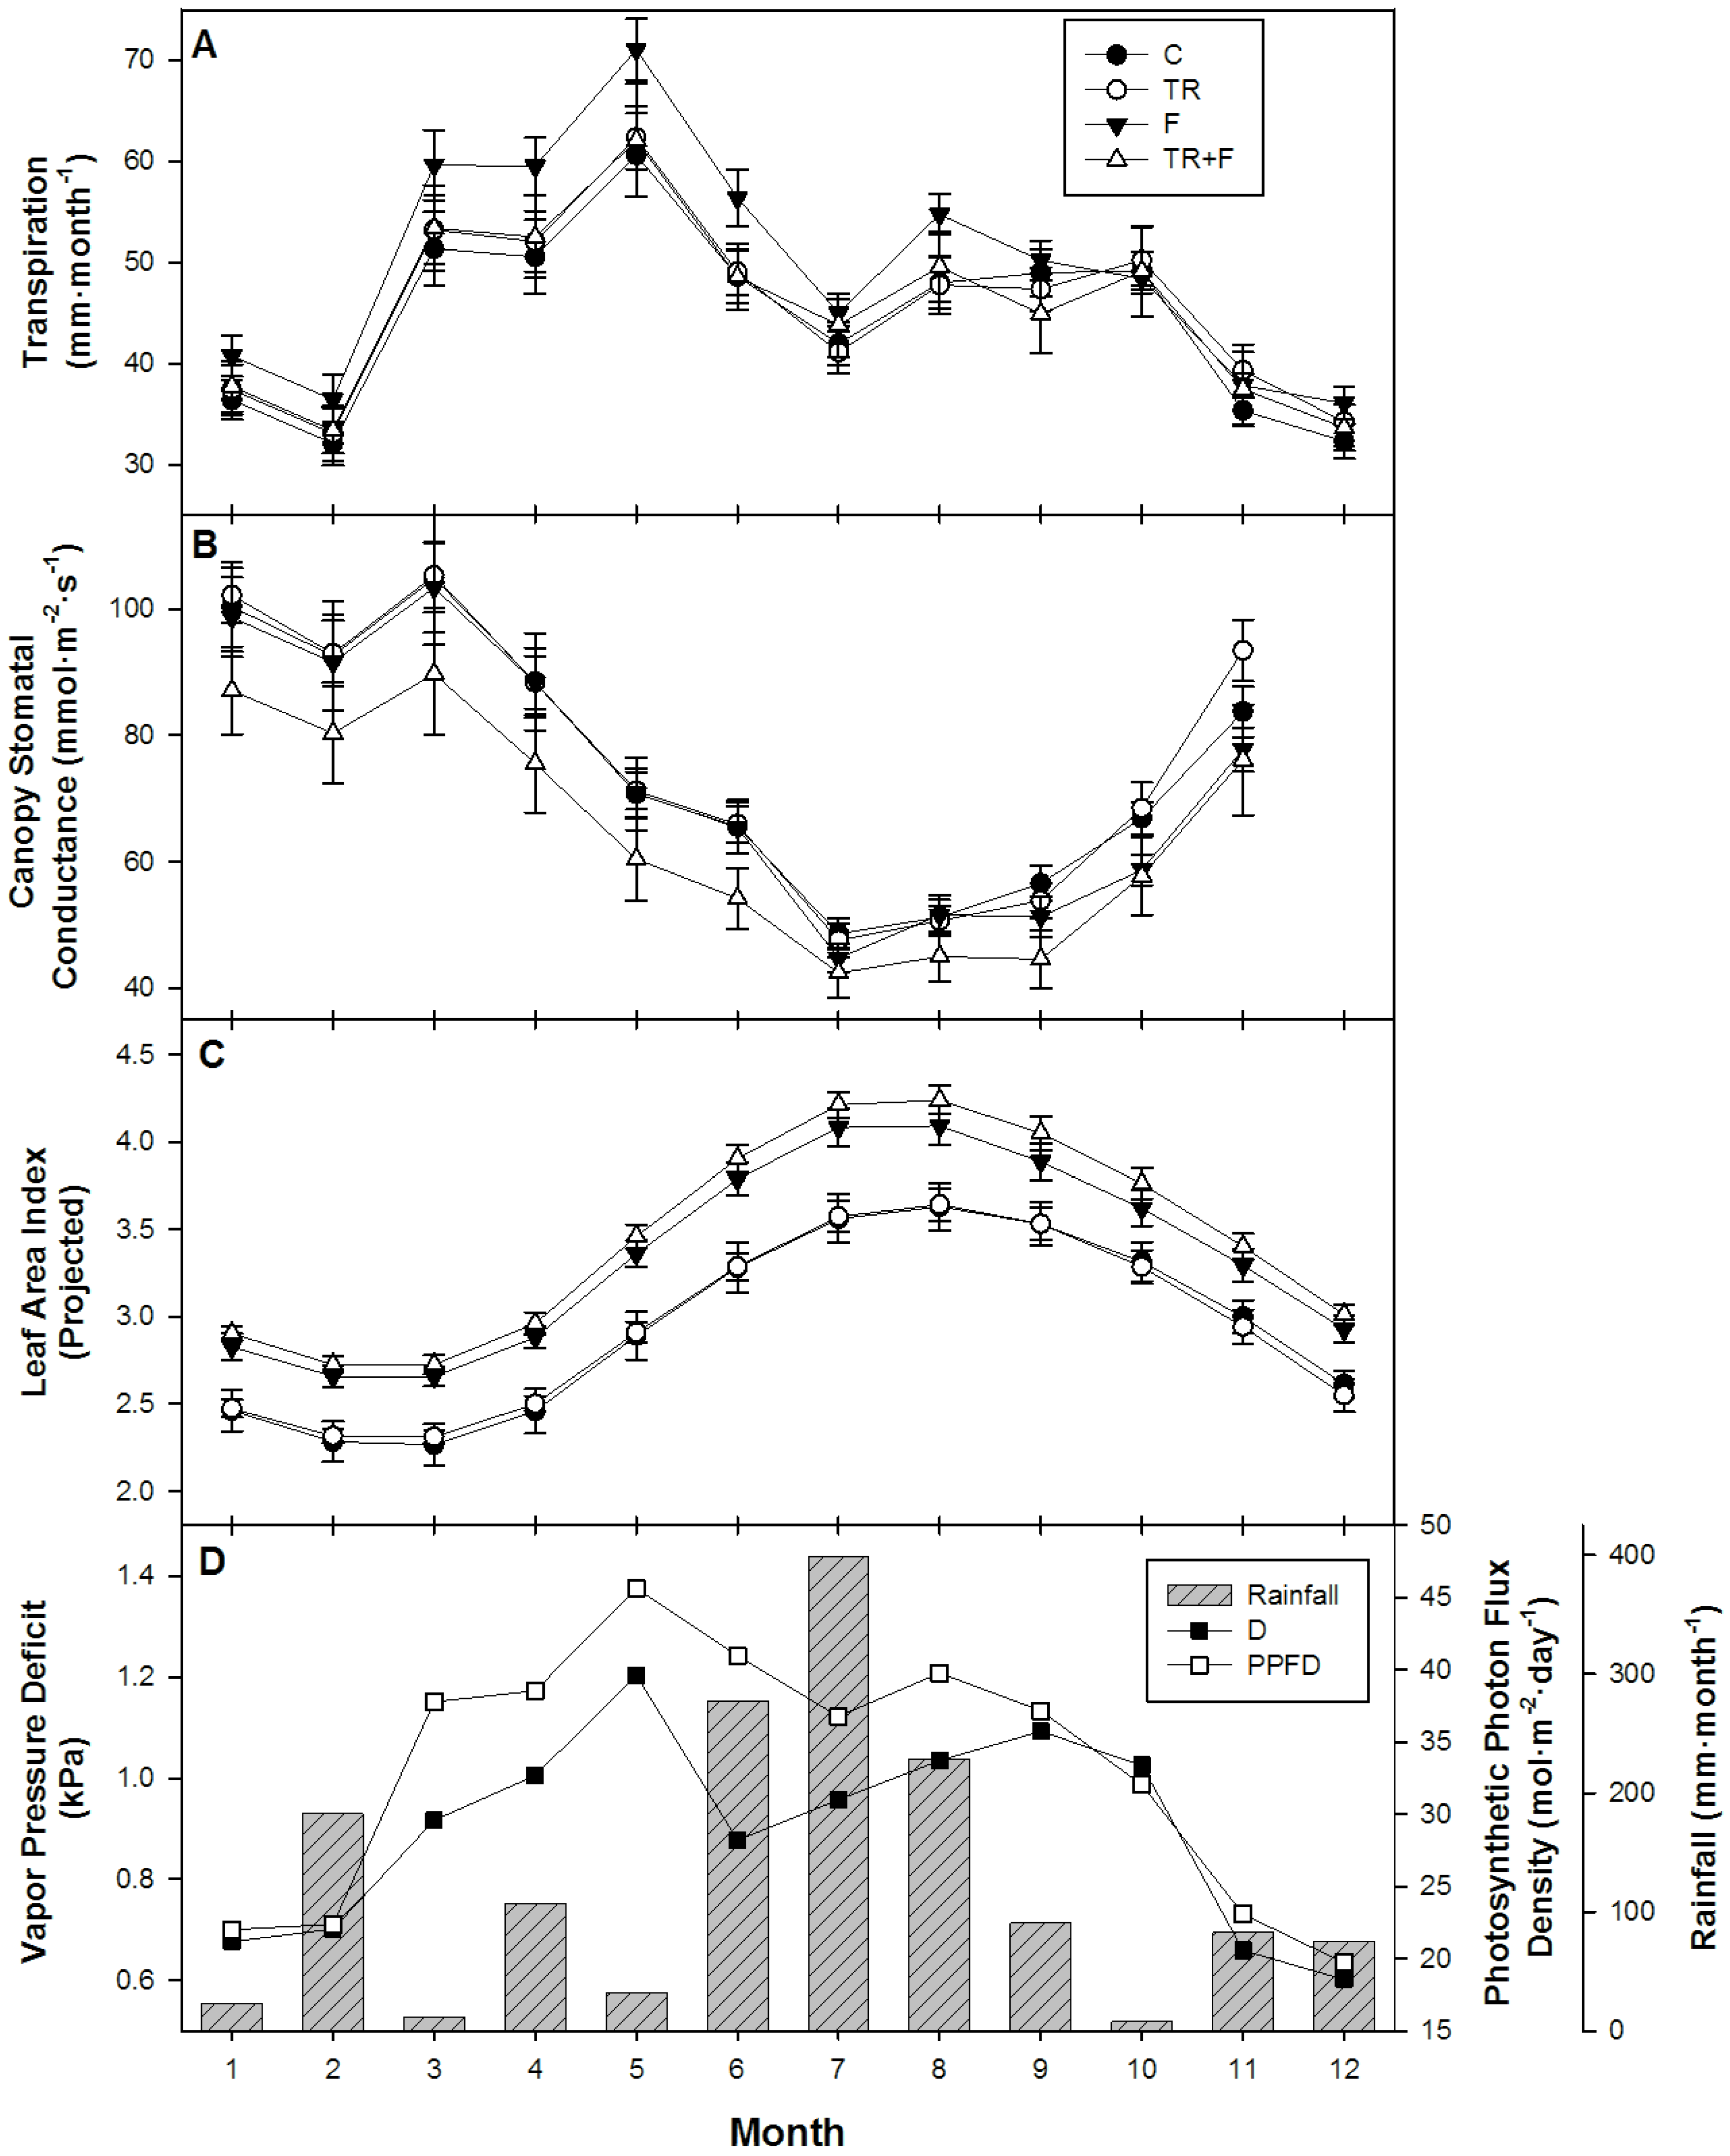
To examine the relative rates of sap flow at different depths in the xylem, we compared daily summed sap flow per unit sapwood area (Js) at 2–4 cm and 4–6 cm depths with daily sums in the outer 0–2 cm depth. Daily sums of Js decreased significantly with depth (p < 0.001). The JS of the 2–4 cm depth was on average 87% of the 0–2 cm Js in all treatments (Figure 3). The Js of the 4–6 cm depth was 58% of the 0–2 cm Js for the C, TR and TR+F treatments, but 76% for the F treatment. Daily JS of the 0–2 cm depth did not differ among treatments (p = 0.598).

3.5. Transpiration

Total transpiration for 2013 (EYear) was not affected by fertilizer application (p = 0.349) or throughfall reduction (p = 0.544). Values of EYear were 535, 547, 596, and 546 mm∙year−1 for the C, TR, F, and TR+F treatments, respectively (Table 3). Total rainfall for 2013 was 1520 mm, resulting in annual transpiration representing 35.2%, 39.2%, 36.0%, and 35.9% of annual rainfall for the C, TR, F, and TR+F treatments, respectively [39]. Monthly transpiration rates (EMonth) varied over time, with higher transpiration rates occurring during the spring and summer months when LAI and D were high (Figure 1). There was a significant interaction between month, fertilizer application and throughfall reduction (p = 0.033) such that in May, when D was at a maximum, EMonth was significantly higher in the F treatment than the C (p = 0.013), TR (p = 0.034), and TR+F (p = 0.029) treatments. There was no effect of treatment on leaf level transpiration (ELeaf) during this month (p = 0.401), and ELeaf averaged 0.4 mmol∙m−2∙s−1 for May. In March and April the EMonth of the F treatment was greater than the control (p = 0.042, p = 0.029), but not the TR (p = 0.105, p = 0.063) or TR+F (p = 0.113, p = 0.079) treatments.

3.6. Canopy Conductance

The response of GC to D was not significantly affected by any of the treatments (Table 3). The mean sensitivity of GC to D, as defined by the parameters δ and GCref, was 78.1 mmol∙m−2∙s−1∙ln(kPa)−1 and 135.4 mmol∙m−2∙s−1, respectively. This response was consistent across all treatments. The 3-PG model uses parameters describing maximum GC (MaxCond, m∙s−1) and stomatal response to D (CoeffCond, mbar−1) to calculate values of GC under optimal conditions. Estimates of MaxCond and CoeffCond were 0.006 m∙s−1 and 0.059 mbar−1, respectively. These parameters were not significantly affected by treatment (p = 0.522, p = 0.41).

4. Discussion

In this study, a 30% reduction in throughfall had little effect on loblolly pine water relations and growth on a poorly drained site in northern Florida after one year of treatment. Although throughfall reduction decreased the volumetric water content (θ) of the upper 20 cm of soil by 0.014 cm3∙cm−3, there were no differences among treatments in the θ of the 60–84 cm soil region, even when measured directly under exclusion troughs. Values of predawn water potential (ΨP), which in theory reflect soil water potential, did not differ among treatments and were similar to values reported for irrigated loblolly pine stands in other studies in similar soils [16,19]. The lack of ΨP response to throughfall exclusion despite a reduction in θ0–20 and magnitude of ΨP values measured suggests that the trees at the study site were able to access soil water reserves deeper in the soil profile. It is likely that the trees at the study site were able to access the water table as numerous studies have shown that the water table typically fluctuates between 2m and the surface on somewhat poorly to poorly drained sites in the lower Coastal Plain flatwoods [40,41,42,43,44]. The rooting depth of loblolly pine has also consistently been shown to extend below 150 cm [45,46,47]. In addition to this, annual rainfall was greater than the long term average for the region during 2013 (1520 mm vs. 1404 mm) [39]. It is likely the combined effects of abundant rainfall and tree roots’ access to a high water table limited responses to throughfall reduction. Others have also noted a limited response to drought in planted pine on poorly drained Coastal Plain sites [42,48].

4.1. Whole-Tree Hydraulic Conductance

Treatments did not affect whole-tree hydraulic conductance (KS), although KS did vary over time. While we did not measure organ-level KS, the literature suggests that differences in KS between measurement dates may have been due to changes in root hydraulic conductivity which, in loblolly pine, has been shown to respond dynamically to changes in soil moisture [49]. The mean KS across all treatments and measurements dates was 1.84 mol·m−2·s−1·MPa−1. Bartkowiak et al. [50] found that throughfall reduction in combination with fertilizer application reduced KS from 3.83 mol·m−2·s−1·MPa−1 to 2.76 mol·m−2·s−1·MPa−1, but throughfall reduction in absence of fertilizer application had no effect on KS. For stands of a similar age and genotype, Gonzalez-Benecke and Martin [19] reported values of KS ranging from 0.84 mol·m−2·s−1·MPa−1 in the control treatment to 2.92 mol·m−2·s−1·MPa−1 in the irrigation treatment. The failure of throughfall reduction to affect KS in this experiment suggests that soil water availability was not reduced to the extent that xylem cavitation was increased. This result, in addition to the lack of response of ΨP, suggests that water availability was not limiting in any treatment.

4.2. LAI and ANPP

Fertilizer application increased leaf area index (LAI) and aboveground net primary productivity (ANPP). Increases in LAI are generally associated with increased productivity, and a strong correlation between foliage biomass and stem wood production has been shown in loblolly pine [51]. Minimum LAI was similar across treatments prior to study establishment, but once treatments were applied the LAI of plots treated with fertilizer application was consistently higher than untreated plots with the magnitude of difference increasing through time (Table 2). Increases in LAI in response to fertilizer application have been observed in loblolly pine plantations growing on diverse sites throughout the southeastern U.S. [12,14,27,50]. In contrast to this, Ward et al. [52] found that fertilizer application had no effect on LAI one year after application in a ten-year-old loblolly pine stand growing on a well-drained silt loam soil. This lack of response was thought to be due to stand development not having progressed to the point at which tree nutrient demand exceeded nutrient supply at the study site. In the current study, plots treated with fertilizer application had significantly greater ANPP (p = 0.001) due to increased foliage production and increased woody biomass increment. Throughfall reduction had no effect on ANPP (p = 0.734).

4.3. Sap Flow and Transpiration

Sap flow per unit sapwood area (JS) decreased toward the pith. Others have also observed reductions in JS with increasing depth in loblolly pine, but the magnitude and pattern of this reduction varies widely among studies. Phillips et al. [53] reported that for twelve-year old loblolly pine the JS of the 2–4 cm sapwood region was 41% of the outer 0–2 cm JS. For mature loblolly pine, Ford et al. [54] observed that JS was almost always greatest in the outer 2 cm of sapwood and tended to decrease with increasing depth. In contrast, Gonzalez-Benecke and Martin [19] did not observe a consistent pattern of radial variation and often observed maximum rates of JS in the inner sapwood regions of loblolly pine. The reason for these varying results is not readily apparent. Observed reductions in JS with increasing sapwood depth are likely the result of many contributing factors. The KS of sapwood has been shown to decrease with increasing depth in conifers [55,56]. This decrease in KS is likely the result of changes in the torus-margo structure that increase resistance to flow and permeability to air. Mark and Crews [57] showed that the margo of Pinus engelmannii Carr. and Pinus contorta Dougl. var. latifolia Engelm. were most open in the outer sapwood and became increasingly blocked and encrusted with increasing sapwood depth. The pit membrane structure of older xylem elements has also been shown to exhibit an increased permeability to air making them more vulnerable to cavitation [58]. The inner sapwood may also not be as well connected to the branches and leaves of the upper canopy, where transpiration rate is greatest, due to this region originally developing to supply branches and leaves that have since died or become shaded [59,60].
After accounting for radial variation in sap flow, daily maximum stand-level transpiration (EMax) did not significantly differ among treatments and ranged from 2.6 to 3.1 mm for the C and F treatments, respectively. Values of EMax were within the range reported for loblolly pine stands of various structures, ages, and genetics [16,19,61]. During the spring, when D and LAI were high, fertilizer application in absence of throughfall reduction increased monthly transpiration rate. The monthly transpiration rate (EMonth) of the F treatment was significantly higher than all other treatments in May, when D was at a maximum, and was also significantly greater than the C treatment during March and April (Figure 1). This observed increase in transpiration can be attributed to the higher levels of LAI in the F plots, as there was no difference in leaf-level transpiration (EL, mmol∙m−2∙s−1) during this time. Ewers et al. [14] also reported increased canopy transpiration (EC) in response to fertilizer application, but when EC was normalized by leaf area (EL), plots receiving only fertilizer had significantly lower EL than the control while plots receiving both fertilizer and irrigation were not different. Samuelson and Stokes [62] reported similar values of EL for stands treated with either irrigation or irrigation and fertilizer application. These results suggest that under conditions of abundant soil moisture EL is similar in fertilized and unfertilized stands, and observed differences in EC are driven by differences in LAI. Under conditions of water limitation; however, fertilizer application tends to reduce EL [19,63]. For example, Bartkowiak et al. [50] found that throughfall reduction in combination with fertilizer application reduced EL, but fertilizer application in absence of throughfall reduction had no effect on EL. Ewers et al. [14] hypothesized that reductions in EL in response to fertilizer application is the result of needles developing under conditions of relative soil drought. This relative soil drought was attributed to increases in LAI without corresponding increases in root growth and increased interception losses.
Total annual transpiration (EYear) did not differ between treatments for 2013, despite observed differences in EMonth during the spring. Values of EYear ranged from 535 mm·year−1 in the C treatment to 596 mm·year−1 in the F treatment, which corresponded to 35.2% and 39.2% of total rainfall, respectively. Bartkowiak et al. [50] also found that EYear was unaffected by throughfall reduction or fertilizer application and reported values of EYear ranging from 577 to 652 mm·year−1, which corresponded to 41%–46% of annual precipitation. Values of EYear as high as 930 mm·year−1 have been reported for irrigated loblolly pine stands receiving the equivalent of 3000 mm·year−1 of annual rainfall [19]. Samuelson and Stokes [62] also observed significant increases in EC in response to irrigation. These results suggest that the annual transpiration of loblolly pine forests is closely tied to rainfall inputs. In contrast, Ewers et al. [19] and Ewers et al. [34] did not observe increases in EC with irrigation, but when fertilizer and irrigation treatments were applied EC was significantly greater than if either treatment was applied individually. This suggests that under conditions of nutrient limitation additional water inputs may not impact EC. Fertilizer application, in absence of irrigation, has also been shown to increase EC despite reductions in EL [14,63]. This effect is the result of increases in LAI being significant enough to increase EC despite reduction in EL.

4.4. Canopy Conductance

The sensitivity of GC to D was not affected by throughfall reduction or fertilizer application. In contrast to this, Bartkowiak et al. [50] found that throughfall reduction decreased GCref from 171.9 to 148.1 mmol∙m−2∙s−1 when compared to the control. This effect was even more pronounced in the throughfall reduction with fertilizer application treatment, which decreased GCref from 171.9 to 119.0 mmol∙m−2∙s−1. The contrast between the results of this study and those of Bartkowiak et al. [50] may be due to differences in site conditions and/or differences in genetics, as the genetics of loblolly pine has been shown to affect GCref and δ [19,20]. For example, Gonzalez-Benecke and Martin [19] found that irrigation increased GCref and δ in a South Carolina loblolly pine seed source while a Florida seed source was unaffected. This suggested that loblolly pine originating from Florida was less conservative in regulating water loss in response to changes in soil moisture. The lack of response of the diverse northern Florida seed sources in the current study may have resulted from adaptions to abundant water supply due to a high water table and high annual precipitation.
In loblolly pine, reductions in GCref have been reported in response to fertilizer addition [15,63]. This reduction in GCref is likely due to the same factors as those hypothesized to reduce EL [14]. Although a reduction in GCref was observed in response to fertilizer application in Ewers et al. [35], when both irrigation and fertilizer treatments were applied, GCref was found to be greater than the control or irrigation treatments alone. Samuelson et al. [16] also observed an increase in GCref with fertilizer application during a growing season having above average rainfall. The results of these studies suggest that the interaction between genetics, soil nutrition, and soil water availability play an important role in the response of stomatal conductance to changes in D.
The parameters describing the sensitivity of stomatal conductance to changes in D used in the 3-PG model (MaxCond and CoeffCond) were unaffected by either fertilizer application or throughfall reduction. The value of MaxCond observed in this study (0.006 m∙s−1) was identical to the number reported by Bryars et al. [64] for the parameterization of 3-PG for loblolly pine. In contrast to this Gonzalez-Benecke et al. [65] reported MaxCond to be 0.0118 m∙s−1 in their parametrization. This difference may be due to Gonzalez-Benecke et al. [65] using eddy covariance data to parameterize the model as eddy covariance measures total evapotranspiration and has been shown to produce higher estimates than the sap flow technique [66]. The value of CoeffCond measured in this study (0.059 mbar−1), however, was similar to the value of 0.041 mbar−1 reported in Gonzalez-Benecke et al. [65], but was more than twice the value reported by Bryars et al. [64] (0.025 mbar−1). This result suggests that the sensitivity of GC to changes in D is higher than is currently reflected in the parameterization of the Physiological Principles in Predicting Growth Model (3-PG) for loblolly pine [64,65]. This may have consequences, as the model is sensitive to this relationship when calculating stand transpiration and productivity.

5. Conclusions

In this study, a 30% reduction in throughfall did not significantly affect the growth or water use of a loblolly pine plantation on a poorly drained site in the lower Coastal Plain. This lack of response was likely due to abundant rainfall during the study period as well as the ability of trees to access the shallow water table at the study site. Although throughfall reduction decreased θ20, water use was not affected at the canopy or leaf-level. If a 30% reduction in precipitation was applied to an entire watershed, however, it is possible that the water use and growth dynamics of loblolly pine plantations would respond differently due to a lowering of the water table. It is also likely that a 30% reduction in throughfall over a longer period of time would produce different results. Fertilizer application significantly increased basal area production, ANPP, and LAI. This response has been observed by many others and is considered to be typical [11,12,13,14,27]. Fertilizer application did not affect the sensitivity of GC to D, but did result in increased EMonth during the spring, when D was high. During this time the monthly transpiration rate of the F treatment was 17% higher than that of the control. This increase in canopy transpiration was due to the fertilizer application only treatment having a greater LAI than the control treatment as there was no difference in ELeaf during this time. These results suggest that a reduction in precipitation will not affect the growth or water use of loblolly pine on poorly drained sites in the lower Coastal Plain as long as the water table remains high enough to be accessed by tree roots. If reductions in precipitation are significant enough to lower the water table below the rooting zone, however, soil water resources will likely impact the productivity of loblolly pine plantations in the region. Under such a scenario, fertilizer application would likely impact the water relations of these forests due to increases in LAI, also increasing the rate at which soil water resources are depleted.

Acknowledgments

This study was a part of the Pine Integrated Network: Education, Mitigation, and Adaptation project (PINEMAP), a Coordinated Agricultural Project funded by the USDA National Institute of Food and Agriculture, Award #2011-68002-30185. We thank A. Noorments, J.C. Domec, S. Gezan, C. Drum, B. Caudill, J. McCafferty, J. Cucinella, G. Lokuta, B. Ruffin, A. Milligan, B. Gottloeb, A. Garcia, P. Subedi, A. Fields, S. Walton, and J. Ireland for field and lab assistance, and Foley Timber and Land Company for providing access to the site.

Author Contributions

Maxwell Wightman helped install the research site and took the lead in writing the manuscript and conducting data analysis. Timothy Martin helped with study design, study installation, data analysis, and writing the manuscript. Carlos Gonzalez-Benecke helped with study installation, data analysis, and interpreting results. Eric J. Jokela helped with study design and writing the manuscript. Wendell P. Cropper assisted with data analysis and editing the manuscript. Eric J. Ward helped with data processing and writing the manuscript.

Conflicts of Interest

The authors declare no conflict of interest.

Abbreviations

The following abbreviations are used in this manuscript:
CO2
Carbon Dioxide
PPM
Parts per million
D
Vapor Pressure Deficit (kPa)
U.S.
Unites States
LAI
Leaf Area Index
C
Control Treatment
TR
Throughfall reduction treatment
F
Fertilizer application Treatment
TR+F
Throughfall reduction + fertilizer application treatment
As
Sapwood Area
DBH
Diameter at breast height (1.37m)
PPFD
Photosynthetic photon flux density
TIG
Tungsten inert gas
θ0–20
Volumetric water content of 0–20cm soil horizon
θ0–30
Volumetric water content of 0–30 cm soil horizon
θ0–60
Volumetric water content of 0–60cm soil horizon
θ0–84
Volumetric water content of 0–84cm soil horizon
θ30–60
Volumetric water content of 30–60cm soil horizon
θ60–84
Volumetric water content of 60–84cm soil horizon
ANPP
Aboveground net primary productivity
BAG
Basal area growth
ΔT
Temperature difference
ΔTm
Maximum temperature difference
JS
Sap flux density (JS, g∙m−2∙s−1)
ECOR
Corrected transpiration estimates
E20
Uncorrected transpiration estimates from outer 20mm of sapwood
EMax
Maximum daily transpiration
EDay
Daily transpiration rate
EMonth
Monthly transpiration rate
EYear
Yearly transpiration rate
GC
Canopy stomatal conductance
GCref
Maximum canopy stomatal conductance in mmol∙m−2∙s−1 at vapor pressure Deficit = 1 kPa
δ
The slope of the boundary line of the relationship between canopy stomatal conductance and the natural logarithm of vapor pressure deficit
3-PG
Physiological Principles in Predicting Growth model
MaxCond
Maximum canopy stomatal conductance in m∙s−1 at vapor pressure deficit = 0 kPa
CoeffCond
Defines stomatal response to vapor pressure deficit in mb−1
KS
Whole-tree hydraulic conductance
ΨL
Leaf water potential

References

  1. Siegenthaler, U.; Stocker, T.F.; Monnin, E.; Lüthi, D.; Schwander, J.; Stauffer, B.; Raynaud, D.; Barnola, J.-M.; Fischer, H.; Masson-Delmotte, V.; et al. Stable carbon cycle–climate relationship during the late pleistocene. Science 2005, 310, 1313–1317. [Google Scholar] [CrossRef] [PubMed] [Green Version]
  2. Bala, G. Digesting 400 ppm for global mean CO2 concentration. Curr. Sci. 2013, 104, 47–48. [Google Scholar]
  3. Kunkel, K.E.; Stevens, L.E.; Stevens, S.E.; Sun, L.; Janssen, E.; Wuebbles, D.; Konrad, C.E.; Fuhrman, C.M.; Keim, B.D.; Kruk, M.C.; et al. Regional climate trends and Scenarios for the U.S. national climate assessment; Climate of the Southeast U.S.; NOAA Technical Report NESDIS 142-2; NOAA National Climatic Data Center: Asheville, NC, USA, 2013; p. 94.
  4. Schultz, R.P. Loblolly Pine: The ecology and Culture of Loblolly Pine (Pinus taeda L.); USDA Agric. Handb.713; U.S. Government Publishing Office: Washington, DC, USA, 1997.
  5. McKeand, S.; Mullin, T.; Byram, T.; White, T. Deployment of genetically improved loblolly and slash pines in the south. J. For. 2003, 101, 32–37. [Google Scholar]
  6. Smith, W.B.; Miles, P.B.; Perry, C.H.; Pugh, S.A. Forest Resources of the United States, 2007; General Technical Report WO-78; USDA Forest Service: Washington, DC, USA, 2009; p. 336.
  7. Han, F.X.; Plodinec, M.J.; Su, Y.; Monts, D.L.; Li, Z. Terrestrial carbon pools in southeast and south-central United States. Clim. Change 2007, 84, 191–202. [Google Scholar] [CrossRef]
  8. Anderson, C.J.; Lockaby, B.G. The effectiveness of forestry best management practices for sediment control in the southeastern United States: A literature review. South. J. Appl. For. 2011, 35, 170–177. [Google Scholar]
  9. McLaughlin, D.L.; Kaplan, D.A.; Cohen, M.J. Managing forests for increased regional water yield in the southeastern U.S. Coastal Plain. J. Am. Water Resour. Assoc. 2013, 49, 953–965. [Google Scholar] [CrossRef]
  10. Wear, D.N.; Greis, J.G. Southern Forest Resource Assessment: Summary Report; General Technical Report SRS-54; USDA Forest Service Southern Research Station: Asheville, NC, USA, 2002; p. 103.
  11. Fox, T.R.; Jokela, E.J.; Allen, H.L. The Development of Pine Plantation Silviculture in the Southern United States. J. For. 2007, 105, 337–347. [Google Scholar]
  12. Albaugh, T.J.; Allen, H.L.; Dougherty, P.M.; Kress, L.W.; King, J.S. Leaf area and above- and belowground growth responses of loblolly pine to nutrient and water additions. For. Sci. 1998, 44, 317–328. [Google Scholar]
  13. Jokela, E.J.; Martin, T.A.; Vogel, J.G. Twenty-five years of intensive forest management with southern pines: important lessons learned. J. For. 2010, 108, 338–347. [Google Scholar]
  14. Ewers, B.E.; Oren, R.; Albaugh, T.J.; Dougherty, P.M. Carry-over effects of water and nutrient supply on water use of Pinus taeda. Ecol. Appl. 1999, 9, 513–525. [Google Scholar] [CrossRef]
  15. Ewers, B.E.; Oren, R.; Sperry, J.S. Influence of nutrient versus water supply on hydraulic architecture and water balance in Pinus taeda. Plant Cell Environ. 2000, 23, 1055–1066. [Google Scholar] [CrossRef]
  16. Samuelson, L.J.; Farris, M.G.; Stokes, T.A.; Coleman, M.D. Fertilization but not irrigation influences hydraulic traits in plantation-grown loblolly pine. For. Ecol. Manag. 2008, 255, 3331–3339. [Google Scholar] [CrossRef]
  17. Sun, G.; Arumugam, S.; Caldwell, P.V.; Conrads, P.A.; Covich, A.P.; Cruise, J.; Feldt, J.; Georgakakos, A.P.; McNider, R.T.; McNulty, S.G.; et al. Impacts of climate change and variability on water resources in the Southeast USA. In Climate of the Southeast United States: Variability, Change, Impacts, and Vulnerability; Ingram, K.T., Dow, K., Carter, L., Anderson, J., Eds.; Island Press: Washington, DC, USA, 2013; pp. 210–236. [Google Scholar]
  18. Roth, B.E.; Jokela, E.J.; Martin, T.A.; Huber, D.A.; White, T.L. Genotype × environment interactions in selected loblolly and slash pine plantations in the Southeastern United States. For. Ecol. Manag. 2007, 238, 175–188. [Google Scholar] [CrossRef]
  19. Gonzalez-Benecke, C.A.; Martin, T.A. Water availability and genetic effects on water relations of loblolly pine (Pinus taeda) stands. Tree Physiol. 2010, 30, 376–392. [Google Scholar] [CrossRef] [PubMed]
  20. Aspinwall, M.J.; King, J.S.; Domec, J.-C.; McKeand, S.E.; Isik, F. Genetic effects on transpiration, canopy conductance, stomatal sensitivity to vapour pressure deficit, and cavitation resistance in loblolly pine. Ecohydrology 2011, 4, 168–182. [Google Scholar] [CrossRef]
  21. Tang, Z.; Sayer, M.A.S.; Chambers, J.L.; Barnett, J.P. Interactive effects of fertilization and throughfall exclusion on the physiological responses and whole-tree carbon uptake of mature loblolly pine. Can. J. Bot. 2004, 82, 850–861. [Google Scholar] [CrossRef]
  22. Will, R.E.; Fox, T.; Akers, M.; Domec, J.-C.; Gonzalez-Benecke, C.; Jokela, E.; Kane, M.; Laviner, A.; Lokuta, G.; Markewitz, D.; et al. A range-wide experiment to investigate nutrient and soil moisture interactions in loblolly pine plantations. Forests 2015, 6, 2014–2028. [Google Scholar] [CrossRef]
  23. Soil Survey Staff, Natural Resources Conservation Service, United States Department of Agriculture. Web Soil Survey. Available online: http://websoilsurvey.nrcs.usda.gov/ (accessed on 21 January 2012).
  24. Karl, T.R.; Melillo, J.M.; Peterson, T.C. Global Climate Change Impacts in the United States; Cambridge University Press: New York, NY, USA, 2009; p. 188. [Google Scholar]
  25. Topp, G.C.; Davis, J.L.; Annan, A.P. Electromagnetic determination of soil water content: Measurements in coaxial transmission lines. Water Resour. Res. 1980, 16, 574–582. [Google Scholar] [CrossRef]
  26. Gee, G.W.; Bauder, J.W. Particle-size analysis. In Methods of Soil Analysis, 2nd ed.; Klute, A., Ed.; American Society of Agronomy: Madison, WI, USA, 1986; pp. 383–411. [Google Scholar]
  27. Martin, T.A.; Jokela, E.J. Developmental patterns and nutrition impact radiation use efficiency components in southern pine stands. Ecol. Appl. 2004, 14, 1839–1854. [Google Scholar] [CrossRef]
  28. Gonzalez-Benecke, C.A.; Gezan, S.A.; Albaugh, T.J.; Allen, H.L.; Burkhart, H.E.; Fox, T.R.; Jokela, E.J.; Maier, C.A.; Martin, T.A.; Rubilar, R.A.; Samuelson, L.J. Local and general above-stump biomass functions for loblolly pine and slash pine trees. For. Ecol. Manag. 2014, 334, 254–276. [Google Scholar] [CrossRef]
  29. Granier, A. Une nouvelle méthode pour la mesure du flux de sève brute dans le tronc des arbres. Ann. Sci. For. 1985, 42, 193–200. [Google Scholar] [CrossRef]
  30. Granier, A. Evaluation of transpiration in a Douglas-fir stand by means of sap flow measurements. Tree Physiol. 1987, 3, 309–320. [Google Scholar] [CrossRef] [PubMed]
  31. Clearwater, M.J.; Meinzer, F.C.; Andrade, J.L.; Goldstein, G.; Holbrook, N.M. Potential errors in measurement of nonuniform sap flow using heat dissipation probes. Tree Physiol. 1999, 19, 681–687. [Google Scholar] [CrossRef] [PubMed]
  32. Čermák, J.; Kučera, J.; Nadezhdina, N. Sap flow measurements with some thermodynamic methods, flow integration within trees and scaling up from sample trees to entire forest stands. Trees 2004, 18, 529–546. [Google Scholar] [CrossRef]
  33. Samuelson, L.J.; Stokes, T.A.; Coleman, M.D. Influence of irrigation and fertilization on transpiration and hydraulic properties of Populus deltoides. Tree Physiol. 2007, 27, 765–774. [Google Scholar] [CrossRef] [PubMed]
  34. Ewers, B.E.; Oren, R. Analyses of assumptions and errors in the calculation of stomatal conductance from sap flux measurements. Tree Physiol. 2000, 20, 579–589. [Google Scholar] [CrossRef] [PubMed]
  35. Ewers, B.E.; Oren, R.; Johnsen, K.H.; Landsberg, J.J. Estimating maximum mean canopy stomatal conductance for use in models. Can. J. For. Res. 2001, 31, 198–207. [Google Scholar] [CrossRef]
  36. Landsberg, J.J.; Waring, R.H. A generalized model of forest productivity using simplified concepts of radiation-use efficiency, carbon balance and partitioning. For. Ecol. Manag. 1997, 95, 209–228. [Google Scholar] [CrossRef]
  37. Gonzalez-Benecke, C.A.; Jokela, E.J.; Cropper, W.P.; Bracho, R.; Leduc, D.J. Parameterization of the 3-PG model for Pinus elliottii stands using alternative methods to estimate fertility rating, biomass partitioning and canopy closure. For. Ecol. Manag. 2014, 327, 55–75. [Google Scholar] [CrossRef]
  38. Wullschleger, S.D.; Meinzer, F.C.; Vertessy, R.A. A review of whole-plant water use studies in tree. Tree Physiol. 1998, 18, 499–512. [Google Scholar] [CrossRef] [PubMed]
  39. National Oceanic & Atmospheric Administration (NOAA). Monthly Summaries of the Global Historical Climatology Network-Daily (GHCN-D) Subset: USC00087025; NOAA National Climatic Data Center: Asheville, NC, USA, 2014.
  40. Gonzalez-Benecke, C.A.; Martin, T.A.; Wendell, C.P. Whole-tree water relations of co-occurring mature Pinus palustris and Pinus elliottii var. elliottii. Can. J. For. Res. 2011, 41, 509–523. [Google Scholar] [CrossRef]
  41. McCarthy, J.W.; Stone, E.L. Changes in soil water tables following phosphorus fertilization of young slash pine. Soil Sci. Soc. Am. J. 1991, 55, 1440. [Google Scholar] [CrossRef]
  42. Teskey, R.O.; Gholz, H.L.; Cropper, W.P. Influence of climate and fertilization on net photosynthesis of mature slash pine. Tree Physiol. 1994, 14, 1215–1227. [Google Scholar] [CrossRef] [PubMed]
  43. Gholz, H.L.; Clark, K.L. Energy exchange across a chronosequence of slash pine forests in Florida. Agric. For. Meteorol. 2002, 112, 87–102. [Google Scholar] [CrossRef]
  44. Powell, T.L.; Gholz, H.L.; Clark, K.L.; Starr, G.; Cropper, W.P.; Martin, T.A. Carbon exchange of a mature, naturally regenerated pine forest in north Florida. Glob. Change Biol. 2008, 14, 2523–2538. [Google Scholar] [CrossRef]
  45. Van Rees, K.C.J.; Comerford, N.B. Vertical root distribution and strontium uptake of a slash pine stand on a Florida Spodosol. Soil Sci. Soc. Am. J. 1986, 50, 1042. [Google Scholar] [CrossRef]
  46. Torreano, S.J.; Morris, L.A. Loblolly pine root growth and distribution under water stress. Soil Sci. Soc. Am. J. 1998, 62, 818. [Google Scholar] [CrossRef]
  47. Albaugh, T.J.; Allen, H.L.; Kress, L.W. Root and stem partitioning of Pinus taeda. Trees 2006, 20, 176–185. [Google Scholar] [CrossRef]
  48. Bracho, R.; Starr, G.; Gholz, H.L.; Martin, T.A.; Cropper, W.P.; Loescher, H.W. Controls on carbon dynamics by ecosystem structure and climate for southeastern U.S. slash pine plantations. Ecol. Monogr. 2012, 82, 101–128. [Google Scholar] [CrossRef]
  49. Domec, J.-C.; Noormets, A.; King, J.S.; Sun, G.; Mcnulty, S.G.; Gavazzi, M.J.; Boggs, J.L.; Treasure, E.A. Decoupling the influence of leaf and root hydraulic conductances on stomatal conductance and its sensitivity to vapour pressure deficit as soil dries in a drained loblolly pine plantation. Plant Cell Environ. 2009, 32, 980–991. [Google Scholar]
  50. Bartkowiak, S.M.; Samuelson, L.J.; McGuire, M.A.; Teskey, R.O. Fertilization increases sensitivity of canopy stomatal conductance and transpiration to throughfall reduction in an 8-year-old loblolly pine plantation. For. Ecol. Manag. 2015, 354, 87–96. [Google Scholar] [CrossRef]
  51. Teskey, R.O.; Bongarten, B.C.; Cregg, B.M.; Dougherty, P.M.; Hennessey, T.C. Physiology and genetics of tree growth response to moisture and temperature stress: An examination of the characteristics of loblolly pine (Pinus taeda L.). Tree Physiol. 1987, 3, 41–61. [Google Scholar] [CrossRef] [PubMed]
  52. Ward, E.J.; Domec, J.-C.; Laviner, M.A.; Fox, T.R.; Sun, G.; McNulty, S.; King, J.; Noormets, A. Fertilization intensifies drought stress: Water use and stomatal conductance of Pinus taeda in a midrotation fertilization and throughfall reduction experiment. For. Ecol. Manag. 2015, 355, 72–82. [Google Scholar] [CrossRef]
  53. Phillips, N.; Oren, R.; Zimmermann, R. Radial patterns of xylem sap flow in non-, diffuse- and ring-porous tree species. Plant Cell Environ. 1996, 19, 983–990. [Google Scholar] [CrossRef]
  54. Ford, C.R.; McGuire, M.A.; Mitchell, R.J.; Teskey, R.O. Assessing variation in the radial profile of sap flux density in Pinus species and its effect on daily water use. Tree Physiol. 2004, 24, 241–249. [Google Scholar] [CrossRef] [PubMed]
  55. Spicer, R.; Gartner, B.L. The effects of cambial age and position within the stem on specific conductivity in Douglas-fir (Pseudotsuga menziesii) sapwood. Trees 2001, 15, 222–229. [Google Scholar] [CrossRef]
  56. Domec, J.-C.; Pruyn, M.L.; Gartner, B.L. Axial and radial profiles in conductivities, water storage and native embolism in trunks of young and old-growth ponderosa pine trees. Plant Cell Environ. 2005, 28, 1103–1113. [Google Scholar]
  57. Mark, W.R.; Crews, D.L. Heat-pulse velocity and bordered pit condition in living Engelmann spruce and lodgepole pine trees. For. Sci. 1973, 19, 291–296. [Google Scholar]
  58. Sperry, J.S.; Perry, A.H.; Sullivan, J.E.M. Pit membrane degradation and air-embolism formation in ageing xylem vessels of Populus tremuloides Michx. J. Exp. Bot. 1991, 42, 1399–1406. [Google Scholar] [CrossRef]
  59. Dye, P.J.; Olbrich, B.W.; Poulter, A.G. The Influence of growth rings in Pinus patula on heat pulse velocity and sap flow measurement. J. Exp. Bot. 1991, 42, 867–870. [Google Scholar] [CrossRef]
  60. Jiménez, M.S.; Nadezhdina, N.; Čermák, J.; Morales, D. Radial variation in sap flow in five laurel forest tree species in Tenerife, Canary Islands. Tree Physiol. 2000, 20, 1149–1156. [Google Scholar] [CrossRef] [PubMed]
  61. Phillips, N.; Oren, R. intra- and inter-annual variation in transpiration of a pine forest. Ecol. Appl. 2001, 11, 385–396. [Google Scholar] [CrossRef]
  62. Samuelson, L.J.; Stokes, T.A. Transpiration and canopy stomatal conductance of 5-year-old loblolly pine in response to intensive management. For. Sci. 2006, 52, 313–323. [Google Scholar]
  63. Ewers, B.E.; Oren, R.; Phillips, N.; Strömgren, M.; Linder, S. Mean canopy stomatal conductance responses to water and nutrient availabilities in Picea abies and Pinus taeda. Tree Physiol. 2001, 21, 841–850. [Google Scholar] [CrossRef] [PubMed]
  64. Bryars, C.; Maier, C.; Zhao, D.; Kane, M.; Borders, B.; Will, R.; Teskey, R. Fixed physiological parameters in the 3-PG model produced accurate estimates of loblolly pine growth on sites in different geographic regions. For. Ecol. Manag. 2013, 289, 501–514. [Google Scholar] [CrossRef]
  65. Gonzalez-Benecke, C.A.; Teskey, R.O.; Martin, T.A.; Jokela, E.J.; Fox, T.R.; Kane, M.B.; Noormets, A. Regional validation and improved parameterization of the 3-PG model for Pinus taeda stands. For. Ecol. Manag. 2015, 36, 237–256. [Google Scholar] [CrossRef]
  66. Wilson, K.B.; Hanson, P.J.; Mulholland, P.J.; Baldocchi, D.D.; Wullschleger, S.D. A comparison of methods for determining forest evapotranspiration and its components: Sap-flow, soil water budget, eddy covariance and catchment water balance. Agric. For. Meteorol. 2001, 106, 153–168. [Google Scholar] [CrossRef]
Figure 1. Time series of water relations parameters, leaf area index, and meteorological data during 2013. (A) Total monthly transpiration rate by treatment; (B) Mean monthly daylight hour stomatal conductance by treatment; (C) Mean monthly LAI by treatment; (D) Mean daylight hour vapor pressure deficit (D), monthly mean total daily photosynthetic photon flux density (PPFD), and total monthly rainfall for 2013. Treatments include control (C), throughfall reduction (TR), fertilizer application (F), and throughfall reduction and fertilizer application (TR+F). Error bars represent ± 1 standard error.
Forests 07 00214 g001
Figure 2. Mean whole-tree hydraulic conductance (A) and predawn water potential (B) for each measurement date from October 2012 (Month = 10) to November 2013 (Month = 9) for control (C), throughfall reduction (TR), fertilizer application (F), and throughfall reduction and fertilizer application (TR+F) treatments. Error bars represent ± 1 standard error.
Forests 07 00214 g002
Figure 3. Sap flow rates at 2–4 cm and 4–6 cm depths expressed as a percentage of sap flow at 0–2 cm depth for control (C), throughfall reduction (TR), fertilizer application (F), and throughfall reduction and fertilizer application (TR+F) treatments. Percentage values shown above each bar; values followed by the same letter are not significantly different (p = 0.05). Whiskers represent + 1 standard error.
Forests 07 00214 g003
Table 1. Minimum, maximum, and mean DBH of sap flow measurement trees during the winter of 2012–2013 for the control (C), throughfall reduction (TR), fertilizer application (F), and throughfall reduction and fertilizer application (TR+F) treatments.
DBH (cm)
TreatmentMinimumMaximumMean
C1019.114.9
TR8.619.515.0
F9.619.314.8
TR+F919.615.3
Table 2. Mean aboveground net primary productivity (ANPP), basal area growth (BAG), projected leaf area index (LAI), and needlefall for control (C), throughfall reduction (TR), fertilizer application (F), and throughfall reduction and fertilizer application (TR+F) treatments with associated p values. Values for LAI represent monthly minimums and maximums within a given year. For the LAI time series data, there were no treatment by month interactions. For significant F×TR interactions, significantly different (p < 0.05) values are indicated by different small letters.
Treatmentp-Value
CTRFTR+FFTRF×TR
ANPP 2013 (Mg∙ha−1∙year−1)26.5 a28.1 ac32.3 b30.2 bc<0.0010.7360.049
BAG 2012 (m2∙ha−1∙year−1)4.24.05.04.70.0070.2300.789
BAG 2013 (m2∙ha−1∙year−1)3.43.54.33.90.0330.5760.314
LAI 2012 (Projected)2.0–3.41.9–3.31.9–3.61.9–3.70.0370.9380.308
LAI 2013 (Projected)2.3–3.62.3–3.62.7–4.12.7–4.2<0.0010.4520.478
Needlefall 2013 (Mg∙ha−1∙year−1) 5.55.66.46.6<0.0010.3830.536
Table 3. Water use and stomatal sensitivity to vapor pressure deficit reported as mean annual transpiration (EYear), maximum daily transpiration (EMax), sensitivity of stomatal conductance to vapor pressure deficit (-δ), stomatal conductance at vapor pressure deficit = 1 kPa (GCref), 3-PG parameter defining maximum stomatal conductance (MaxCond), and 3-PG parameter defining stomatal sensitivity to vapor pressure deficit (CoeffCond) for control (C), throughfall reduction (TR), fertilizer application (F), and throughfall reduction and fertilizer application (TR+F) treatments with associated p values.
Treatmentp Value
CTRFTR+FFTRFxTR
EYear (mm∙year−1)5355475965460.3490.5450.334
EMax (mm∙day−1)2.602.703.082.760.1250.5170.229
−δ (mmol∙m−2∙s−1∙ln(kPa)−1)81.3779.9377.5673.490.6350.6870.793
GCref (mmol∙m−2∙s−1)138.38139.9137.19126.20.5870.6630.573
MaxCond (m∙s−1)0.00650.00630.00600.00570.1780.6300.897
CoeffCond (mbar−1)0.0610.0580.0550.0630.9980.5020.130

