Abstract
Intimate mixtures of trembling aspen (Populus tremuloides Michx.) and white spruce (Picea glauca (Moench) Voss) are a key feature of western Canadian boreal forests. These mixtures have the potential to produce high yields of merchantable fibre and provide numerous ecological services. Achievement of this potential has been difficult, and often expensive, to realize as a regeneration goal in managed forests. We report 21 to 25 year results of managed mixtures on two study sites where the white spruce was planted, and the density of aspen natural regeneration manipulated within five years of the stand initiation disturbance. On both sites, white spruce mortality did not increase with increasing aspen density. While height and diameter growth of white spruce declined with increasing aspen density, the effect was not entirely consistent across the two sites. Abrasion from aspen branches was the most common source of damage to spruce crowns. Mixed stands had greater merchantable volume production than pure spruce stands based on model projections. Application of aspen harvest at year 60, while protecting the spruce component for a second harvest entry at year 90, was projected to optimize combined yield for the mixedwood stands.
1. Introduction
Mixtures of trembling aspen (Populus tremuloides Michx.) and white spruce (Picea glauca (Moench) Voss), are a prominent component of the boreal forest in Western Canada [1,2]. Mixedwood forests represent a range of early- to mid-seral successional stages [3] and develop most commonly on mesic and subhygric sites [4,5] where successional pathways are more variable than on dry or wet sites [6]. When aspen and white spruce regenerate at approximately the same time following disturbance, aspen will form an overstorey above spruce for at least 50–60 years. After that time, white spruce begins to grow through the canopy and aspen decreases in dominance and basal area. In the absence of fire, windstorms, harvesting, or other large-scale disturbance, the mixedwood stand may eventually become a spruce-dominated stand [3]. White spruce may also establish naturally in the understory of mature aspen stands when there is a local spruce seed source [7]. Light levels under fully-stocked boreal aspen stands reach minimum levels of 5% of full sunlight between 10 and 25 years after disturbance [8], but increase to 15% to 20% of full sunlight or higher at around age 40, which is adequate to allow establishment of white spruce [9,10].
Regenerating mixtures of trembling aspen and white spruce by design remains one of the most difficult challenges in the management of boreal mixedwood stands. Quantitative comparisons of mixed and pure-species stands growing under similar site conditions are limited [11]. Several studies demonstrate that aspen can reduce growth of overtopped white spruce when it is present at densities above about 1000 st ha−1 (stems per hectare) [12,13]. Studies also indicate that reducing aspen densities can increase light levels [10,12] and spruce growth [14,15,16]. Treatments which reduce competition from aspen and other broadleaved trees can provide substantial increases in growth of white spruce [17,18]. Reducing aspen densities by manual brushing or herbicide treatments can improve growing conditions for white spruce [16,18]. Studies in northern British Columbia and Alberta indicate that light levels underneath aspen canopies are related to the basal area of aspen [8,10]. Comeau et al. [10] suggest that maintaining total aspen basal area below 8 m2 ha−1 may provide near optimal light conditions for growth of white spruce.
Height growth of conifers is maintained until severe competition levels are reached, or competition remains at sufficient intensity for a period of time. Diameter growth is sacrificed to maintain height growth in response to competition [19]. As a result, HDR (the ratio of tree height to root collar diameter) increases in response to increases in level of competition [14,15,20,21]. For white spruce, HDR values exceeding 55 to 60 are considered to indicate stress [22]. In addition to competition, HDR is influenced by a range of factors, including variations in spring, summer and fall growing conditions, soil resource availability, and stem sway and bending [22].
Bokalo et al. [16] describe growth responses of both the aspen and spruce to precommercial thinning treatments that reduced aspen densities to different levels. This analysis indicated no significant effects of density on aspen size and no significant effect of aspen density on spruce height at year 9 (3 to 4 years after spacing). However, spruce root collar diameter (RCD) was significantly smaller in the unspaced compared to the spaced plots and HDR for white spruce increased with increasing aspen density.
There are a number of advantages to managing mixedwoods as such rather than attempting to convert them to pure white spruce or aspen stands. Managing for a mixedwood condition supports sustainable management objectives such as conserving biodiversity, protecting wildlife habitat, and preserving visual esthetics [23,24,25]. Long-term site productivity may also be enhanced by the presence of aspen, which takes up nutrients and retains them within the system [25,26]. The risk of attack by white pine weevil (Pissodes strobi Peck) [27,28] and risk of Armillaria root disease is lower in mixedwood than pure conifer stands [29,30].
Finally, overstory aspen is an effective nurse crop for understory spruce by moderating the rate of radiative heat loss from the ground to the night sky, and slowing the transfer of soil heat toward the ground surface [31], reducing the incidence of growing season frost and environmental extremes [32,33,34,35]. It also reduces the vigor of other competitors such as bluejoint reedgrass (Calamagrostis canadensis (Michx.) Beauv.) [34,36,37], which can serious impact spruce establishment.
In addition to the biological and yield advantages of mixtures, economic benefits can also be derived by managing mixedwoods which, historically, have been underutilized in favor of more valuable pure conifer stands. Mixedwoods are are a good source of high-quality fibre, markets for aspen are expanding, and they can potentially provide greater diversity of products than single-species stands [38]. White spruce can be expensive and difficult to establish in pure stands following disturbance [5,38], whereas mixedwoods may be easier to establish and may also produce higher quality spruce stems than those resulting from more open growing conditions [39,40]. Finally, overall yield from mixedwood stands may be higher than from single-species stands because of the physical, phenological, and successional differences in growth strategy that exist between aspen and white spruce [11,25,41,42]. Achievement of the potential for superior productivity and resilience to risk of mixed species stands requires a close spatial association of the species[43].
Despite substantial interest in mixedwood management, practical experience and long-term data on outcomes of different management practices in the western boreal forest are limited. The Siphon Creek and Bear Mountain studies were initiated in 1989 in response to an identified need for information on the effects of aspen density on spruce and aspen growth [44]. The objectives of the study were to: (1) test the effects of aspen density on white spruce size and growth, and on aspen growth and size; and (2) examine the potential yield implications for the development of pure and mixed stands. Our hypothesis was that spruce growth would be reduced with increasing aspen density, but that stand level biomass would be greater for some combinations of the two tree species.
2. Experimental Section
2.1. Site Descriptions
The study was conducted at Siphon Creek (120°19′ W, 56°27′ N) and Bear Mountain (120°20′ W, 55°39′ N) in northeastern British Columbia, 45 km northeast and 72 km southeast of Fort St. John, respectively. Both sites are within the “Moist Warm” variant of the Boreal White and Black Spruce biogeoclimatic zone (BWBSmw; [2]). This subzone is characterized by a mean annual temperature of 1.9 °C, mean annual precipitation of 515 mm, mean annual snowfall of 156 cm, an average of 157 frost-free days per year, and a frost-free period of 94 days (using 1971–2000 climate normals calculated using ClimateBC software [45]). Soils on both sites were developed on loamy to clayey morainal material. They are classified as Luvisols, characterized by a loamy textured A horizon over a clay-enriched B horizon [46]. Ecologically, the sites were very similar, comprising a fine-scale mosaic of the “Aspen—Rose—Creamy peavine” and “Aspen—Highbush cranberry—Oak fern” site series. Their soil moisture regimes were mesic to subhygric, with medium to rich nutrient regimes [2].
2.2. Pre-Treatment History
The Siphon Creek site originally supported a mixed conifer-aspen stand that had a history of selective conifer logging in 1968. As part of a conifer reforestation program, the residual stand (mostly aspen) was brush bladed and windrowed in the early winter of 1984/85. This site was planted (before study establishment) with three-year-old bareroot white spruce seedlings (PBR 2 + 1; syroblock plug transplants grown in the styroblock for 2 years and in a nursery bed for 1 year) at 1480 st ha−1 (stems ha−1) in May 1985. The Bear Mountain site was logged for aspen in the winter of 1987/1988 and received no further treatment before study establishment. Additional details can be found in Kabzems et al. [44].
2.3. Study Design and Experimental Treatments
In 1990, the aspen regeneration on both sites was thinned to densities of 0, 5000, and 10,000 st ha−1. To expand the range of aspen densities found within the experimental treatments, two additional aspen treatments (1000 and 2000 st ha−1) were created in the summer of 2000 by reducing existing densities in a randomly selected subset of plots initially designated as 5000 (1 plot reduced to 1000 st ha−1, and two plots reduced to 2000 st ha−1) or 10,000 st ha−1 (two plots reduced to 1000 st ha−1 and one plot reduced to 2000 st ha−1) at each location. At both locations, aspen was manually thinned to the target densities. In addition, all other tree and tall shrub species were removed at the initial thinning in 1990 and during subsequent tending between 1990 and 1996 to maintain treatment densities.
At both locations, within each treatment plot (0.3 ha), four subplots of 0.04 ha were established for repeated measurement of sample trees. At Bear Mountain, only one subplot in each plot was planted with one-year-old containerized (CT) PSB 313 (seedlings grown in styroblock containers, with individual cells nominally 3 cm in diameter and 13 cm in depth) white spruce seedlings in 1989. During the summers of 1990 and 1991, all remaining subplots were planted with the same CT spruce stock type. A record of the planting year for spruce within individual subplots was not available for the Bear Mountain site. All Bear Mountain CT spruce were planted using planting shovels into microsites that had been screefed using a Hawke power scarifier. Initially the Bear Mountain site was planted at seven different spruce densities, 0, 500, 700, 900, 1100, 1300 or 1500 st ha−1. Due to hare damage and mortality, the spruce planting densities could not be maintained. However, there were at least 20 planted spruce within each 0.04 ha subplot when established.
At Siphon Creek, the PBR spruce planted in 1985 were located in all four subplots. In 1993, two plots were abandoned because of incomplete aspen regeneration. Two additional plots containing vigorous aspen which had been planted with the PBR spruce in 1985 were then added to the trial to retain the original number of plots in the study design.
2.4. Aspen and Spruce Height and Diameter Measurements
At the establishment of the experiment, 20 spruce trees and 20 aspen trees within each subplot were tagged and then used for repeated measurements. The sample trees were spaced over the 0.04 ha subplot. The initial tree selection protocol was not documented; however, sampled aspen trees had a range in heights and diameters in 2002. Measurements occurred in 1993, 1997, 1999, 2002 and 2010 at Bear Mountain and in 1993, 1996, 1998, 2002 and 2010 at Siphon Creek. At each measurement, trees were assessed for total height, height to base of live crown, groundline diameter (only spruce), leader length (only spruce), type and cause of damage. In 2010, diameter was only measured at breast height (1.3 m) for spruce.
In September 2011, basal area was assessed at both study sites using one basal area determination ( prism BAF factor 4) at the center of each subplot.
2.5. Statistical Methods
Mixed Model Anova
Analysis of variance (ANOVA) was used to test whether or not there was a treatment (thinning) effect on aspen and spruce at each location using the SAS Proc Mixed procedure (SAS Institute, Cary, NC, USA). If significant (p < 0.10) differences were detected, Tukey’s multiple comparisons for differences in treatments were used to group similar treatment densities.
The data used in the mixed model ANOVA was collected in 2010, 10 years after the secondary thinning treatments. This measurement assumes that there was sufficient time to reflect growth conditions of the treatment densities. Analysis was based on plot means. The plot mean was an average of the four subplot means which represented the four largest diameter trees in each subplot for both aspen and white spruce. Top-height and top-DBH refer to the average height of the four largest dbh trees in a subplot and does not imply the traditional definition of “top height”.
The response variables tested included mean height (HT), mean diameter at breast height (DBH), mean height increment (HTI) and mean height to DBH ratio (H/DBH) of the four largest diameter trees. Two separate analyses were completed for Siphon Creek and Bear Mountain because of differences in treatments.
The statistical model for both aspen and spruce was as follows:
where Yij is the response; µ is the overall mean; Ploti is the random effect of ith plot; Awj is the fixed effect of the jth aspen treatment; εij is the residual. The ANOVA assumptions of normality of residual and the homogeneity of variances between treatments were confirmed.
2.6. Mortality
Mortality was represented as the ratio of the tree count of tagged trees from the final measurement (2010) to the tree count of tagged trees from the first measurement (1993) expressed as percentage of periodic (total mortality over 17 years) and percentage of annual mortality. To test for an aspen treatment effect, the Kruskal-Wallis test was performed using SAS Proc NPAR1WAY (SAS Institute, Cary, NC, USA). This non-parametric test was chosen over an ANOVA because the data violated the assumption of normality and homogeneity of variances between treatments.
2.7. Analysis of Basal Area
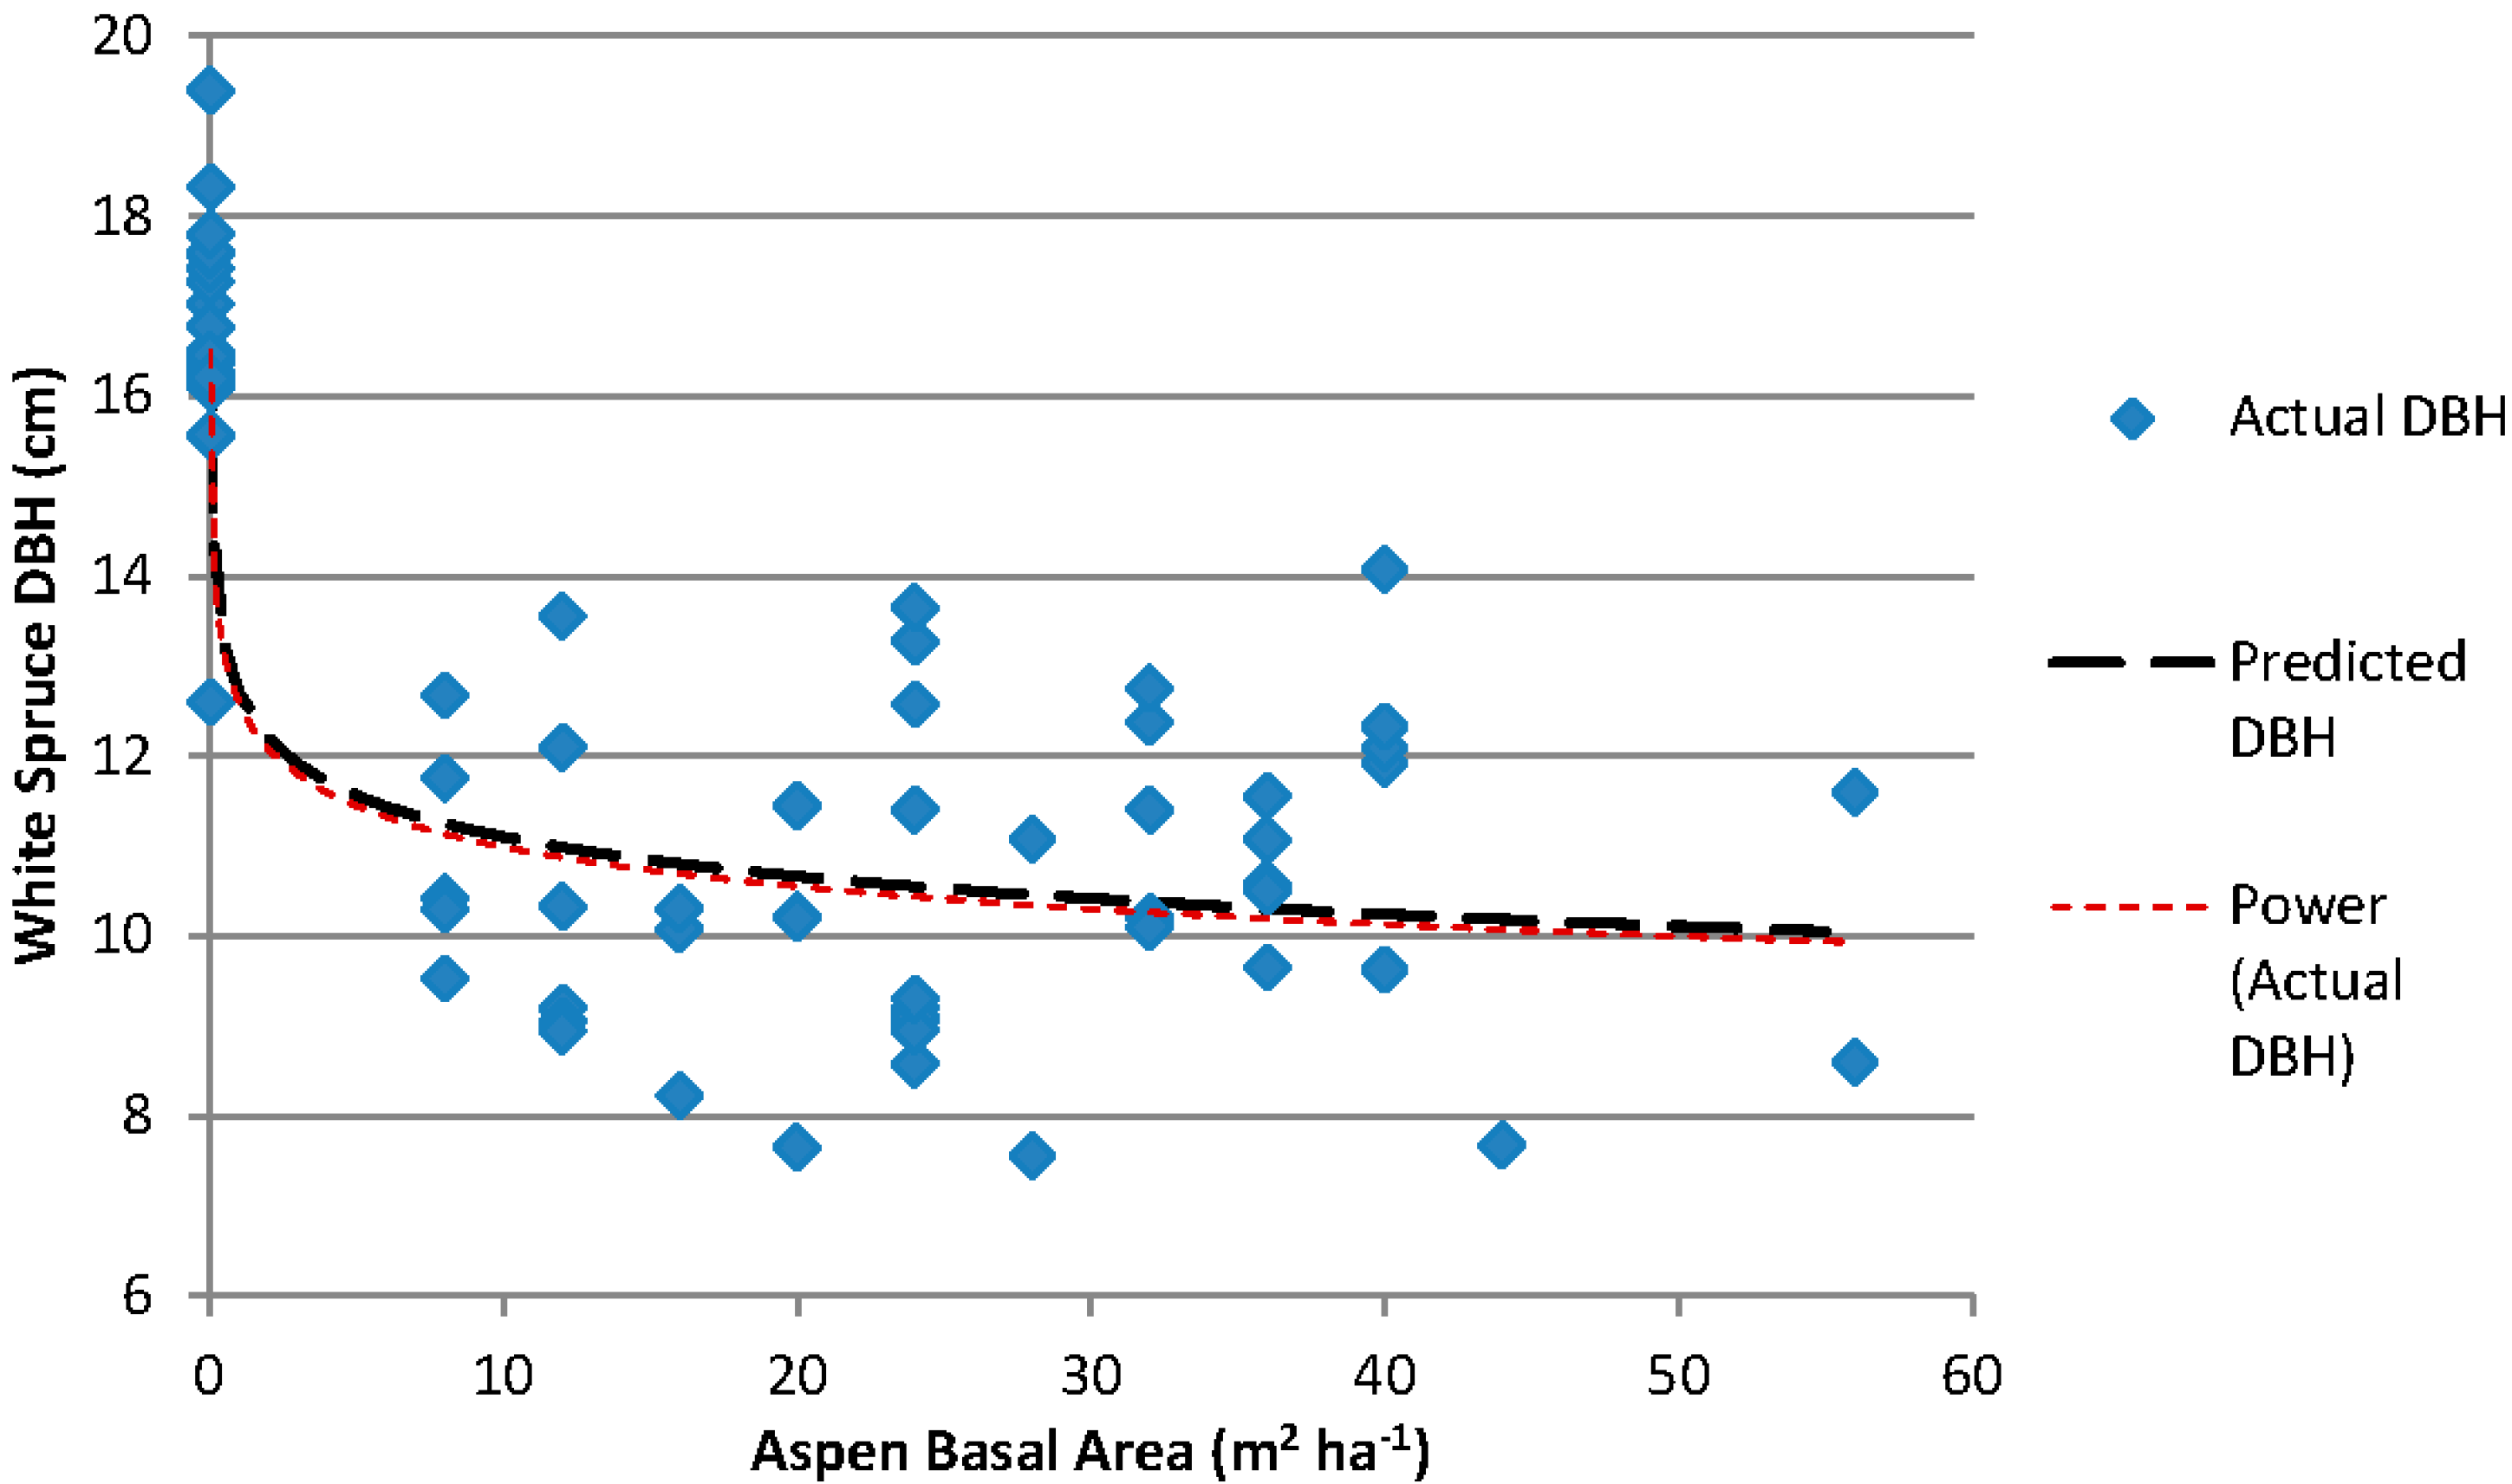
The actual aspen basal area for each subplot in Siphon Creek was assessed in 2011 using a basal area factor 4 prism. The subplot white spruce top-DBH, average of the four thickest DBH stems, was plotted against the actual aspen basal areas to graphically illustrate the relationship between the basal area and subplot top-DBH. The nature and strength of the relationship was then explored using non-linear regression. Data analysis was completed using SAS 9.4 (SAS Institute, Cary, NC, USA). Several non-linear models were tested and the non-linear power function performed the best. The model form was:
where is the top-DBH (cm), is the estimated aspen basal area in m2, and are estimated coefficients. In the power function the coefficient is a scaling factor that moves the function up or down depending on the value of . The exponent determines the rate of growth or decay for the function and the shape of the function. Different models were evaluated based on the pseudo-R2 and the RMSE.
2.8. Siphon Creek Long Term Projections:
Long term yield predictions representing a range of different combinations of aspen and spruce densities from the Siphon Creek installation were made using the Mixedwood Growth Model (MGM) [47,48]). The Siphon Creek installation was used because aspen regeneration and spruce planting occurred in the first growing season after disturbance which corresponds to recommended operational mixedwood practices. The Mixedwood Growth Model (The Mixedwood Growth Model referenced in this manuscript relates to MGM2010.xls and its supporting MGM HelpWeb documentation available online [47]) is a deterministic, distance-independent, individual tree growth model developed by the University of Alberta for the western Canadian boreal forest. MGM is designed to model simple or complex multi-species, multi-cohort stands of trembling aspen, white spruce, lodgepole pine and their mixtures. Height and diameter growth of individual trees are predicted using regional site index curves, allometric allocation functions, and empirically derived competition functions that account for the effects of competition from overtopping trees.
The long term projections involved initializing MGM with a tree list representing the last plot measurement (2010). The tree list inputs included species, diameter at breast height, total height, and breast height age and corresponding tree expansion factor. Since the sample design recorded a fixed number of trees per plot, plot size and associated tree expansion factors varied by treatment density. To estimate the effective plot size, the tree spacing and associated plot sizes were estimated from the treatment density classes.
This final measurement was chosen as it removed the need to model early effects of competition on growth and mortality which are difficult to represent. This measurement also provided the best estimate of site index. The site indices for aspen and spruce were estimated using the average height of the top trees from all treatments and Site Tools v 3.3 [49]. Site index was 22.5 (m @ 50 years) for aspen and 22 (m @ 50 years) for white spruce at Siphon Creek. The tree growth within each subplot was simulated to age 90 using the lower foothills sub-regional site index equations [50,51] and sub-regional volume equations [52]. Merchantability criteria were: stump height of 0.3 m, minimum stump diameter of 15 cm and a minimum top diameter of 10 cm. Mortality adjustment (MAFLAG) was set to true which imposed a maximum stand basal area limit [47]. A gap loss factor of 20% was used as an estimate of the average unproductive stand area [53]. Stands were simulated using spruce densities of 500 and 1300 st ha−1. The long term effect of early treatments on yield (volume m3 ha−1) for the resulting aspen-spruce mixtures was contrasted at ages 60 and 90.
2.9. Understory Protection Simulation
The plots used for the long term projections were also selected to demonstrate the potential future yields that could be attained if understory protection harvesting was used at Siphon Creek. As in the previous projections, the last plot measurement (2010) was used to initialize MGM. Each subplot was first projected to age 60 using the same site index and model parameterization as above. At age 60, understory protection harvesting was simulated following a strip harvesting pattern (6 m wide extraction area, 6 m wide machine corridor, 6 m extraction area, 3 m residual strip) as suggested by Grover et al. [54]. For any given area, the pattern results in an approximately 57% extraction area, 29% in machine corridor and 14% in residual strips. At age 60, each subplot was harvested as either extraction area (only mature aspen were harvested) and machine corridor (all trees were removed and regenerated to aspen at 9267 st ha−1 [54] using the average top height at age 25 obtained from the actual plot data). The residual strip was left unharvested. Each subplot was then projected further to age 90 and clearcut harvested. Total understory protection harvested yields of each treatment at age 60 and 90 were represented as the average of the four subplots weighted by their respective relative area; extraction 57%, machine corridor 25% and residual 14%. These yields were contrasted against the deciduous and coniferous yields from age 60 and 90 clearcut harvest simulations.
3. Results
3.1. Spruce Growth as Affected by Aspen Density
Mean mortality of tagged white spruce seedlings from 1993 to 2010 ranged from 15.2% to 32.2% at Bear Mountain and 0.8% to 4.1% at Siphon Creek (Table 1). The chi-square values (not shown) from Kruskal-Wallis test were not significant (p > 0.05) indicating that aspen density did not affect spruce mortality.

Table 1.
Mortality for aspen and spruce over the measurement period (1993 to 2012).
| Aspen Treatment (st ha−1) | Number of Plots | Mean and Standard Deviation (below) for Aspen Periodic Morality (%) | Mean and Standard Deviation (below) for Spruce Periodic Mortality (%) | ||
|---|---|---|---|---|---|
| Bear Mountain | Siphon Creek | Bear Mountain | Siphon Creek | ||
| 0 | 6 | - | - | 15.2 | 2.5 |
| (13.6) | (3.6) | ||||
| 1000 | 3 | 7.5 | 5.4 | 30.0 | 1.3 |
| (5.8) | (5.8) | (23.5) | (3.1) | ||
| 2000 | 3 | 2.5 | 10.4 | 14.6 | 2.5 |
| (4.0) | (11.8) | (9.4) | (4.5) | ||
| 5000 | 4 | 2.5 | 8.3 | 28.3 | 0.8 |
| (3.2) | (8.1) | (22.6) | (1.9) | ||
| 10,000 | 4 | 4.7 | 7.2 | 32.2 | 4.1 |
| (6.4) | (10.2) | (20.3) | (6.6) | ||
White spruce grown without aspen had an average height of 9.9 m at Siphon Creek, which was not significantly greater than the 1000 st ha−1 treatment height of 9.1 m (Table 2). Spruce growing under aspen densities of 5000 st ha−1, 10,000 st ha−1 and 2000 st ha−1 all had significantly lower heights than the 0 aspen treatment.
Table 2.
Mean white spruce height, diameter, height/diameter ratio and eight year height increment (2002 measurement to 2010 measurement) at Siphon Creek (25 years old) and Bear Mountain (21 years old) for the four largest diameter spruce in each sub-plot.
| Aspen Density (st ha−1) | Siphon Creek | Bear Mountain | ||||||
|---|---|---|---|---|---|---|---|---|
| Height (m) | Diameter at 1.3 m (cm) | H/DBH | Mean Eight Year Height Increment (m year−1) | Height (m) | Diameter at 1.3 m (cm) | H/DBH | Mean Eight Year Height Increment (m year−1) | |
| 0 | 9.9 a * | 16.7 a | 60 a | 0.48 a | 7.0 a | 14.6 a | 48 a | 0.43 a |
| 1000 | 9.1 ab | 11.5 b | 80 b | 0.44 ab | 4.2 bc | 5.9 bc | 73 ab | 0.27 bc |
| 2000 | 8.2 b | 10.0 b | 82 b | 0.39 bc | 4.8 b | 6.9 b | 70 a | 0.29 b |
| 5000 | 8.8 b | 11.4 b | 78 b | 0.41bc | 3.1 bc | 3.6 c | 106 ab | 0.18 cd |
| 10,000 | 8.3 b | 9.9 b | 84 b | 0.36 c | 2.7 c | 2.6 c | 151 b | 0.15 d |
* values in columns followed by different letters are significantly different (p < 0.1).
Twenty-one years after initial planting of white spruce at Bear Mountain, spruce within the 0 aspen treatment had an average height of 7.0 m, which was significantly greater than any of the treatments which retained aspen (Table 2). Spruce height at Bear Mountain generally decreased with increasing aspen density, where the 10,000 aspen st ha−1 treatment was significantly lower than the 1000 and 2000 st ha−1 treatments (Table 2).
Mean white spruce height increments between 2002 and 2010 followed a similar pattern to 2010 spruce height at Siphon Creek and Bear Mountain. Siphon Creek spruce grown without aspen averaged 0.48 m which was significantly greater than all treatments which retained aspen except for the 1000 aspen st ha−1 treatment (Table 2). At Bear Mountain, the 0 aspen treatment (0.43 m) was significantly greater than all treatments which retained aspen (Table 2). The treatments which retained aspen at Bear Mountain formed two groups, the 1000 and 2000 st ha−1 treatments (0.27 to 0.29 m), which had greater height increments than the higher aspen density treatments (0.18 to 0.15 m, Table 2).
White spruce diameters within the 0 aspen treatments were significantly greater at both the Siphon Creek (p < 0.1) and Bear Mountain (p < 0.1) sites than treatments which retained aspen. At Siphon Creek, there were no significant differences in white spruce diameter between any of the treatments which retained aspen (Table 2). At Bear Mountain, the white spruce separated into two diameter size groups, the 2000 and 1000 st ha−1 treatments (6.9 to 5.9 cm), and smaller diameters of the 5000 and 10,000 st ha−1 aspen treatments (3.6 to 2.6 cm, Table 2).
The white spruce at Siphon Creek within the 0 aspen treatment had an H/DBH of 60, which was significantly lower than any of the treatments which retained aspen. H/DBH ranged from 78 to 84 with the highest H/DBH in the 10,000 aspen st ha−1 treatment. The H/DBH of 48 for spruce in the 0 aspen treatment at Bear Mountain was only significantly different from the 10,000 st ha−1 treatment with a H/DBH of 151 (Table 2). The other aspen density treatments formed an intermediate group which were not statistically different from the two ends of the continuum.
For each subplot in the Siphon Creek study area, the top-dbh was plotted against the estimated aspen basal area (Figure 1). The non-linear power function was significant (p < 0.001, pseudo-R2 = 0.7779, RMSE = 1.608, n = 69). The model for this relationship is:
where is the estimated spruce top-dbh (cm) and is the estimated aspen basal area (m2 ha−1).
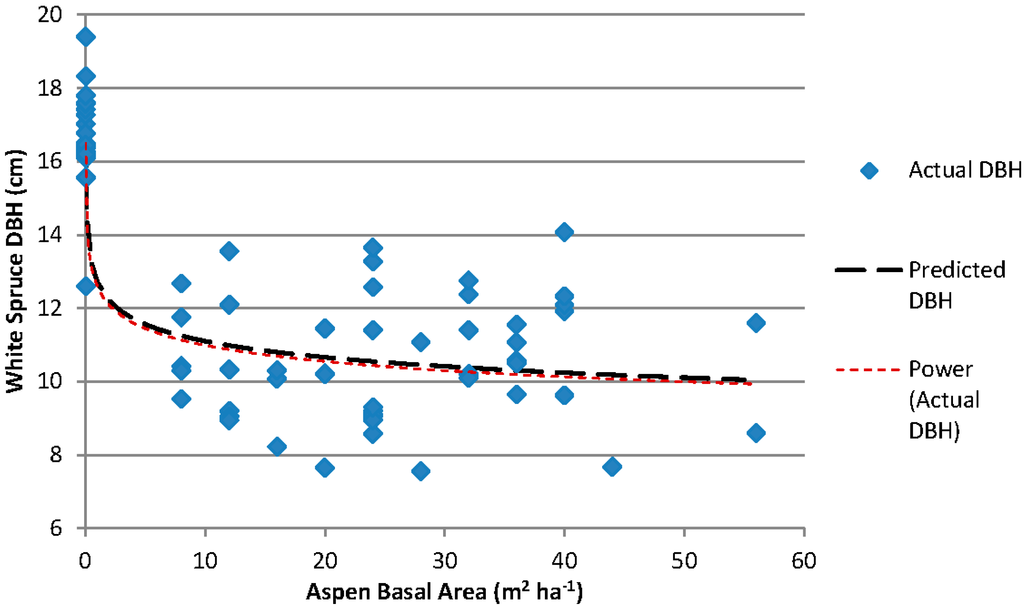
Figure 1.
Relationship between white spruce dbh (four largest diameter spruce in each subplot) and measured aspen basal area for the Siphon Creek study area. The model used for the relationship is Y = bXc.
Figure 1.
Relationship between white spruce dbh (four largest diameter spruce in each subplot) and measured aspen basal area for the Siphon Creek study area. The model used for the relationship is Y = bXc.
The most common forms of damage to white spruce at Siphon Creek in 2010 were due to whipping or abrasion from aspen branches (Table 3). Bending of the leader or foliage loss were the most common forms of damage to spruce attributed to aspen. Spruce leader loss or mortality due to whipping was less than 1% across all treatments.
Table 3.
Summary of damaging agents to white spruce and aspen at Siphon Creek in 2010.
| Aspen Density (st ha−1) | Spruce Abrasion Damage from Aspen (%) | Spruce Leader Weevil (%) | Spruce Adelgid Gall (%) | Spruce Top Dead or Damaged Unknown Source (%) | Aspen Physical Damage (%) | Hypoxylon Canker Present on Aspen (%) | Aspen Mortality Hypoxylon Canker (%) |
|---|---|---|---|---|---|---|---|
| 0 aspen | 0.2 | ||||||
| 1000 | 17.5 | 1.3 | 2.9 | 2.1 | 2.5 | ||
| 2000 | 17.0 | 0.4 | 0.4 | 0.4 | 4.6 | 7.9 | 3.8 |
| 5000 | 27.8 | 0.6 | 0.6 | 9.7 | 1.6 | 0.8 | |
| 10,000 | 25.7 | 1.3 | 0.6 | 2.5 | 2.8 | 1.3 |
3.2. Aspen Growth as Affected by Aspen Density
Mortality of tagged aspen stems from 1990 to 2010 ranged from 2.5% to 7.5% at Bear Mountain and 5.4% to 10.4% at Siphon Creek (Table 1). The chi-square values (not shown) from Kruskal-Wallis test were not significant (p > 0.05) indicating that aspen density did not affect aspen mortality.
Aspen height did not differ significantly (p = 0.17) among the aspen density treatments at Bear Mountain, or at Siphon Creek (p = 0.33). Mean height of aspen at Bear Mountain ranged from 10.9 m to 13.4 m and from 13.1 m to 13.9 m at Siphon Creek (Table 4).
Average annual aspen height increments ranged from 0.39 m year−1 to 0.52 m year−1 at Bear Mountain (Table 4) but were not significantly different (p = 0.87) between treatments. At Siphon Creek, annual aspen height increments ranged from 0.46 to 0.48 m year−1 (Table 4), and were not significantly different between treatments (p = 0.97).
Aspen diameters at both Bear Mountain and Siphon Creek demonstrate the pattern of largest diameters with the 1000 st ha−1 and smallest diameters in the 10,000 st ha−1 treatment. The 10,000 aspen st ha−1 treatment had significantly smaller diameters than the other three treatments at Siphon Creek. Differences between the other three aspen densities were not significant. At Bear Mountain, the greatest aspen diameter of 14.3 cm was in the 1000 st ha−1 treatment, and the smallest diameter of 12.3 cm was in the 10,000 st ha−1 treatment. The 1000 and 2000 aspen st ha−1 treatments had significantly greater diameters than the 10,000 st ha−1 aspen treatment (Table 4). Aspen H/DBH demonstrated the pattern of lowest ratios in the 1000 st ha−1 and highest ratios in the 10,000 st ha−1 treatment at both Bear Mountain and Siphon Creek (Table 4). At both sites, the 1000 st ha−1 aspen density had the lowest H/DBH (Table 4).
Table 4.
Mean aspen height, diameter, height/diameter and eight year height increment (2002 measurement to 2010 measurement) at Siphon Creek (25 years old) and Bear Mountain (22 years old) for the four largest diameter aspen in each subplot.
| Aspen Density (st ha−1) | Siphon Creek | Bear Mountain | ||||||
|---|---|---|---|---|---|---|---|---|
| Height (m) | Diameter at 1.3 m (cm) | H/DBH | Mean Eight Year Height Increment (m y−1) | Height (m) | Diameter at 1.3 m (cm) | H/DBH | Mean Eight Year Height Increment (m year−1) | |
| 1000 | 13.2 a* | 14.9 a | 89 a | 0.47 a | 10.9 a | 14.3 a | 77 a | 0.39 a |
| 2000 | 13.9 a | 15.0 a | 94 ab | 0.47 a | 12.2 a | 14.0 a | 87 ab | 0.47 a |
| 5000 | 13.7 a | 14.1 a | 98 b | 0.48 a | 13.4 a | 13.6 ab | 99 bc | 0.52 a |
| 10,000 | 13.1 a | 12.3 b | 108 c | 0.46 a | 11.8 a | 11.3 b | 105 c | 0.41 a |
* values in columns followed by different letters are significantly different (p < 0.1).
Aspen crown length at Siphon Creek ranged from 67% in the 5000 st ha −1 aspen treatment to 60% in the 10,000 aspen st ha−1 treatment in 2002. At the next measurement in 2010, aspen crown length ranged from 66% in the 1000 aspen st ha−1 treatment to 60% in the 10,000 aspen st ha−1 treatment.
Broken stems were the most common (2.5% to 9.7%) form of physical damage noted on aspen at Siphon Creek (Table 3). Hypoxylon canker (Hypoxylon mammatum (Wahl.)) was present on 1.6% to 7.9% of the aspen measured stems, and aspen mortality caused by Hypoxylon canker was noted on 1.3% to 3.8% of the aspen stems. There was no observable pattern between aspen damaging agents and the density of the aspen (Table 3).
3.3. Future Potential Yields of Aspen and Spruce Mixtures Using MGM Predictions
MGM projections of stand volumes for 60 and 90 year rotations (Table 5) demonstrate several principles for pure and mixed species stands. The proportion of deciduous in the total stand volume is greater in the 60 year rotation than in the 90 year rotation. Spruce volumes at both 60 and 90 year rotations decrease with increasing aspen density. Higher levels of spruce stocking at stand initiation increased the spruce volume in mixed stands. MGM projections of purely deciduous volumes from Siphon Creek plot data averaged 285 m3 ha−1 and had a maximum of 322 m3 ha−1 for a 60 year rotation (not shown), which was less volume than the mixed species stand projected from the same sample plot data. If only one harvest entry was used, the maximum total volume in the model projections at Siphon Creek came from the combination of 1300 st ha−1 spruce and 5000 st ha−1 aspen over a 90 year rotation (Table 5). Comparing the Mean Annual Increment (MAI) for 60 and 90, age 60 has consistently higher MAIs (>5.0 m3 ha−1 year−1) than age 90 due primarily to growth of the deciduous component (Table 5). At age 90, the MAIs are smaller (<5.0 m3 ha−1 year−1) than at age 60 and are driven primarily from the conifer component, with a shift from deciduous dominance at 60 to conifer dominance at 90.
Yields for a simulated understory protection (two stage harvest) where aspen was harvested at age 60 while protecting the spruce component of the mixedwood [54,55], followed by a complete harvest of the released spruce, and regenerated aspen at year 90 (Table 5) were also estimated using MGM. Combined yields of over 500 m3 ha−1 were predicted for the two most productive understory protection scenarios (Table 5). In mixed species stands, the maximum aspen contribution was predicted where 2000 to 5000 aspen st ha−1 were combined with 1300 spruce st ha−1 at stand initiation (Table 5). In contrast to the full removal harvests at age 60 or 90, the yields from understory protection are a composite of both maximum deciduous yield from age 60 and conifer yield at 90. Mean annual increment (MAI) projections from understory protection harvesting were over 5.0 m3 ha−1 year−1 and were comparable to the maximum MAIs from intimate mixtures of mixedwood at age 60.
Table 5.
Summary of MGM projections for 60 and 90 year rotations using a single entry harvest and a 90 year rotation with understory protection harvest for the Siphon Creek experimental plots. Understory protection volumes are the sums of harvest volume at age 60 plus volume harvested at age 90.
| Stand Age 60 Years | Spruce 500 st ha−1 | Spruce 1300 st ha−1 | ||||||
|---|---|---|---|---|---|---|---|---|
| Aspen density | Coniferous total volume | Deciduous total volume | Stand total volume | MAI | Coniferous total volume | Deciduous total volume | Stand total volume | MAI |
| (st ha−1) | (m3 ha−1) | (m3 ha−1) | (m3 ha−1) | (m3 ha−1) | (m3 ha−1) | (m3 ha−1) | (m3 ha−1) | (m3 ha−1) |
| 0 | 213 | 0 | 213 | 3.6 | 343 | 0 | 343 | 5.7 |
| 2000 | 84 | 263 | 346 | 5.8 | 175 | 161 | 335 | 5.6 |
| 5000 | 84 | 259 | 342 | 5.7 | 166 | 205 | 370 | 6.2 |
| 10,000 | 54 | 174 | 228 | 3.8 | 122 | 224 | 346 | 5.8 |
| Stand Age 90 Years | Spruce 500 st ha−1 | Spruce 1300 st ha−1 | ||||||
| Aspen density | Coniferous total volume | Deciduous total volume | Stand total volume | MAI | Coniferous total volume | Deciduous total volume | Stand total volume | MAI |
| (st ha−1) | (m3 ha−1) | (m3 ha−1) | (m3 ha−1) | (m3 ha−1) | (m3 ha−1) | (m3 ha−1) | (m3 ha−1) | (m3 ha−1) |
| 0 | 286 | 0 | 286 | 3.2 | 375 | 0 | 375 | 4.2 |
| 2000 | 215 | 157 | 372 | 4.1 | 345 | 70 | 415 | 4.6 |
| 5000 | 193 | 162 | 355 | 3.9 | 328 | 110 | 439 | 4.9 |
| 10,000 | 137 | 138 | 275 | 3.1 | 258 | 177 | 435 | 4.8 |
| Understory Protection Stand Age 90 years | Spruce 500 st ha−1 | Spruce 1300 st ha−1 | ||||||
| Aspen density | Coniferous total Volume | Deciduous total Volume | Stand total Volume | MAI | Coniferous total Volume | Deciduous total Volume | Stand total Volume | MAI |
| (st ha−1) | (m3 ha−1) | (m3 ha−1) | (m3 ha−1) | (m3 ha−1) | (m3 ha−1) | (m3 ha−1) | (m3 ha−1) | (m3 ha−1) |
| 2000 | 191 | 270 | 461 | 5.1 | 332 | 170 | 502 | 5.6 |
| 5000 | 173 | 268 | 440 | 4.9 | 313 | 214 | 527 | 5.9 |
| 10,000 | 121 | 191 | 313 | 3.5 | 255 | 240 | 494 | 5.5 |
4. Discussion
We originally hypothesized that higher rates of both aspen and white spruce mortality would be associated with higher aspen treatment densities. There was no evidence of suppression induced spruce mortality from the aspen densities created in this study. The site differences in spruce mortality probably reflect the far more competitive environment which existed when the spruce were planted at least two years post-harvest in a productive boreal mixedwood site at Bear Mountain. Microsite preparation using a powered scarifier likely created slightly depressed, poorly drained microsites which were less favourable for spruce than raw planting with an intact forest floor over an undisturbed soil horizon. Sample spruce trees were first marked at five years post disturbance at Siphon Creek, which means that some mortality could have occurred, but was not recorded, in the five year period between planting and initial assessment. In contrast, Bear Mountain spruce were tagged shortly after planting, so that all initial spruce mortality would be reflected in the experimental assessments. Thinning the aspen concurrently with spruce planting at Bear Mountain may have stimulated the cover of grasses and forbs to the detriment of the planted spruce [18]. In contrast, the initial thinning of the Siphon Creek aspen five years after planting would have benefitted the spruce with early shading of understory vegetation by the developing aspen crowns [36], caused by a reduction in light competition for the well established spruce when the aspen were thinned.
Aspen periodic mortality rates overlapped between the two sites. The aspen mortality rates were variable within site and treatment, and did not increase with increasing aspen density.
4.1. Did Aspen Density Have an Effect on Spruce Height and Diameter Growth? Were the Aspen Density Effects Consistent between the Two Sites?
Both the presence of aspen and increasing aspen density had negative effects on spruce height and diameter growth, consistent with other studies [16,18,56]. At Siphon Creek, significant differences in spruce height, DBH, and H/DBH were only seen between 0 aspen and those treatments which retained aspen. At Bear Mountain, in contrast, there were significant differences in spruce height, DBH, H/DBH, and mean eight-year height increments between different aspen densities, as well as the difference between 0 aspen and all the treatments which retained aspen.
At both study sites, there were no significant differences in spruce growth between the 5000 and 10,000 st ha−1 aspen densities. After a threshold value of 8 m2 ha−1 aspen basal area, spruce diameters did not indicate a clear trend in response to aspen basal area ranging from 8 to 56 m2 ha−1.
The H/DBH was lowest for the open grown white spruce at both sites. At Bear Mountain, the open grown spruce were not significantly different for H/DBH under 1000 to 5000 st ha−1 of aspen, even though the ratios ranged from 73 to 106 (Table 2). These results are consistent with numerous previous studies [14,15,16,21,22]. Interactions at the individual tree level strongly influence dynamics of these mixed species stands [57]. At Siphon Creek, there were no significant differences in H/DBH for white spruce under the treatments which retained aspen, and the range was relatively restricted (78 to 84). This suggests that the variation in aspen density at Bear Mountain created a stronger environmental gradient with a larger degree of internal variability compared to Siphon Creek. The average height growth of white spruce between the last two assessments also demonstrates that there was a stronger environmental gradient created by the aspen densities at Bear Mountain which influenced white spruce height growth. Another source of variability results from the fact that density does not represent competition effects as well as other variables such as basal area that incorporate both density and tree size [12].
At age 25, various types of damage to the white spruce were documented from the branches of the aspen canopy. The general outcome is for spruce crowns to be damaged by physical abrasion and leader whipping as they grow through the aspen canopy later in stand development [17,58]. With increasing physical abrasion and damage to the spruce by aspen branches, total spruce volume declines.
Reduction of spruce budworm and white pine weevil (Pissodes strobi Peck) are cited as benefits of growing spruce under an aspen canopy [28,59]. These insects were not identified as important damaging agents for spruce in pure stands at either Siphon Creek or Bear Mountain. Both of these agents occur in the general area, and are noted during regular pest surveys [60].
4.2. Did Aspen Density Have an Effect on Aspen Height and Diameter Growth?
At both sites, increasing aspen density had no effect on aspen height growth, consistent with the literature [16,61,62,63]. Aspen diameter was significantly smaller in the highest density aspen treatments at both sites consistent with results from several other studies [64,65,66,67]. For aspen at both sites, total basal area was not related to aspen height, diameter and H/DBH at the last measurement.
4.3. What Did the MGM Simulations Suggest Regarding Mixtures of Aspen and Spruce?
For both study sites, the highest merchantable yields were predicted to be achieved by a mixed species stand which had an aspen density of 2000 to 5000 st ha−1 created at year 5 or earlier by thinning of natural regeneration, and a spruce density of 1300 st ha−1 or greater at establishment. The complexity of mixed species silviculture requires knowledge of spatial and temporal growth dynamics of the species involved [68]; combined with stand structure, stand age and density [69]. Achievement of the yield potential on these study sites had three components: (1) planting of white spruce in the first growing season after disturbance; (2) early thinning of the aspen regeneration; and (3) an understory protection harvest of the aspen at 60 years, followed by 30 years of spruce growth before the final harvest.
Yield from boreal mixedwoods may be higher than from single-species stands because of the physical, phenological, and successional differences in growth strategy that exist between aspen and white spruce [11,25,41,42]. Shade tolerance differences between aspen and white spruce provide the ecological niche separation which creates the potential for greater productivity of mixed stands [43]. A stratified structure of 13 to 14 m tall aspen over 8 to 9 m tall spruce had formed 25 years after stand establishment at Siphon Creek. The combination of stratified structure and niche separation at Siphon Creek may account for the greater productivity of the aspen spruce mixture at this site compared to the 20 year old stands examined by Groot et al. [70] where no significant effect of species proportion on volume production was indicated.
This study illustrates the benefits of a thinning treatment to both aspen and spruce yields in a mixedwood. Dominant aspen were retained at both the initial (year 2 at Bear Mountain, year 5 at Siphon Creek) and the secondary thinning which created the 1000 and 2000 st ha−1 densities 12 to 15 years after stand initiation. Retained aspen benefitted from increased growing space at each stand entry. The white spruce benefitted from treatments which reduced aspen competition twice in the first 15 years after planting. In contrast, where vegetation management treatments are applied to benefit spruce, the range of mixed species outcomes may not combine to produce a gain in volume [70].
Changes in rotation length or changing the relative species proportions did not provide projected increases in mixedwood volume production that were as great as applying an understory protection harvest. With longer rotations, broadleaf contribution to the mixedwood stand declines and the conifer contribution increases. In the 60 year simulated rotation on this highly productive site, increasing the initial spruce density from 500 to 1300 st ha−1 did not increase projected stand total volumes, but did increase the proportion of the conifer component in the mixedwood stand. The maximum combined yields were achieved with understory protection harvest of the aspen at 60 years, followed by 30 years of growth for the white spruce before the final harvest. This two stage harvesting system maximized the productive potential of both species. In our analysis, only a generalized harvest scenario was used in the MGM simulations, in contrast with the detailed site level analysis of Grover et al. [54]. Our analysis is likely to overestimate both spruce and aspen growth since it does not incorporate spruce windthrow losses after the first harvest entry and the reduced aspen growth in portions of the harvest area due to shading by adjacent trees [54,71].
Productive 25 year-old aspen stands would be in the stem exclusion phase of stand development, experiencing severe competition and reduction in light under the aspen canopy. Thinning aspen densities to 5000 st ha−1 or less at an early age, as done in this study, has created a relatively open environment for the spruce component of a mixedwood stand, delaying the stem exclusion phase. Vertical stratification of crowns for the two species was not absolute, as spruce crowns were within the lower portion of the aspen canopy. Physical damage to white spruce tops was common even where aspen density had been reduced to 1000 st ha−1. Damage to white spruce in mixed stands is likely to increase over time if no additional stand density manipulation occurs.
5. Conclusions
Intimate mixtures of boreal mixedwoods have the greatest potential to maximize tree production and achieve numerous ecological values, but are the most difficult and expensive to achieve operationally. The results of this study provide guidance to encourage development of cost effective silviculture systems for boreal mixedwoods, and indicate that reductions of aspen densities to between 2000 and 5000 stems ha−1 at or before age 5 are likely to provide the highest merchantable volumes from aspen-white spruce mixedwood stands.
Understory protection applied to a managed mixedwood stand would create several different types of mixedwood stand structures over the rotation period, maximize stand level productivity for the two species, and enable operational efficiencies. With an improved knowledge of the early successional dynamics of mixed species stands, we can enhance our predictive tools at both the stand and landscape level.
Acknowledgments
Funding for this research was provided by the B.C. Ministry of Forests, Lands and Natural Resource Operations. The authors gratefully acknowledge the many people who have contributed to the continued measurement and maintenance of this long term experiment.
Author Contributions
Richard Kabzems was the lead author responsible for study design, interpretation of results and the primary writing of text. Mike Bokalo and Phil Comeau were responsible for statistical analysis, and contributed to interpretation of results and writing of text. Dan MacIsaac contributed to interpretation of results and writing of text.
Conflicts of Interest
The authors declare no conflict of interest.
References
- Rowe, J.S. Forest Regions of Canada; Publication No. 1300; Canadian Forestry Service: Ottawa, ON, Canada, 1972. [Google Scholar]
- DeLong, C.; Banner, A.; MacKenzie, W.H.; Rogers, B.J.; Kaytor, B. A Field Guide to Ecosystem Identification for the Boreal White and Black Spruce Zone of British Columbia; Land Management Handbook No. 65; B.C. Ministry of Forests and Range: Victoria, BC, Canada, 2011. Available online: https://www.for.gov.bc.ca/hfd/pubs/Docs/Lmh/Lmh65.pdf (accessed on 30 June 2015).
- Chen, H.Y.H.; Popadiouk, R.V. Dynamics of North American boreal mixedwoods. Environ. Rev. 2002, 10, 137–166. [Google Scholar] [CrossRef]
- Kabzems, A.; Kosowan, A.L.; Harris, W.C. Mixedwood Section in an Ecological Perspective: Saskatchewan, 2nd ed.; Technical Bulletin 8; Canadian Forestry Service: Prince Albert, SK, Canada, 1986. [Google Scholar]
- Lieffers, V.J.; Macmillan, R.B.; MacPherson, D.; Branter, K.; Stewart, J.D. Semi-natural and intensive silvicultural systems for the boreal mixedwood forest. For. Chron. 1996, 72, 286–292. [Google Scholar] [CrossRef]
- Weir, J.M.H.; Johnson, E.A. Effects of escaped settlement fires and logging on forest composition in the mixedwood boreal forest. Can. J. For. Res. 1998, 28, 459–467. [Google Scholar] [CrossRef]
- Kabzems, R.; Garcia, O. Structure and dynamics of trembling aspen—White spruce mixed stands near Fort Nelson, B.C. Can. J. For. Res. 2004, 34, 384–395. [Google Scholar] [CrossRef]
- Lieffers, V.J.; Pinno, B.; Stadt, K. Light dynamics and free-to-grow standards in aspen dominated mixedwood forests. For. Chron. 2002, 78, 137–145. [Google Scholar] [CrossRef]
- Groot, A.; Carlson, D.W.; Fleming, R.L.; Wood, J.E. Small Openings in Trembling Aspen Forest: Microclimate and Regeneration of White Spruce and Trembling Aspen; NODA-NFP-Technical-Report No. TR-47; Canadian Forestry Service: Sault Ste. Marie, ON, Canada, 1997; p. 25. [Google Scholar]
- Comeau, P.; Heineman, J.; Newsome, T. Evaluation of relationships between understory light and aspen basal area in the B.C. central interior. For. Ecol. Manag. 2006, 226, 80–87. [Google Scholar] [CrossRef]
- Man, R.; Lieffers, V.J. Are mixtures of aspen and white spruce more productive than single species stands? For. Chron. 1999, 75, 505–513. [Google Scholar] [CrossRef]
- Filipescu, C.N.; Comeau, P.G. Aspen competition affects light and white spruce growth across several boreal sites in western Canada. Can. J. For. Res. 2007, 37, 1701–1713. [Google Scholar] [CrossRef]
- Filipescu, C.N.; Comeau, P.G. Competitive interactions between aspen and white spruce vary with stand age in boreal mixedwoods. For. Ecol. Manag. 2007, 247, 175–184. [Google Scholar] [CrossRef]
- Coopersmith, D.; Hall, E. Experimental Project 1077—The Siphon Cr. Mixedwood Trial: The Use of a Simple HDR to Predict the Growth Success of Planted White Spruce Seedlings Beneath Aspen Canopies; Research Note No. PG-17; B.C. Ministry of Forests: Prince George, BC, Canada, 1999. [Google Scholar]
- Coopersmith, D.; Sagar, B.; Thompson, D. Ten Year Results of the Bear Mtn. Mixedwood Trial (EP1077): The Effect of Overtopping Aspen Canopies on White Spruce Seedling Growth and Seedling Microclimate; Research Note No. PG-23; B.C. Ministry of Forests: Prince George, BC, Canada, 2000. [Google Scholar]
- Bokalo, M.; Comeau, P.G.; Titus, S.J. Early development of tended mixtures of aspen and spruce in western Canadian boreal forests. For. Ecol. Manag. 2007, 242, 175–184. [Google Scholar] [CrossRef]
- Lees, J.C. Release of White Spruce from Aspen Competition in Alberta’s Spruce-Aspen Forest; Publication No. 1163; Department of Forestry: Ottawa, ON, Canada, 1966; p. 14. [Google Scholar]
- Pitt, D.G.; Comeau, P.G.; Parker, W.C.; MacIsaac, D.; McPherson, S.; Hoepting, M.K.; Stinson, A.; Mihajlovich, M. Early vegetation control for regeneration of a single cohort, intimate mixture of white spruce and trembling aspen on upland boreal sites. Can. J. For. Res. 2010, 40, 549–564. [Google Scholar] [CrossRef]
- Lanner, R.M. On the insensitivity of height growth to spacing. For. Ecol. Manag. 1985, 13, 143–148. [Google Scholar] [CrossRef]
- Tesch, S.D.; Korpella, E.J.; Hobbs, S.D. Effects of sclerophyllous shrub competition on root and shoot development and biomass partitioning of Douglas-fir seedlings. Can. J. For. Res. 1993, 23, 1415–1426. [Google Scholar] [CrossRef]
- Wagner, R.G.; Mohammed, G.H.; Noland, T.L. Critical periods of interspecific competition for northern conifers associated with herbaceous vegetation. Can. J. For. Res. 1999, 29, 890–897. [Google Scholar] [CrossRef]
- Opio, C.; Jacob, N.; Coopersmith, D. Height to diameter ratio as a competition index for young conifer plantations in northern British Columbia. For. Ecol. Manag. 2000, 137, 245–252. [Google Scholar] [CrossRef]
- Peterson, E.B.; Peterson, N.M. Aspen Managers’ Handbook for British Columbia; FRDA Report No. 230; Forestry Canada and B.C. Ministry of Forests: Victoria, BC, Canada, 1995. Available online: https://www.for.gov.bc.ca/hfd/pubs/Docs/Frr/FRR230.pdf (accessed on 30 June 2015).
- Comeau, P.G. Why Mixedwoods? In Silviculture of Temperate and Boreal Broadleaf-Conifer Mixtures; Comeau, P.G., Thomas, K.D., Eds.; Land Management Handbook 36; B.C. Ministry of Forests: Victoria, BC, Canada, 1996; pp. 1–5. Available online: https://www.for.gov.bc.ca/hfd/pubs/Docs/Lmh/Lmh36.pdf (accessed on 29 June 2015). [Google Scholar]
- Macdonald, S.E.; Lecomte, N.; Bergeron, Y.; Brais, S.; Chen, H.; Comeau, P.; Drapeau, P.; Lieffers, V.; Quideau, S.; Spence, J.; et al. Ecological Implications of Changing the Composition of Boreal Mixedwood Forests; A State of Knowledge Report; Sustainable Forest Management Network: Edmonton, AB, Canada, 2010; p. 48. Available online: http://www.sfmn.ales.ualberta.ca/en/Publications/~/media/sfmn/Publications/StateofKnowledgeReports/Documents/SOK2010MixedwoodsMacdonaldetalEn.pdf (accessed on 29 June 2015).
- Pastor, J. Nutrient cycling in aspen ecosystems. In Proceedings of Aspen symposium ''89, Duluth, MN, USA, July 25–27 1989; Gen. Tech. Rep. NC-140. U.S. Department of Agriculture, Forest Service: St. Paul, MN, USA, 1990; pp. 21–38. Available online: http://www.nrs.fs.fed.us/pubs/gtr/gtr_nc140.pdf (accessed on 29 June 2015). [Google Scholar]
- Alfaro, R.I. Role of genetic resistance in managing ecosystems susceptible to white pine weevil. For. Chron. 1996, 72, 374–380. [Google Scholar] [CrossRef]
- Taylor, S.P.; Alfaro, R.I.; DeLong, C.; Rankin, L. The effects of overstory shading on white pine weevil damage to white spruce and its effect on spruce growth rates. Can. J. For. Res. 1996, 26, 306–312. [Google Scholar] [CrossRef]
- Morrison, D.; Merler, H.; Norris, D. Detection, Recognition and Management of Armillaria and Phellinus Root Diseases in the Southern Interior of British Columbia; FRDA Rep. No. 179; Forestry Canada and B.C. Ministry of Forests: Victoria, BC, Canada, 1991. Available online: https://www.for.gov.bc.ca/hfd/pubs/Docs/Frr/FRR179.pdf (accessed on 8 September 2015).
- Gerlach, J.P.; Reich, P.B.; Puettmann, K.; Baker, T. Species, diversity, and density affect tree seedling mortality from Armillaria root rot. Can. J. For. Res. 1997, 27, 1509–1512. [Google Scholar] [CrossRef]
- Stathers, R.J. Summer Frost in Young Forest Plantations; FRDA Report 073; Forestry Canada and B.C. Ministry of Forests: Victoria, BC, Canada, 1989; p. 24. Available online: https://www.for.gov.bc.ca/hfd/pubs/Docs/Frr/FRR073.pdf (accessed on 30 June 2015).
- Groot, A.; Carlson, D.W. Influence of shelter on night temperatures, frost damage, and bud break of white spruce seedlings. Can. J. For. Res. 1996, 26, 1531–1538. [Google Scholar] [CrossRef]
- Pritchard, J.M.; Comeau, P.G. Effects of opening size and stand characteristics on light transmittance and temperature under young trembling aspen stands. For. Ecol. Manag. 2004, 200, 119–128. [Google Scholar] [CrossRef]
- Voicu, M.; Comeau, P.G. Microclimatic and spruce growth gradients adjacent to young aspen stands. For. Ecol. Manag. 2006, 221, 13–26. [Google Scholar] [CrossRef]
- Filipescu, C.N.; Comeau, P.G. Influence of Populus tremuloides density on air and soil temperature. Scand. J. For. Res. 2011, 26, 421–428. [Google Scholar] [CrossRef]
- Lieffers, V.J.; Stadt, K.J. Growth of understory Picea glauca, Calamagrostis canadensis and Epilobium angustifolium in relation to overstory light. Can. J. For. Res. 1994, 24, 1193–1198. [Google Scholar] [CrossRef]
- Groot, A. Effects of shelter and competition on the early growth of planted white spruce (Picea glauca). Can. J. For. Res. 1999, 29, 1002–1014. [Google Scholar] [CrossRef]
- MacDonald, G.B. Mixedwood management research and practice in Ontario. In Silviculture of Temperate and Boreal Broadleaf-Conifer Mixtures; Comeau, P.G., Thomas, K.D., Eds.; Land Management Handbook 36; B.C. Ministry of Forests: Victoria, BC, Canada, 1996; pp. 102–113. [Google Scholar]
- Forintek Canada Corporation. Influence of Growth Rate on Strength and Related Wood Properties of Boreal White Spruce; Technote 00-08W; Forintek Canada Corp.: Vancouver, BC, Canada, 2000; p. 4. [Google Scholar]
- Middleton, G.R.; Munro, D.B. Wood Density of Alberta White Spruce—Implications for Silvicultural Practices; Forintek Canada Corp.: Vancouver, BC, Canada, 2002; p. 21. [Google Scholar]
- MacPherson, D.M.; Lieffers, V.J.; Blenis, P.V. Productivity of aspen stands with and without a spruce understory in Alberta’s boreal mixedwood forests. For. Chron. 2001, 77, 351–356. [Google Scholar] [CrossRef]
- Comeau, P.G.; Kabzems, R.; McClarnon, J.; Heineman, J.L. Implications of selected approaches for regenerating and managing western boreal mixedwoods. For. Chron. 2005, 81, 559–574. [Google Scholar] [CrossRef]
- Pretzsch, H. Forest Dynamics, Growth and Yield: From Measurements to Model; Springer-Verlag: Berlin, Germany & Heidelberg, Germany, 2009; Chapter 9; pp. 337–380, 664. [Google Scholar]
- Kabzems, R.; Nemec, A.L.; Farnden, C. Growing trembling aspen and white spruce intimate mixtures: Early results (13–17 years) and future projections. BC J. Ecosyst. Manag. 2007, 8, 1–15. [Google Scholar]
- Wang, T.; Hamann, A.; Spittlehouse, D.; Aitken, S.N. Development of scale-free climate data for western Canada for use in resource management. Int. J. Climatol. 2006, 26, 383–397. [Google Scholar] [CrossRef]
- Lord, T.M.; Green, A.J. Soils of the Fort St. John-Dawson Creek Area, British Columbia. B.C.; Soil Survey, Res. Br. Report No. 42; Agriculture Canada: Vancouver, BC, Canada, 1986. [Google Scholar]
- Mixedwood Growth Model. Available online: http://www.rr.ualberta.ca/Research/MixedwoodGrowthModel.aspx (accessed on 8 September 2015).
- Bokalo, M.; Stadt, K.J.; Comeau, P.G.; Titus, S.J. The validation of the Mixedwood Growth Model (MGM) for use in forest management decision making. Forests 2013, 4, 1–27. [Google Scholar] [CrossRef]
- British Columbia Ministry of Forests and Range (BC MOFR). Site Tools 3.3, 2004. Available online: www.for.gov.bc.ca/hre/sitetool/release.htm (accessed on 15 April 2015).
- Huang, S. A Subregion-Based Compatible Height-Site Index-Age Model for Young and Mature White Spruce in Alberta; Forest Management Research Note; Publication No. T/354; Alberta Environmental Protection Land and Forest Service: Edmonton, AB, Canada, 1997. [Google Scholar]
- Huang, S.; Titus, S.J.; Morgan, D.J. A Compatible Height-Site Index-Age Model for Young and Mature Aspen Based on Natural Subregions; Forest Management Research Note; Publication No. T/355; Alberta Environmental Protection Land and Forest Service: Edmonton, AB, Canada, 1997. [Google Scholar]
- Huang, S. Ecologically Based Individual Tree Volume Estimation for Major Alberta Tree Species. In Individual Tree Volume Estimation Procedures for Alberta: Methods of Formulation and Statistical Foundations; Report #1; Alberta Environmental Protection, Land and Forest Services, Forest Management Division: Edmonton, AB, Canada, 1994. [Google Scholar]
- MacIsaac, D.A.; Comeau, P.G.; Macdonald, S.E. Dynamics of regeneration gaps following harvest of aspen stands. Can. J. For. Res. 2006, 36, 1818–1823. [Google Scholar] [CrossRef]
- Grover, B.E.; Bokalo, M.; Greenway, K.J. White spruce understory protection: From planning to growth and yield. For. Chron. 2014, 90, 35–43. [Google Scholar] [CrossRef]
- Navratil, S.; Brace, L.G.; Sauder, E.A.; Lux, S.J. Silvicultural and Harvesting Options to Favor Immature White Spruce and Aspen Regeneration in Boreal Mixedwoods; Information Report NOR-X-337; Canadian Forest Service: Edmonton, AB, Canada, 1994; p. 78. [Google Scholar]
- Cole, E.C.; Newton, M.; Youngblood, A. Effects of overtopping on growth of white spruce in Alaska. Can. J. For. Res. 2013, 43, 861–871. [Google Scholar] [CrossRef] [Green Version]
- Neufeld, B.A.; Morris, D.M.; Luckai, N.; Reid, D.E.B.; Bell, F.W.; Shahi, C.; Meyer, W.L.; Adhikary, S. The influence of competition and species mixture on plantation-grown white spruce: Growth and foliar nutrient response after 20 years. For. Chron. 2014, 90, 70–79. [Google Scholar] [CrossRef]
- Steneker, G.A. Growth of White Spruce Following Release from Trembling Aspen; Publication No. 1183; Forestry Research Development Branch: Ottawa, ON, Canada, 1967; p. 16. [Google Scholar]
- MacLean, D.A. Forest management strategies to reduce spruce budworm damage in the Fundy Model Forest. For. Chron. 1996, 72, 399–405. [Google Scholar] [CrossRef]
- Westfall, J.; Ebata, T. 2013 Summary of Forest Health Conditions in British Columbia. B.C.; Pest Management Report No. 15; Ministry Forests, Lands, and Natural Resource Operations, Resource Practices Branch: Victoria, BC, Canada, 2013; p. 88. Available online: http://www.for.gov.bc.ca/hfp/health/overview/2013.htm (accessed on 22 September 2015).
- Perala, D.A. Thinning Strategies for Aspen: A Predictive Model; Paper NC-RP-161; U.S. Department Agriculture, Forest Service: St. Paul, Minnesota, USA, 1978; p. 19. Available online: http://www.nrs.fs.fed.us/pubs/rp/rp_nc161.pdf (accessed on 29 June 2015).
- Weingartner, D.H. Spacing and thinning in aspen and mixedwood: Some thoughts, theories and observations? In Space to grow: Spacing and Thinning in Northern Ontario, Proceedings of the Symposium Sponsored by Forestry Canada, Ontario Region, and Ontario Ministry of Natural Resources, Sault Ste. Marie, ON, Canada, 18–20 June 1990; Haavisto, V.F., Smith, C.R., Mason, C., Eds.; Joint Report No. 15. Forestry Canada, Ontario Region, and Ontario Ministry of Natural Resources: Sault Ste. Marie, ON, Canada, 1991; pp. 145–149. [Google Scholar]
- Penner, M.; Robinson, C.; Woods, M. The response of good and poor aspen clones to thinning. For. Chron. 2001, 77, 874–884. [Google Scholar] [CrossRef]
- Bickerstaff, A. The Effect of Thinning upon the Growth and Yield of Aspen Stands; Canada Forestry Silvicultural Research Note No. 80; Dominion Forest Service: Ottawa, ON, Canada, 1946; p. 25. [Google Scholar]
- Steneker, G.A. Guide to the Silvicultural Management of Trembling Aspen in the Prairie Provinces; Information Report NOR X 164; Canadian Forestry Service: Edmonton, AB, Canada, 1976; p. 6. [Google Scholar]
- Perala, D.A. Déjà vu: “Does it pay to thin young aspen?”. In Space to Grow: Spacing and Thinning in Northern Ontario, Proceedings of the Symposium Sponsored by Forestry Canada, Ontario Region, and Ontario Ministry of Natural Resources, Sault Ste. Marie, ON, Canada, 18–20 June 1990; Haavisto, V.F., Smith, C.R., Mason, C., Eds.; Forestry Canada, Ontario Region, and Ontario Ministry of Natural Resources, Joint Report No. 15. Forestry Canada: Sault Ste. Marie, ON, Canada, 1991; pp. 139–144. [Google Scholar]
- Rice, J.A.; MacDonald, G.B.; Weingartner, D.H. Precommercial thinning of trembling aspen in northern Ontario: Part 1—Growth responses. For. Chron. 2001, 77, 893–901. [Google Scholar] [CrossRef]
- Kelty, M.J. Comparative productivity of monocultures and mixed-species stands. In The Ecology and Silviculture of Mixed-Species Forests; Kelty, M.J., Larson, B.C., Oliver, C.D., Eds.; Kluwer Academic Publishers: Dordrecht, The Netherlands, 1992; pp. 125–141. [Google Scholar]
- Forrester, D.I. The spatial and temporal dynamics of species interactions in mixed-species forests: From pattern to process. For. Ecol. Manag. 2013, 312, 282–292. [Google Scholar] [CrossRef]
- Groot, A.; Adhikary, S.; Sharma, M.; Luckai, N.; Bell, F.W.; Larocque, G.R. Effect of species composition on the production rate and efficiency of young Picea glauca-Populus tremuloides forests. For. Ecol. Manag. 2014, 315, 1–11. [Google Scholar] [CrossRef]
- Lennie, A.D.; Landhausser, S.M.; Lieffers, V.J.; Sidders, D. Regeneration of aspen following partial and strip understory protection harvest in boreal mixedwood forests. For. Chron. 2009, 85, 631–638. [Google Scholar] [CrossRef]
© 2015 by the authors; licensee MDPI, Basel, Switzerland. This article is an open access article distributed under the terms and conditions of the Creative Commons by Attribution (CC-BY) license (http://creativecommons.org/licenses/by/4.0/).