
Assessments of Population Structure, Diversity, and Phylogeography of the Swiss Needle Cast Fungus (Phaeocryptopus gaeumannii) in the U.S. Pacific Northwest

Abstract
:1. Introduction
2. Materials and Methods
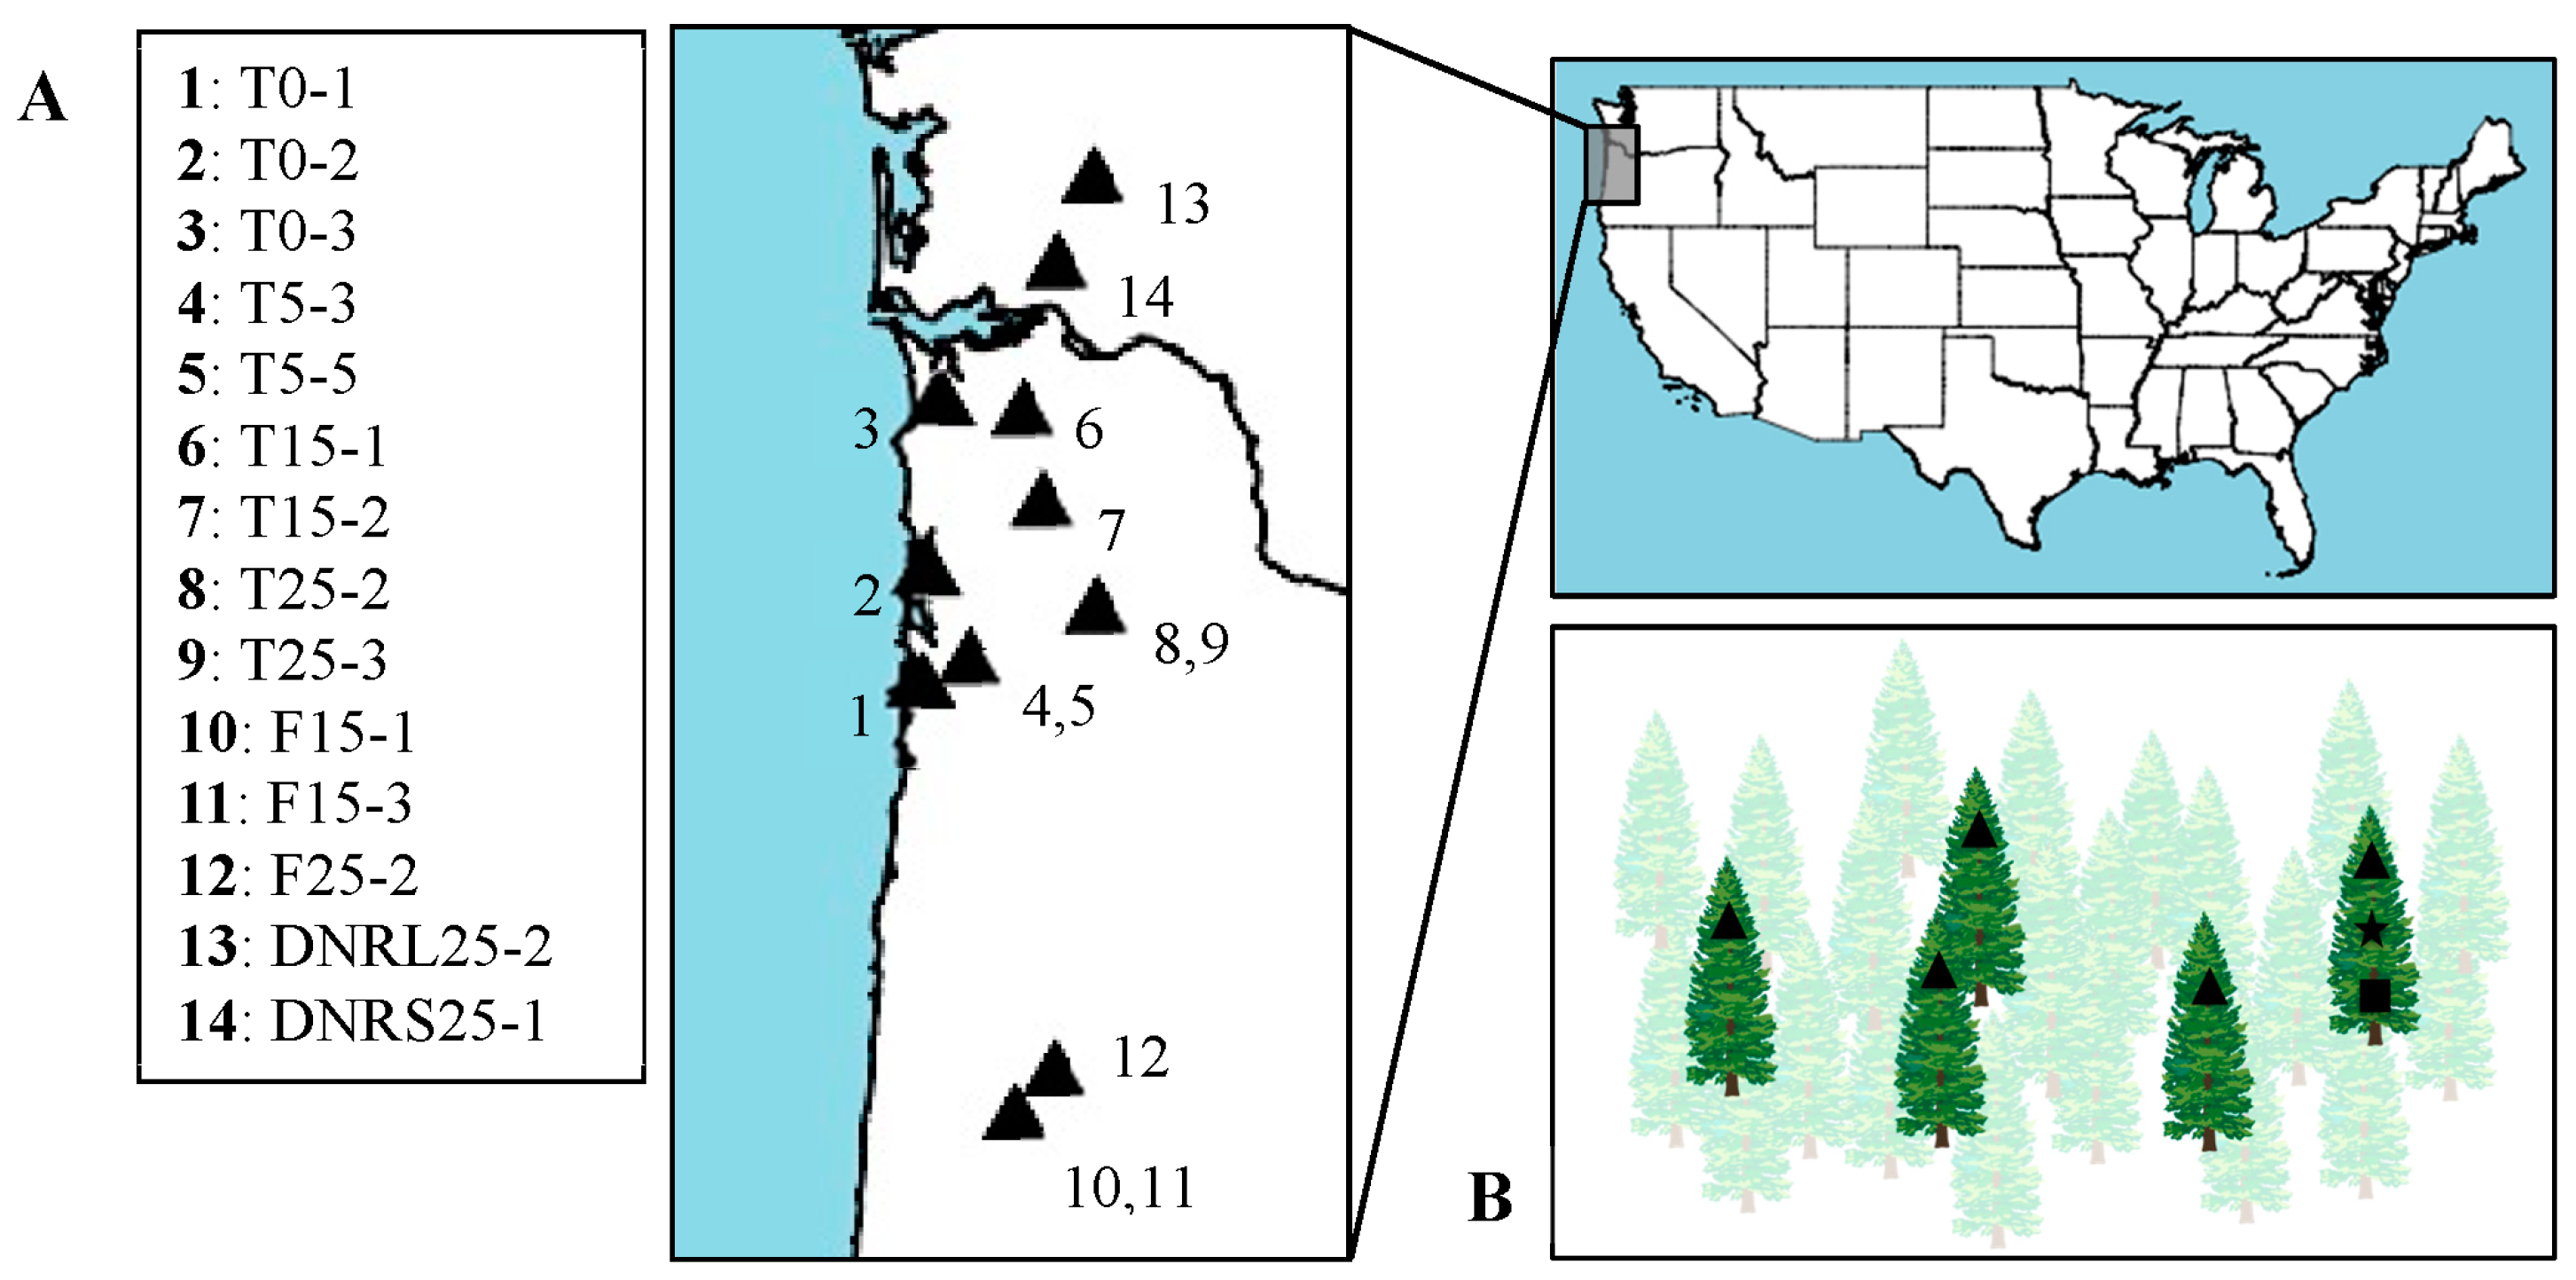
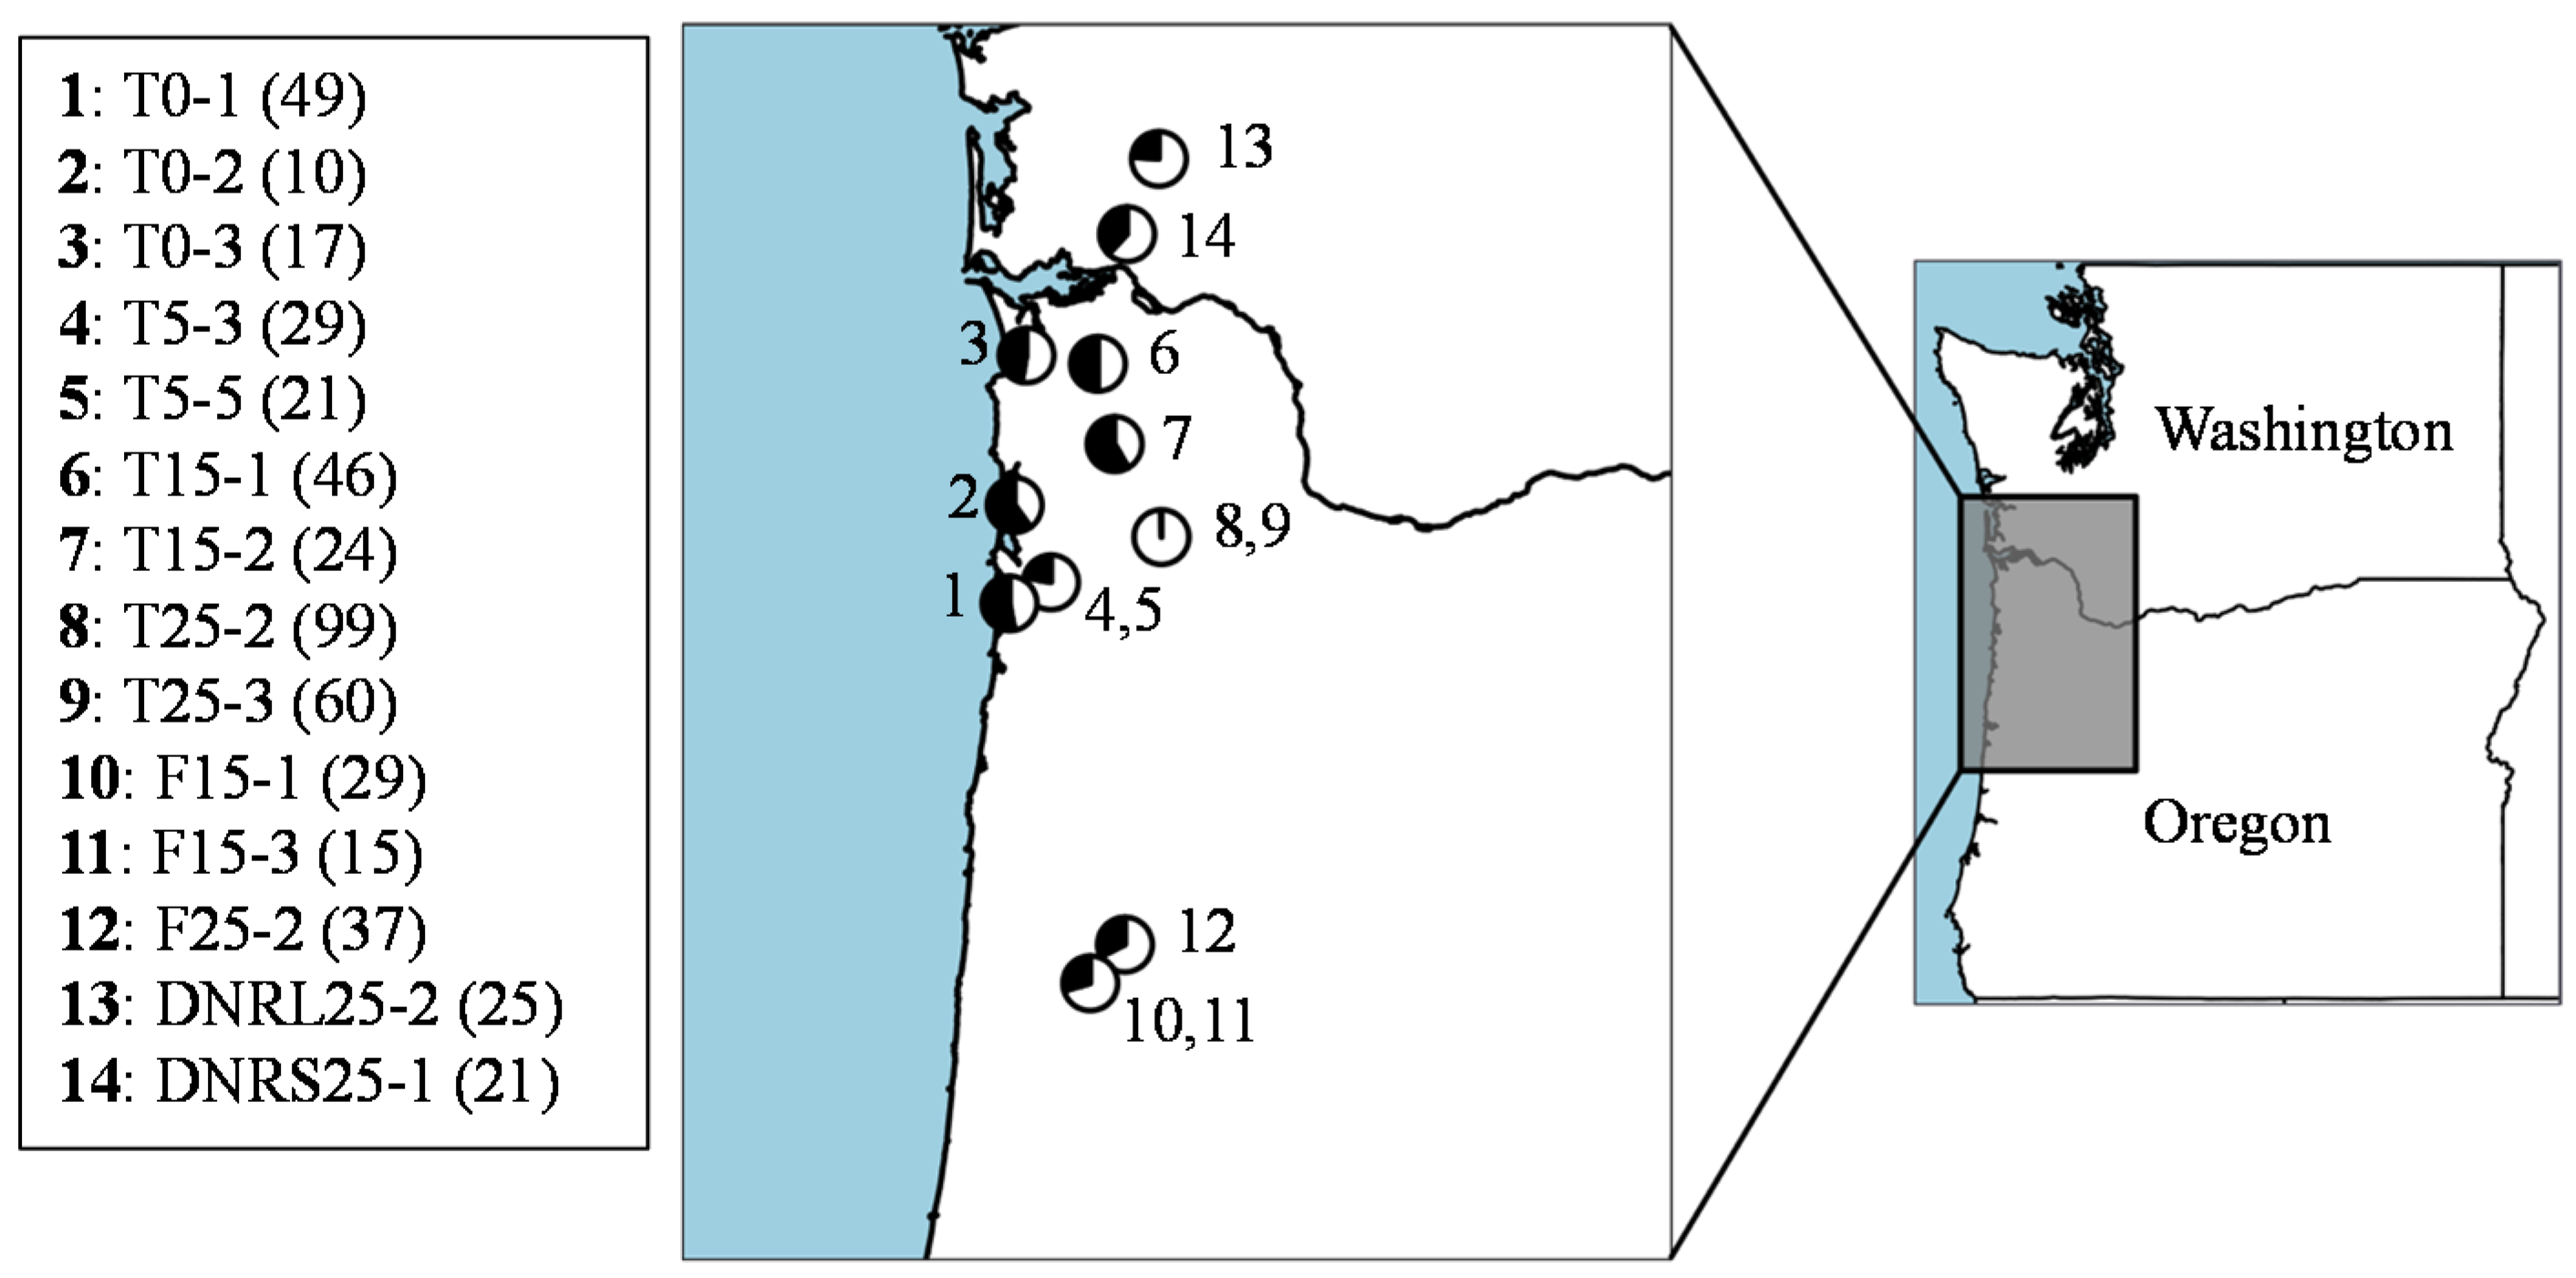
2.1. Sample Collection


| Site | N a | MLG b | eMLG c | L1 d | L2 e |
|---|---|---|---|---|---|
| T-01 | 49 | 48 | 9.96 | 23 | 26 |
| T-02 | 10 | 9 | 9 | 4 | 6 |
| T-03 | 17 | 17 | 10 | 9 | 8 |
| T5-3 | 29 | 29 | 10 | 22 | 7 |
| T5-5 | 21 | 20 | 9.79 | 17 | 4 |
| T15-1 | 46 | 45 | 9.96 | 23 | 23 |
| T15-2 | 24 | 23 | 9.84 | 10 | 14 |
| T25-2 | 99 | 90 | 9.85 | 99 | 0 |
| T25-3 | 60 | 59 | 9.97 | 59 | 1 |
| F15-1 | 29 | 27 | 9.78 | 27 | 2 |
| F15-3 | 15 | 15 | 10 | 4 | 11 |
| F25-2 | 37 | 32 | 9.61 | 25 | 12 |
| DNRL25-2 | 25 | 25 | 10 | 19 | 6 |
| DNRS25-2 | 21 | 16 | 8.93 | 13 | 8 |
| Total | 482 | 454 | 9.99 | 358 | 124 |
2.2. Isolation and Culturing
2.3. DNA Extractions
2.4. Microsatellite PCR
2.5. Genotyping and Allele Scoring
2.6. Data Analysis
3. Results and Discussion
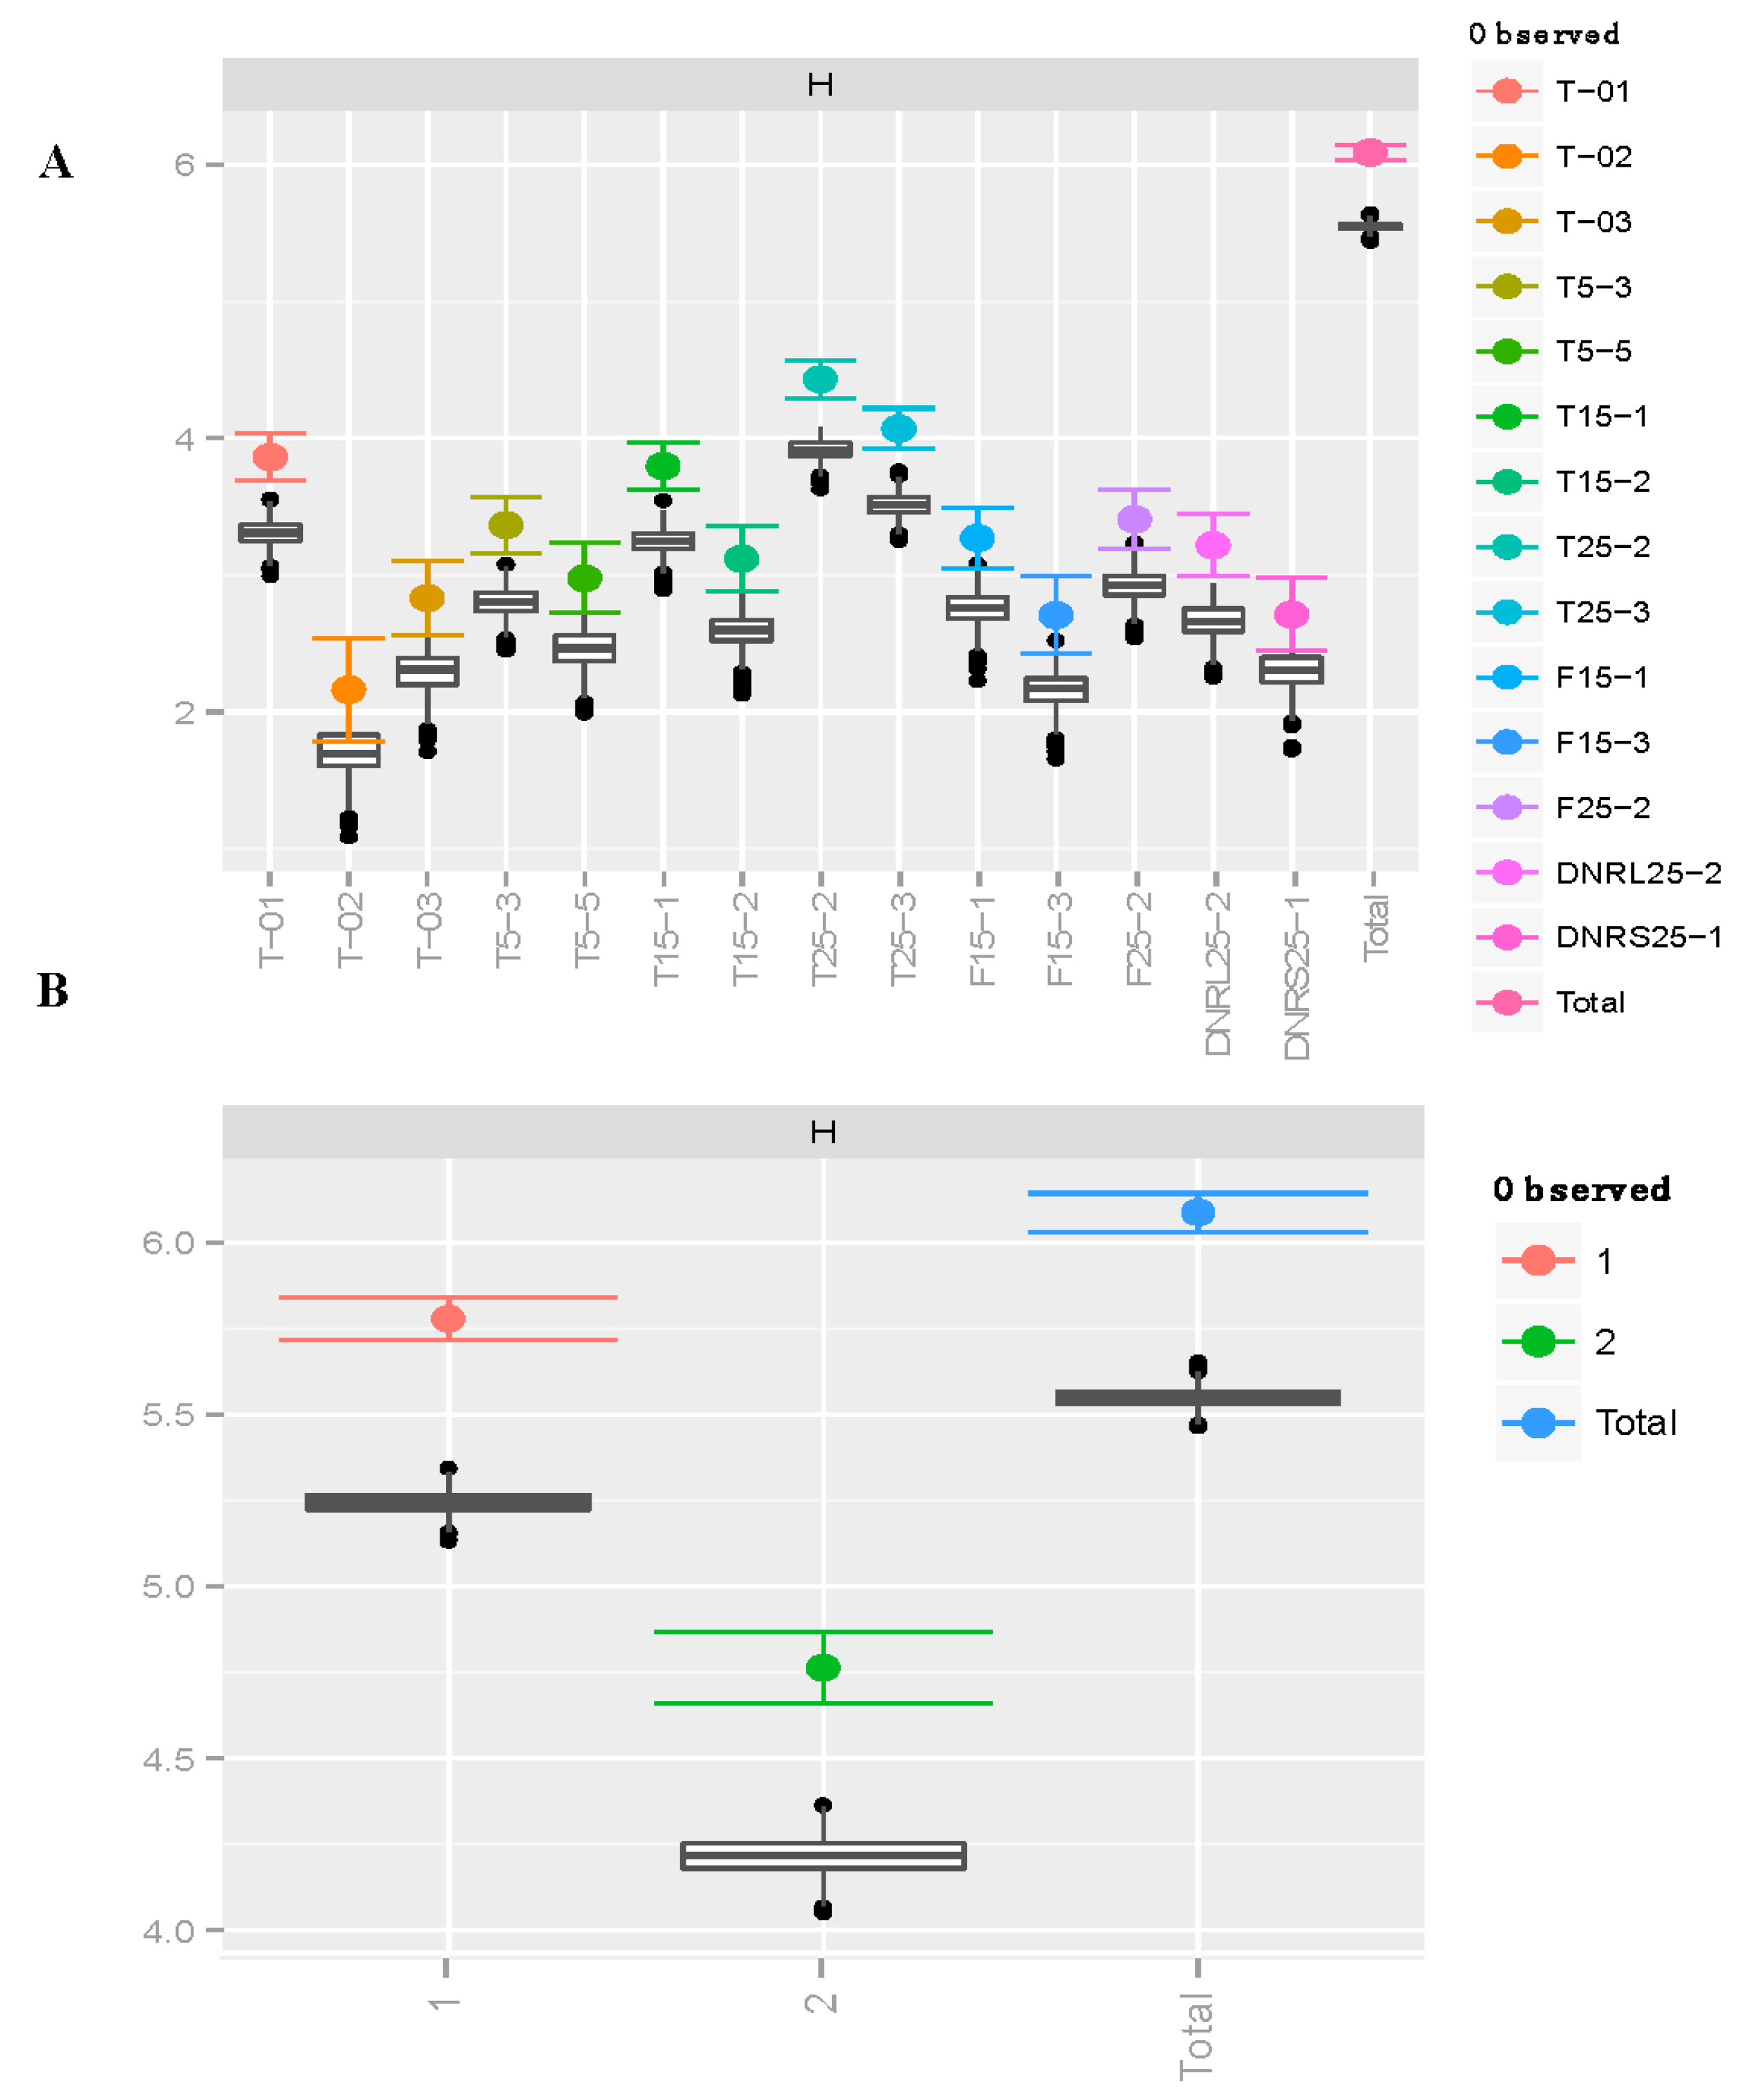
3.1. Richness and Diversity

| A | ||||
| Site | H a | G b | λc | Hed |
| T-01 | 3.864 (3.69, 4.04) | 47.08 (42.0, 52.1) | 0.979 (0.97, 0.99) | 0.821 |
| T-02 | 2.164 (1.79, 2.54) | 8.333 (6.30, 10.37) | 0.880 (0.79, 0.97) | 0.749 |
| T-03 | 2.833 (2.56, 3.11) | 17.00 (14.3, 19.8) | 0.941 (0.90, 0.98) | 0.806 |
| T5-3 | 3.367 (3.16, 3.57) | 29.00 (25.5, 32.5) | 0.966 (0.95, 0.98) | 0.781 |
| T5-5 | 2.979 (2.72, 3.23) | 19.17 (16.0, 22.3) | 0.948 (0.92, 0.98) | 0.726 |
| T15-1 | 3.799 (3.62, 3.97) | 44.08 (39.3, 48.9) | 0.977 (0.97, 0.99) | 0.778 |
| T15-2 | 3.120 (2.88, 3.36) | 22.15 (18.8, 25.6) | 0.955 (0.93, 0.98) | 0.804 |
| T25-2 | 4.433 (4.30, 4.57) | 73.69 (65.1, 82.3) | 0.986 (0.98, 0.99) | 0.630 |
| T25-3 | 4.071 (3.92, 4.22) | 58.07 (52.8, 63.3) | 0.983 (0.98, 0.99) | 0.717 |
| F15-1 | 3.272 (3.05, 3.50) | 25.49 (21.8, 29.2) | 0.961 (0.94, 0.98) | 0.751 |
| F15-3 | 2.708 (2.43, 2.99) | 15.00 (12.5, 17.5) | 0.933 (0.89, 0.98) | 0.810 |
| F25-2 | 3.409 (3.20, 3.62) | 27.94 (23.6, 32.3) | 0.964 (0.95, 0.98) | 0.815 |
| DNRL25-2 | 3.219 (2.99, 3.45) | 25.00 (21.7, 28.3) | 0.960 (0.94, 0.98) | 0.787 |
| DNRS25-1 | 2.714 (2.45, 2.98) | 14.23 (11.5, 17.0) | 0.930 (0.89, 0.97) | 0.759 |
| Total | 6.089 (6.03, 6.14) | 417.8 (401, 435) | 0.998 (0.997, 0.998) | 0.820 |
| B | ||||
| Lineage | H | G | λ | He |
| 1 | 5.780 (5.71, 5.85) | 303.7 (289, 318) | 0.997 (0.996, 0.997) | 0.728 |
| 2 | 4.764 (4.66, 4.87) | 114.7 (107, 122) | 0.991 (0.989, 0.993) | 0.745 |
| Total | 6.089 (6.03, 6.15) | 417.8 (400, 435) | 0.998 (0.997, 0.998) | 0.820 |
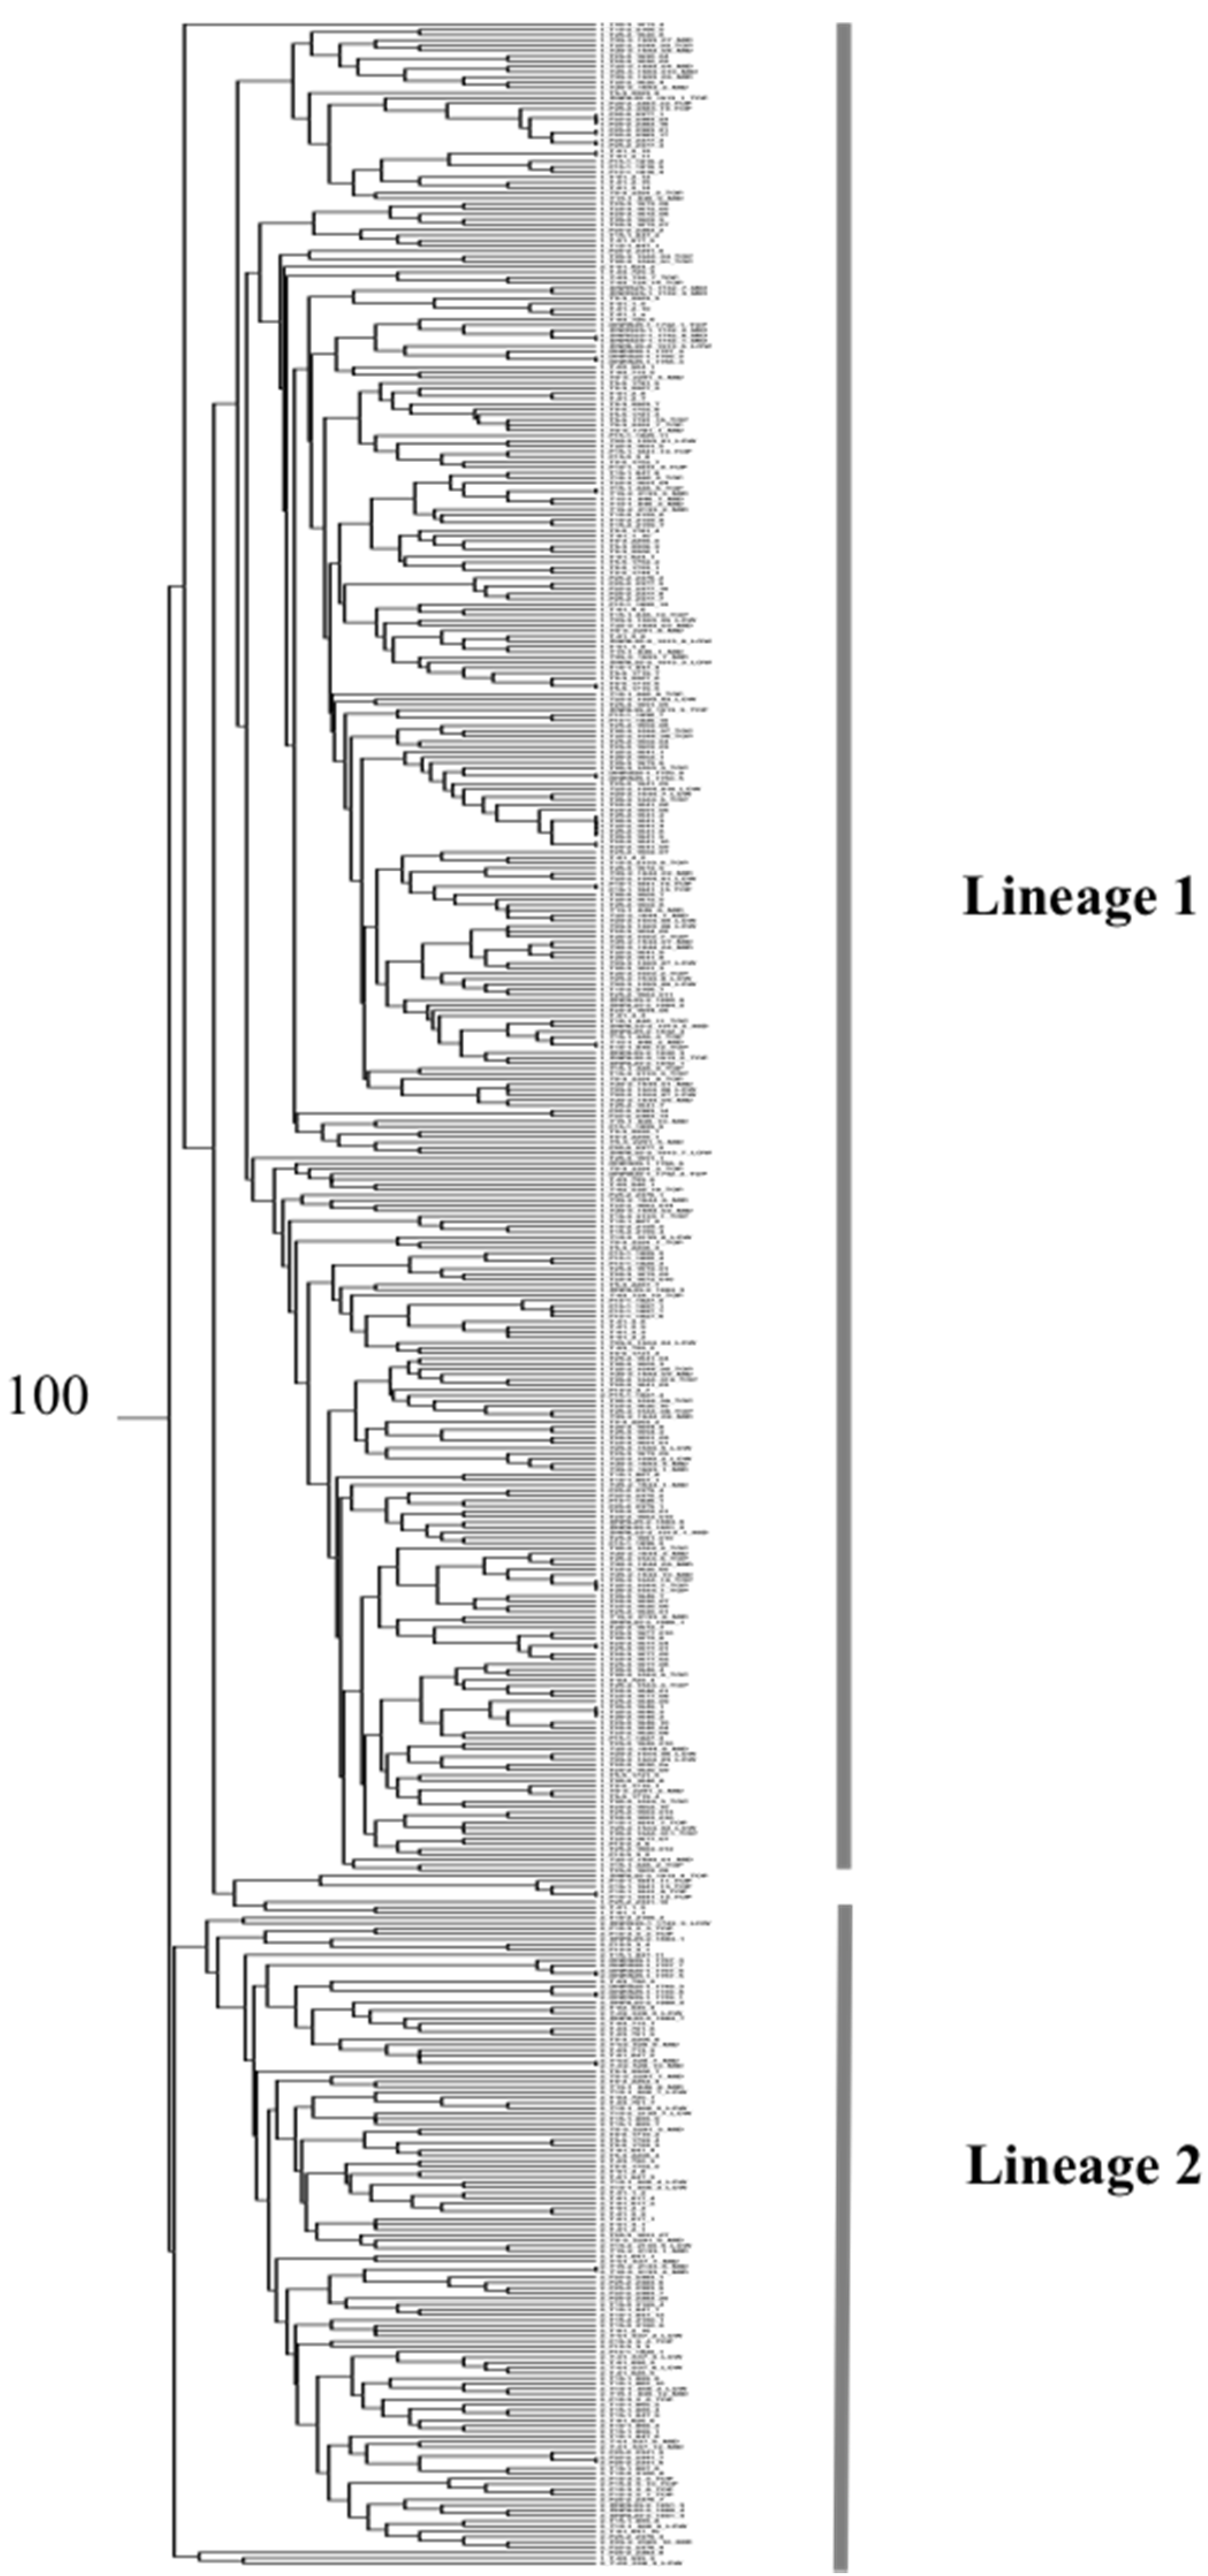
3.2. Phylogeography

3.3. Population Structure and Differentiation
| Hierarchical Level | Variance (%) | φ | p * |
|---|---|---|---|
| φLT (between lineages) | 22.671 | 0.227 | 0.001 |
| φSL (among sites within lineages) | 4.719 | 0.061 | 0.001 |
| φTS (among trees within sites) | 10.772 | 0.148 | 0.001 |
| φTT (within trees) | 61.838 | 0.382 | 0.001 |

4. Conclusion
Acknowledgments
Author Contributions
Conflicts of Interest
References
- Boyce, J.S. A needle-cast of Douglas Fir associated with Adelopus gaeumannii. Phytopathology 1940, 30, 649–659. [Google Scholar]
- Hansen, E.M.; Stone, J.K.; Capitano, B.R.; Rosso, P.; Sutton, W.; Winton, L.; Kanaskie, A.; McWilliams, M.G. Incidence and impact of Swiss needle cast in forest plantations of Douglas-fir in coastal Oregon. Plant Dis. 2000, 84, 773–778. [Google Scholar] [CrossRef]
- Manter, D.K.; Kavanagh, K.L.; Filip, G.M. Pseudothecia of Swiss needle cast fungus, Phaeocryptopus gaeumannii, physically block stomata of Douglas fir, reducing CO2 assimilation. New Phytol. 2000, 148, 481–491. [Google Scholar] [CrossRef]
- Manter, D.K.; Winton, L.M.; Filip, G.M.; Stone, J.K. Assessment of Swiss needle cast disease: Temporal and spatial investigations of fungal colonization and symptom severity. J. Phytopathol. 2003, 151, 344–351. [Google Scholar] [CrossRef]
- Oregon Department of Forestry. Swiss Needle Cast (SNC) Aerial Survey, 1996–2015. Avaliable online: http://www.oregon.gov/odf (accessed on 28 September 2015).
- Stone, J.K.; Capitano, B.R.; Kerrigan, J.L. The histopathology of Phaeocryptopus gaeumannii on Douglas-fir needles. Mycologia 2008, 100, 431–444. [Google Scholar] [CrossRef] [PubMed]
- Winton, L.M.; Hansen, E.M.; Stone, J.K. Population structure suggests reproductively isolated lineages of Phaeocryptopus gaeumannii. Mycologia 2006, 98, 781–791. [Google Scholar] [CrossRef] [PubMed]
- Winton, L.M. Phylogenetics, Population Genetics, Molecular Epidemiology, and Pathogenicity of the Douglas-Fir Swiss Needle Cast Pathogen Phaeocryptopus gaeumannii. Ph.D. Thesis, Oregon State University, Corvallis, OR, USA, 2001. [Google Scholar]
- Winton, L.M.; Stone, J.K.; Hansen, E.M. Polymorphic microsatellite markers for the Douglas-fir pathogen Phaeocryptopus gaeumannii, causal agent of Swiss Needle Cast disease. Mol. Ecol. Notes 2007, 7, 1125–1128. [Google Scholar] [CrossRef]
- R Core Team. R: A Language and Environment for Statistical Computing. R Foundation for Statistical Computing, Vienna, Austria. Available online: http://www.R-project.org (accessed on 6 June 2013).
- Peakall, R.; Smouse, P.E. Genalex 6: Genetic analysis in Excel. Population genetic software for teaching and research. Mol. Ecol. Notes 2006, 6, 288–295. [Google Scholar] [CrossRef]
- Peakall, R.; Smouse, P.E. Genalex 6.5: Genetic analysis in Excel. Population genetic software for teaching and research—An update. Bioinformatics 2012, 28, 2537–2539. [Google Scholar] [CrossRef] [PubMed]
- Kamvar, Z.N.; Tabima, J.F.; Grünwald, N.J. Poppr: An R package for genetic analysis of populations with clonal, partially clonal, and/or sexual reproduction. PeerJ 2014, 2. [Google Scholar] [CrossRef] [PubMed]
- Grünwald, N.J.; Hoheisel, G.A. Hierarchical analysis of diversity, selfing, and genetic differentiation in populations of the oomycete Aphanomyces euteiches. Phytopathology 2006, 96, 1134–1141. [Google Scholar] [CrossRef] [PubMed]
- Stoddart, J.A.; Taylor, J.F. Genotypic diversity: Estimation and prediction in samples. Genetics 1988, 118, 705–711. [Google Scholar] [PubMed]
- Simpson, E.H. Measurement of diversity. Nature 1949, 163. [Google Scholar] [CrossRef]
- Nei, M. Estimation of average heterozygosity and genetic distance from a small number of individuals. Genetics 1978, 89, 583–590. [Google Scholar] [PubMed]
- Grünwald, N.J.; Goodwin, S.B.; Milgroom, M.G.; Fry, W.E. Analysis of genotypic diversity data for populations of microorganisms. Phytopathology 2003, 93, 738–746. [Google Scholar] [CrossRef] [PubMed]
- Excoffier, L.; Smouse, P.E.; Quattro, J.M. Analysis of molecular variance inferred from metric distances among DNA haplotypes: Application to human mitochondrial DNA restriction data. Genetics 1992, 131, 479–491. [Google Scholar] [PubMed]
- Rambaut, A. FigTree Version 1.4.2. Available online: http://tree.bio.ed.ac.uk/software/figtree/ (accessed on 10 June 2014).
- Rogers, J.S. Studies in Genetics. In Measures of Genetic Similarity and Genetic Distances; University of Texas Publication: Texas, TX, USA, 1972; pp. 145–153. [Google Scholar]
- Manter, D.K.; Reeser, P.W.; Stone, J.K. A climate-based model for predicting geographic variation in Swiss needle cast severity in the Oregon Coast Range. Phytopathology 2005, 95, 1256–1265. [Google Scholar] [CrossRef] [PubMed]
- Stone, J.K.; Hood, I.A.; Watt, M.S.; Kerrigan, J.L. Distribution of Swiss needle cast in New Zealand in relation to winter temperature. Australas. Plant Pathol. 2007, 36, 445–454. [Google Scholar] [CrossRef]
- Stone, J.K.; Coop, L.B.; Manter, D.K. Predicting effects of climate change on Swiss needle cast disease severity in Pacific Northwest forests. Can. J. Plant Pathol. 2008, 30, 169–176. [Google Scholar] [CrossRef]
- Watt, M.S.; Stone, J.K.; Hood, I.A.; Palmer, D.J. Predicting the severity of Swiss needle cast on Douglas-fir under current and future climate in New Zealand. For. Ecol. Manag. 2010, 260, 2232–2240. [Google Scholar] [CrossRef]
- Watt, M.S.; Stone, J.K.; Hood, I.A.; Manning, L.K. Using a climatic niche model to predict the direct and indirect impacts of climate change on the distribution of Douglas-fir in New Zealand. Glob. Chang. Biol. 2011, 17, 3608–3619. [Google Scholar] [CrossRef]
- Balloux, F.; Lugon Moulin, N. The estimation of population differentiation with microsatellite markers. Mol. Ecol. 2002, 11, 155–165. [Google Scholar] [CrossRef] [PubMed]
© 2016 by the authors; licensee MDPI, Basel, Switzerland. This article is an open access article distributed under the terms and conditions of the Creative Commons by Attribution (CC-BY) license (http://creativecommons.org/licenses/by/4.0/).
Share and Cite
Bennett, P.; Stone, J. Assessments of Population Structure, Diversity, and Phylogeography of the Swiss Needle Cast Fungus (Phaeocryptopus gaeumannii) in the U.S. Pacific Northwest. Forests 2016, 7, 14. https://doi.org/10.3390/f7010014
Bennett P, Stone J. Assessments of Population Structure, Diversity, and Phylogeography of the Swiss Needle Cast Fungus (Phaeocryptopus gaeumannii) in the U.S. Pacific Northwest. Forests. 2016; 7(1):14. https://doi.org/10.3390/f7010014
Chicago/Turabian StyleBennett, Patrick, and Jeffrey Stone. 2016. "Assessments of Population Structure, Diversity, and Phylogeography of the Swiss Needle Cast Fungus (Phaeocryptopus gaeumannii) in the U.S. Pacific Northwest" Forests 7, no. 1: 14. https://doi.org/10.3390/f7010014
APA StyleBennett, P., & Stone, J. (2016). Assessments of Population Structure, Diversity, and Phylogeography of the Swiss Needle Cast Fungus (Phaeocryptopus gaeumannii) in the U.S. Pacific Northwest. Forests, 7(1), 14. https://doi.org/10.3390/f7010014