Article

Variability of Stand Structures and Development in Old-Growth Forests in the Pacific Northwest, USA

1
Department of Forest Sciences, Seoul National University, Seoul 08826, Korea
2
Yale University, School of Forestry and Environmental Studies, New Haven, CT 06511, USA
*
Author to whom correspondence should be addressed.
Forests 2015, 6(9), 3177-3196; https://doi.org/10.3390/f6093177
Submission received: 15 July 2015 / Revised: 14 August 2015 / Accepted: 8 September 2015 / Published: 11 September 2015

Abstract

:
The forest stand structure class “old-growth” has previously been qualitatively described as having several distinct “sub-structures.” Species composition, diameter distribution, and other structural features commonly associated with old-growth in the Pacific Northwest are quite variable. We determined which quantitative stand structure variables are commonly found together using the Spearman correlation and non-metric multidimensional analysis. Some features were more commonly found together than others, indicating different old-growth stand types, or sub-structures. Cluster analysis classified the old-growth forests into four groups: Douglas-fir dominance, shade tolerant species dominance, and intermediate groups. The intermediate groups were split by the density of large logs and large shade tolerant trees. The old-growth sub-structures appear to change from one to another as the old forest develops.

1. Introduction

Old-growth forests can contain a variety of structural features that require a long time to develop, such as large trees, snags, downed logs, and multiple canopy layers [1,2,3]. The overall stand physiognomy has also been described as varying from containing a relatively continuous upper canopy of shade intolerant species, to a fragmented canopy, to a continuous canopy of primarily shade tolerant species [4,5]. Consequently, there appear to be several “sub-structures” of old-growth.
Several sub-structure classifications of old-growth forests in the Pacific Northwest have been developed [4,6,7]. The classification varied in which structural attributes were associated with each old-growth sub-structure [4,8]. Franklin et al. [5] reviewed the different classifications and proposed that old-growth be divided into three sub-structures: “Vertical Diversification,” “Horizontal Diversification,” and “Pioneer Cohort Loss.”
It is also possible that old-growth forests change among these sub-structures sequentially, as has been proposed by both Oliver and Larson [4] and Franklin et al. [5]. The fact that the age of transitioning from one sub-structure to another varies according to many factors has made it difficult to confirm the sequential development.
Forests can develop along different pathways to an old-growth condition. Forests of mixed Douglas-fir (Pseudotsuga menziesii (Mirb.) Franco), western hemlock (Tsuga heterophylla (Raf.) Sarg.), and western redcedar (Thuja plicata Donn ex D. Don) in western Washington can result from stand-replacing or minor disturbances [9,10] and from stands initiating at narrow or wide spacings [11]. Although time is required for these trees to grow to large sizes, the large tree diameters in a stand do not necessarily reflect the trees’ ages [12]. The diameters can also reflect their past disturbance history, soil productivity, species interactions, and initial crowding [10,11,13]. For example, western hemlocks [14] and western redcedars [15] can grow larger than any Douglas-firs found in the present study, but not if they are dominated by Douglas-firs in either even-age or uneven-age stands. Studies [16,17,18,19] have noted that an old-growth stand can sometimes retain the tree age distribution characteristic of the disturbance that initiated it even after several hundred years.
Some common structural features of old-growth stands that have been quantified by researchers for the western hemlock zone in the western Cascade range are: at least 20 Douglas-fir trees ha−1 older than 200 years, multi-layered canopies, and considerable amounts of coarse woody debris with at least 10 snags ha−1 and over 37 tons ha−1 of large logs [20,21,22,23,24]. Not all of these features are found consistently in old-growth stands [13]. Consequently, some old-growth forests may not have value for specific old-growth functions if they are lacking a needed structural feature [25]. This study examined which structural features are commonly found together and which are not.
This study was done in Douglas-fir-western hemlock stands in the western hemlock zone [26] of the western Cascade Range of the Pacific Northwest region of the United States. We examined old-growth forests in western Washington with three objectives: to understand which structural features are found together; to determine if there are patterns of sub-structures in the old forests; and to determine if patterns of change in sub-structures can be inferred within these old stands such as proposed by Oliver and Larson [4] and Franklin et al. [5].

2. Materials and Methods

2.1. Study Area

The study area was within and around the Cispus Adaptive Management Area (AMA), which is 58,236 hectares of heavily forested, mountainous land on the northeastern part of the Gifford Pinchot National Forest in southwest Washington, USA [27]. Annual precipitation was 145 cm ranging from a monthly mean precipitation of 31 mm in July to 261 mm in November [28]. Annual mean temperature was 10.3 °C with a monthly mean minimum temperature of 2.4 °C in December to 18.8 °C in August [29]. Soils are either reddish brown loam to clay loam derived from basalt and andesite or loamy sand to sandy loam, often formed in aerially deposited dacitic pumice and volcanic ash [30]. Mt. St. Helens erupted intermittently and provided tephra for more than 35,000 years [31]. Douglas-fir was the dominant species across our study area, with large amounts of western hemlock and western redcedar [32]. Pacific silver fir (Abies amabilis (Dougl.) Forbes), red alder (Alnus rubra Bong.), and bigleaf maple (Acer macrophyllum Pursh) were also found in some plots.

2.2. Sample Plots

Within this large area, we collected preliminary data from 62 stands. From these, 16 stands were selected for investigating old-growth characteristics (Table 1). Stands were considered to be suitable if they had not been subjected to logging, were over 150 years old [33], and in aggregate appeared to satisfy the general descriptions of old-growth [4,8,23], botanically diverse [6], and/or old forest [24], which described stands containing large sized trees, snags, down woody debris, and multiple canopy layers.
Table 1. Topographic characteristics and stand age and disturbance information of the study plots.
Stand IdentificationMean Altitude (m)Aspect (°)Slope (%)PhysiographyOldest Tree Age (Year)Age DistributionFireWindthrow
1701.021847Bench/terrace132Single cohort--
21,066.817065Sidehill/middle 1/3132Single cohortYes-
3701.025630Sidehill/middle 1/3155Single cohortYesSmall
4670.63050Sidehill/upper1/3120Single cohortYesSmall
5548.634025Sidehill/lower 1/3252Continuous DF-WHYesSmall
6487.78020Sidehill/lower 1/3240Continuous DF-WH-Small
7609.635560Sidehill/middle294Continuous DF-WHYesLarge
8487.710Broad flat258Aggregate-Some
91,127.81999Bench/terrace482Continuous DF-WH-Some
10457.236030Sidehill/lower 1/3426Continuous-Some
11548.69065Narrow ridgetop/peak490Aggregate-Small
121,005.827030Sidehill/lower 1/3549Continuous/aggregate--
13731.534030Sidehill/middle 1/3426Continuous/aggregate-Small
141,097.311Broad flat999Aggregate--
15792.53050Sidehill/lower 1/3998Continuous/aggregate-Large
16609.636090Sidehill/lower 1/3600Continuous/aggregateYesSmall
Continuous DF-WH = continuous in total, DF (Douglas-fir) in older age groups and western hemlock in younger age groups; continuous/aggregate = continuous in total, aggregate by species.
All of the studied stands were between 300 m and 1,100 m elevation and within the western hemlock zone” [26]. Most of stands were on side hills of diverse slope angles. Approximately 70% of the study sites contained streams. Half of the stands were on the north-facing slopes and the rest were on east-, south-, or west-facing slopes. Most stands showed either continuous or aggregated age distributions. While only 40% of the stands showed obvious evidence of past fires such as visible fire scars or charcoal, 75% of the stands had evidence of small windthrow events (Table 1).

2.3. Data Collection

A circular, fixed-area 1-ha plot (56 m radius) was established in each studied stand. Sample plots used in this study were part of the Gifford Pinchot National Forest Current Vegetation System (CVS). CVS is the permanent plot grid system established by the USDA Forest Service between 1993 and 2000 [34]. Trees with diameter at breast height (DBH) larger than 122 cm were tallied within the 1-ha plot. Two concentric, fixed radius subplots were established at the center of the 1 ha plot: a 15.6 m radius subplot (0.076 ha) was used for measuring trees with DBH between 33 cm and 122 cm, and an 8 m radius subplot (0.02 ha) was used for measuring trees with DBH between 7 cm and 33 cm. In addition, two or three 8 m radius subplots were randomly assigned to the N, E, S or W end of the 1 ha plot and were also used for measuring trees with DBH between 7 cm and 33 cm. One 15.6 m line transect was established from the plot center to the north direction to measure downed woody debris. The diameter and length of downed woody debris ≥7 cm diameter was measured. Aspect, slope (%), and elevation (m) were measured at the center of each plot.
Trees were tallied in all plots by species and DBH. One representative tree of each species and diameter group (10 cm DBH intervals from 10 cm to 130 cm, plus >130 cm) was selected for coring at breast height to record the age; and height, crown width, height to crown ratio, and crown class of the tree were also measured. Canopy layers were determined by the relative positions of tree crowns with respect to surrounding vegetation. The layers were defined as emergent, dominant, codominant, intermediate, or overtopped based on Smith et al. [35].

2.4. Data Analysis

The stands’ quantified structural features were sorted, organized, and analyzed to determine which features were commonly found together in stands and were related to each other. We converted the field data to quantitative stand measures that have been used to describe old-growth characteristics (Table 2). Western hemlock, western redcedar, and Pacific silver fir were considered to be shade tolerant species in this study [32]. We used 100 cm DBH for the threshold of large Douglas-firs in old-growth stands and the DBH of 50 cm for the threshold for large shade tolerant species and snags, based on previous studies [8,23,36].
Table 2. Quantitative structural variables used for old-growth characteristics in this study, modified from previous studies.
Abbreviation forTable 3 and Table 4Structural ElementsSource of Information and Relevant References
# Tree speciesNumber of tree species
R BA DFRatio of Douglas-fir basal area to total stand basal areaShade intolerant Douglas-fir [37]
R BA STRatio of shade tolerant tree basal to total stand basal areaRatio of shade tolerant species [37]
D trees ≥100 cmNumber of trees ≥100 cm DBH ha−140 (ca. 100 cm) to 60 inches in diameter [36]
D DF ≥100 cmNumber of Douglas-fir ≥100 cm DBH ha−1Douglas-fir older than 200 years [23,36], Douglas-fir trees with DBH of 1 to 2 m [38]
D ST ≥50 cmNumber of shade tolerant trees ≥50 cm DBH ha−1Shade tolerant species ≥50 cm DBH
D snag ≥50 cmNumber of snags ≥50 cm DBH ha−1Density of snags >50 cm DBH and >15 m tall [10], ≥50 cm DBH [38]
D log ≥50 cmNumber of logs ≥50 cm diameter ha−1Density of logs >60 cm diameter [23]
DBH classesNumber of 10-cm DBH classes containing treesStructural heterogeneity [39]
Max DBHMaximum DBH classLarge tree size
Missing DBH ≥ 50 cmNumber of 10-cm DBH classes without trees between 50 cm & max DBH: “missing upper DBH classes”Broken or continuous canopy of medium to large [24]
Missing DBH < 50 cmNumber of 10-cm DBH classes without trees <50 cm DBH: “missing lower DBH classes”Understory absent or consisting of some seedlings [24]
Correlations among structural features were analyzed using the Spearman’s rank correlation among characteristics of the stands because four variables were not normally distributed [40]. Data were tested for normality with the Kolmogorov-Smirnov test and for homogeneity of variance with Levene’s test. Non-metric multidimensional scaling (NMDS) [41] was used to elucidate relationships among quantitative variables of old-growth features and to ordinate the stands based on the Euclidean distance with the PAST program (v. 3.0, Natural History Museum, University of Oslo, Oslo, Norway) [42]. The ordinations were rotated to load the stand structural variable with the highest correlation onto axis one.
The stands were grouped into sub-structures based on cluster analysis using the variables shown in Table 2. Variables were standardized and applied for the cluster analysis. The Ward linkage method and square Euclidean distance measure were used. All variables among stand groups classified by cluster analysis were compared to determine the commonalities of structural features in old-growth forests using one-way analysis of variance (ANOVA) and Tukey’s multiple comparison tests [40]. IBM SPSS Statistics was used for correlation analysis, cluster analysis, ANOVA, and Tukey test (v. 21.0, IBM SPSS Inc, Chicago, IL, USA, 2012).

2.5. Stand Development Reconstruction

Stand development reconstruction techniques [43,44,45] were used to determine if the observed sub-structures could represent a time sequence. We developed temporal/logic statements of the four grouped plots and arranged them to infer a time sequence.

3. Results

3.1. Relationships among Structural Variables

Some stand structure features associated with old-growth forests commonly occurred together and others did not. That is, some of variables showed strong positive or negative relationships with other variables, indicating there is a potential for coexistence of some variables and a relative mutual exclusion of others (Table 3).
Density of trees (trees ha−1) ≥100 cm DBH showed the greatest number of significant correlations with other variables, followed by density of Douglas-firs ≥100 cm DBH. The density of trees ≥100 cm DBH had a significant positive correlation with both the number of missing upper DBH classes (p < 0.001), and the number of missing lower DBH classes (p = 0.013).
The density of Douglas-firs ≥100 cm DBH showed significant positive correlation with the ratio of Douglas-fir basal area to stand basal area (p = 0.002), density of trees ≥100 cm DBH (p < 0.001), number of Douglas-fir DBH classes (p = 0.010), maximum DBH of stand (p = 0.001), and missing DBH classes ≥50 cm DBH (p = 0.009). It showed a significant negative correlation with the ratio of shade tolerant species basal area to stand basal area (p < 0.001).
The ratio of shade tolerant species basal area to stand basal area had a significant positive correlation with density of shade tolerant species ≥50 cm DBH (p = 0.001) and a significant negative correlation with the ratio of Douglas-fir basal area to stand basal area (p < 0.001). The ratio of Douglas-fir basal area to stand basal area showed an opposite pattern of correlation of the ratio of shade tolerant species basal area to stand basal area with the same variables.
Table 3. Spearman correlation coefficients for the different variables attributed to old-growth stands. Variables represent Douglas-fir or shade tolerant species dominance, density of large trees, snags, and logs, and DBH distributions. See Table 2 for variables and abbreviations.
Variable (See Table 2)# Tree SpeciesR BA DFR BA STD Trees ≥100 cmD DF ≥100 cmD ST ≥50 cmD Snag ≥50 cmD Log ≥50 cmDBH ClassesDF DBH ClassesMax DBH ClassMissing DBH ≥ 50 cm
R BA DF−0.291
R BA ST0.203−0.900 ***
D trees ≥100 cm−0.515 *0.546 *−0.577 *
D DF ≥100 cm−0.4150.715 **−0.821 ***0.867 ***
D ST ≥50 cm0.060−0.681 **0.762 **−0.227−0.487
D snag ≥50 cm−0.2430.103−0.0940.2140.3030.213
D log ≥50 cm0.403−0.2750.284−0.140−0.2440.360−0.113
DBH classes−0.0970.373−0.2980.1260.3310.0950.296−0.146
DF DBH classes−0.2200.920 ***−0.852 ***0.3950.622 *−0.760 **−0.018−0.1440.243
Max DBH class−0.2450.409−0.4580.869 ***0.753 **−0.0180.349−0.0480.1620.268
Missing DBH ≥50 cm−0.0670.229−0.3320.786 ***0.629 **0.0550.3040.0900.0200.1100.958 ***
Missing DBH <50 cm−0.756 **0.468−0.3130.603 *0.415−0.1550.045−0.368−0.0480.3440.4490.306
***: p < 0.001; **: p < 0.01; *: p < 0.05, D: density (number of stems ha−1), BA: basal area (m2 ha−1).

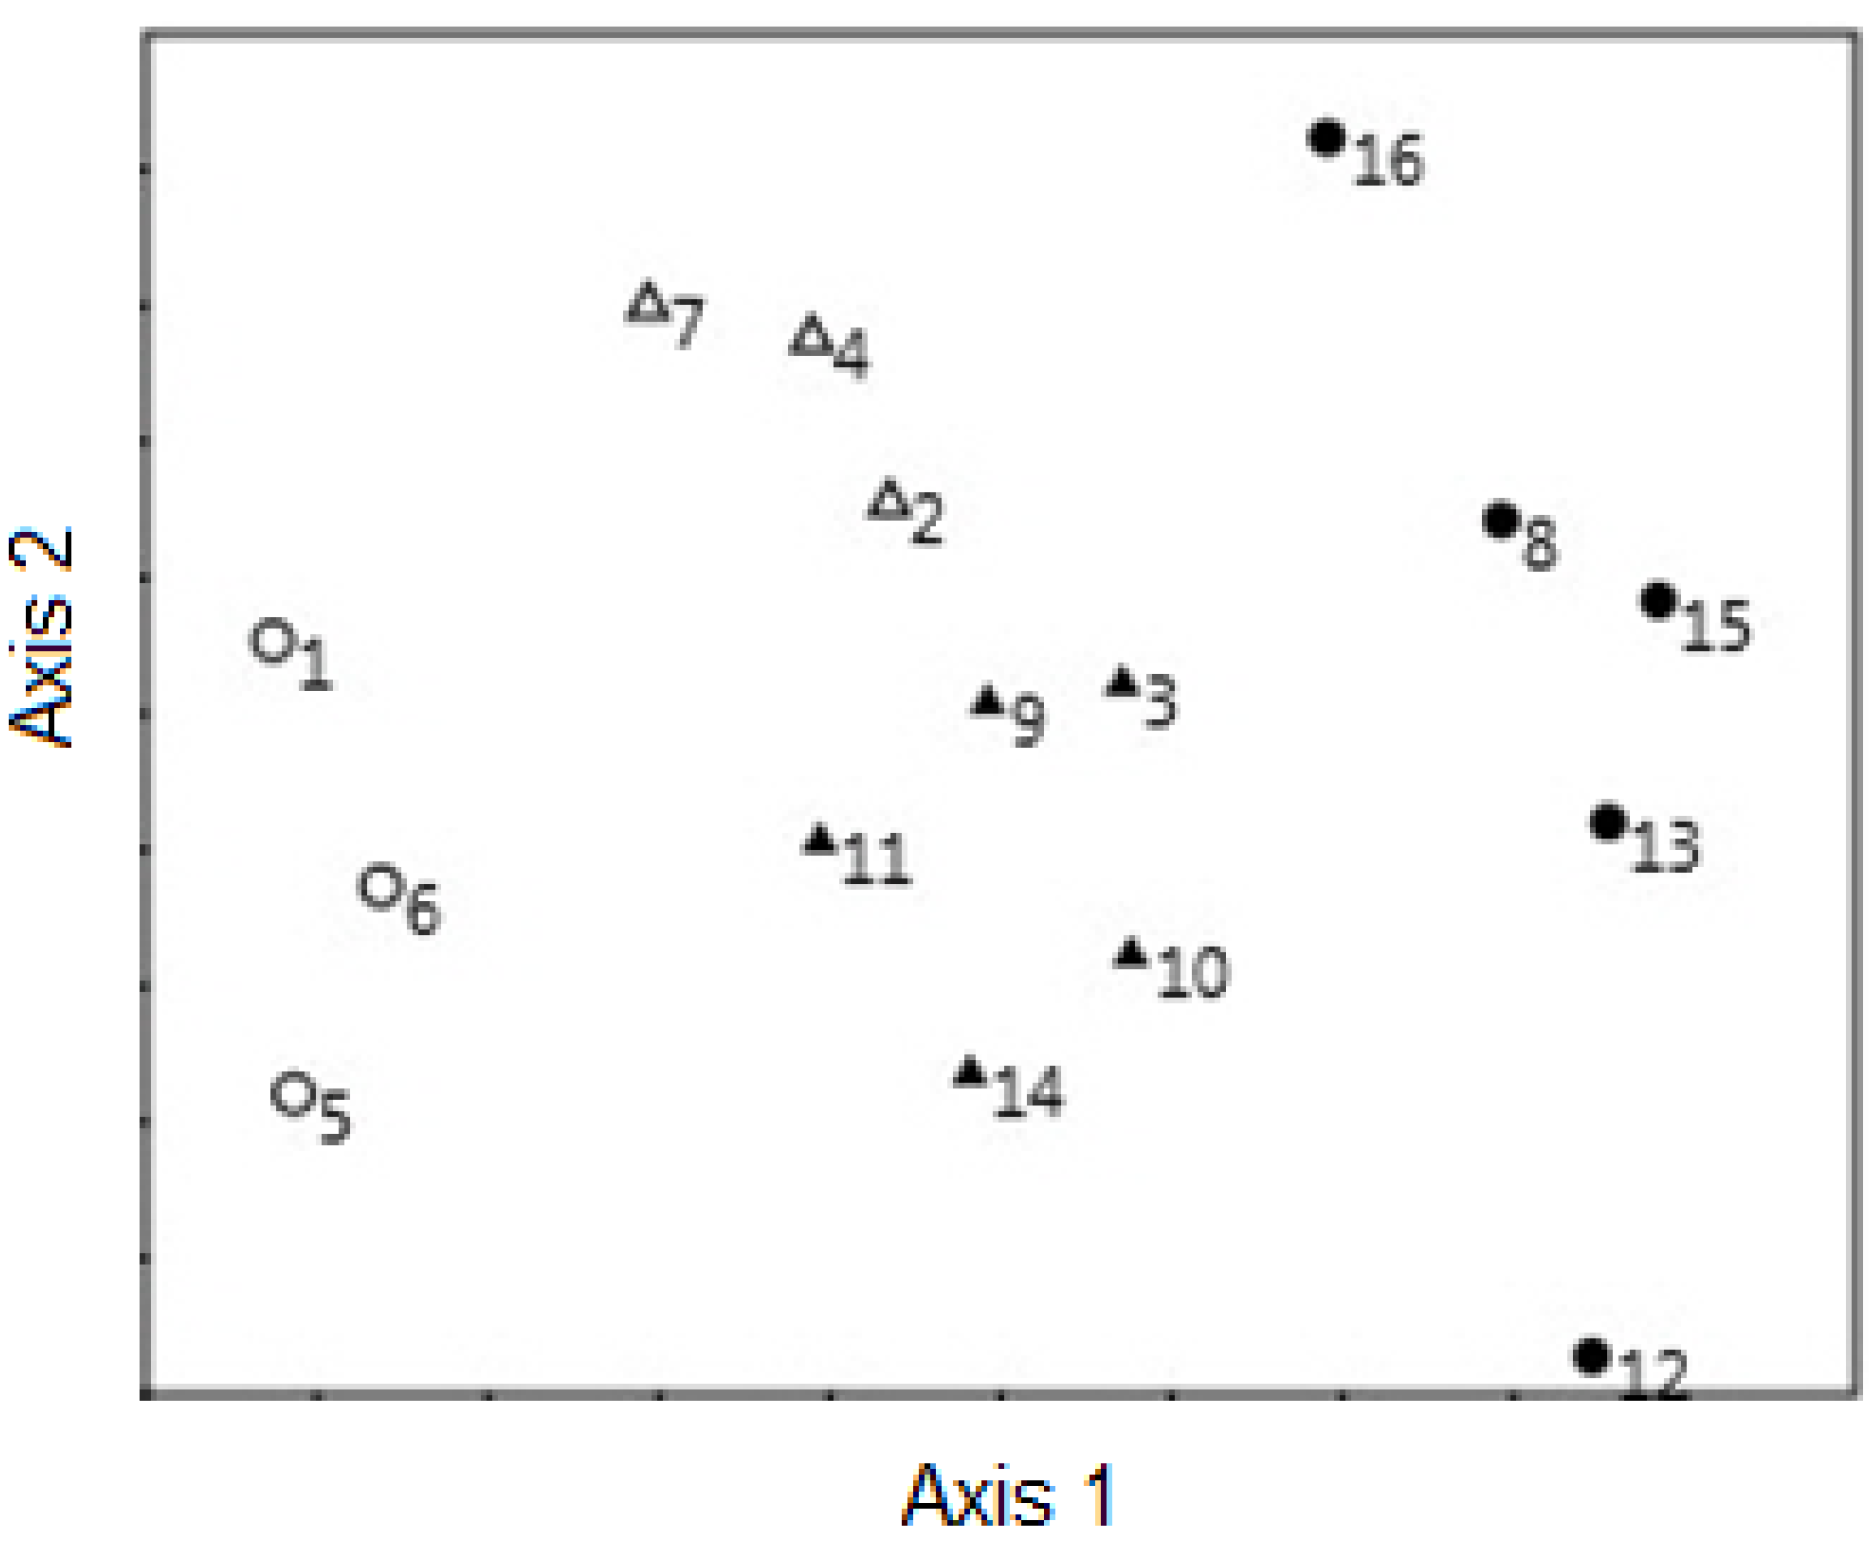
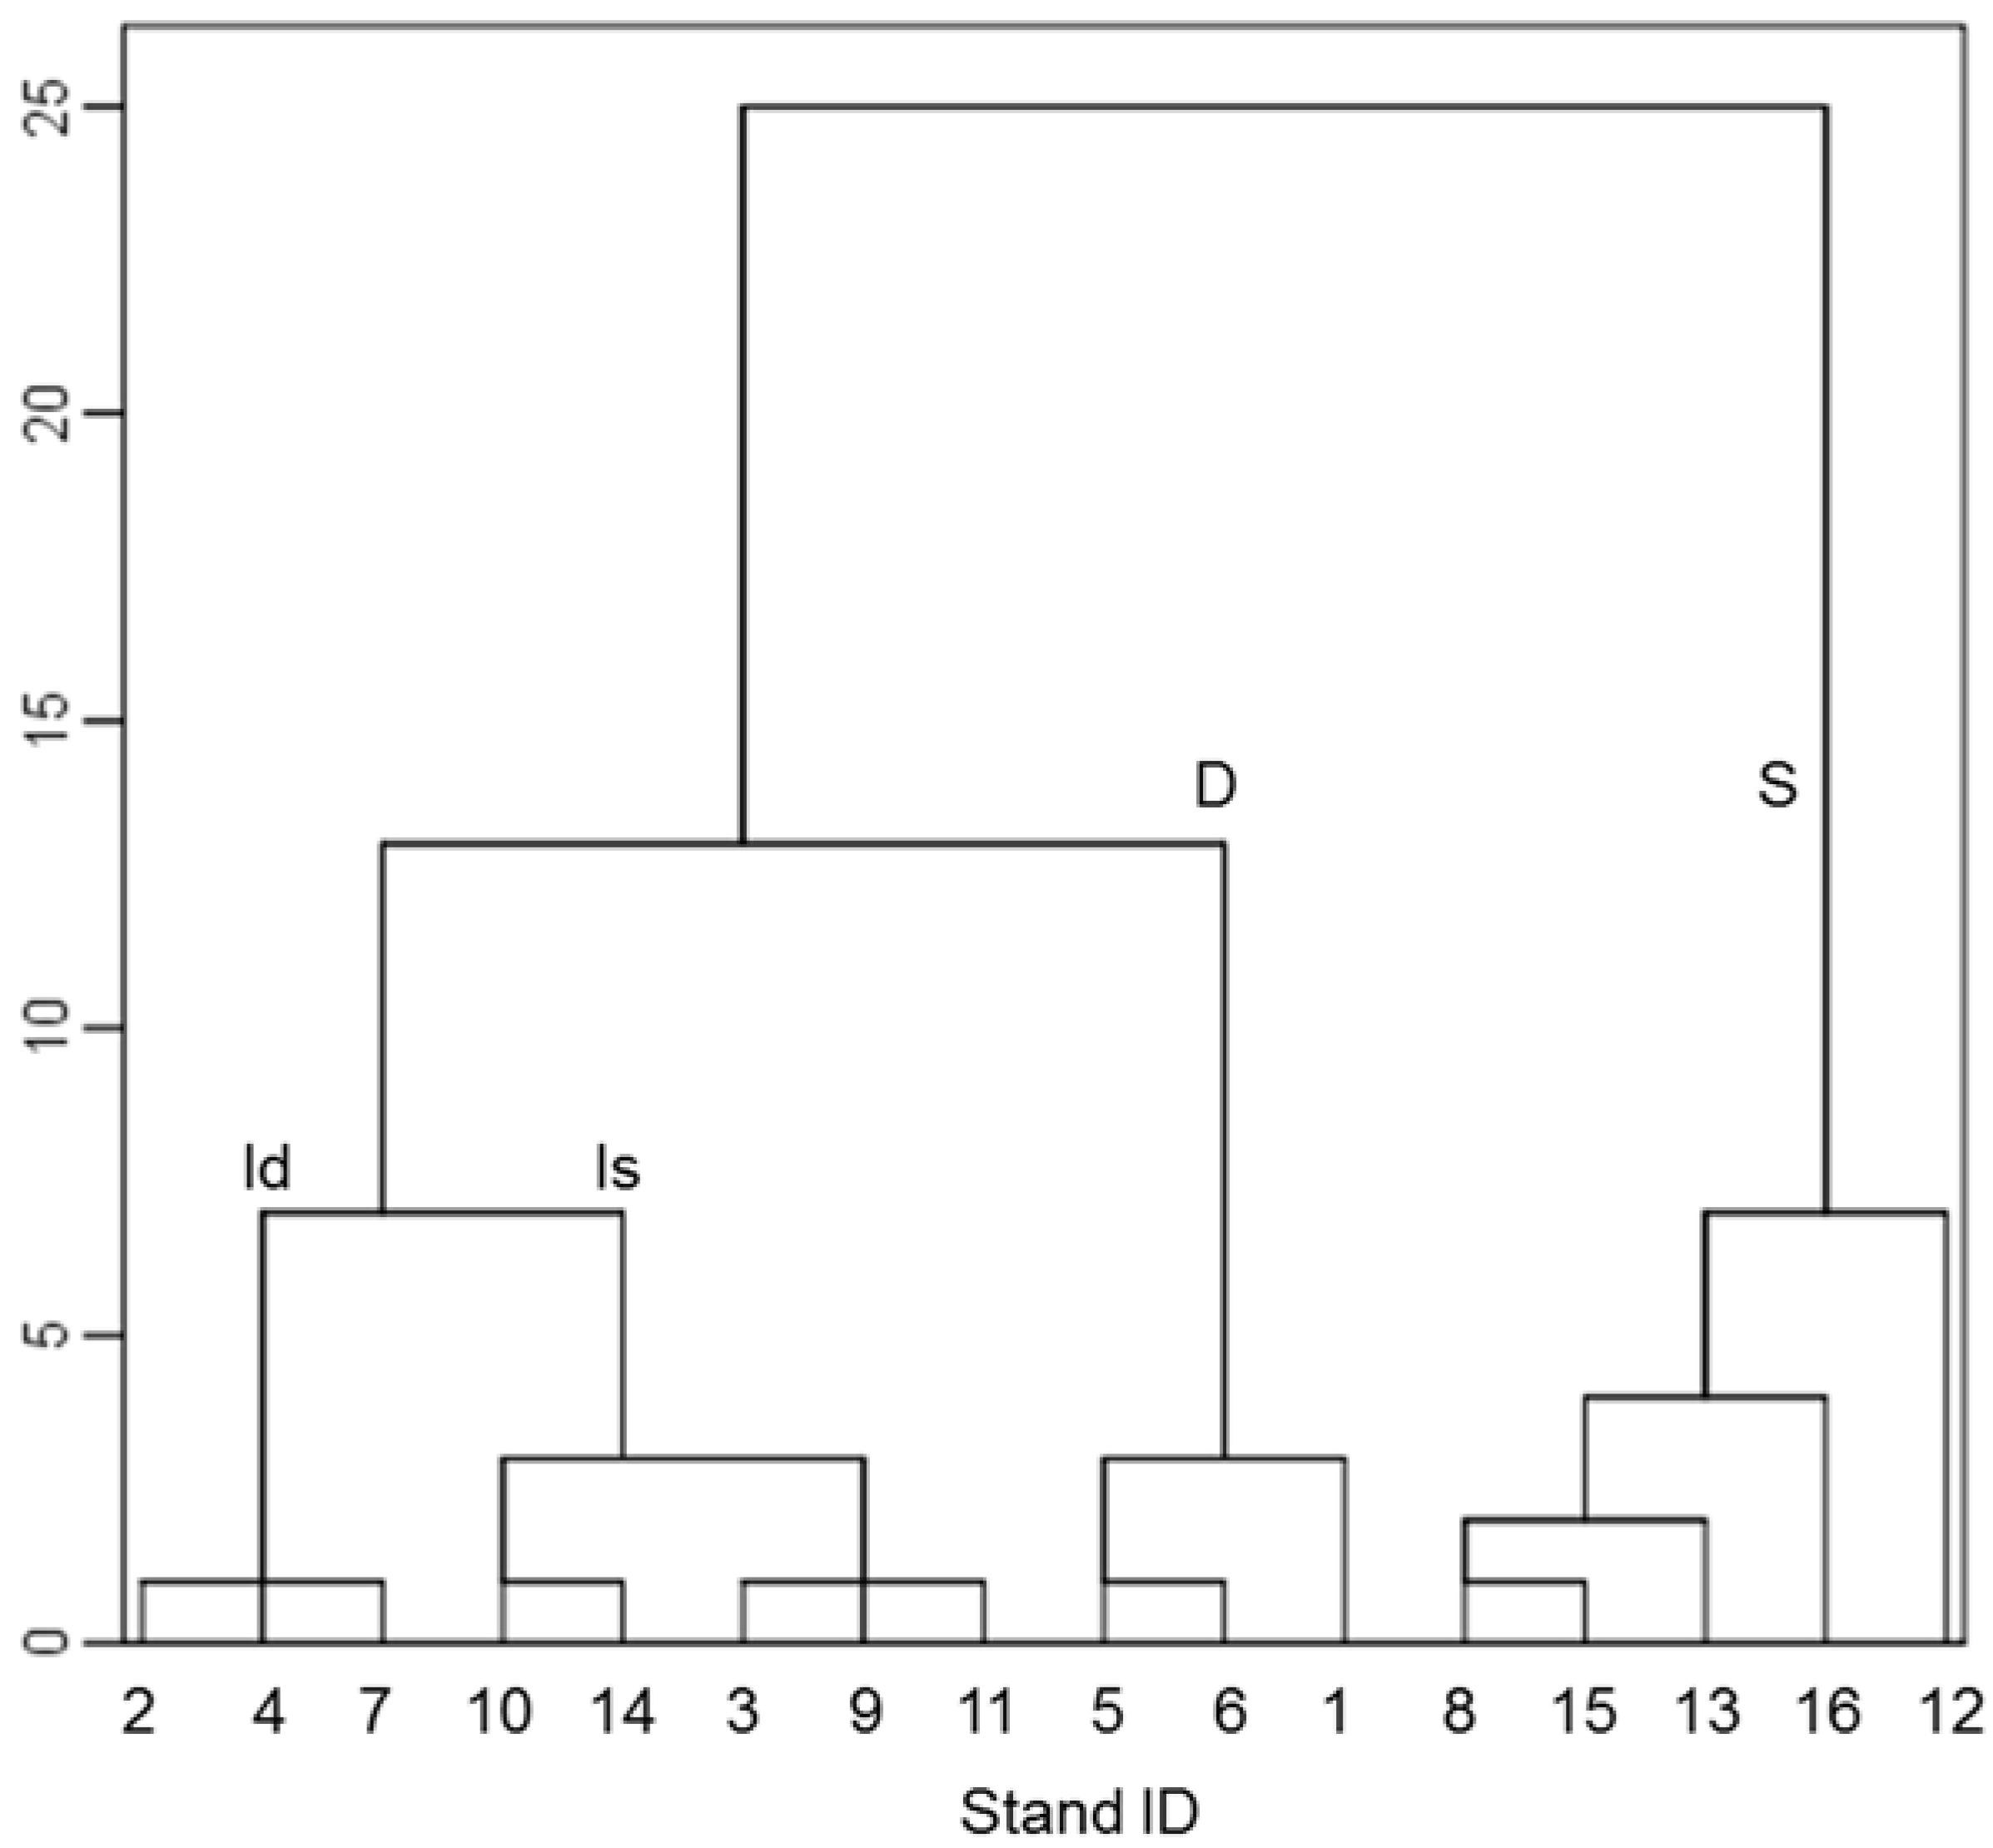
3.2. Non-Metric Multidimensional Scaling and Grouping of Stands

The first dimension of NMDS corresponds with dominant species, the ratio of Douglas-fir basal area—the ratio of shade tolerant species basal area. The density of Douglas-firs ≥100 cm DBH and number of Douglas-fir DBH classes were negatively related with the first axis, and shade tolerant species ≥50 cm DBH was positively related with the first axis. The second dimension reflects the density of snags ≥50 cm DBH, which was negatively related with the second axis. The stress was 0.1261. The R2 of the first axis and second axis were 0.72 and 0.13, respectively (Figure 1).
Figure 1. Non-metric multidimensional scaling ordination for sixteen study sites. The analysis was based on the twelve stand structural variables attributed to old-growth. Variables are shown in Table 2. Stress is 0.126. Numbers indicate the stand identification (ID) and each symbol represent the stand groups in Figure 2. Filled circle: group S (shade tolerant species dominant), filled triangle: group Is (Intermediate-shade tolerant species dominant), triangle: group Id (Intermediate-Douglas-fir dominant), and circle: group D (Douglas-fir dominant).
Forests 06 03177 g001
Stands were classified into two groups as shade-tolerant species dominant (Group S) and Douglas-fir dominant-intermediate stands at distance level 25. The Douglas-fir dominant-intermediate stands were classified into two groups as Douglas-fir dominant (Group D) and intermediate stands at distance level 12 (Figure 2). Thus, stands could be classified into three groups as shade tolerant species dominant, Douglas-fir dominant, and intermediate groups. Intermediate groups were classified into two groups at distance level 6 as Intermediate-shade-tolerant species dominant group (Groups Is) and Intermediate-Douglas-fir dominant group (Group Id). The groups are:
  • Group S: Stands 8, 12, 13, 15 & 16 (Table 1)
  • Group Is: Stands 3, 9, 10, 11 & 14 (Table 1)
  • Group Id: Stands 2, 4 & 7 (Table 1)
  • Group D: Stands 1, 5 & 6 (Table 1)
Figure 2. Hierarchical cluster analysis of 16 old-growth stands using Ward linkage, square Euclidean distance and Amalgamation steps as similarity measurements. Variables are shown in Table 2. Group S: shade-tolerant species dominant stands, Group D: Douglas-fir dominant stands, Group Id and Is: Intermediate stands.
Forests 06 03177 g002
Dominant species and large log density were important both in stand mapping in NMDS and stand grouping in cluster analysis. Douglas-fir or shade tolerant species dominance explained stand mapping in the first dimension in NMDS and stand grouping in cluster analysis. The large log density explained the second dimension in NMDS and in classifying intermediate groups.

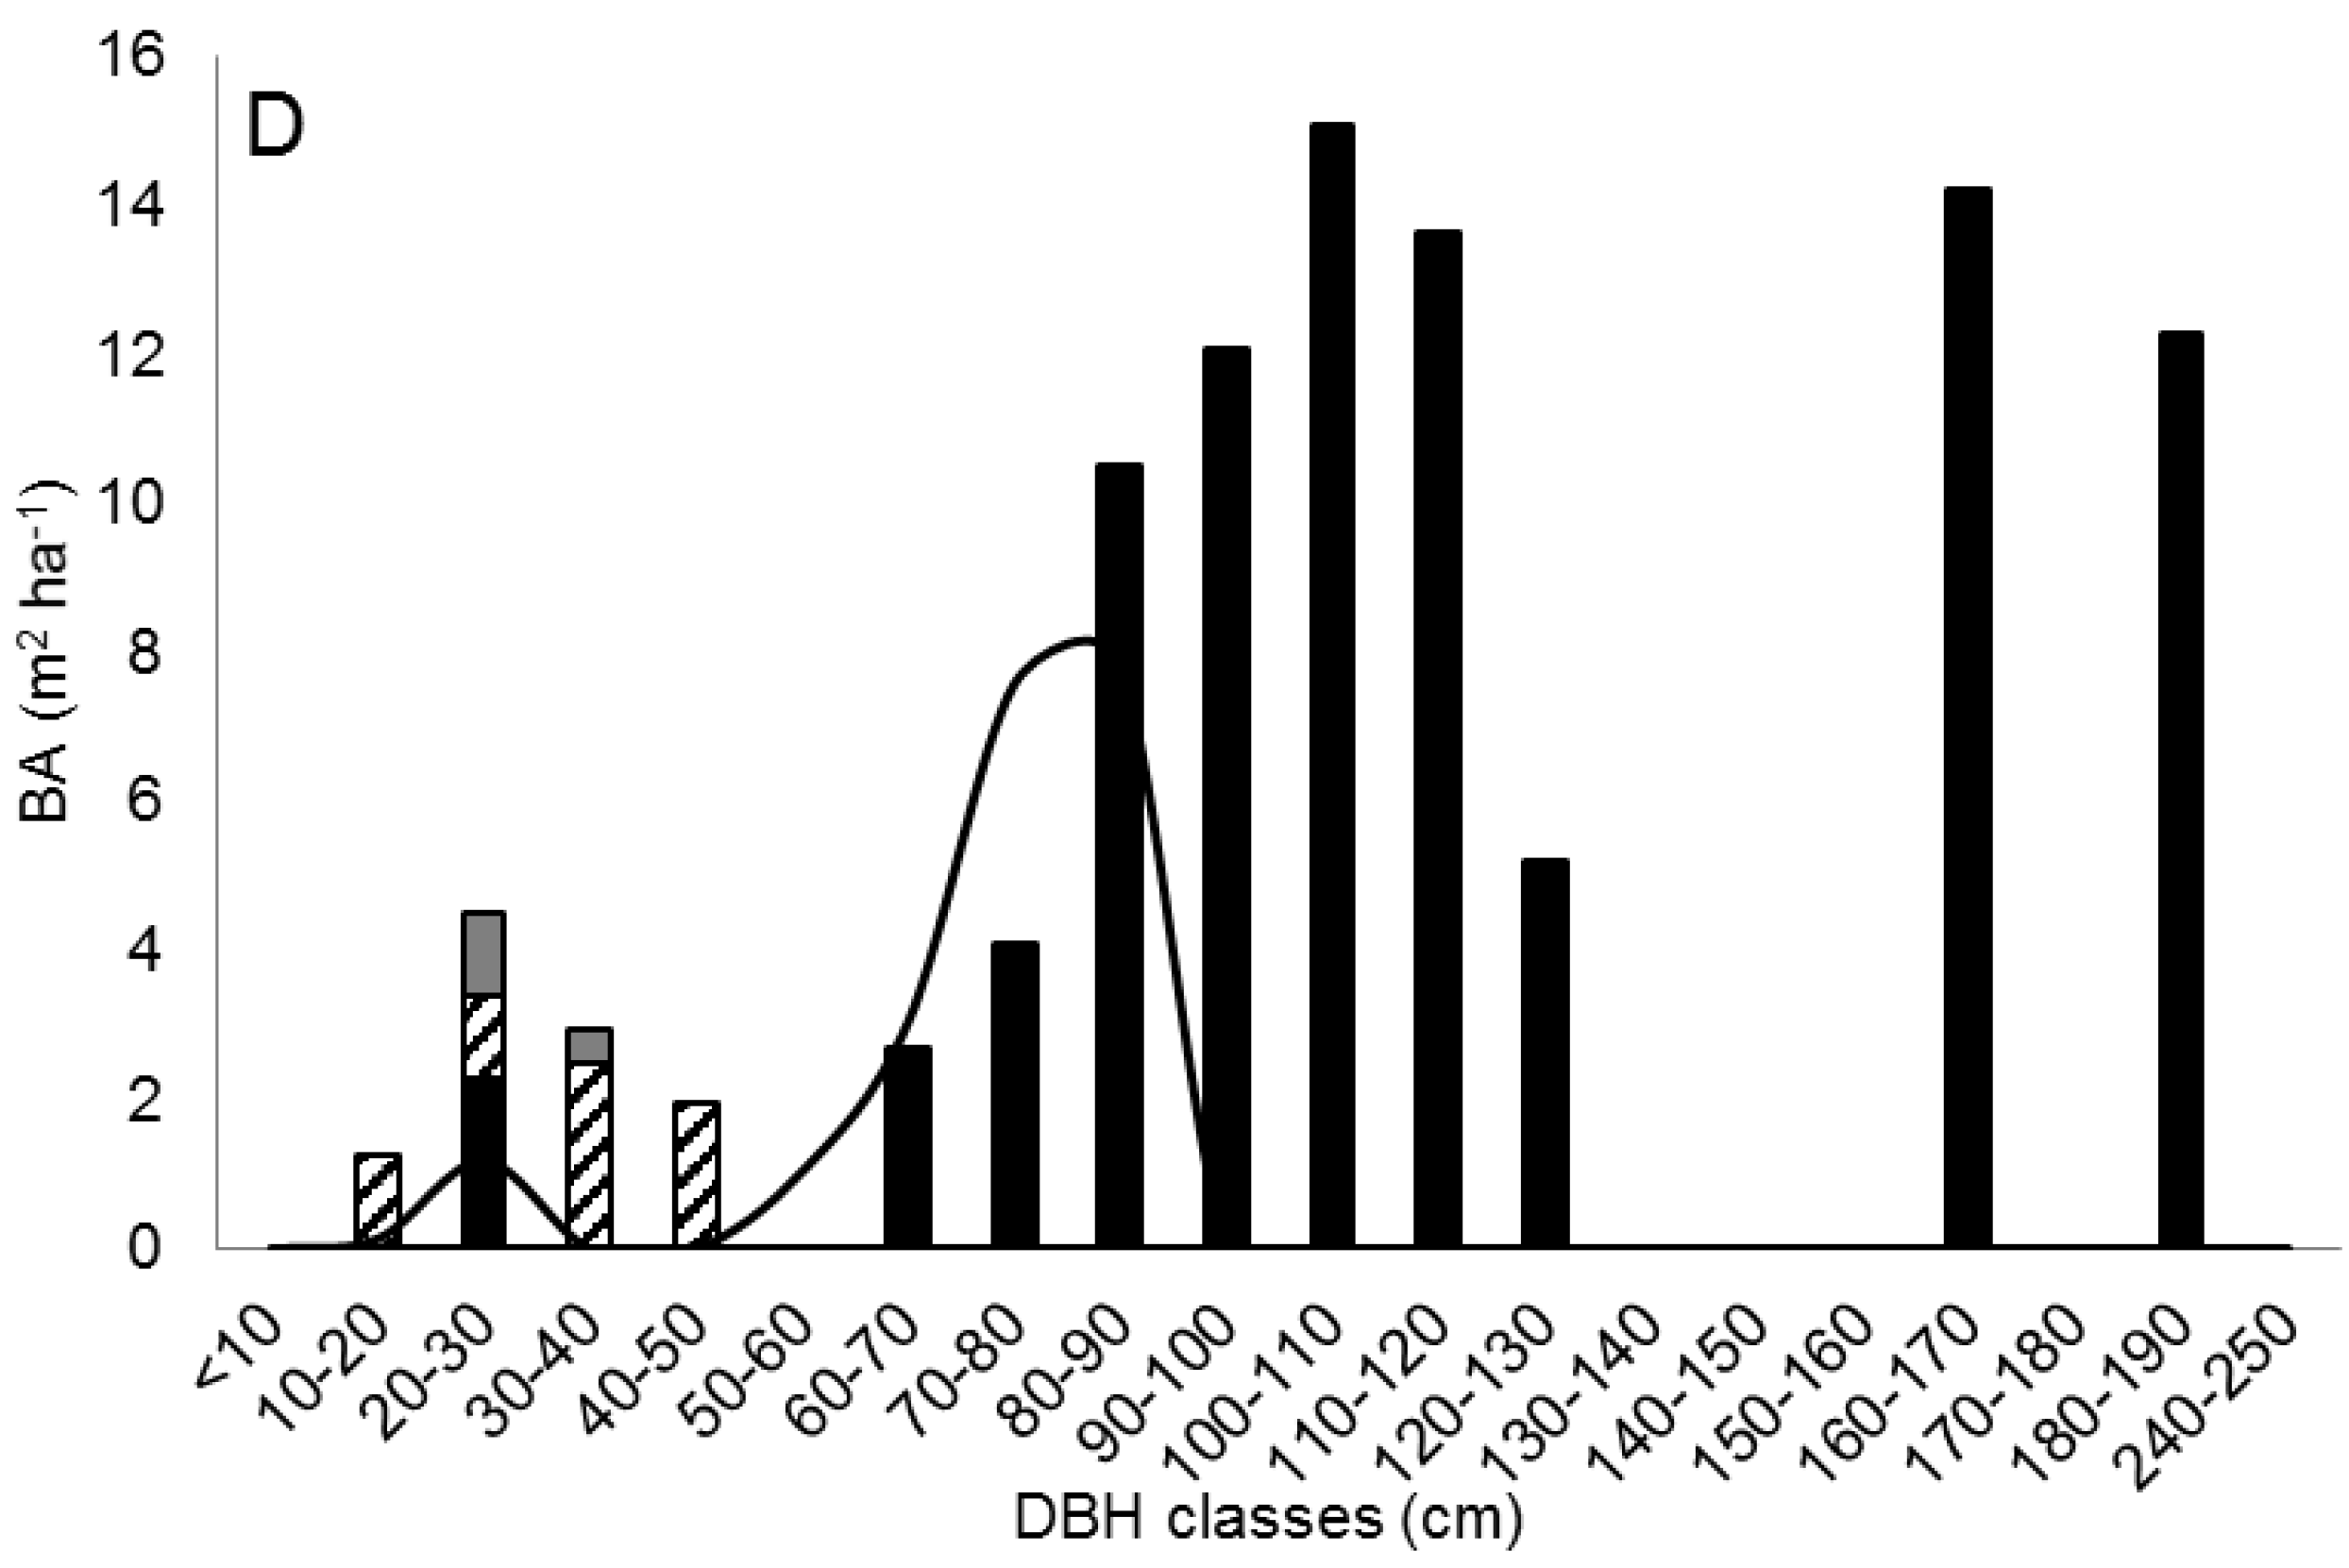
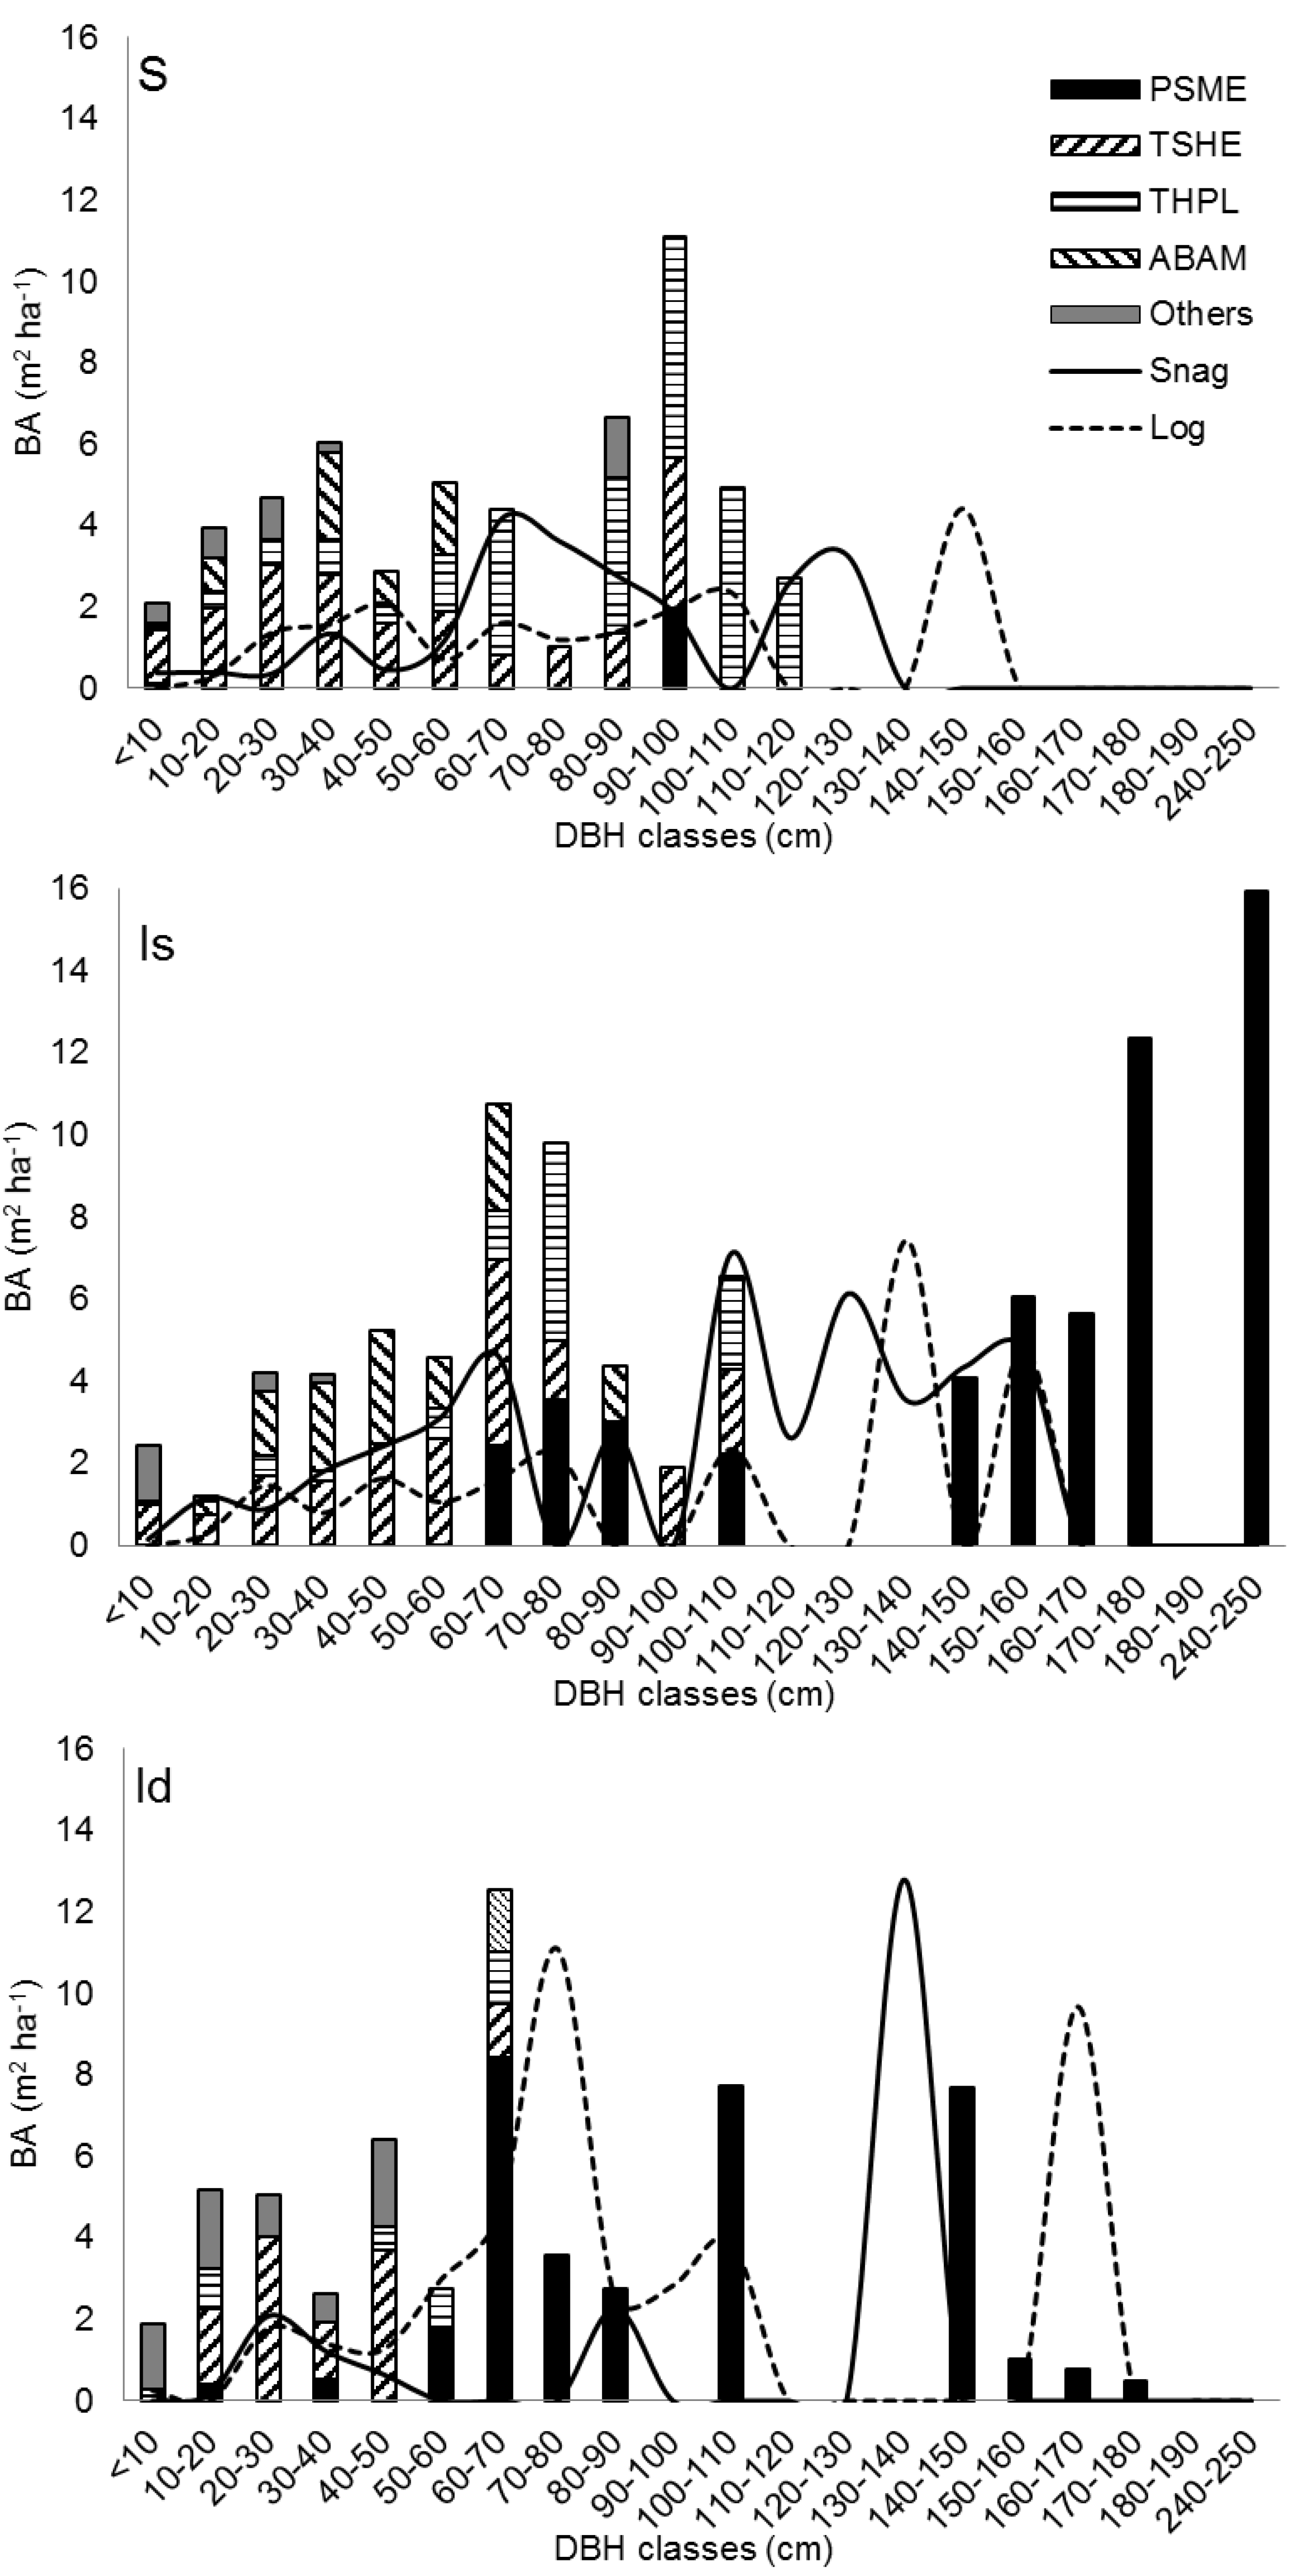
3.3. Structural Characteristics of Grouped Stands

Stands in group S had over 70% of the stand basal area occupied by shade tolerant species, while Douglas-fir was almost absent except in stand 12, which had a Douglas-fir basal area of 13% (Figure 3). Western redcedar occupied the majority of the basal area in DBH classes over 60 cm and western hemlock occupied over 50% of the basal area in DBH classes <50 cm.
Groups Is and Id had intermediate patterns between groups S and D. Both Is and Id groups had missing trees in DBH classes between 110–140 cm. Group Is had more stand basal area occupied by shade tolerant species than group Id in DBH classes ≥50 cm. The snags and logs over 100 cm DBH occupied over 40% of the total snag and log basal areas in groups Is and Id.
Douglas-fir occupied over 80% of the stand basal area in group D. Stands in group D consisted of almost pure Douglas-firs in DBH classes ≥50 cm, whereas DBH classes <50 cm were mostly occupied by western hemlocks and other species in group D.
While DBH distribution was quite continuous in group S, the other groups (Is, Id and D) had discontinuous DBH distributions with missing trees in DBH classes over 100 cm. The DBH distribution of Douglas-firs was discontinuous with large Douglas-fir snags. In most stands, few Douglas-firs existed in the smaller DBH classes (<50 cm). The incidental presence of Douglas-firs in the small DBH classes in groups Id and D might have been the result of localized regeneration opportunities created by partial disturbances [4]. In contrast, western hemlocks and western redcedars maintained a continuous DBH distribution.
Figure 3. DBH distributions by species of groups S, Is, Id, and D classified by cluster analysis (Figure 2). Data are means of stands belonging to the same groups. Snags and Logs = line graphs; Species = bar graphs. PSME: Pseudotsuga menziesii (Mirb.) Franco, TSHE: Tsuga heterophylla (Raf.) Sarg., THPL: Thuja plicata Donn ex D. Don, and ABAM: Abies amabilis (Dougl) Forbes. Others: Abies grandis (Douglas ex D. Don) Lindl., Abies procera Rehder, Acer circinatum Pursh, Acer macrophyllum Pursh, Alnus rubra Bong., Taxus brevifolia Nutt., and Vaccinium parvifolium Smith.
Forests 06 03177 g003aForests 06 03177 g003b

3.4. Differences and Similarities in Structural Features of Grouped Stands

Among stands investigated, some variables attributed to old-growth characteristics were common among groups while other variables did not overlap in different groups.
Species composition, log density, and density of large sized trees were significantly different among different groups (p < 0.05, Table 4). The ratios of Douglas-fir basal area to stand basal area in group S and group D were significantly lower and higher, respectively, than that in groups Is and Id (p < 0.05). In contrast, the ratio of basal area of shade tolerant species to stand basal area was significantly higher in group S and significantly lower in group D than that in groups Is and Id (p < 0.05).
Groups D and S showed significant differences in the density of large trees including Douglas-firs ≥100 cm DBH and shade tolerant species ≥50 cm DBH. Most stands had trees in more than seven DBH classes (10 cm class intervals), indicating that the old stands had trees with DBH’s larger than 70 cm. About 63% of the stands had trees with DBH’s larger than 100 cm. DBH distributions were discontinuous in the DBH classes beyond 110 cm in most stands. Group Id had significantly higher densities of logs with DBH’s ≥50 cm than the other groups (p = 0.001). Group D had significantly higher numbers of missing DBH classes in DBH classes <50 cm (p = 0.020).
Consequently we identified and classified the old-growth stands into four sub-structures by dominant species: Douglas-fir dominant (group D), shade-tolerant species dominant (group S), and intermediate stands (groups Id and Is). Old stands dominated by large Douglas-firs were linked with large-sized trees and diverse DBH distributions but lacked small trees in the understory and shade tolerant species in large DBH classes [19]. Stands dominated by shade tolerant species displayed few trees ≥120 cm DBH and mostly consisted of shade tolerant species.
Table 4. Mean values of variables in groups shown in Table 2.
Abbreviation (Table 2)Group DGroup IdGroup IsGroup SMean
R BA DF91.0 (1.7) a57.9 (4.8) b57.0 (3.2) b2.8 (2.5) c46.6 (8.4)
R BA ST7.6 (2.9) a36.8 (3.6) b42.5 (4.1) b86.3 (4.3) c48.6 (7.5)
D trees ≥100 cm44 (4.4) a13 (7.6) b24 (7.7) ab8 (5.3) b21 (4.5)
D DF ≥100 cm44 (4.7) a13 (7.5) b18 (6.6) b0 b17 (4.6)
D ST ≥50 cm0 b17 (4.3) ab66 (9.3) a66 (14.4) a44 (8.8)
D snag ≥50 cm44 (23.2) ns17 (4.3) ns42 (7.8) ns39 (21.6) ns37 (8.0)
D log ≥50 cm0.0 b61 (8.8) a21 (6.6) b21 (6.6) b25 (5.9)
DBH classes8.7 (0.7)8.0 (0.6)9.2 (0.5)7.8 (0.6)8.4 (0.3)
DF DBH classes6.0 (1.0) a4.3 (0.3) ab2.6 (0.5) bc0.4 (0.2) c2.9 (0.6)
Max DBH class16 (2.1) ns11 (2.0) ns16 (2.7) ns10 (1.0) ns13 (1.2)
Missing DBH ≥50 cm5.3 (2.0) ns3.3 (2.4) ns6.2 (2.6) ns1.8 (0.7) ns4.1 (1.0)
Missing DBH <50 cm2.0 (0.0) a0.0 (0.0) b1.0 (0.5) ab0.2 (0.2) b0.8 (0.3)
D = density (number of stems ha−1); BA = basal area (m2 ha−1). Numbers in parentheses are SD. Values followed by the same letter are not significantly different among groups at p < 0.05 according to Dunnett T3 for D DF ≥ 100 cm and Tukey’s multiple range test for the other variables. “ns” means not significantly different among groups.

3.5. Reconstruction of a Sequential Change in Stand Structures

The developed and arranged temporal/logic statements were:
  • In all plots with Douglas-firs, the largest western hemlocks and western redcedars are noticeably smaller than the largest Douglas-firs, suggesting that the three species were or had been growing together and/or the hemlocks and redcedars were younger.
  • In S, the hemlocks and redcedars are small for the age of the stand but there are no larger trees of any species, suggesting they are either young or are/were suppressed—in either case by larger trees that are no longer alive. This indicates a sequence of “S occurring later than D, Id, and Is.”
  • The order “D, Id, and Is” shows increasingly fewer numbers of Douglas-firs but increasingly greater diameters of the largest Douglas-firs and indicates a possible sequence in that order.
  • The order “D, Id, and Is” shows increasingly fewer numbers of large Douglas-firs, but increasing numbers of snags and logs of large sizes, indicating a possible sequence of the large Douglas-firs dying.
  • The order “D, Id, and Is” showed increasing gaps in the diameter distribution of large Douglas-firs, indicating a possible sequence with the overstory developing gaps.
  • The near absence of large Douglas-firs in S, but the presence of snags and logs much larger than present shade tolerant species indicates a sequence of “S occurring later than D, Id, and Is.”
These statements suggests that the sub-structures in (Figure 4) are sequentially changing along the trajectory “D, Id, Is, to S.” These also reflect the changes in old-growth sub-structures suggested by both Oliver and Larson [4] and Franklin et al. [5] (Table 5).
Table 5. Comparison of “old-growth” substructures suggested by Franklin et al. [5] and Oliver and Larson [4].
Franklin et al. [5]Oliver and Larson [4]Sub-structure categories in this paper:
Vertical DiversificationTransition Old-growthD
Horizontal DiversificationTransition Old-growthId & Is
Pioneer Cohort LossTrue Old-growthS
Oliver and Larson [4] did not distinguish the sub-structure of group D from groups Id and Is in the “Transition Old-Growth” sub-structure described for D; however, others did anticipate this distinct sub-structure. Spies and Franklin [38] identified both a “Late Transition Phase” and a “Shifting Gap Phase” that describe parts of the processes suggested in D, Id, and Is.

4. Discussion

Old-growth forests have been characterized as having structural characteristics of large sized trees and snags, large down woody debris, and complex canopy structures and DBH distributions [8,13,46]. Many of these characteristics are rarely found together in a stand and others are commonly found together.
The stand structure class known as “old-growth” can be refined to reflect several possible sub-structures. These sub-structures continue to change in species composition from Douglas-fir-dominant to shade tolerant species-dominant stands (Figure 4a). Stands may change from group D to group S, with the ratio of Douglas-fir basal area to stand basal area decreasing and the ratio of shade tolerant species basal area to stand basal area increasing, showing shade tolerant species replacing the long-lived Douglas-fir pioneer species. Increases in the density of snags ≥50 cm was followed by increases in the density of logs ≥50 cm. The changes in maximum DBH of stands coincided with the changes in number of missing DBH classes between 50 cm and the maximum DBH classes (Figure 4b).
The DBH distributions of each species in stands grouped by the cluster analysis and the temporal arrangement of the grouped stands offer further insights into how the stand development processes might have occurred. Douglas-firs in group D probably established after a catastrophic fire or other catastrophic disturbance, grew vigorously, and dominated the stands. Fire often eliminated most of the previous stand, leaving only a few large trees, primarily thick-barked Douglas-firs that were large enough to survive the fire [46,47].
Figure 4. Changes in structural variables attributed to old-growth variables by grouped stands (sub-structures) temporally arranged based on the similarity in clustering analysis and oldest tree age. Variables are shown in Table 2. Solid arrows in (a) indicate pathogen damage and double-line arrows indicate wind damage detected in the stands.
Forests 06 03177 g004
The increasing dominance of shade tolerant species with stand development is largely because the shade intolerant Douglas-firs survive poorly under the canopy of other trees [48]. Shading probably prevented Douglas-fir seedlings from becoming established [49,50]. The occasional understory Douglas-fir found in a few stands might have grown in small gaps in the multi-layered canopy structure [4]. The disturbances and light limitations created by a multi-layered canopy structure are the main factors controlling the species composition in the older stands [51]. The light limitation caused the concentration of Douglas-firs in large DBH classes and the paucity or non-existence of Douglas-firs in DBH classes <50 cm [48]. The lack of young Douglas-firs replacing the senescing Douglas-firs in the dominant layer results in a discontinuous diameter distribution of this species in groups D, Id, and Is. Conversely western hemlocks, western redcedars, and Pacific silver firs could become established and survive successfully under a canopy and subsequently maintain more continuous diameter distributions. In group S, however, individual tree deaths probably created discontinuities of shade tolerant species in the larger diameter classes. Western hemlock has a high regeneration rate, but the basal areas of western hemlocks were distributed quite evenly in the DBH classes <70 cm, while the relative basal area of western hemlock decreased beyond DBH classes >70 cm in groups Is and S, suggesting that many western hemlocks died before reaching the large sizes of Douglas-firs or western redcedars. The gaps in DBH classes indicate that deaths of large “pioneer” Douglas-firs in these stands have led to large gaps and more horizontal variation within the stand.
The clumped DBH distributions found in groups D, Id, and Is can be explained by: (i) a combination of factors including cumulative tree deaths from senescence, a lack of long-lived shade tolerant species such as western redcedar in a stand and the differences in life expectancies of the dominant species [52]; or (ii) disturbances [53]. Douglas-firs and western redcedars can live up to 1000 years or more, while western hemlocks rarely lives beyond 400 years [6,14,54]. While long-lived Douglas-firs survived primarily in large DBH classes, mature western hemlocks in the upper canopy strata appeared to senesce and die before they reached the size of large Douglas-firs, releasing growing space for the younger western hemlocks that survived in the understory.
Some of the observed old-growth stands had experienced minor disturbances in the past [18]. As stands grow older, the possibilities of disturbances increase. Small disturbances eliminating one to several trees in the upper canopy layer create gaps and provide opportunities for understory shade tolerant species to be released and new seedling to become established, resulting in a multi-cohort structure [55]. Such small-scale disturbances occur to large, old trees and result in discontinuities of diameter distributions in the larger diameter classes. Without fire, the tree death is likely to be from senescence or small disturbances such as localized wind throws or decay. By contrast, even ground fires would generally eliminate most shade tolerant, fire-susceptible species such as western hemlocks, western redcedars, and Pacific yews.
Old-growth forests have been characterized as having trees of large sizes, snags, and down woody debris [56]. However, large Douglas-fir trees may not necessarily mean that the stand is older than the stand which does not have large Douglas-firs. A stand could remain without large disturbances long enough for the large Douglas-firs to senesce and die without younger Douglas-firs becoming established and growing.
Snag basal area can change easily because decayed snags can fall apart at any time, especially in the old stands. The correlation results (Table 3) showed that large snag presence was not significantly correlated with other old-growth features. The high snag basal area in DBH classes ≥100 cm in groups Id and Is are likely caused by Douglas-fir senescence, while the high snag basal area in DBH classes 40–100 cm in groups S and D could be caused by mortality from either vertical differentiation or senescence [57]. The major source of snags with DBH <50 cm was probably western hemlock mortality. Similar basal areas of hemlocks in most DBH classes <50 cm suggest that large numbers of western hemlocks were naturally thinned by competition as others grow to the next DBH class.
The variations and general development pattern of old forest structures in this study suggest that the stand structure class known as “old-growth” can be refined into sub-structures to reflect its variations. The subdivisions suggested by Franklin et al. [5] probably most clearly reflect the processes suggested by this study.
In most forests in the Pacific Northwest, disturbances occur before the long-lived Douglas-firs die; and so the Pioneer Cohort Loss sub-structure is rarely achieved. Most of the stands of this study, and probably most forests referred to as “old-growth” in the Pacific Northwest, are not in this condition. Instead, they contain large trees, multiple canopies, and some—but not necessarily all—of the other features described as old-growth characteristics. They would be classified as being in the “Vertical Diversification” and “Horizontal Diversification” stages of Franklin et al. [5].
The long life span of the dominant pioneering species, Douglas-fir, played an important role in the structure and development of the “old-growth” structures. In forests where the dominating pioneers do not live long, it is possible that the Horizontal Diversification and Pioneer Cohort Loss stages are reached sooner and more often, since there is less time for stand-replacing disturbances to occur. It is also possible that different processes could be occurring in those forests than the processes described here.

5. Conclusions

Stand structure classifications are helpful in describing wildlife guild habitats; however, the category commonly referred to as “old-growth” had diverse stand structural features and could be subdivided into several sub-structures. The old-growth forests continue to change and are the product of their past species composition, age, and disturbance history.
Tree species compositions appear to change over time with and without the influences of minor disturbances. Shade tolerant species such as western hemlocks and western redcedars took over dominance in terms of tree numbers and basal areas from Douglas-firs as the stands apparently grew older. Douglas-firs generally remained the largest trees in the stands until they died.
A general pattern of development in generally termed “old-growth” forests of the Pacific Northwest, U.S.A., seems to be occurring. At first, the long-lived pioneer Douglas-firs first (D; Figure 4a) create a distinctive vertical canopy above the more shade tolerant species, followed by a time when the dying Douglas-firs create horizontal gaps and snags (Id and Is). Barring stand-replacing disturbances, all of the pioneer Douglas-firs eventually die, forming a stand (S) dominated by shade tolerant species that had grown upward during D, Id, and Is.

Acknowledgments

This study was funded by the USDA Forest Service Cowlitz Valley Ranger District, and Landscape Management System project of Silviculture Laboratory, College of Forest Resources (now College of the Environment), University of Washington, a cooperative project with USDA Forest Service Pacific Northwest Research Station. We thank Ed Tompkins and Buddy Rose in the USDA Forest Service Cowlitz Valley Ranger District for the data collection, and Dell Neeham in the USDA Forest Service Mt. Baker-Snoqualmie National Forest for the information of the GPCVS data. We also thank C. Larry Mason, Patrick J. Baker and the members of the Silviculture Laboratory, College of Forest Resources, University of Washington for their help, comments, and suggestions during the fieldwork and data analysis.

Author Contributions

Pil Sun Park conceived and designed the study, carried out field work, analyzed data and prepared the manuscript. Chadwick D. Oliver supervised the study, analyzed data, reviewed and edited the work.

Conflicts of Interest

The authors declare no conflict of interest.

References

  1. Booth, D.E. Estimating prelogging old-growth in the Pacific Northwest. J. For. 1991, 89, 25–29. [Google Scholar]
  2. Forest Ecosystem Management Assessment Team (FEMAT). Forest Ecosystem Management: An Ecological, Economic, and Social Assessment. Draft Supplemental Environmental Impact Statement: On Management of Habitat for Late-Successional and Old-Growth Forest Related Species within the Range of the Northern Spotted Owl; FEMAT: Washington, DC, USA, 1993. [Google Scholar]
  3. Hedman, C.W.; van Lear, D.H.; Swank, W.T. In-stream large woody debris loading and riparian forest seral stage associations in the southern Appalachian Mountains. Can. J. For. Res. 1996, 26, 1218–1227. [Google Scholar] [CrossRef]
  4. Oliver, C.D.; Larson, B.C. Forest Stand Dynamics; John Wiley and Sons: New York, NY, USA, 1996. [Google Scholar]
  5. Franklin, J.F.; Spies, T.A.; Pelt, R.V.; Carey, A.B.; Thornburgh, D.A.; Berg, D.R.; Lindenmayer, D.B.; Harmong, M.E.; Keeton, W.S.; Shawh, D.C.; et al. Disturbances and structural development of natural forest ecosystems with silvicultural implications, using Douglas-fir forests as an example. For. Ecol. Manag. 2002, 155, 399–423. [Google Scholar] [CrossRef]
  6. Carey, A.B.; Curtis, R.O. Conservation of biodiversity: A useful paradigm for forest ecosystem management. Wildl. Soc. Bull. 1996, 24, 610–620. [Google Scholar]
  7. Spies, T.A.; Duncan, S.L. Old Growth in a New World; Island Press: Washington, DC, USA, 2009. [Google Scholar]
  8. Spies, T.A.; Franklin, J.F. The structure of natural young, mature, and old-growth Douglas-fir forests in Oregon and Washington. In Wildlife and Vegetation of Unmanaged Douglas-fir Forests; Ruggiero, L.F., Aubry, K.B., Eds.; General Technical Report PNW-GTR-285; USDA Forest Service: Portland, OR, USA, 1991; pp. 91–110. [Google Scholar]
  9. Nystrom, M.N.; DeBell, D.S.; Oliver, C.D. Development of Young Growth Western Red Cedar Stands; USDA Forest Service Research Paper PNW-324; USDA Forest Service: Portland, OR, USA, 1984; p. 9. [Google Scholar]
  10. Zenner, E.K. Development of tree size distributions in Douglas-fir forests under differing disturbance regimes. Ecol. Appl. 2005, 15, 701–714. [Google Scholar] [CrossRef]
  11. Donato, D.C.; Campbell, J.L.; Franklin, J.F. Multiple successional pathways and precocity in forest development: Can some forests be born complex? J. Veg. Sci. 2012, 23, 576–584. [Google Scholar] [CrossRef]
  12. Wierman, C.A.; Oliver, C.D. Crown stratification by species in even-aged mixed stands of Douglas-fir/western hemlock. Can. J. For. Res. 1979, 9, 1–9. [Google Scholar] [CrossRef]
  13. Spies, T.A. Ecological concepts and diversity of old-growth forests. J. For. 2004, 102, 14–20. [Google Scholar]
  14. Tsuga heterophylla. Available online: http://www.fs.fed.us/database/feis/ (accessed on 1 August 2011).
  15. Minore, D. Thuja plicata Donn ex D. Don. In Silvics of North America, Volume 1, Conifers; Burns, R.M., Honkala, B.H., Eds.; USDA Forest Service Agriculture Handbook 654; USDA Forest Service: Washington, DC, USA, 1990; p. 675. [Google Scholar]
  16. Oliver, C.D. Forest development in North America following major disturbances. For. Ecol. Manag. 1981, 3, 153–168. [Google Scholar] [CrossRef]
  17. Tappeiner, J.C.; Huffman, D.; Marshall, D.; Spies, T.A.; Bailey, J.D. Density, ages, and growth rates in old-growth and young-growth forests in coastal Oregon. Can. J. For. Res. 1997, 27, 638–648. [Google Scholar] [CrossRef]
  18. Winter, L.E.; Brubaker, L.B.; Franklin, J.F.; Miller, E.A.; DeWitt, D.Q. Canopy disturbances over the five-century lifetime of an old-growth Douglas-fir stand in the Pacific Northwest. Can. J. For. Res. 2002, 32, 1057–1070. [Google Scholar] [CrossRef]
  19. Freund, J.A.; Franklin, J.F.; Lutz, J.A. Structure of early old-growth Douglas-fir forests in the Pacific Northwest. For. Ecol. Manag. 2015, 335, 11–25. [Google Scholar] [CrossRef]
  20. Franklin, J.F.; Cromack, K., Jr.; Denison, W.; McKee, A.; Maser, C.; Sedell, J.; Swanson, F.; Juday, G. Ecological Characteristics of Old-growth Douglas-fir Forests; General Technical Report PNW-GTR-118; USDA Forest Service: Portland, OR, USA, 1981. [Google Scholar]
  21. Brown, E.R. (Ed.) Management of Wildlife and Fish Habitats in Forests of Western Oregon and Washington. Part I-Chapter Narratives; USDA Forest Service Publication No. R6-F&WL-192-1985; USDA Forest Service: Portland, OR, USA, 1985.
  22. Spies, T.A.; Franklin, J.F.; Thomas, T.B. Coarse woody debris in Douglas-fir forests of western Oregon and Washington. Ecology 1988, 69, 1689–1702. [Google Scholar] [CrossRef]
  23. Hansen, A.J.; Spies, T.A.; Swanson, F.J.; Omann, J.L. Conserving biodiversity in managed forests. Bioscience 1991, 41, 382–292. [Google Scholar] [CrossRef]
  24. O’Hara, K.L.; Latham, P.A.; Hessburg, P.; Smith, B.G. A structural classification for Inland Northwest forest vegetation. West. J. Appl. For. 1996, 11, 97–102. [Google Scholar]
  25. Burrascano, S.; Keeton, W.S.; Sabatini, F.M.; Blasi, C. Commonality and variability in the structural attributes of moist temperate old-growth forests: A global review. For. Ecol. Manag. 2013, 291, 458–479. [Google Scholar] [CrossRef]
  26. Franklin, J.F.; Dyrness, C.T. Natural Vegetation of Oregon and Washington; Oregon State University Press: Corvalis, OR, USA, 1988. [Google Scholar]
  27. Cispus. Available online: http://www.reo.gov/ama/locations/cispus.htm (accessed on 1 August 2011).
  28. Randle 1 E, Washington, NCDC 1981–2010 Monthly Normals. Available online: http://www.wrcc.dri.edu/cgi-bin/cliMAIN.pl?wa6909 (accessed on 9 August 2015).
  29. Packwood, Washington, NCDC 1981–2010 Monthly Normals. Available online: http://www.wrcc.dri.edu/cgi-bin/cliMAIN.pl?wa6262 (accessed on 9 August 2015).
  30. Soil Survey of Lewis County Area, Washington. Available online: http://www.nrcs.usda.gov/Internet/FSE_MANUSCRIPTS/washington/WA641/0/wa641_text.pdf (accessed on 14 July 2015).
  31. A Soil Survey of Skamania County Area, Washington. Available online: http://www.nrcs.usda.gov/Internet/FSE_MANUSCRIPTS/washington/WA659/0/wa659_text.pdf (accessed on 14 July 2015).
  32. Burns, R.M.; Honkala, B.H. Silvics of North America, Volume 1, Conifer; USDA Forest Service Agriculture Handbook 654; USDA Forest Service: Washington, DC, USA, 1990. [Google Scholar]
  33. Jiang, H.; Strittholt, J.R.; Frost, P.A.; Slosser, N.C. The classification of late seral forests in the Pacific Northwest, USA using Landsat ETM+ imagery. Remote Sens. Environ. 2004, 91, 320–331. [Google Scholar] [CrossRef]
  34. USDA Forest Service. Current Vegetation Survey, Version 1.5; Pacific Northwest Region, USDA Forest Service: Portland, OR, USA, 1995. [Google Scholar]
  35. Smith, D.; Larson, B.C.; Kelty, M.J.; Ashton, P.M.S. The Practice of Silviculture: Applied Forest Ecology, 9th ed.; John Wiley & Sons, Inc.: New York, NY, USA, 1997. [Google Scholar]
  36. Society of American Foresters (SAF). Scheduling the Harvest of Old-growth; Society of American Foresters: Bethesda, MD, USA, 1984. [Google Scholar]
  37. North, M.; Chen, J.; Oakley, B.; Song, B.; Rudnicki, M.; Gray, A.; Innes, J. Forest stand structure and pattern of old-growth western hemlock/Douglas-fir and mixed-conifer forests. For. Sci. 2004, 50, 299–311. [Google Scholar]
  38. Spies, T.A.; Franklin, J.F. The diversity and maintenance of old-growth forests. In Biodiversity in Managed Landscapes: Theory and Practice; Szaro, R.C., Johnson, D.W., Eds.; Oxford University Press: New York, NY, USA, 1996; pp. 296–314. [Google Scholar]
  39. Franklin, J.F.; van Pelt, R. Spatial aspects of complexity in old-growth forests. J. For. 2004, 102, 22–28. [Google Scholar]
  40. Zar, J.H. Biostatistical Analysis, 5th ed.; Pearson Prentice-Hall: Upper Saddle River, NJ, USA, 2010. [Google Scholar]
  41. Kruskal, J.B. Nonmetric multidimensional scaling: A numerical method. Psychometrika 1964, 29, 115–129. [Google Scholar] [CrossRef]
  42. Hammer, Ø.; Harper, D.A.T.; Ryan, P.D. PAST: Paleontological statistics software package for education and data analysis. Palaeontol. Electron. 2001, 4, p. 9. Available online: http://palaeo-electronica.org/2001_1/past/issue1_01.htm (accessed on 11 February 2015).
  43. Lutz, H. Vegetation of Heart’s Content, a virgin forest in northwestern Pennsylvania. Ecology 1930, 11, 1–29. [Google Scholar] [CrossRef]
  44. Henry, J.D.; Swan, J.M.A. Reconstructing forest history from live and dead plant material—An approach to the study of forest succession in southwest New Hampshire. Ecology 1974, 55, 772–783. [Google Scholar] [CrossRef]
  45. Oliver, C.D.; Stephens, E.P. Reconstruction of a mixed species forest in central New England. Ecology 1977, 58, 562–572. [Google Scholar] [CrossRef]
  46. Huff, M.H. Forest age structure and development following wildfires in the western Olympic Mountains, Washington. Ecol. Appl. 1995, 5, 471–483. [Google Scholar] [CrossRef]
  47. Swetnam, T.W. Fire history and climate change in Giant Sequoia groves. Science 1993, 262, 885–889. [Google Scholar] [CrossRef] [PubMed]
  48. Lewis, J.D.; Mckane, R.B.; Tingey, D.T.; Beedlow, P.A. Vertical gradients in photosynthetic light response within an old-growth Douglas-fir and western hemlock canopy. Tree Physiol. 2000, 20, 447–456. [Google Scholar] [CrossRef] [PubMed]
  49. Hansen, A.J.; Garman, S.L.; Weigand, J.F.; Urban, D.L.; McComb, W.C.; Raphael, M.G. Alternative silvicultural regimes in the Pacific Northwest: Simulations of ecological and economic effects. Ecol. Appl. 1995, 5, 535–554. [Google Scholar] [CrossRef]
  50. Coates, K.D. Conifer seedling response to northern temperate forest gaps. For. Ecol. Manag. 2000, 127, 249–269. [Google Scholar] [CrossRef]
  51. Kohyama, T. Size-structured tree populations in gap-dynamic forest—The forest architecture hypothesis for the stable coexistence of species. J. Ecol. 1993, 81, 131–143. [Google Scholar] [CrossRef]
  52. Knowles, P.; Grant, M.C. Age and size structure analyses of Engelmann spruce, ponderosa pine, lodgepole pine, and limber pine in Colorado. Ecology 1983, 64, 1–9. [Google Scholar] [CrossRef]
  53. Mailly, D.; Kimmins, J.P. Growth of Pseudotsuga menziesii and Tsuga heterophylla seedlings along a light gradient: Resource allocation and morphological acclimation. Can. J. For. Res. 1997, 75, 1424–1435. [Google Scholar]
  54. Pojar, J.; MacKinnon, A.; Alaback, P.B. Plants of the Pacific Northwest Coast: Washington, Oregon, British Columbia & Alaska; Lone Pine Publishing: Vancouver, BC, Canada, 1994. [Google Scholar]
  55. Jang, W.; Park, P.S. Stand structure and maintenance of Picea jezoensis in a northern temperate forest, South Korea. J. Plant Biol. 2010, 53, 180–189. [Google Scholar] [CrossRef]
  56. Nilsson, S.G.; Niklasson, M.; Hedin, J.; Aronsson, G.; Gutowski, J.M.; Linder, P.; Ljungberg, H.; Mikusiński, G.; Ranius, T. Erratum to “Densities of large living and dead trees in old-growth temperate and boreal forests”. For. Ecol. Manag. 2003, 178, 355–370. [Google Scholar] [CrossRef]
  57. Cline, S.P.; Berg, A.B.; Wight, H.M. Snag characteristics and dynamics in Douglas-fir forests, western Oregon. J. Wildl. Manag. 1980, 44, 773–786. [Google Scholar] [CrossRef]

