
Variation of Oriental Oak (Quercus variabilis) Leaf δ13C across Temperate and Subtropical China: Spatial Patterns and Sensitivity to Precipitation

 ,
, 
Abstract
:1. Introduction
2. Materials and Methods
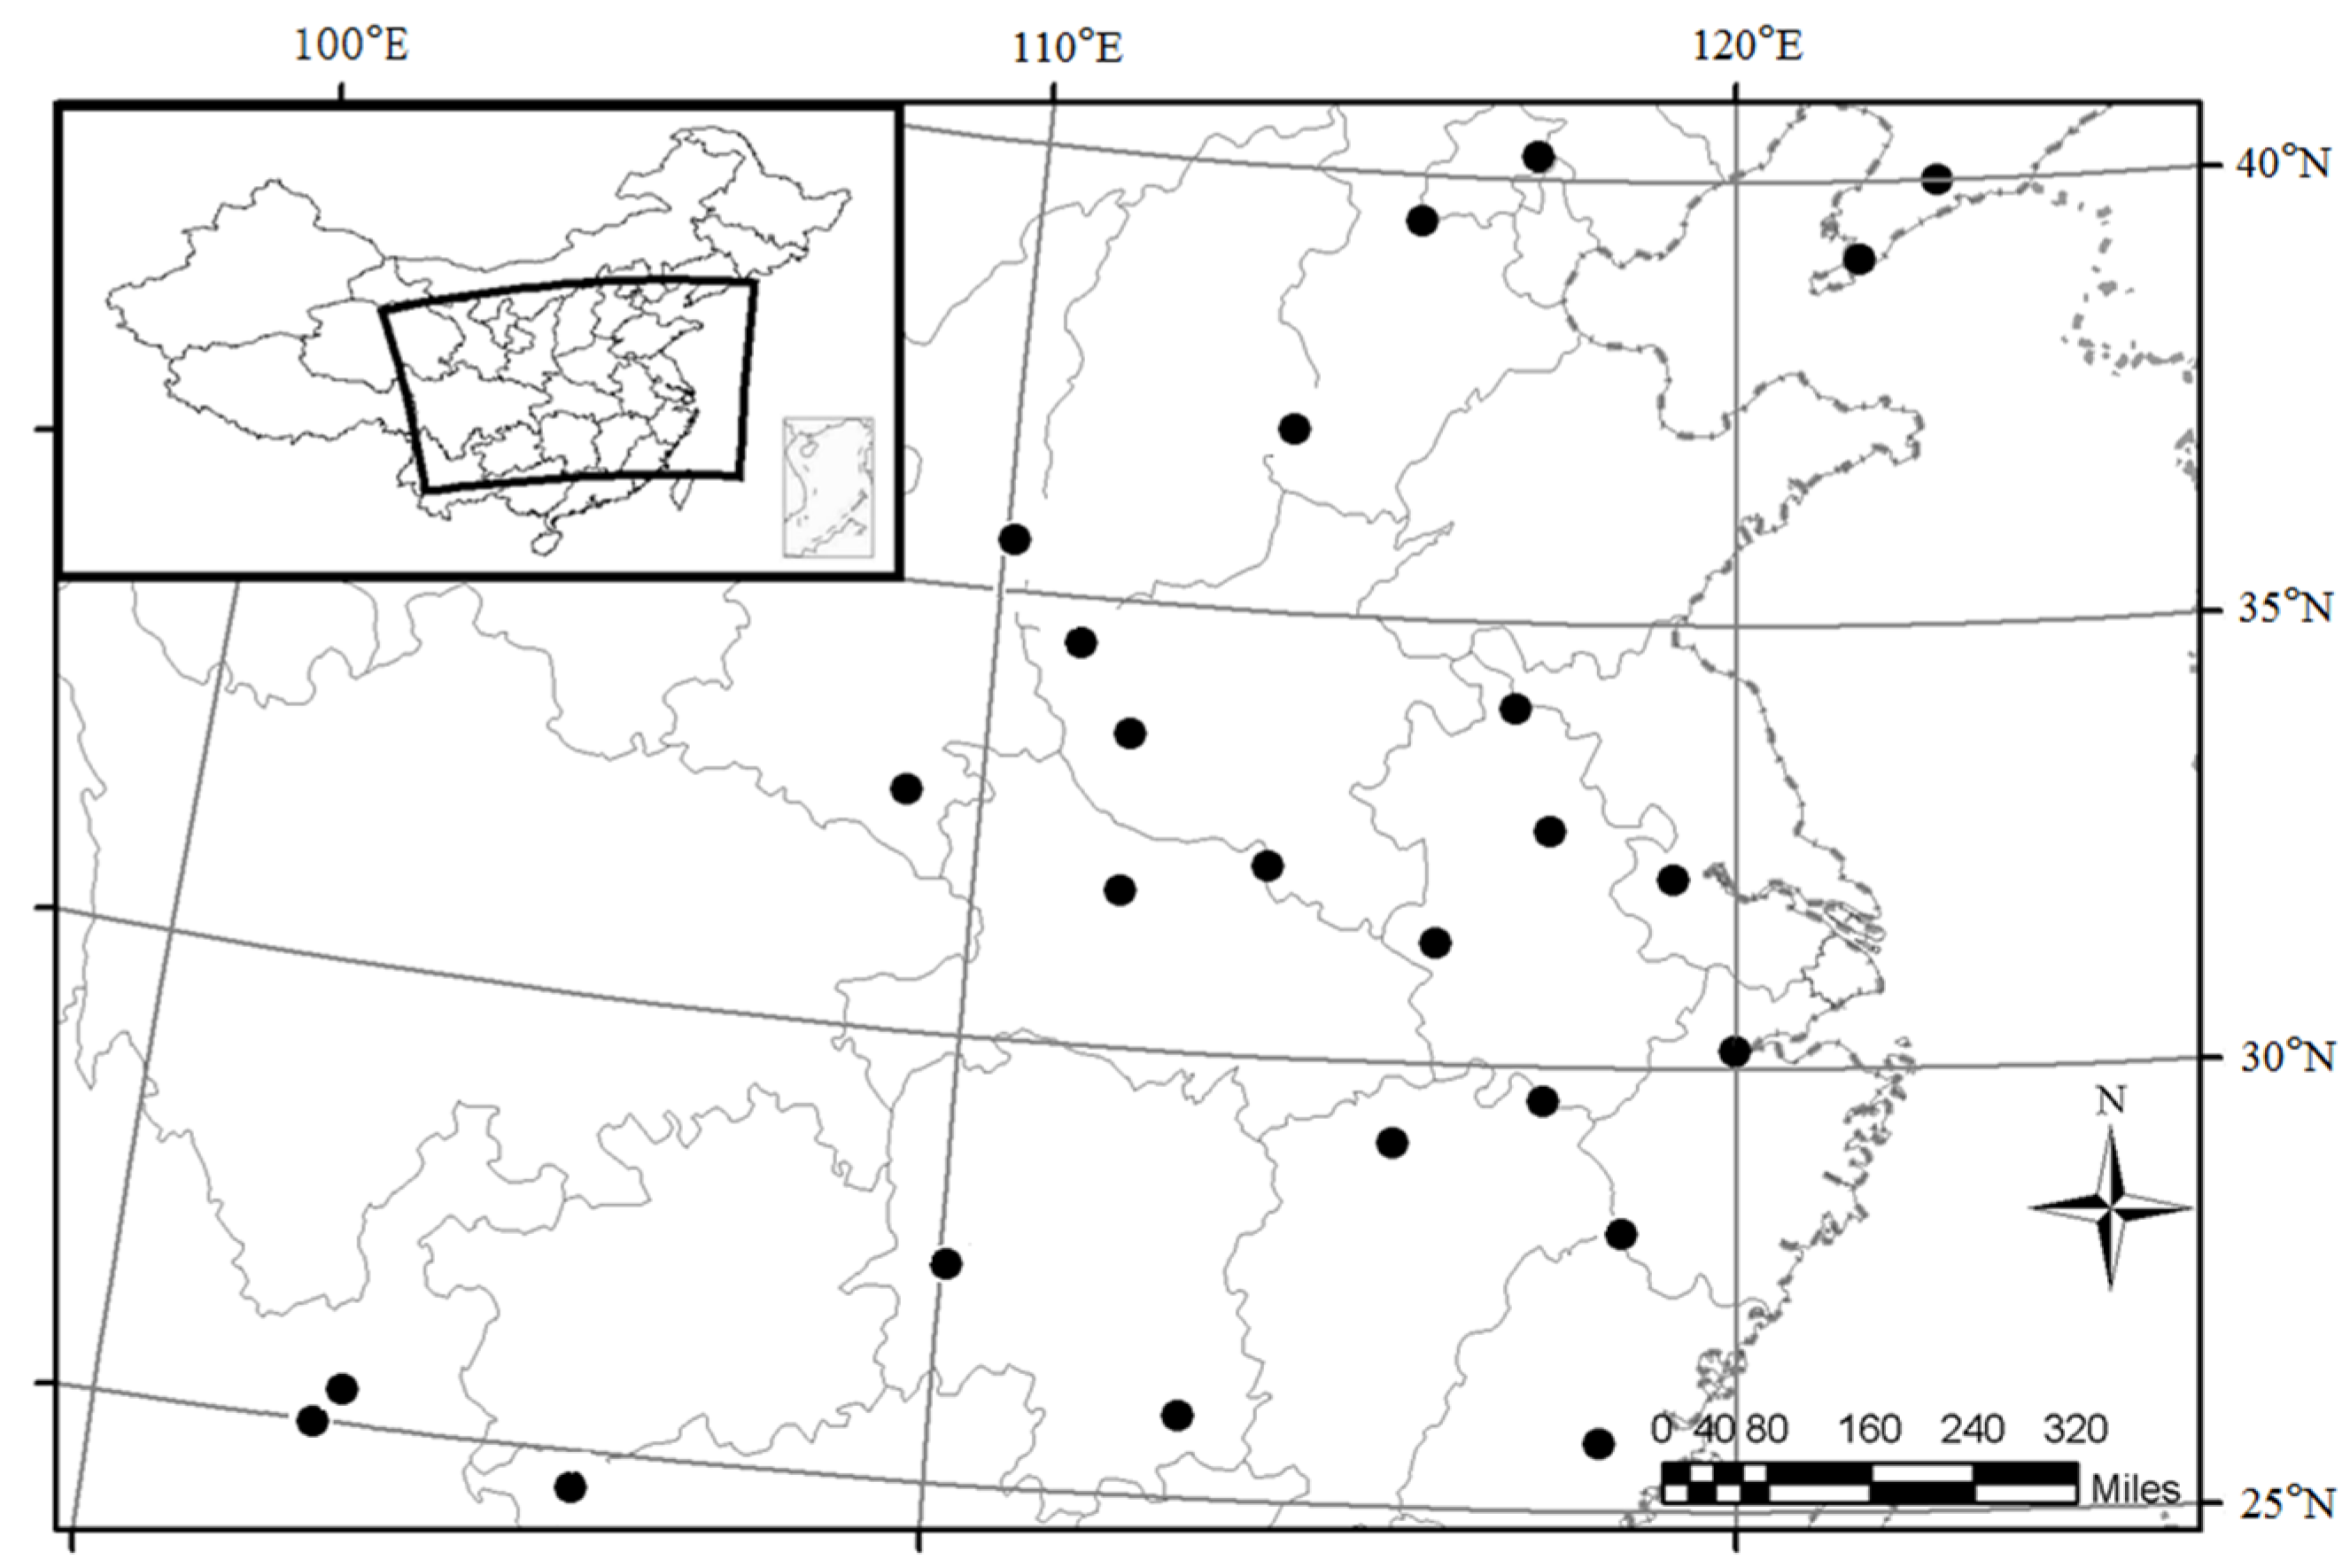
2.1. Study Areas and Sample Stands
2.2. Sampling
2.3. Chemical Analyses
2.4. Statistical Analyses
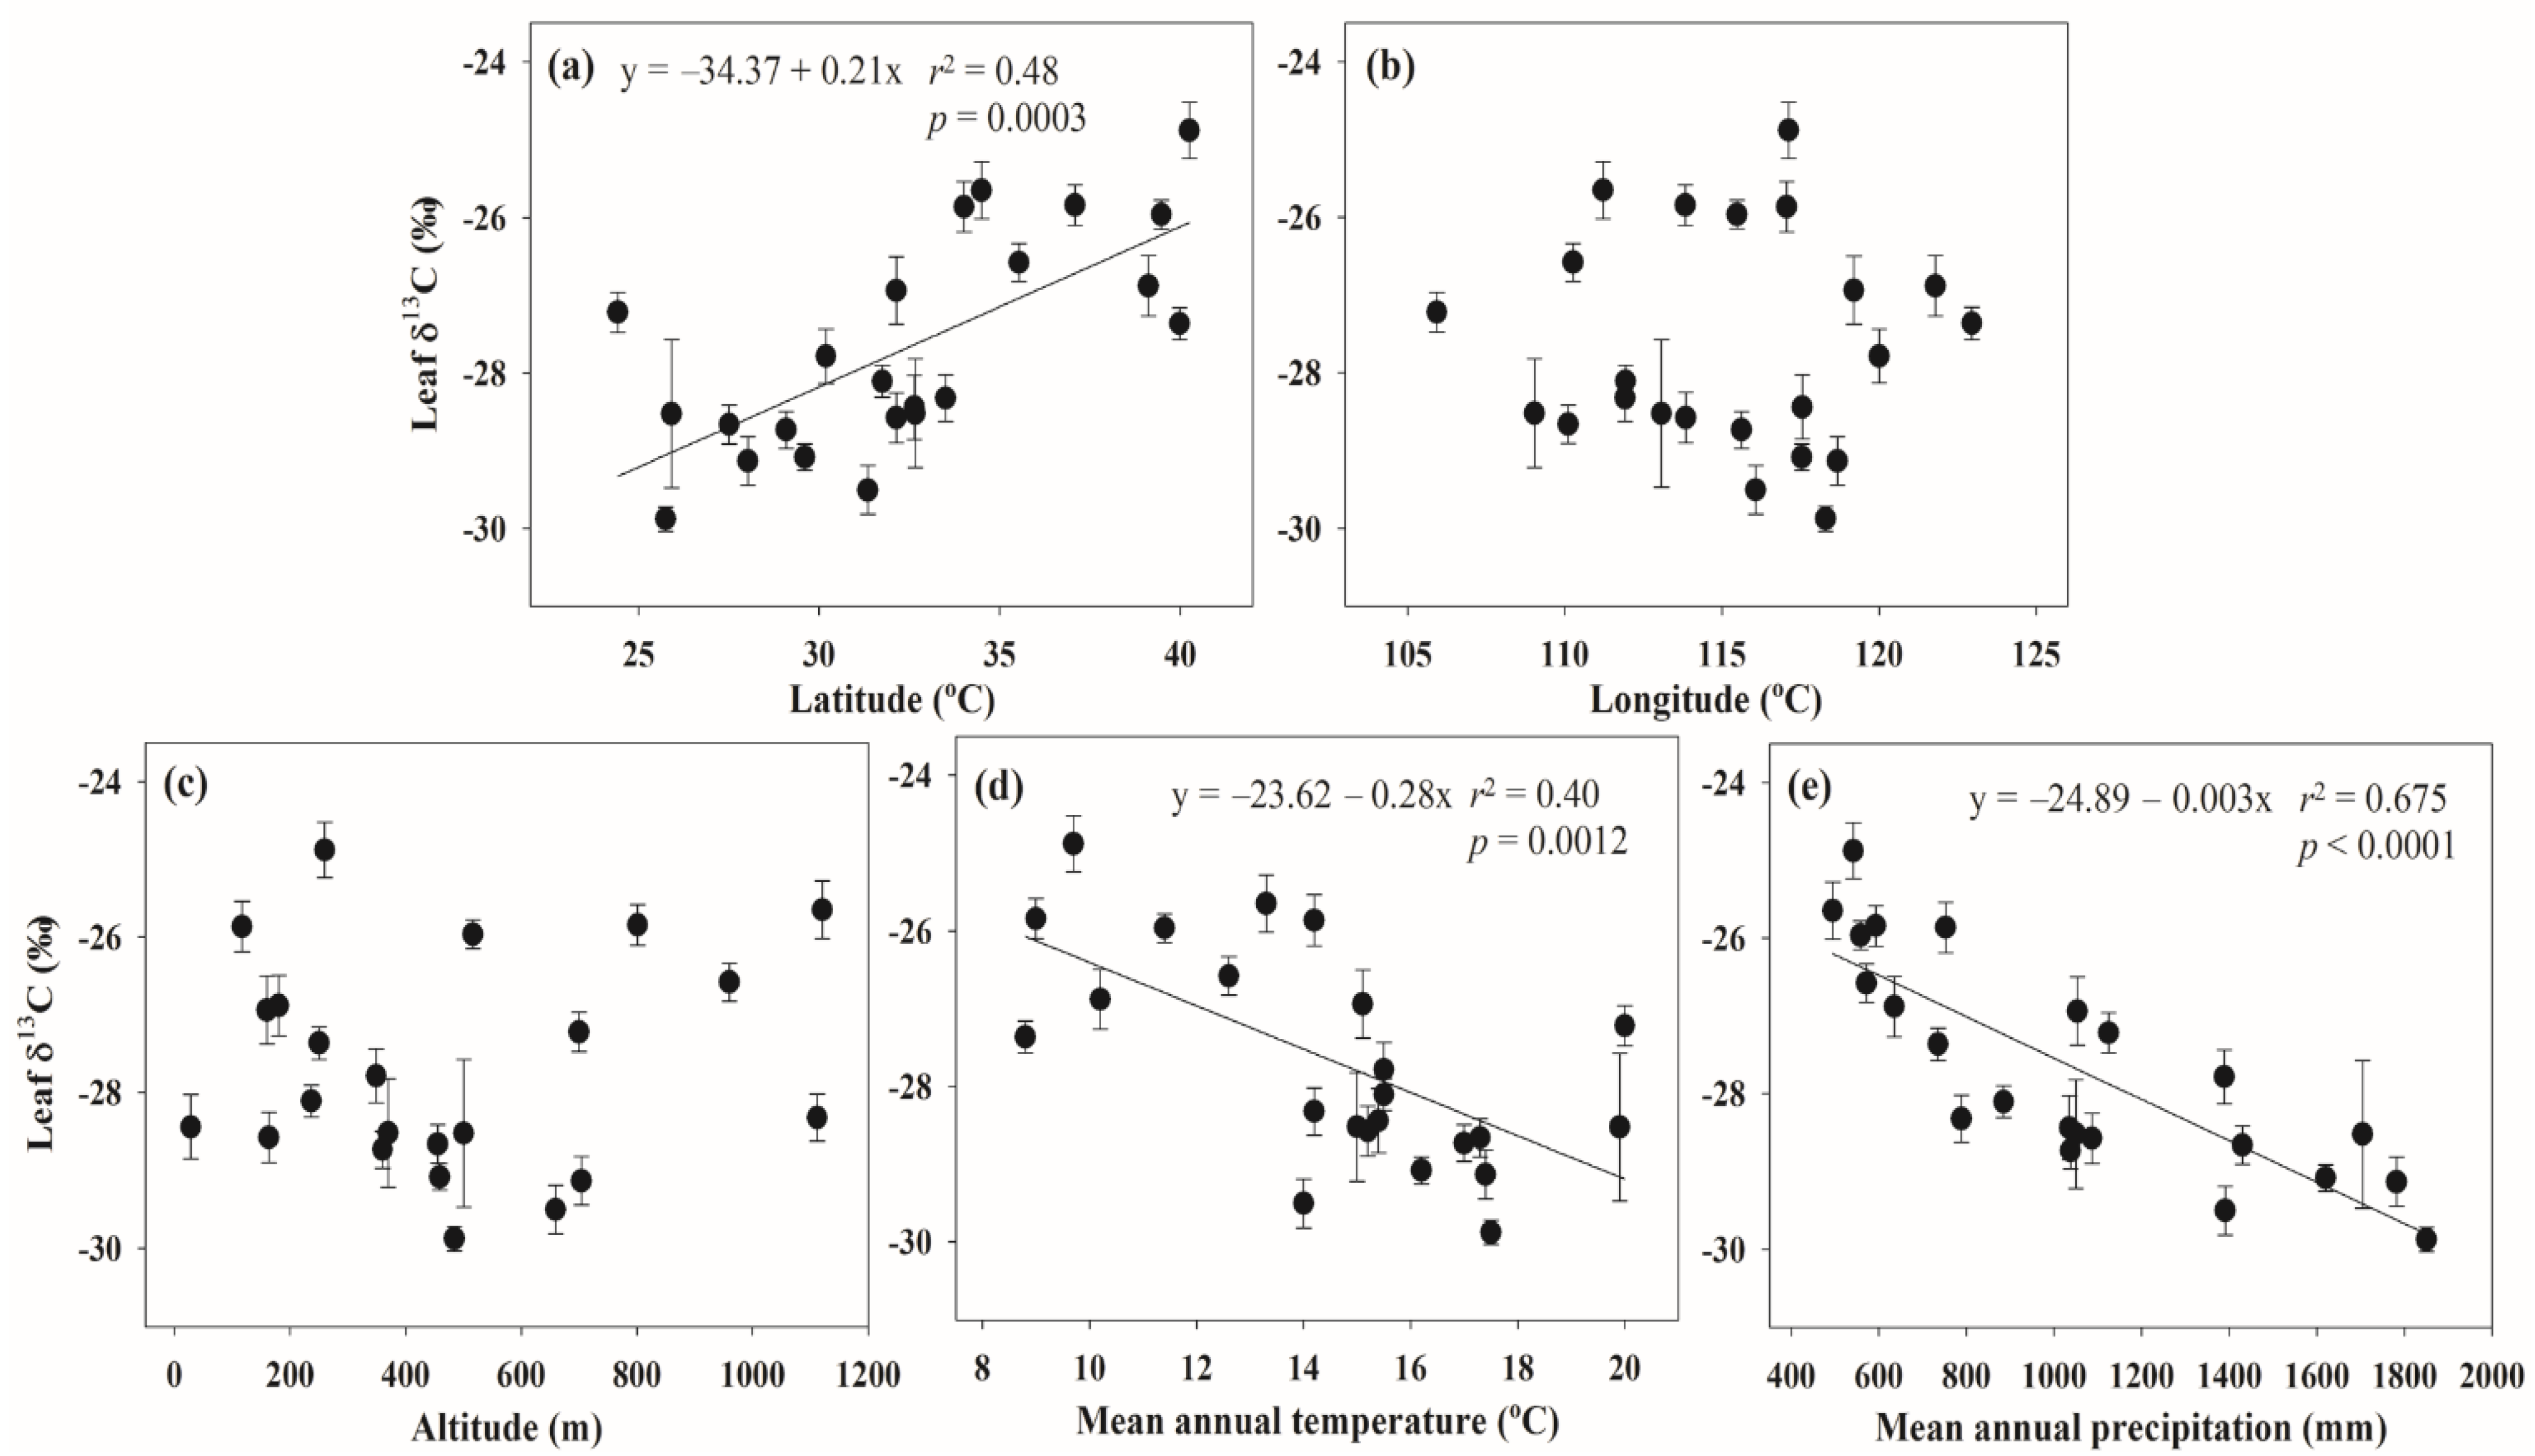
3. Results

| Mean | Standard Error | Maximum | Minimum | Coefficient of Variation(%) | |
|---|---|---|---|---|---|
| MAP (mm) | 1065 | 75 | 1850 | 495 | 38 |
| MAT (°C) | 14.7 | 0.5 | 20 | 8.8 | 20 |
| C (mg g−1) | 493.1 | 3.4 | 519.1 | 462.5 | 3.4 |
| δ13C (‰) | −27.4 | 0.3 | −24.3 | −30.4 | 5.7 |
| Methods | Equation | R2 | p |
|---|---|---|---|
| Full model | Leaf δ13C = −29.475 − 0.005 × LAT + 0.038 × LON + 0.000 × ALT + 0.032 × MAT − 0.003 × MAP | 0.680 | < 0.0001 |
| Stepwise | Leaf δ13C= −24.889 − 0.003 × MAP | 0.675 | < 0.0001 |
4. Discussion
5. Conclusions
Supplementary Files
Supplementary File 1Acknowledgments
Author Contribution
Conflicts of Interest
References
- Körner, C.; Farquhar, G.D.; Wong, S.C. Carbon isotope discrimination by plants follows latitudinal and altitudinal trends. Oecologia 1991, 88, 30–40. [Google Scholar] [CrossRef]
- Mulkey, S.S. Photosynthetic acclimation and water-use efficiency of three species of understory herbaceous bamboo (Gramineae) in Panama. Oecologia 1986, 70, 514–519. [Google Scholar] [CrossRef]
- Ehleringer, J.; Field, C.; Lin, Z.; Kuo, C. Leaf carbon isotope and mineral composition in subtropical plants along an irradiance cline. Oecologia 1986, 70, 520–526. [Google Scholar] [CrossRef]
- Zimmerman, J.K.; Ehleringer, J.R. Carbon isotope ratios are correlated with irradiance levels in the Panamanian orchid Catasetum viridiflavum. Oecologia 1990, 83, 247–249. [Google Scholar] [CrossRef] [PubMed]
- Kelly, C.K.; Woodward, F.I. Ecological Correlates of Carbon Isotope Composition of Leaves: A Comparative Analysis Testing for the Effects of Temperature, CO2 and O2 Partial Pressures and Taxonomic Relatedness on δ13C. J. Ecol. 1995, 257, 509–515. [Google Scholar] [CrossRef]
- Diefendorf, A.F.; Mueller, K.E.; Wing, S.L.; Koch, P.L.; Freeman, K.H. Global patterns in leaf 13C discrimination and implications for studies of past and future climate. Proc. Natl. Acad. Sci. USA 2010, 107, 5738–5743. [Google Scholar] [CrossRef] [PubMed]
- Hartman, G.; Danin, A. Isotopic values of plants in relation to water availability in the Eastern Mediterranean region. Oecologia 2010, 162, 837–852. [Google Scholar] [CrossRef] [PubMed]
- Peri, P.L.; Ladd, B.; Pepper, D.A.; Bonser, S.P.; Laffan, S.W.; Amelung, W. Carbon (δ13C)and nitrogen (δ15N) stable isotope composition in plant and soil in Southern Patagonia’s native forests. Glob. Chang. Biol. 2012, 18, 311–321. [Google Scholar] [CrossRef]
- Ramírez-Valiente, J.A.; Valladares, F.; Sánchez-Gómez, D.; Delgado, A.; Aranda, I. Population variation and natural selection on leaf traits in cork oak throughout its distribution range. Acta Oecol. 2014, 58, 49–56. [Google Scholar] [CrossRef]
- Vitousek, P.M.; Field, C.B.; Matson, P.A. Variation in foliar δ13C in Hawaiian Metrosideros polymorpha: A case of internal resistance? Oecologia 1990, 84, 362–370. [Google Scholar] [CrossRef]
- Koch, G.W.; Sillett, S.C.; Jennings, G.M.; Davis, S.D. The limits to tree height. Nature 2004, 428, 851–854. [Google Scholar] [CrossRef] [PubMed]
- Keenan, T.F.; Hollinger, D.Y.; Bohrer, G.; Dragoni, D.; Munger, J.W.; Schmid, H.P.; Richardson, A.D. Increase in forest water-use efficiency as atmospheric carbon dioxide concentrations rise. Nature 2013, 499, 324–327. [Google Scholar] [CrossRef] [PubMed]
- Korol, R.; Kirschbaum, M.; Farquhar, G.; Jeffreys, M. Effects of water status and soil fertility on the C-isotope signature in Pinus radiata. Tree Physiol. 1999, 19, 551–562. [Google Scholar] [CrossRef] [PubMed]
- Lauteri, M.; Pliura, A.; Monteverdi, M.C.; Brugnoli, E.; Villani, F.; Eriksson, G. Genetic variation in carbon isotope discrimination in six European populations of Castanea sativa Mill. originating from contrasting localities. J. Evol. Biol. 2004, 17, 1286–1296. [Google Scholar] [CrossRef] [PubMed]
- Schulze, E.D.; Williams, R.; Farquhar, G.; Schulze, W.; Langridge, J.; Miller, J.M.; Walker, B.H. Carbon and nitrogen isotope discrimination and nitrogen nutrition of trees along a rainfall gradient in northern Australia. Funct. Plant Biol. 1998, 25, 413–425. [Google Scholar] [CrossRef]
- Swap, R.; Aranibar, J.; Dowty, P.; Gilhooly, W.; Macko, S.A. Natural abundance of 13C and 15N in C3 and C4 vegetation of Southern Africa: Patterns and implications. Glob. Chang. Biol. 2004, 10, 350–358. [Google Scholar] [CrossRef]
- Gouveia, A.C.; Freitas, H. Modulation of leaf attributes and water use efficiency in Quercus suber along a rainfall gradient. Trees 2009, 23, 267–275. [Google Scholar] [CrossRef]
- Qu, C.M.; Han, X.G.; Su, B.; Huang, J.H.; Jiang, G.M. The characteristicsof foliar δ13C values of plants and plant water use efficiencyindicated by δ13C values in two fragmented rainforestsin Xishuangbanna, Yunnan. Acta Bot. Sin. 2001, 43, 186–192. [Google Scholar]
- Su, B.; Han, X.G.; Li, L.H.; Huang, J.H.; Bai, Y.F.; Qu, C.M. Responses of δ13C value and water use efficiency of plantspecies to environmental gradients along the grasslandzone of Northeast China Transect. Acta Phytoecol. Sin. 2000, 24, 648–655. [Google Scholar]
- Li, M.; Zhu, J. Variation of δ13C of wood and foliage with canopy height differs between evergreen and deciduous species in a temperate forest. Plant Ecol. 2011, 212, 543–551. [Google Scholar] [CrossRef]
- Chen, T.; Yang, M.X.; Feng, H.Y.; Xu, S.J.; Qiang, W.Y.; He, Y.Q.; An, L.Z. Spatial distribution of stable carbon isotopecompositions of plant leaves in the north of the Tibetan Plateau. J. Glaciol. Geocryol. 2003, 25, 83–87. [Google Scholar]
- Li, M.C.; Luo, T.X.; Kong, G.; Qian, G.J. Characteristics of stable carbon isotope composition of different life form speciesgrowing at the timbenine in Sergyemla Mountain. Acta Ecol. Sin. 2008, 28, 3160–3167. [Google Scholar]
- Givnish, T.J.; Wong, S.C.; Stuart-Williams, H.; Holloway-Phillips, M.; Farquhar, G.D. Determinants of maximum tree height in Eucalyptus species along a rainfall gradient in Victoria, Australia. Ecology 2014, 95, 2991–3007. [Google Scholar] [CrossRef]
- Körner, C.; Farquhar, G.D.; Roksandic, Z. A global survey of carbon isotope discrimination in plants from high altitude. Oecologia 1988, 74, 623–632. [Google Scholar] [CrossRef]
- Hultine, K.; Marshall, J. Altitude trends in conifer leaf morphology and stable carbon isotope composition. Oecologia 2000, 123, 32–40. [Google Scholar] [CrossRef]
- Van de Water, P.K.; Leavitt, S.W.; Betancourt, J.L. Leaf δ13C variability with elevation, slope aspect, and precipitation in the southwest United States. Oecologia 2002, 132, 332–343. [Google Scholar] [CrossRef]
- Du, B.; Liu, C.; Kang, H.; Zhu, P.; Yin, S.; Shen, G.; Hou, J.; Ilvesniemi, H. Climatic control on plant and soil δ13C along an altitudinal transect of Lushan Mountain in Subtropical China: Characteristics and interpretation of soil carbon dynamics. PLoS ONE 2014, 9, e86440. [Google Scholar] [CrossRef] [PubMed]
- Shestakova, T.A.; Aguilera, M.; Ferrio, J.P.; Gutiérrez, E.; Voltas, J. Unravelling spatiotemporal tree-ring signals in Mediterranean oaks: A variance-covariance modelling approach of carbon and oxygen isotope ratios. Tree Physiol. 2014, 34, 819–838. [Google Scholar] [CrossRef] [PubMed]
- Damesin, C.; Rambal, S.; Joffre, R. Between-tree variations in leaf δ13C of Quercus pubescens and Quercus ilex among Mediterranean habitats with different water availability. Oecologia 1997, 111, 26–35. [Google Scholar] [CrossRef]
- Klein, T.; Shpringer, I.; Fikler, B.; Elbaz, G.; Cohen, S.; Yakir, D. Relationships between stomatal regulation, water-use, and water-use efficiency of two coexisting key Mediterranean tree species. For. Ecol. Manag. 2013, 302, 34–42. [Google Scholar] [CrossRef]
- Donovan, L.A.; West, J.B.; McLeod, K.W. Quercus species differ in water and nutrient characteristics in a resource-limited fall-line sandhill habitat. Tree Physiol. 2000, 20, 929–936. [Google Scholar] [CrossRef] [PubMed]
- Bowen, G.J. Isoscapes: Spatial pattern in isotopic biogeochemistry. Ann. Rev. Earth Planet. Sci. 2010, 38, 161–187. [Google Scholar] [CrossRef]
- Castillo, J.; Aguilera, M.; Voltas, J.; Ferrio, J.P. Isoscapes of tree-ring carbon-13 perform like meteorological networks in predicting regional precipitation patterns. J. Geophys. Res. Biogeosciences 2013, 118, 352–360. [Google Scholar] [CrossRef]
- Wang, J.; Wang, S.; Kang, H.; Xin, Z.; Qian, Z.; Liu, C. Distribution pattern of oriental oak (Quercus variabilis Blume) and the characteristics of climate of distribution area in eastern Asia. J. Shanghai Jiaotong Univ. Agric. Sci. 2009, 27, 235–241. [Google Scholar]
- Wang, L.; Ren, X.; Liu, Y. Geographical distribution of deciduous oaks in China. J. Beijing For. Univ. 1985, 3, 57–69. [Google Scholar]
- Farquhar, G.D.; Ehleringer, J.R.; Hubick, K.T. Carbon isotope discrimination and photosynthesis. Annu. Rev. Plant Biol. 1989, 40, 503–537. [Google Scholar] [CrossRef]
- Ramírez-Valiente, J.A.; Sánchez-Gómez, D.; Aranda, I.; Valladares, F. Phenotypic plasticity and local adaptation in leaf ecophysiological traits of 13 contrasting cork oak populations under different water availabilities. Tree Physiol. 2010, 30, 618–627. [Google Scholar] [CrossRef] [PubMed]
- Ferrio, J.P.; Florit, A.; Vega, A.; Serrano, L.; Voltas, J. Δ13C and tree-ring width reflect different drought responses in Quercus ilex and Pinus halepensis. Oecologia 2003, 137, 512–518. [Google Scholar] [CrossRef] [PubMed]
- Di Matteo, G.; Perini, L.; Atzori, P.; de Angelis, P.; Mei, T.; Bertini, G.; Mugnozza, G.S.; Fabbio, G. Changes in foliar carbon isotope composition and seasonal stomatal conductance reveal adaptive traits in Mediterranean coppices affected by drought. J. For. Res. 2014, 25, 839–845. [Google Scholar] [CrossRef]
- Payne, W.; Sattelmacher, B. Effects of phosphorus and water supply on yield, transpirational water-use efficiency, and carbon isotope discrimination of pearl millet. Crop Sci. 2000, 40, 120–125. [Google Scholar]
- Turner, N.C.; Schulze, E.D.; Nicolle, D.; Schumacher, J.; Kuhlmann, I. Annual rainfall does not directly determine the carbon isotope ratio of leaves of Eucalyptus species. Physiol. Plant 2008, 132, 440–445. [Google Scholar] [CrossRef] [PubMed]
- Brugnoli, E.; Farquhar, G.D. Photosynthetic fractionation of carbon isotopes. In Photosynthesis: physiology and metabolism; Advances in Photosynthesis; Leegood, R.C., Sharkey, T.D., et al., Eds.; Kluwer Academic Publishers: Dordrecht, Holland, 2000; Volume 9, pp. 399–434. [Google Scholar]
- Xue, B. Status and developing potentiality of the phosphorite resource around Dianchi lake of Kunming. Geol. Chem. Miner. 2008, 30, 149–154. [Google Scholar]
- Zhou, X.; Sun, X.; Du, B.; Yin, S.; Liu, C. Multielement stoichiometry in Quercus variabilis under natural phosphorus variation in subtropical China. Sci. Rep. 2015, 5, 7839. [Google Scholar] [CrossRef] [PubMed]
- Karimi, R.; Folt, C.L. Beyond macronutrients: Element variability and multielement stoichiometry in freshwater invertebrates. Ecol. Lett. 2006, 9, 1273–1283. [Google Scholar] [CrossRef] [PubMed]
© 2015 by the authors; licensee MDPI, Basel, Switzerland. This article is an open access article distributed under the terms and conditions of the Creative Commons Attribution license (http://creativecommons.org/licenses/by/4.0/).
Share and Cite
Du, B.; Kang, H.; Zhu, Y.; Zhou, X.; Yin, S.; Burgess, P.J.; Liu, C. Variation of Oriental Oak (Quercus variabilis) Leaf δ13C across Temperate and Subtropical China: Spatial Patterns and Sensitivity to Precipitation. Forests 2015, 6, 2296-2306. https://doi.org/10.3390/f6072296
Du B, Kang H, Zhu Y, Zhou X, Yin S, Burgess PJ, Liu C. Variation of Oriental Oak (Quercus variabilis) Leaf δ13C across Temperate and Subtropical China: Spatial Patterns and Sensitivity to Precipitation. Forests. 2015; 6(7):2296-2306. https://doi.org/10.3390/f6072296
Chicago/Turabian StyleDu, Baoming, Hongzhang Kang, Yanhua Zhu, Xuan Zhou, Shan Yin, Paul J. Burgess, and Chunjiang Liu. 2015. "Variation of Oriental Oak (Quercus variabilis) Leaf δ13C across Temperate and Subtropical China: Spatial Patterns and Sensitivity to Precipitation" Forests 6, no. 7: 2296-2306. https://doi.org/10.3390/f6072296
APA StyleDu, B., Kang, H., Zhu, Y., Zhou, X., Yin, S., Burgess, P. J., & Liu, C. (2015). Variation of Oriental Oak (Quercus variabilis) Leaf δ13C across Temperate and Subtropical China: Spatial Patterns and Sensitivity to Precipitation. Forests, 6(7), 2296-2306. https://doi.org/10.3390/f6072296