Abstract
While sustainable forestry in Europe is characterized by the provision of a multitude of forest ecosystem services, there exists no comprehensive study that scrutinizes their sensitivity to forest management on a pan-European scale, so far. We compile scenario runs from regionally tailored forest growth models and Decision Support Systems (DSS) from 20 case studies throughout Europe and analyze whether the ecosystem service provision depends on management intensity and other co-variables, comprising regional affiliation, social environment, and tree species composition. The simulation runs provide information about the case-specifically most important ecosystem services in terms of appropriate indicators. We found a strong positive correlation between management intensity and wood production, but only weak correlation with protective and socioeconomic forest functions. Interestingly, depending on the forest region, we found that biodiversity can react in both ways, positively and negatively, to increased management intensity. Thus, it may be in tradeoff or in synergy with wood production and forest resource maintenance. The covariables species composition and social environment are of punctual interest only, while the affiliation to a certain region often makes an important difference in terms of an ecosystem service’s treatment sensitivity.
1. Introduction
For a long time, the general consensus in Europe was that forest ecosystem services beyond wood production would be sufficiently provided as mere side effects of the latter, a concept that was well outlined by the term wake theory []. In the present, however, they have emancipated, and their relative importance is subject to partly heated societal debates from the local to the pan-European scale. The emergence of the Helsinki Criteria for sustainable forest management [,] marks an important milestone in this process. Consequently, important questions are how far ecosystem service provision is sensitive to forest management, and to what extent different ecosystem services are conflicting or compatible.
Although local case studies have contributed to these questions, there is no synthesis available yet. Furthermore, while the vulnerability of ecosystem service provision due to climate change has been investigated on a European level [,,]), silvicultural steering possibilities were not fathomed on such a large scale. Existing studies were limited to single ecosystem services only and did not follow a regionally tailored bottom-up approach (cf. [,]). This is remarkable, as meanwhile most of Europe’s forests are covered by management-oriented forest growth simulation models—partly even embedded in decision support systems (DSS)—that enable such a scrutiny.
The European Union project INTEGRAL [], a collaboration of 21 research groups from 13 European countries, asks how different policies influence forest managers’ behavior in terms of silvicultural treatment and how this would influence the provision of ecosystem services in a time frame of about 30 years (assuming constant climate conditions during that time span). To this end, mostly two representative case study areas have been selected per country, where, in a so far unprecedented collaboration of social and natural scientists, sets of policy scenarios have been developed and translated into forest owner-specific management scenarios that were able to drive up-to-date forest growth simulators and DSS containing such simulators, respectively. An important part of the research was to identify each region’s most relevant forest ecosystem services and to design and/or implement appropriate quantitative indicators for benchmarking ecosystem service provision in the forest growth scenarios. As a result there exists for each case study a set of policy scenarios with interlinked forest management scenarios and corresponding simulation results that show timelines of ecosystem service provision.
While the broad scope of the project results, from policy to ecosystem services, will be reported in other publications, it seems worthwhile to have a closer look at the silvicultural scenarios—without considering which policies triggered them—and the resulting ecosystem service provision expected from forest simulations. While forest ownership structure is crucial for management decisions in a given policy framework, it is not considered an influence variable in the study on hand. We focus on the management and its influence on ecosystem services; but we do not ask who decided on a given management option and why. The character of this work is explorative as there is no pre-defined set of hypotheses or theoretical framework we could test. Rather, we would like to contribute to the formation of hypotheses as a background for further studies.
Thus, this study uses the existing results for asking:
- -
- What kind of ecosystem services are important throughout Europe and which are relevant on a regional level only?
- -
- Can ecosystem services be meaningfully controlled by forest management, and is this different across Europe?
- -
- Which ecosystem services are conflicting, neutral, or positively correlated?
Based on this synthesis we discuss the steering potential for Europe’s forests.
2. Material and Methods
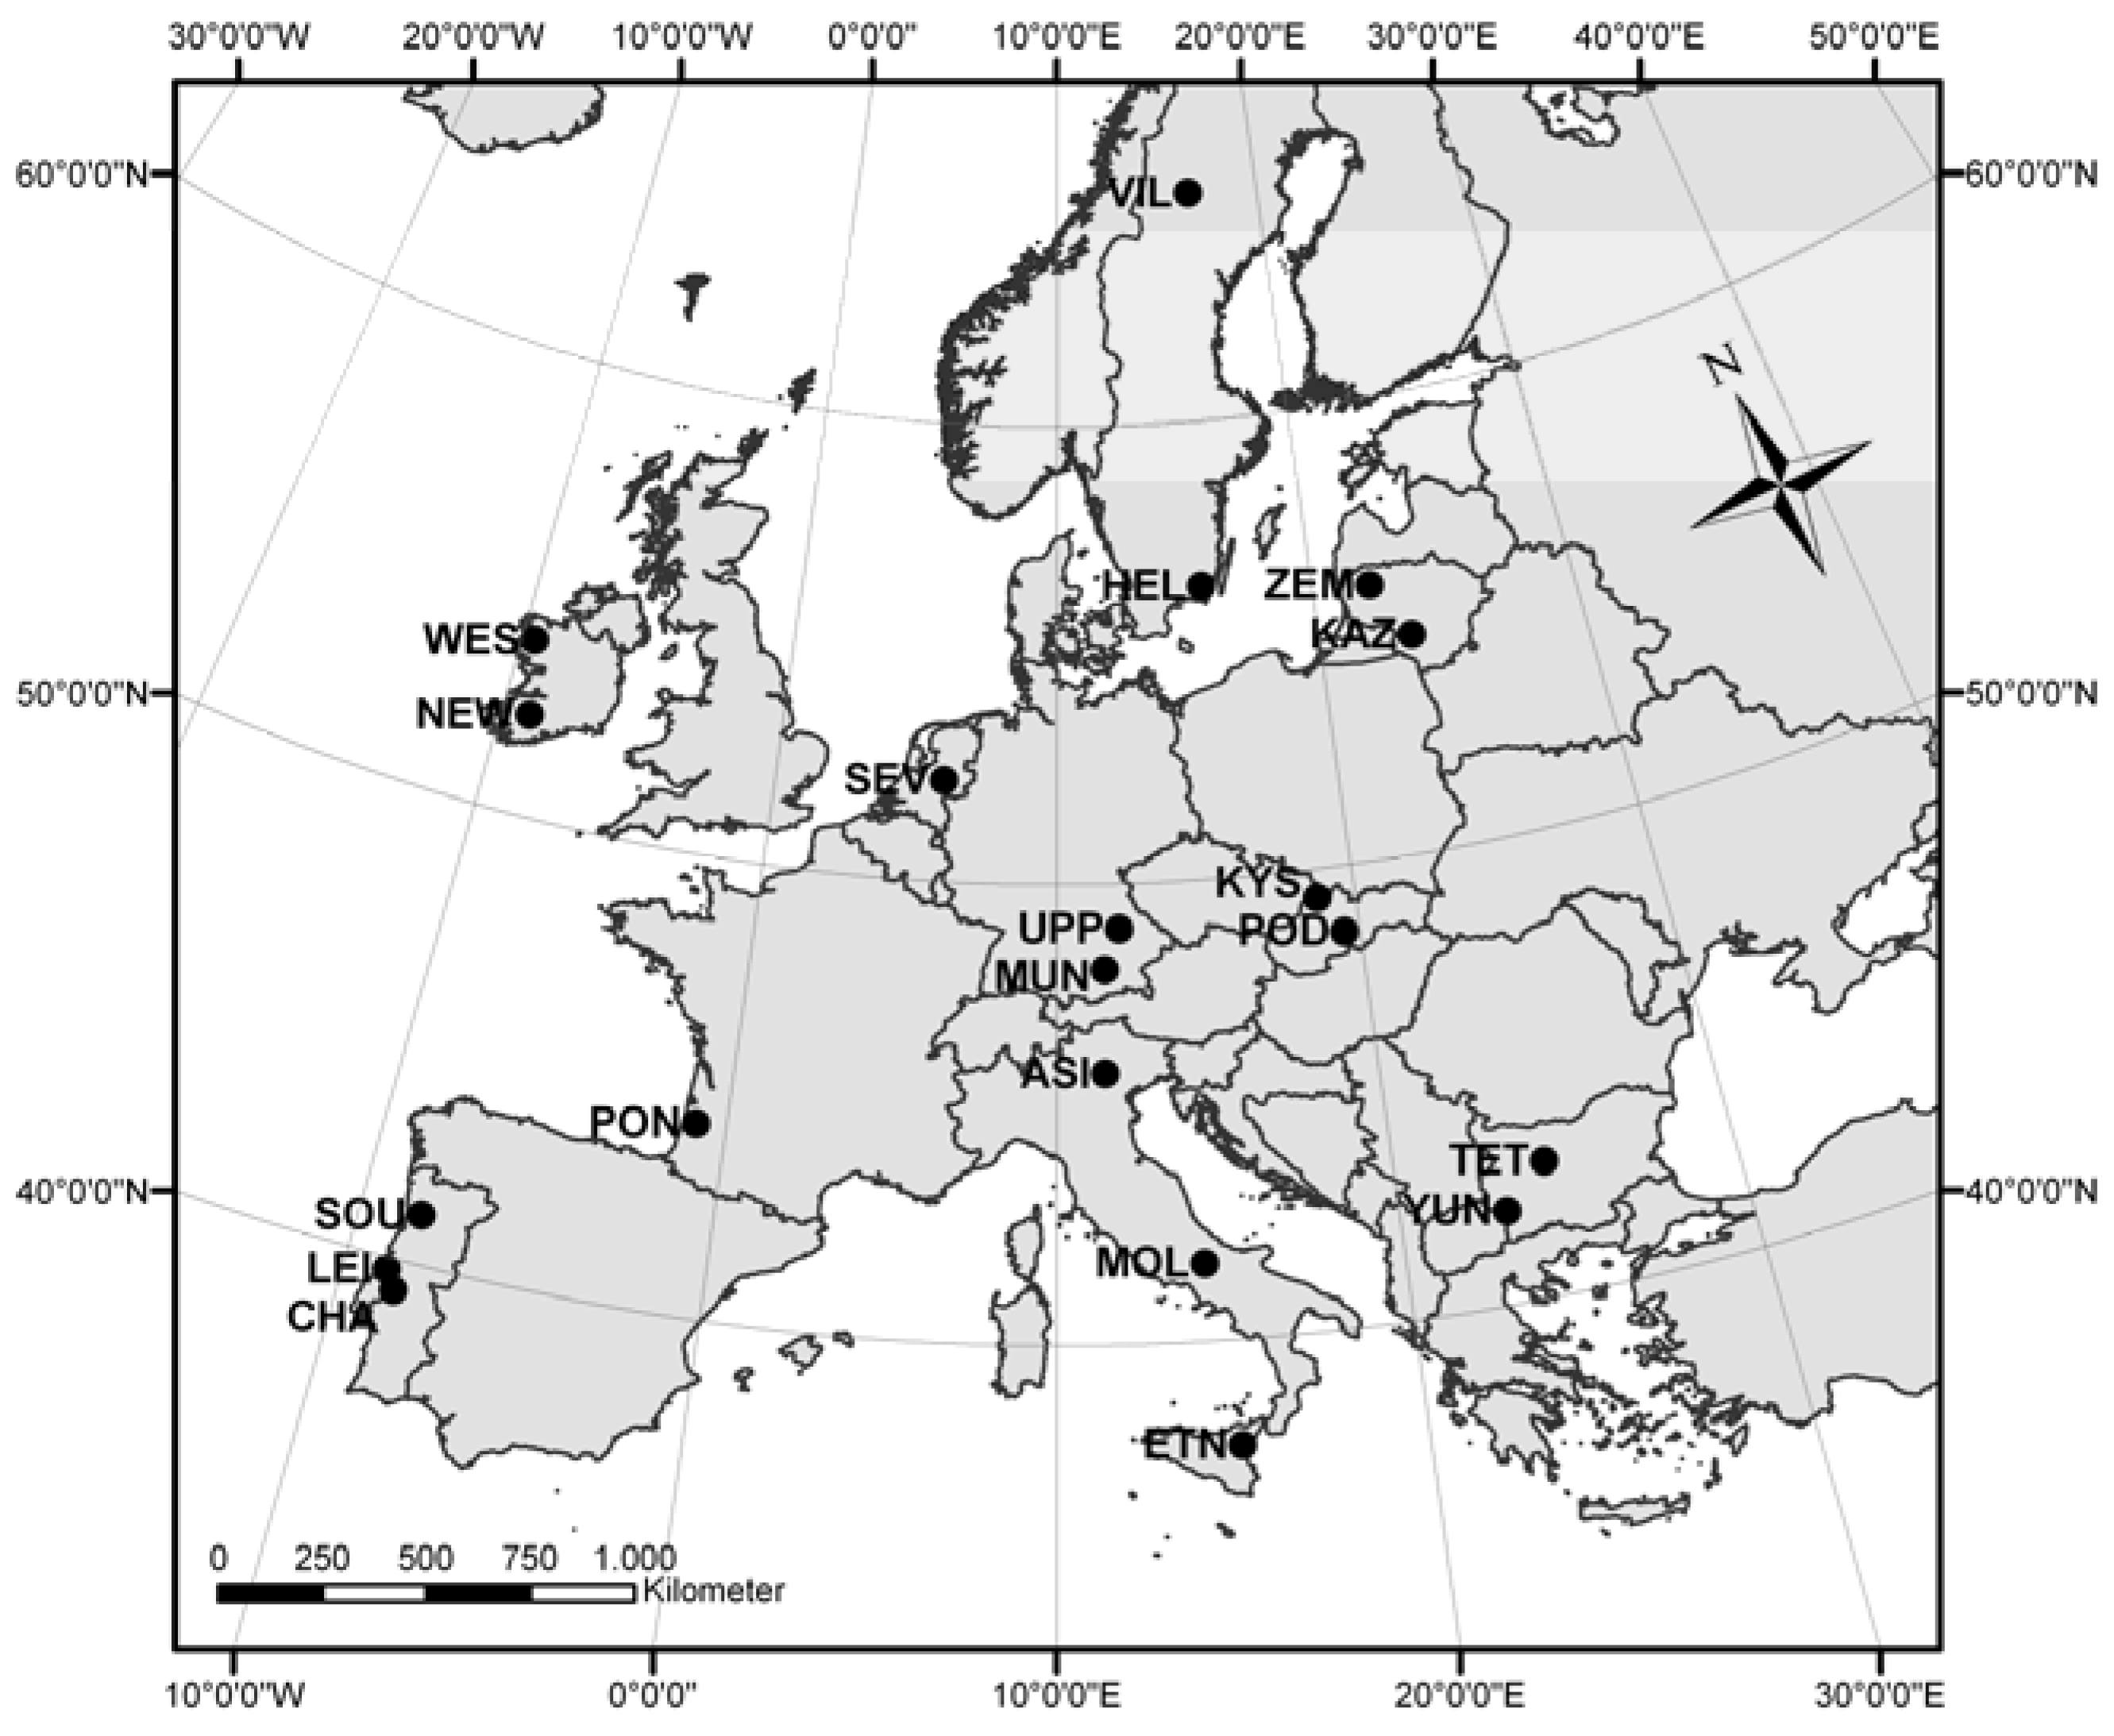
2.1. Case Study Areas
The 20 case study areas underlying this study were selected in the INTEGRAL project’s framework in order to represent typical forest landscapes for each country, the term “typical” concerning tree species composition, site conditions, and management paradigms, but also socioeconomic frame conditions for forestry. In the project, they were assigned to six European forest regions, namely Eastern Europe, Central Western Europe, North Western Europe, Southern Europe, Western Europe, and Northern Europe, each of these regions having a distinctive ecological, socioeconomic, and political context [] (Table 1, Figure 1).
Figure 1.
Geographic locations of all INTEGRAL case study areas. See Table 1 for the full case study names.
Table 1.
The INTEGRAL case studies used in this work, selected group affiliations, and key properties. The table is sorted by country and case study name (alphabetical order).
| Country | Case Study Area (CSA) | CSA Acronym | Forest Region | Species Composition | Social Environment | Latitude | Longitude | Total Area (ha) | Forest Area (ha) |
|---|---|---|---|---|---|---|---|---|---|
| Bulgaria | Teteven | TET | Eastern Europe | broadleaf | rural | 42°55′ N | 24°25′ E | 27,400 | 10,100 |
| Bulgaria | Yundola | YUN | Eastern Europe | conifer | rural | 42°01′ N | 23°06′ E | 10,100 | 3700 |
| France | Pontenx | PON | Central Western Europe | conifer | rural | 44°12′ N | 00°55′ W | 101,000 | 66,700 |
| Germany | Munich South | MUN | Central Western Europe | mixed | city near | 48°08′ N | 11°34′ E | 60,000 | 43,200 |
| Germany | Upper Palatinate | UPP | Central Western Europe | mixed | rural | 49°01′ N | 12°05′ E | 300,000 | 159,000 |
| Ireland | Newmarket | NEW | North Western Europe | conifer | rural | 52°12′ N | 09°00′ W | 75,100 | 13,500 |
| Ireland | Western Peatlands | WES | North Western Europe | conifer | rural | 53°48′ N | 09°31′ W | 1,000,000 | 116,000 |
| Italy | Asiago | ASI | Southern Europe | mixed | rural | 45°52′ N | 11°31′ E | 46,700 | 30,900 |
| Italy | Etna | ETN | Southern Europe | broadleaf | city near | 37°45′ N | 14°59′ E | 25,300 | 7000 |
| Italy | Molise | MOL | Southern Europe | mixed | rural | 41°40′ N | 14°15′ E | 600 | 600 |
| Lithuania | Kazlu Ruda | KAZ | Eastern Europe | conifer | rural | 54°45′ N | 23°30′ E | 66,000 | 36,800 |
| Lithuania | Zemaitija | ZEM | Eastern Europe | mixed | rural | 55°59' N | 22°15′ E | 38,000 | 11,700 |
| Netherlands | South East Veluwe | SEV | Western Europe | conifer | city near | 52°13′ N | 5°58′ E | 8000 | 6000 |
| Portugal | Chamusca | CHA | Southern Europe | broadleaf | rural | 39°21′ N | 8°29′ W | 74,600 | 53,000 |
| Portugal | Leiria | LEI | Southern Europe | conifer | rural | 39°45′ N | 8°48′ W | 75,200 | 44,400 |
| Portugal | Sousa | SOU | Southern Europe | mixed | rural | 41°04′ N | 8°15′ W | 48,900 | 22,000 |
| Slovakia | Kysuce | KYS | Eastern Europe | mixed | city near | 49°22′ N | 18°44′ E | 152,000 | 121,600 |
| Slovakia | Podpol’anie | POD | Eastern Europe | broadleaf | rural | 48°34′ N | 19°30′ E | 20,000 | 10,200 |
| Sweden | Helgea | HEL | Northern Europe | conifer | rural | 56°25′ N | 15°42′ E | 120,000 | 96,000 |
| Sweden | Vilhelmina | VIL | Northern Europe | conifer | rural | 64°55′ N | 16°35′ E | 850,000 | 530,000 |
The case study areas are located in 10 European countries; these are (in alphabetical order) Bulgaria (2 case studies), France (1 case study), Germany (2), Ireland (2), Italy (3), Lithuania (2), the Netherlands (1), Portugal (3), Slovakia (2), and Sweden (2). As shown in Table 1, they cover a range of northern latitudes between 38° (Etna, Italia) and 65° (Vilhelmina, Sweden) and longitudes between 9° W (Leiria, Portugal) and 24° E (Teteven, Bulgaria). The average total size and the forest area size of such a case study area amounts to about 160,000 ha and 70,000 ha, respectively. However, there is a large variance in the area sizes; the smallest case study area (Molise, Italy) is a forest biosphere reserve with slightly more than 600 ha only, while the largest (Western Peatlands, Ireland) covers an area of about 1,000,000 ha. For the purposes of this study, the case study areas (CSAs) were grouped into three tree species composition classes (Table 1). “Broadleaf” (4 CSAs) and “conifer” (9 CSAs) mean that the concerned area is dominated by deciduous species stands and conifer stands, respectively. The category “mixed” (7 CSAs) indicates a more or less balanced mixture of conifer and deciduous species in a given case study area at the stand level or on larger scales. Another simple grouping we called “social environment” considered if a case study area is located in an urban catchment (group name “city near”, 4 CSAs) or in a more rural landscape (“rural”, 16 CSAs, see Table 1).
2.2. Investigated Ecosystem Services
In total, 23 different ecosystem services have been investigated in the case study areas (Table 2). Some of them, e.g., biodiversity or harvested wood, were reported as important in each case study area; others, like the area available for reindeer herding, pine cone production or sub-specifications of harvested wood (e.g., eucalypt pulpwood, conifer sawlog production), were specific to certain case studies only (Table 3). For the purpose of this study we grouped the ecosystem services according to the six Helsinki criteria for sustainable forest management [] as well as into the four categories suggested by the FORSYS COST Action FP0804 []. Both systems overlap; however, there are some important differences. The FORSYS categories only distinguish between wood products, non-wood products, and services, noting whether these products and services are traded on markets or not. The Helsinki criteria are more detailed concerning the forest services; however, they do not make a distinction between market or non-market products and services.
Concerning the Helsinki criteria, most reported ecosystem services (ESS) belong to the groups “protective functions” (7 ESS), and wood production (5 ESS), while according to the FORSYS categories the largest groups are “non-market services” (10 ESS) and “market wood products” (5 ESS). While standing wood volume was attributed to the Helsinki class “forest resources,” it was not attributed to any of the FORSYS categories because it is neither a product nor a service per se. See Table 3 for a complete list of the investigated ecosystem services by country and case study area. For each investigated ecosystem service, country-specific index calculation methods were used and partly newly developed in the INTEGRAL project (see Supplementary Information 2 for details), taking into account the specifically most important conditions. Being more difficult to compare than uniformly calculated index values, they ensure a high relevance on the spot.
Table 2.
Forest ecosystem services (ESS) investigated in all case study areas together. The ESS were grouped (I) according to the Helsinki criteria []; and (II) according to the FORSYS categories [].
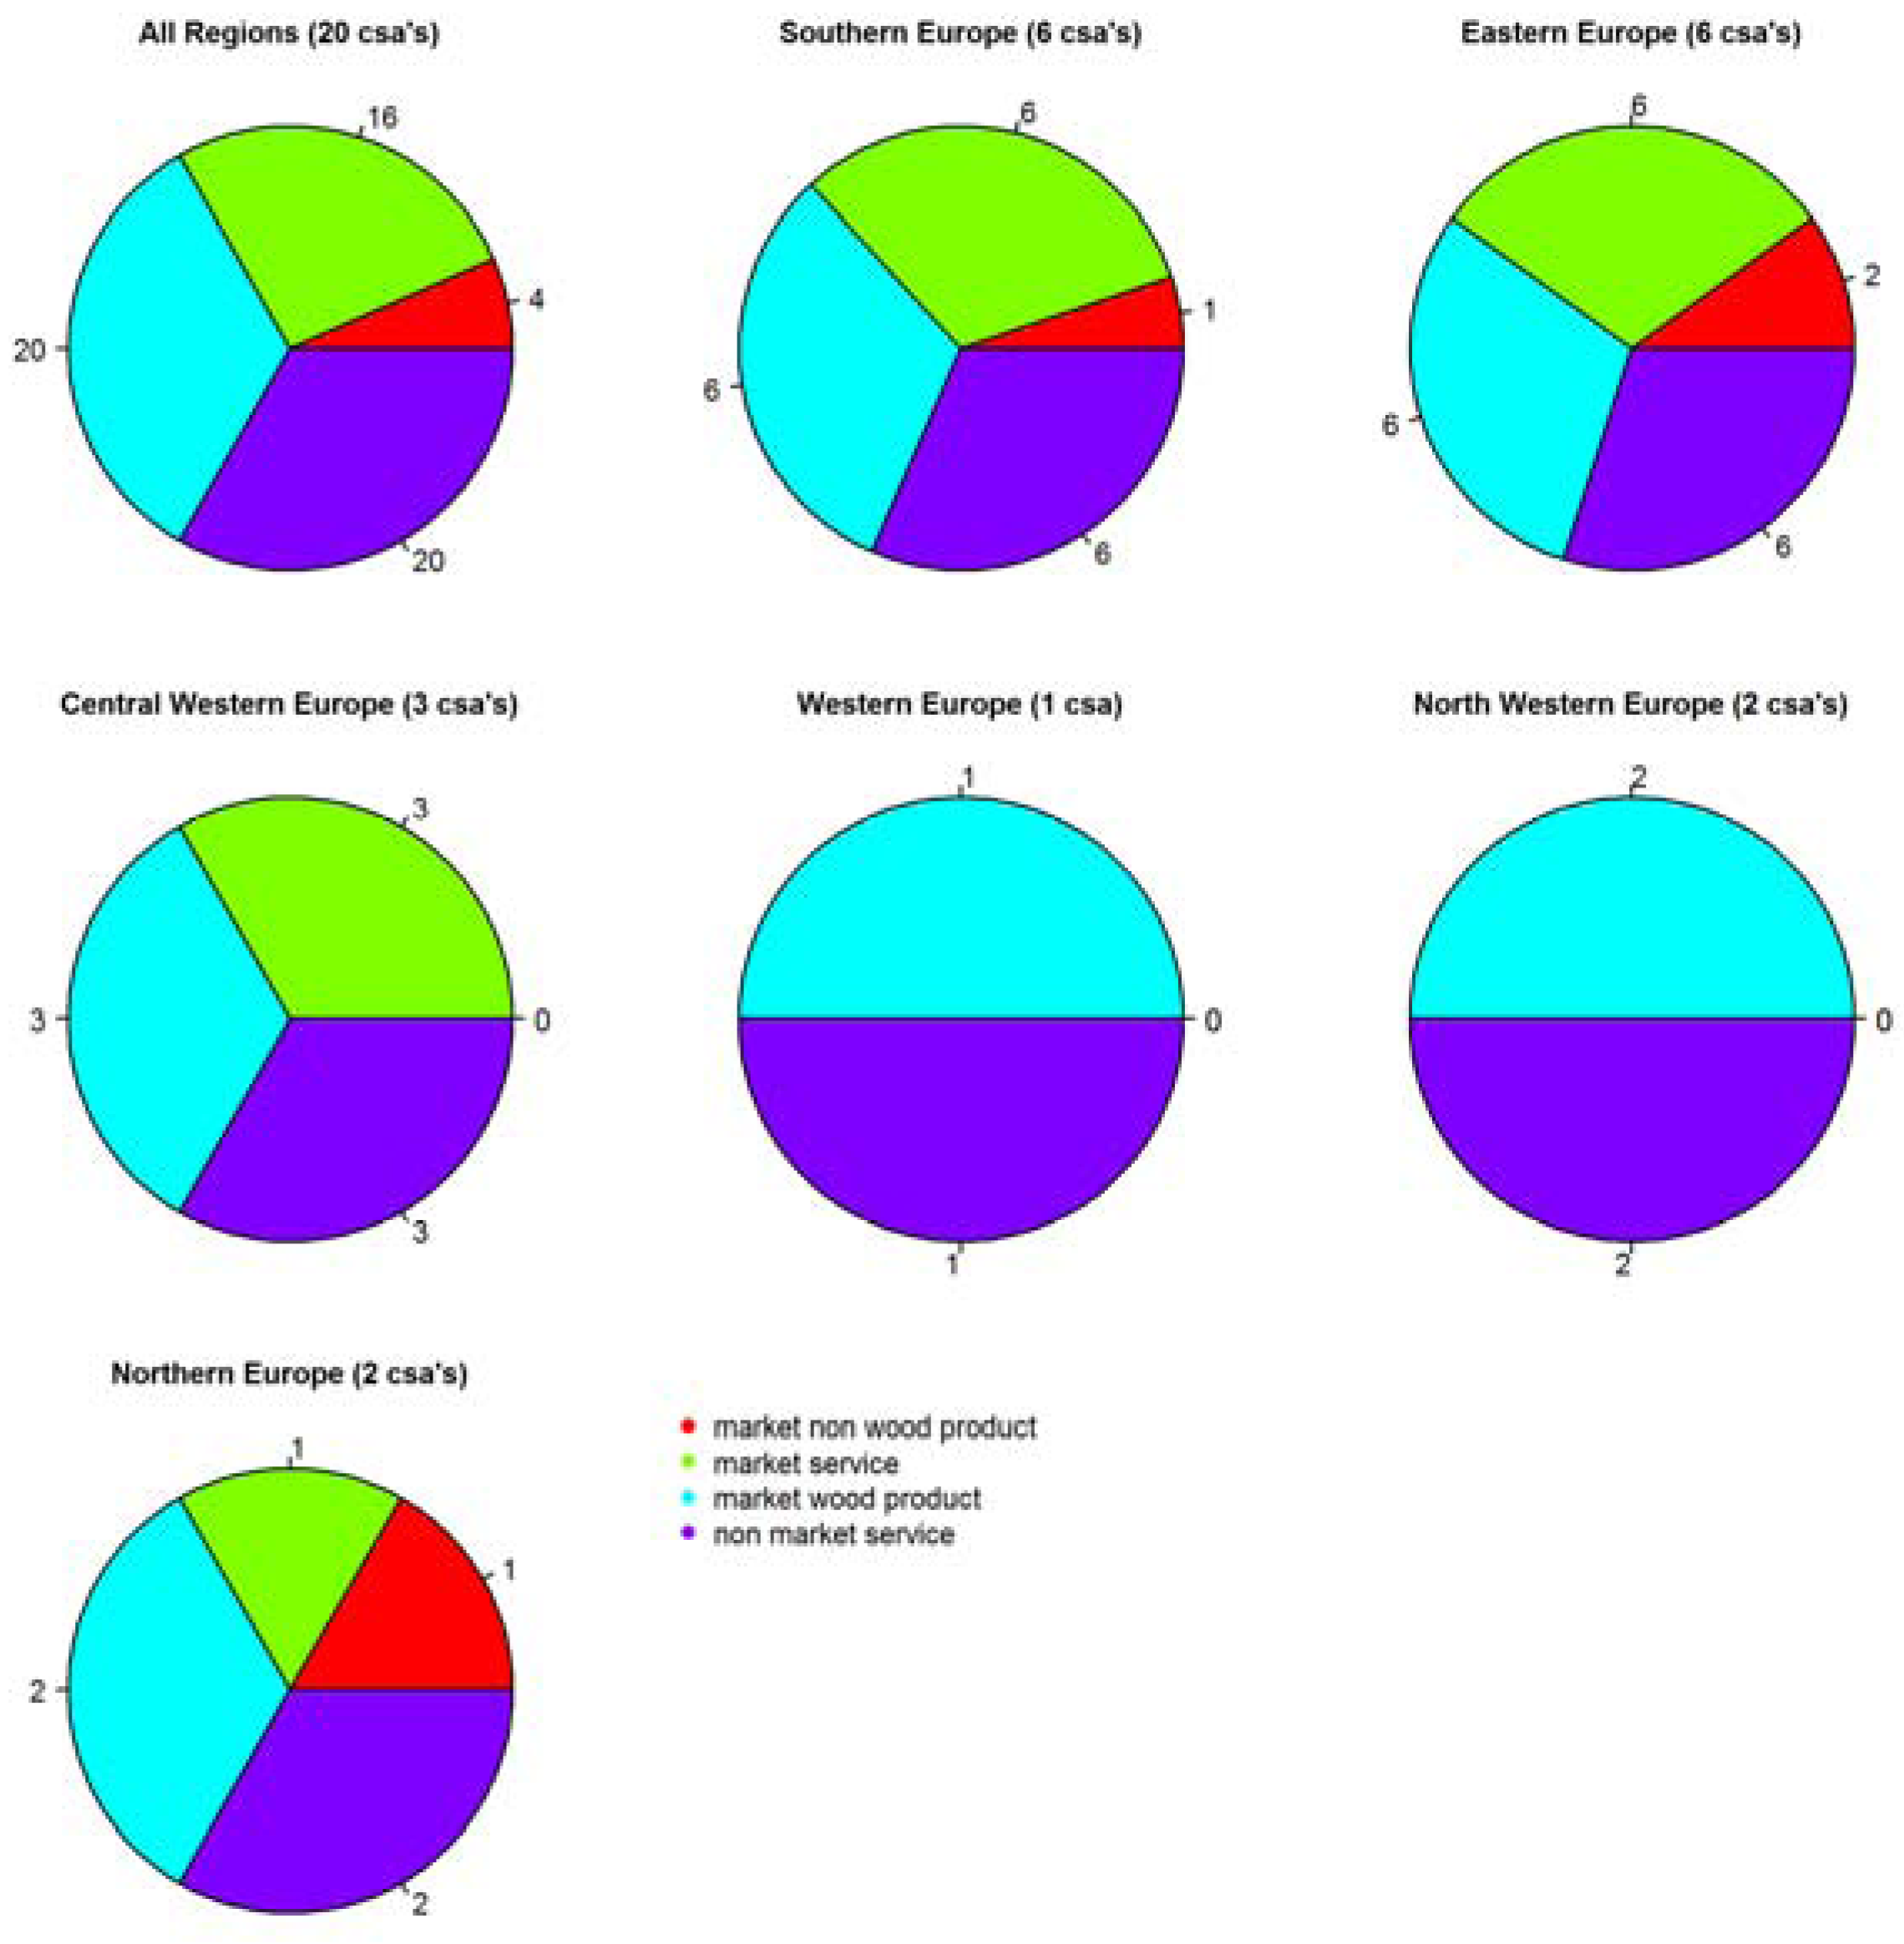
| Ecosystem Service | Helsinki Criterion No. | Helsinki Class | FORSYS Class |
|---|---|---|---|
| carbon sequestration | 1 | forest resource | non-market service |
| standing volume | 1 | forest resource | |
| harvested wood | 3 | production (wood) | market wood product |
| conifer sawlog production | 3 | production (wood) | market wood product |
| cork oak fuelwood production | 3 | production (wood) | market wood product |
| eucalypt pulpwood production | 3 | production (wood) | market wood product |
| hardwood timber production | 3 | production (wood) | market wood product |
| cork production | 3 | production (non-wood) | market non-wood product |
| mushroom production | 3 | production (non-wood) | market non-wood product |
| pine cone production | 3 | production (non-wood) | market non-wood product |
| reindeer area | 3 | production (non-wood) | market non-wood product |
| biodiversity | 4 | biodiversity | non-market service |
| coastal protection | 5 | protective functions | non-market service |
| fire safety | 5 | protective functions | non-market service |
| natural dynamics protection | 5 | protective functions | non-market service |
| quality water provision | 5 | protective functions | non-market service |
| sand dunes embankment | 5 | protective functions | non-market service |
| water & soil protection | 5 | protective functions | non-market service |
| watershed protection | 5 | protective functions | non-market service |
| hunting | 6 | socioeconomic functions | market service |
| landscape aesthetics | 6 | socioeconomic functions | non-market service |
| recreation | 6 | socioeconomic functions | market service |
| tourism | 6 | socioeconomic functions | market service |
Table 3.
Investigated ecosystem services per country and case study area (CSA).
| Country | CSA Acronym | Ecosystem Service | Helsinki Class | FORSYS Class |
|---|---|---|---|---|
| Bulgaria | TET | biodiversity | biodiversity | non-market service |
| carbon sequestration | forest resource | non-market service | ||
| harvested wood | production (wood) | market wood product | ||
| recreation | socioeconomic functions | market service | ||
| standing volume | forest resource | |||
| tourism | socioeconomic functions | market service | ||
| Bulgaria | YUN | biodiversity | biodiversity | non-market service |
| carbon sequestration | forest resource | non-market service | ||
| harvested wood | production (wood) | market wood product | ||
| recreation | socioeconomic functions | market service | ||
| standing volume | forest resource | |||
| tourism | socioeconomic functions | market service | ||
| France | PON | biodiversity | biodiversity | non-market service |
| carbon sequestration | forest resource | non-market service | ||
| harvested wood | production (wood) | market wood product | ||
| recreation | socioeconomic functions | market service | ||
| standing volume | forest resource | |||
| Germany | MUN | biodiversity | biodiversity | non-market service |
| carbon sequestration | forest resource | non-market service | ||
| harvested wood | production (wood) | market wood product | ||
| quality water provision | protective functions | non-market service | ||
| recreation | socioeconomic functions | market service | ||
| Germany | UPP | biodiversity | biodiversity | non-market service |
| carbon sequestration | forest resource | non-market service | ||
| harvested wood | production (wood) | market wood product | ||
| recreation | socioeconomic functions | market service | ||
| Ireland | NEW | biodiversity | biodiversity | non-market service |
| carbon sequestration | forest resource | non-market service | ||
| harvested wood | production (wood) | market wood product | ||
| quality water provision | protective functions | non-market service | ||
| Ireland | WES | biodiversity | biodiversity | non-market service |
| carbon sequestration | forest resource | non-market service | ||
| harvested wood | production (wood) | market wood product | ||
| quality water provision | protective functions | non-market service | ||
| Italy | ASI | biodiversity | biodiversity | non-market service |
| carbon sequestration | forest resource | non-market service | ||
| harvested wood | production (wood) | market wood product | ||
| recreation | socioeconomic functions | market service | ||
| Italy | ETN | biodiversity | biodiversity | non-market service |
| carbon sequestration | forest resource | non-market service | ||
| harvested wood | production (wood) | market wood product | ||
| recreation | socioeconomic functions | market service | ||
| Italy | MOL | biodiversity | biodiversity | non-market service |
| carbon sequestration | forest resource | non-market service | ||
| harvested wood | production (wood) | market wood product | ||
| recreation | socioeconomic functions | market service | ||
| Lithuania | KAZ | biodiversity | biodiversity | non-market service |
| harvested wood | production (wood) | market wood product | ||
| recreation | socioeconomic functions | market service | ||
| water & soil protection | protective functions | non-market service | ||
| Lithuania | ZEM | carbon sequestration | forest resource | non-market service |
| harvested wood | production (wood) | market wood product | ||
| recreation | socioeconomic functions | market service | ||
| Netherlands | SEV | biodiversity | biodiversity | non-market service |
| carbon sequestration | forest resource | non-market service | ||
| fire safety | protective functions | non-market service | ||
| harvested wood | production (wood) | market wood product | ||
| landscape aesthetics | socioeconomic functions | non-market service | ||
| natural dynamics protection | protective functions | non-market service | ||
| Portugal | CHA | carbon sequestration | forest resource | non-market service |
| conifer sawlog production | production (wood) | market wood product | ||
| cork oak fuelwood production | production (wood) | market wood product | ||
| cork production | production (non-wood) | market non-wood product | ||
| eucalypt pulpwood production | production (wood) | market wood product | ||
| pine cone production | production (non-wood) | market non-wood product | ||
| recreation | socioeconomic functions | market service | ||
| Portugal | LEI | carbon sequestration | forest resource | non-market service |
| coastal protection | protective functions | non-market service | ||
| conifer sawlog production | production(wood) | market wood product | ||
| recreation | socioeconomic functions | market service | ||
| sand dunes embankment | protective functions | non-market service | ||
| watershed protection | protective functions | non-market service | ||
| Portugal | SOU | carbon sequestration | forest resource | non-market service |
| conifer sawlog production | production (wood) | market wood product | ||
| eucalypt pulpwood production | production (wood) | market wood product | ||
| hardwood timber production | production (wood) | market wood product | ||
| recreation | socioeconomic functions | market service | ||
| Slovakia | KYS | biodiversity | biodiversity | non-market service |
| carbon sequestration | forest resource | non-market service | ||
| harvested wood | production (wood) | market wood product | ||
| hunting | socioeconomic functions | market service | ||
| mushroom production | production (non-wood) | market non-wood product | ||
| quality water provision | protective functions | non-market service | ||
| recreation | socioeconomic functions | market service | ||
| standing volume | forest resource | |||
| Slovakia | POD | biodiversity | biodiversity | non-market service |
| carbon sequestration | forest resource | non-market service | ||
| harvested wood | production (wood) | market wood product | ||
| hunting | socioeconomic functions | market service | ||
| mushroom production | production (non-wood) | market non-wood product | ||
| quality water provision | protective functions | non-market service | ||
| recreation | socioeconomic functions | market service | ||
| standing volume | forest resource | |||
| Sweden | HEL | biodiversity | biodiversity | non-market service |
| carbon sequestration | forest resource | non-market service | ||
| harvested wood | production (wood) | market wood product | ||
| quality water supply | protective functions | non-market service | ||
| Sweden | VIL | biodiversity | biodiversity | non-market service |
| carbon sequestration | forest resource | non-market service | ||
| harvested wood | production (wood) | market wood product | ||
| recreation | socioeconomic functions | market service | ||
| reindeer area | production (non-wood) | market non-wood product | ||
| standing volume | forest resource | |||
| tourism | socioeconomic functions | market service |
2.3. Simulation Tools/DSS and Forest Data
Most of the simulation tools used in the case studies are single tree or stand level models (Table 4). While Table 4 gives the main references for these models, Supplementary Information 3 informs about their validity and applicability for the respective selected case study areas, and provides additional references. With a few exceptions (the Netherlands, Portugal), where partly process-based models were applied, these models were empirically or semi-empirically calibrated. In three countries (Ireland, Portugal, and Sweden), actual DSS with embedded simulation models were used. Thereby, the approach was to mirror different forest owners’ or manager groups’ attempts to optimize their target achievement within different policy frameworks. In the other cases, the simulations underwent no formal optimization. The forest data that were used to define the initial state for the scenario simulations mostly come from national and enterprise-level forest inventories or a combination of both. In France and Sweden remote sensing surveys also served as a forest data source.
Algorithms for calculating ecosystem service provision indices were either available as implemented in the simulation tools/DSS or were applied to the simulation results in a separate step following the scenario runs.
Table 4.
Simulation tools/DSS and forest data sources used in the different countries.
| Country | Simulation Tool/DSS Type | Tool Name | Forest Data |
|---|---|---|---|
| Bulgaria | individual tree model | SIBYLA [] | forest inventory |
| France | tree and stand level models embedded in a multi-model pool | Fagacées [] and Maritime Pine Model [], embedded in CAPSIS [] with SIMMEM extension for landscape applications. | derived from aerial photographs and MODIS satellite images |
| Germany | single tree simulator | SILVA [,] | Forest enterprise inventories and German Federal Forest Inventory |
| Ireland | spatial DSS (including stand level models) | Remsoft Woodstock [] | Landscape inventory data (forest and agriculture) |
| Italy | large-level matrix model | EFISCEN [,] | Stand wise forest management plan data |
| Lithuania | large scale stand-level forestry simulator | Kupolis [] | Lithuanian stand wise forest inventory |
| Nether-lands | process based forest landscape simulation model (pixel or raster-based) | LandClim [,] | Detailed forest inventory (from 1981), projected to 2010 with a carefully checked spin-up run |
| Portugal | empirical and process-based individual or stand level models | SADfLOR toolbox [,] | Stand- and tree-level forest inventory data |
| Slovakia | individual tree model | SIBYLA [,] | Stand level inventory data from obligatory forest management plan |
| Sweden | DSS (including individual tree models) | Heureka [] | National Forest Inventory Plots combined with satellite images |
2.4. Forest Management Scenarios
The scenarios calculated with the above-mentioned tools originate from case-study specific policy analyses performed in the INTEGRAL project. Although this study utilizes these scenarios uncoupled from their political context, the original concept needs to be explained.
For each case study, several possible alternative socioeconomic scenarios for the coming decades were elaborated. As the forest area in most case studies belongs to different groups of owners, the probable forest management behavior of the different relevant owner types in the context of a given socioeconomic scenario was elaborated in detail. In order to make this information feasible for scenario calculations, owner behavior was translated into quantitative management rules and definitions, which were directly compatible with the specific simulation tools/DSS (see [] for detailed explanations of the scenario building process). Although the applied simulation tools/DSS are very different, typical variables that defined forest management for simulation purposes were intensity and type of thinnings (e.g., thinning from above or below, selective thinning, etc.), thinning frequency, rotation length, and species preferences for harvesting and regenerating stands. Dependent on the specific simulation tool’s/DSS’s concept and the case studies’ frame conditions, such settings were in some cases applied in an overarching way for large forest landscape compartments, in other cases very detailed with specific settings for a broad spectrum of different forest stand types. On average, four different scenarios (max. 7, min. 3) were defined per case study area, amounting to 85 scenarios in total. In each case study, all scenarios started with the same initial forest state, and were applied immediately, i.e., possible transient phases from current concepts to the scenario conditions were neglected. The scenarios were simulated for three decades in most case studies; in some cases the simulations were extended to 50 years (Bulgaria, France, Netherlands), and 60 years (Lithuania). The central simulation outcomes were the case study-specific indicators for ecosystem service provision at the end of the simulation time span. Climate conditions were assumed to be constant at their present state.
While in the original INTEGRAL context the scenarios’ policy aspects are highly important, this study focuses on the treatment-dependency of ecosystem service provision. Thus, for the purpose of this work, a simple scenario grouping that could be meaningfully applied across all case studies was sought. As all case studies covered one scenario that could be interpreted as “business as usual” (or was explicitly called so), this was used as the reference for grouping. As the grouping criterion that could be applied in each case study while being relevant for this work as well, we chose forest management intensity. A scenario was termed “more intensive” or “less intensive” if it assumed a more intensive forest management on case study area level compared to business as usual. Precisely, “more intensive” means that on landscape level a higher wood production is strived for. This mainly comprises measures like increased felling budgets and rotation shortening, which are often accompanied by reduced stand densities, but also indirect measures like increasing the share of more productive tree species in the course of thinnings and stand regeneration (cf. []). Here, we made no difference between whether this is done evenly on the whole area or by a strong treatment segregation on stand level, as long as the overall goal—higher wood production at the landscape level—was the same. In addition to the scenarios “business as usual,” “more intensive,” and “less intensive,” we introduced a fourth group, called “near business as usual.” In this group, we pooled all scenarios that were comparable to business as usual in terms of management intensity, but resulted from another policy framework, which was not defined as the respective case study’s business as usual. This grouping resulted in 20 “business as usual,” 25 “less intensive,” 32 “more intensive,” and eight “near business as usual” scenarios (Table 5).
Table 5.
Number of calculated scenarios by scenario category, country, and case study area (CSA).
| # of Scenarios in Scenario Category | |||||
|---|---|---|---|---|---|
| Country | CSA-Acronym | Business as Usual | Near b.a.u. | Less Intensive | More Intensive |
| Bulgaria | TET | 1 | 0 | 1 | 1 |
| Bulgaria | YUN | 1 | 0 | 1 | 1 |
| France | PON | 1 | 1 | 2 | 2 |
| Germany | MUN | 1 | 0 | 2 | 1 |
| Germany | UPP | 1 | 0 | 1 | 2 |
| Ireland | NEW | 1 | 0 | 2 | 1 |
| Ireland | WES | 1 | 1 | 0 | 3 |
| Italy | ASI | 1 | 0 | 1 | 3 |
| Italy | ETN | 1 | 1 | 3 | 2 |
| Italy | MOL | 1 | 0 | 1 | 2 |
| Lithuania | KAZ | 1 | 0 | 1 | 2 |
| Lithuania | ZEM | 1 | 0 | 1 | 2 |
| Netherlands | SEV | 1 | 1 | 1 | 2 |
| Portugal | CHA | 1 | 1 | 0 | 2 |
| Portugal | LEI | 1 | 1 | 0 | 2 |
| Portugal | SOU | 1 | 1 | 2 | 0 |
| Slovakia | KYS | 1 | 0 | 2 | 0 |
| Slovakia | POD | 1 | 0 | 1 | 1 |
| Sweden | HEL | 1 | 1 | 1 | 2 |
| Sweden | VIL | 1 | 0 | 2 | 1 |
| Sum | 20 | 8 | 25 | 32 | |
It is important to keep in mind that an overall reference scenario does not make sense. The case study-specific business as usual scenarios strongly reflect each country’s or forest region’s socioeconomic frame conditions for forestry. Evidently, they also depend on the current forest state in each case study area, which results from long-term feedback between the social economy and the forest state itself. The second INTEGRAL policy brief [] denominates the socioeconomic context for each forest region, which ranges from “commodity-oriented forestry driven by strong forest industry, large forest area and globalized wood market” in Northern Europe to “amenity-oriented forestry influenced by small forest areas und urban society demands” in Western Europe (see Table 6 for a complete list).
2.5. Scenario Result Consolidation
As each country or case study had its own indices for given ecosystem services, a cross-country comparison based on the direct simulation results was not feasible. Instead, based on the expertise of each contributing research team, we classified each ecosystem service’s value on landscape level obtained at the end of a scenario simulation along an ordinal scale, expressed through the symbols “--”, “−”, “0”, “+”, “++”. Here, “0” means no meaningful change compared to the initial situation. The signs “+” and “−”, by contrast, indicate an increase or decrease, respectively, which is considered meaningful for the stakeholders in the case study area of interest, and “++” and “--” symbolize an increase or decrease that is considered particularly strong in the case study’s context. While inevitably losing quantitative information, this scaling overcomes the problem that in different regions meaningful changes of the same ecosystem service might imply different orders of magnitude.
Table 6.
European forest regions, their current socioeconomic context, and representative countries in this study. Adapted from the 2nd INTEGRAL policy brief [].
| Forest Region | Socioeconomic Context | Representative Countries |
|---|---|---|
| Eastern Europe | commodity-oriented forestry driven by transition to market economy, moderate role of forest industry and relatively large forest areas | Bulgaria, Lithuania, Slovakia |
| Central Western Europe | multifunctional forestry driven by a pluralistic society, market economy, moderate forest areas, and moderate role of forest industry | France, Germany |
| North Western Europe | plantation-oriented forestry driven by small forest area and market economy | Ireland |
| Southern Europe | partly low forest management driven by primacy of non-wood products and natural risks; partly plantation-oriented forestry driven by property fragmentation, forest industry, market economy, and natural risks | Italy, Portugal |
| Western Europe | amenity-oriented forestry influenced by small forest areas und urban society demands | The Netherlands |
| Northern Europe | commodity-oriented forestry driven by strong forest industry, large forest area, and globalized wood market | Sweden |
The classification was performed in a combined bottom-up/top-down-approach. We communicated the above classification scheme to the contributing teams, and they reported their classification as well as the corresponding numerical simulation output. During the consolidation process we carefully checked and compared all group reports and called back in case of potential incongruities. Most important for the subsequent analyses was the comparison of the non-business-as-usual scenario outcomes with the related business as usual scenario. To this end, we assigned the numerical values −2, −1, 0, 1, and 2 to the ordinal scale “--”, “−”, “0”, “+”, and “++” in exactly this order. From each numerical ecosystem service value obtained in a given scenario we subtracted the corresponding business as usual value (e.g., subtracting “++” from “−” means −1 − 2 = −3, indicating a strong decrease in a given ecosystem service’s provision compared to business as usual). In order to avoid pseudo-precision, all such results greater or smaller than zero were assigned “+” or “−”, respectively, and all zero results were marked with “0.” Thus, “+” and “−” express a meaningful increase or decrease of an ecosystem service compared to business as usual at the end of the simulation time span, while “0” indicates no momentous difference.
2.6. Evaluating the Consolidated Results
Given the consolidated scenario outcomes described above, it was possible to scrutinize them for influences of the management scenario groups as defined above (“more intensive,” “less intensive,” “near business as usual”) on ecosystem service provision. Hereby the ecosystem services were grouped according to both the Helsinki criteria and the FORSYS-classification (see 2.2). In this context, ecosystem service provision is always understood as deviation from business as usual.
The case study-specific covariables forest region, species composition, and social environment were considered as well. Although technically possible, we refrained from testing effects statistically, as the simulation outcomes are not empirical but modeled data. As the backbone of our descriptive analysis we chose mosaic plots [] as implemented in the R-package vcd []. A mosaic plot’s total area (Figure 4 may be taken as an example) represents the total amount of observations taken into account. This area is divided into tiles that display a specific combination of categorical properties (like scenario category, social environment, etc. in Figure 4) each. Each tile’s area represents the number of observations inside such a property combination. See Supplementary Information 1 for a detailed explanation of how to read mosaic plots.
3. Results
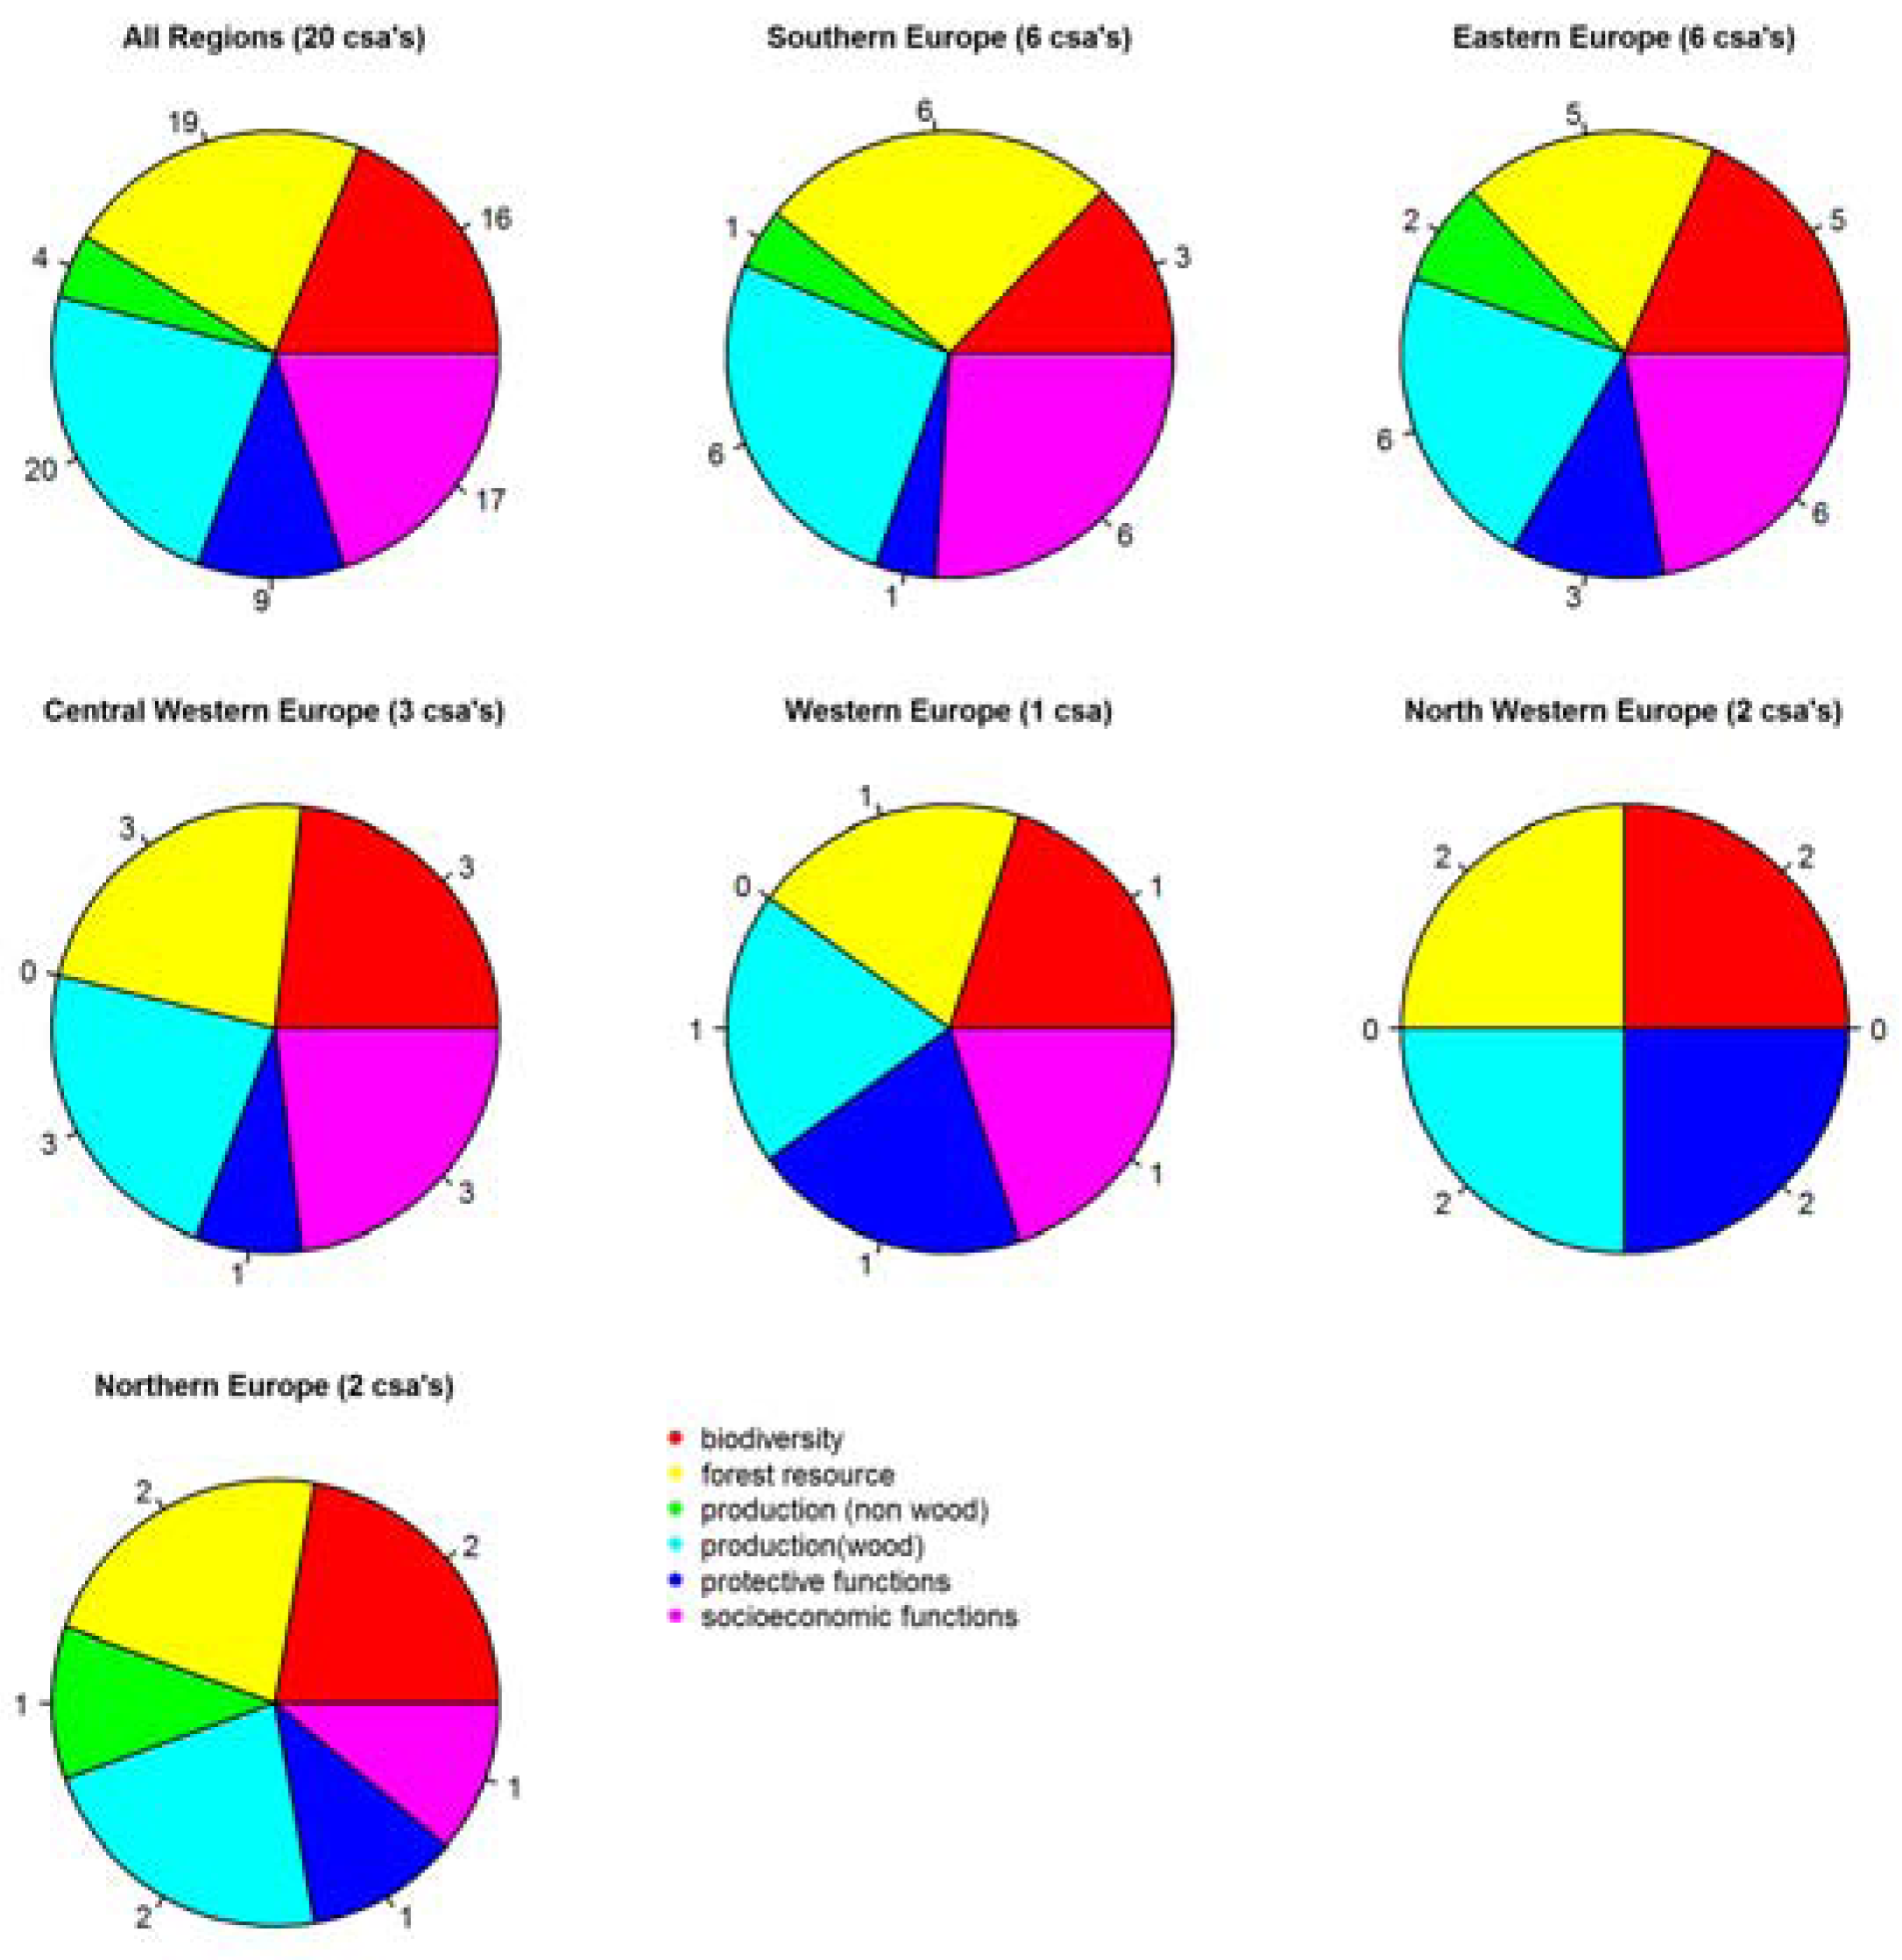
3.1. Ecosystem Services’ Pervasiveness
The choice of ecosystem services reported from the single case study areas gives an indication of their relevance and pervasiveness. For the Helsinki and FORSYS classifications, Figure 2 and Figure 3 show for how many case study areas a given ecosystem service category was reported. Concerning the Helsinki classes, across all regions, only wood production is reported in 20 out of 20 case study areas. Nearly the same is true for forest resource maintenance (19 out of 20). Socioeconomic functions (17 out of 20) and biodiversity (16 out of 20) show a high pervasiveness as well. Far less prominent are protective functions (9 out of 20) and non-wood production (4 out of 20). Although protective functions are reported for about half the case study areas only, they were dealt with in each of the forest regions (Figure 2). They are, however, a most diverse and region-specific group, ranging from fire protection in the Netherlands to coastal protection in Portugal, with water protection-related issues being the most prominent overall. Non-wood production-related ecosystem services are reported only for Southern, Eastern, and Northern Europe, which reflects the prominence of wood in the Western European countries’ forest products. From the FORSYS categories’ perspective, market wood products and non-market services are equally prominent throughout Europe and reported in each of the case study areas (Figure 3). Market services were not reported for Western Europe and North Western Europe.
Figure 2.
Region-overarching and regional shares of reported ecosystem services categories grouped by the Helsinki criteria. Each sector represents the number of case study areas where a given ecosystem service category was reported.
Figure 3.
Region-overarching and regional shares of reported ecosystem services grouped by the FORSYS classification. Each sector represents the number of case study areas where a given ecosystem service category was reported.
3.2. Management Sensitivity of Ecosystem Service Provision
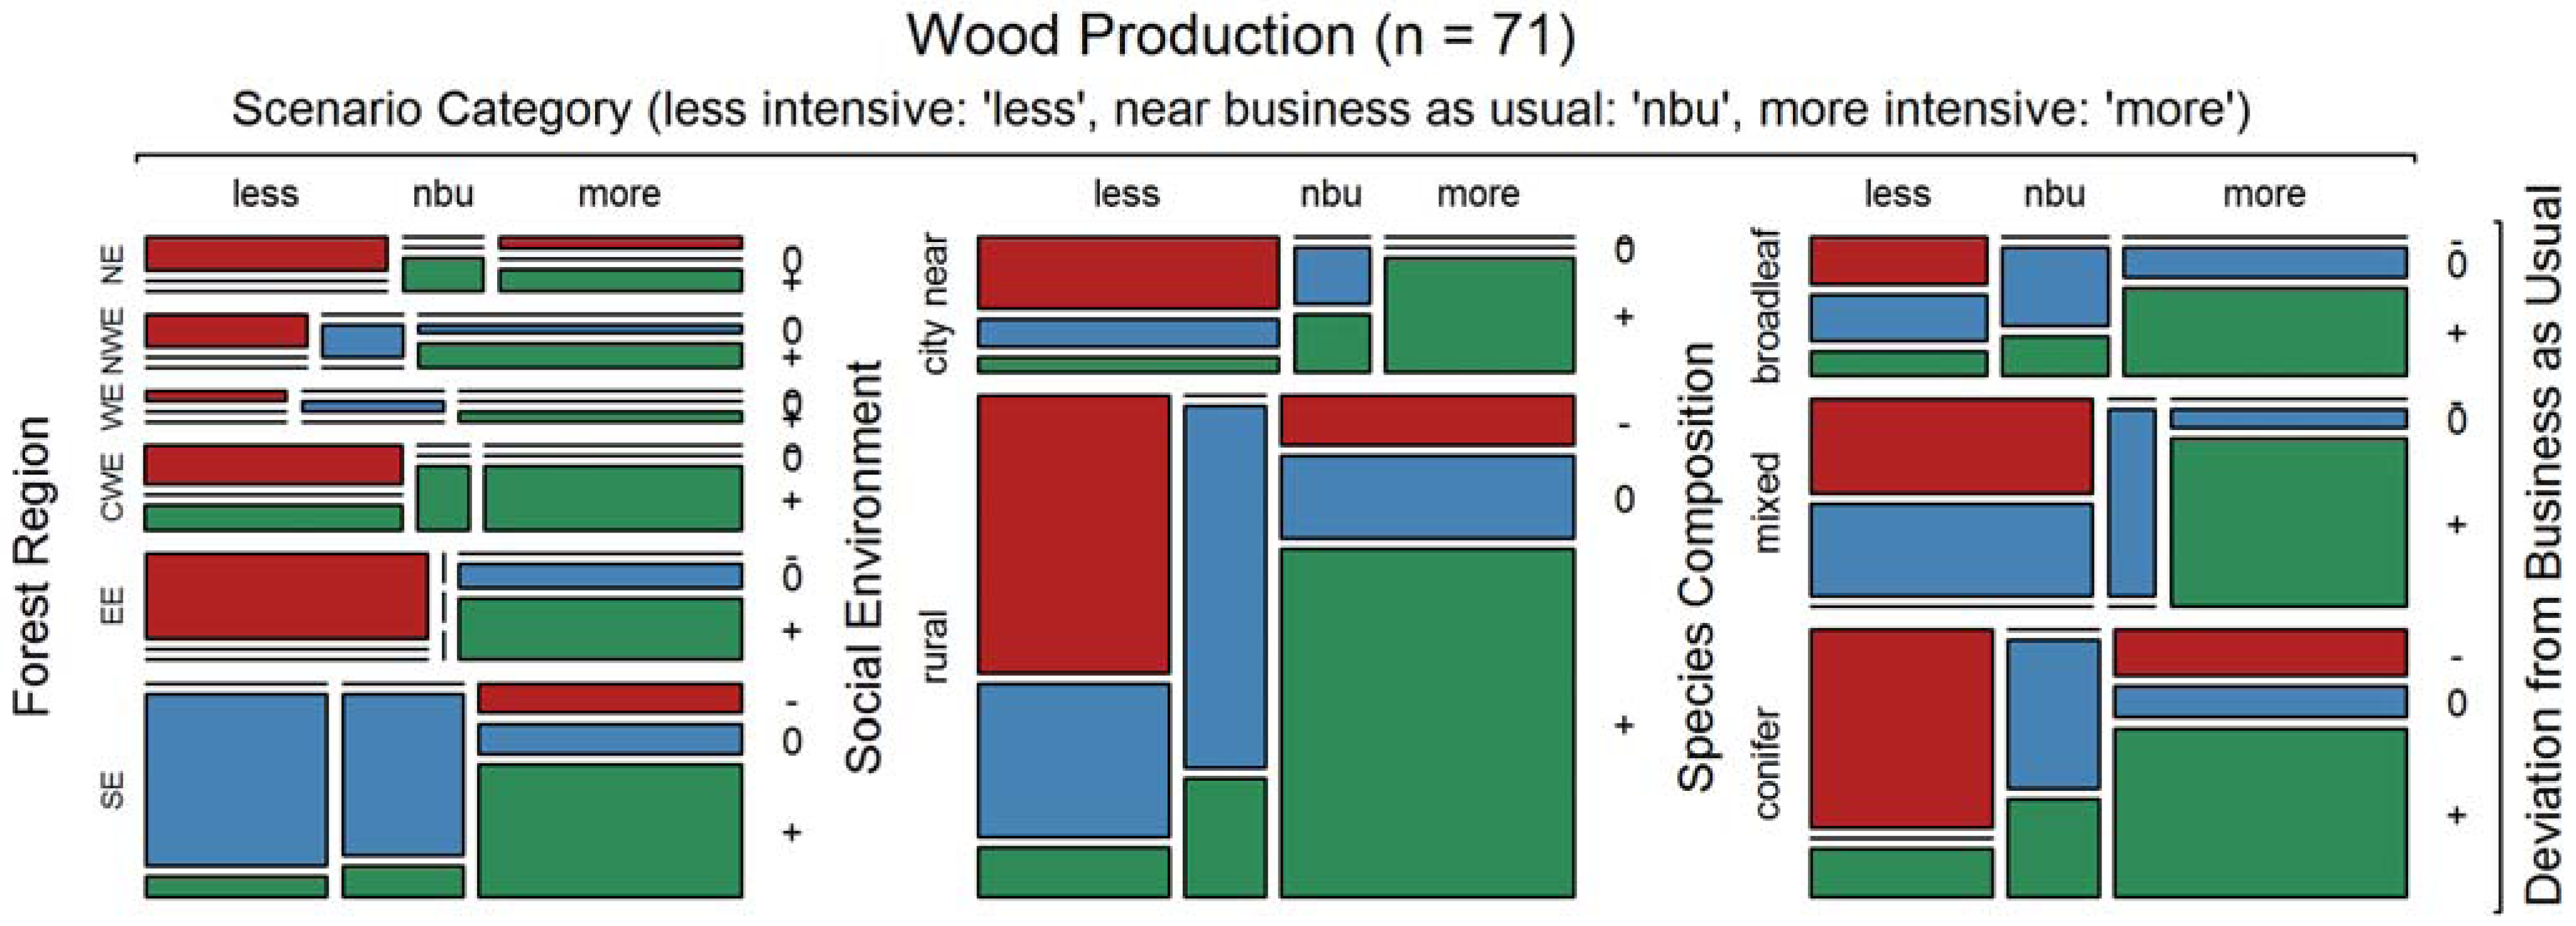
3.2.1. Wood Production/Market Wood Products
As expected, the ecosystem services belonging to the Helsinki group “wood production” (equivalent to the FORSYS class “market wood products”) display a strong dependency on management intensity (Figure 4). More intensive management leads to marked increases in wood production, less intensive to marked losses. Taking forest region as a covariable (Figure 4, left panel), two exceptions become evident: in the Southern European case studies, less intensive management (similar to “near business as usual”) leads to almost no change compared to business as usual. In Central Western Europe, less intensive management sometimes leads to increased wood production, the reason being that accumulating standing wood volume forces managers to increase their harvest level after some decades, even in the framework of a less intensive management scenario.
Figure 4.
Sensitivity of wood production in relation to management intensity, by forest region, social environment, and species composition. Deviation from business as usual: “−” (red), “0” (blue). “+” (green): decreased, unchanged, increased ecosystem service provision compared to business as usual. Scenario Category: Less intensive (“less”), more intensive treatment (“more”), and near business as usual (“nbu”). Forest Regions: “SE”—Southern Europe, “EE”—Eastern Europe, “CWE”—Central Western Europe, “WE”—Western Europe, “NWE”—North Western Europe, “NE”—Northern Europe.
Social environment (rural vs. near city, Figure 4, middle panel) does not show any influence as a covariable to management intensity. For species composition as a covariable (Figure 4, right panel), a similar lack of influence was observed. However, losses in wood production occur as a result of more intensive management in conifer-dominated forest landscapes (in Southern and Northern Europe) only.
Summary: Wood production (market wood product provision) clearly increases with management intensity with some region-specific exceptions. The social environment and species composition do not significantly impact on this relationship.
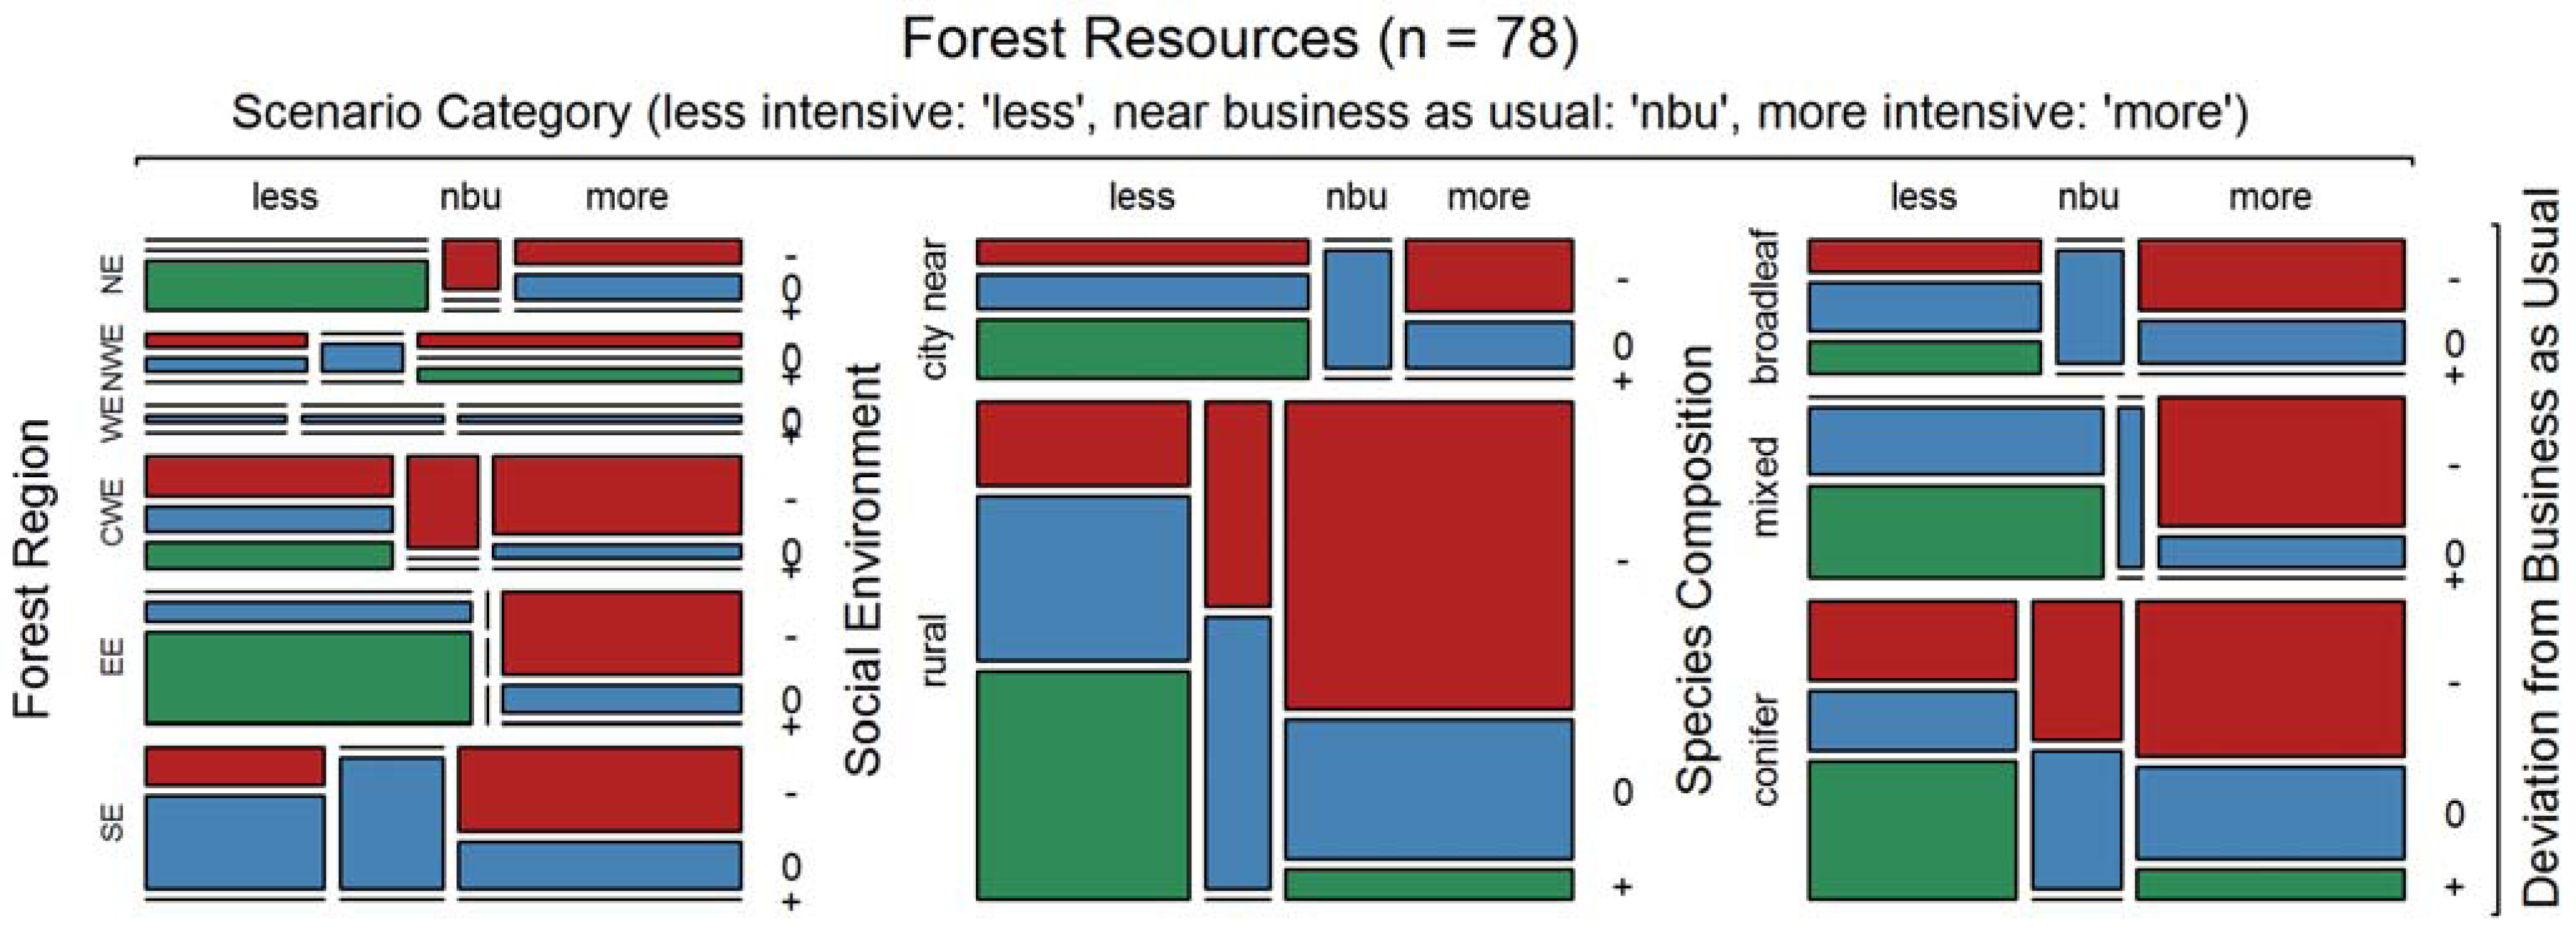
3.2.2. Forest Resources
The Helsinki class Forest Resources includes all ecosystem services related to carbon storage and standing volume. Thus, this class is closely related to the non-market services FORSYS class. As expected, we observe a clear, opposite trend to the one for wood production-related ecosystem services shown above. More intensive treatment reduces the standing volume and therefore also the carbon storage (Figure 5). There are, however, region-specific differences. Losses dominate with more intensive management in Southern Europe, Eastern Europe, and Central Western Europe (Figure 5, left panel). Massive gains are associated with less intensive management in Eastern Europe and Northern Europe, in contrast with the losses associated with more intensive treatment in the same regions. In Southern Europe, only a weak trend was found, with no gains at all with reduced management intensities; in Western Europe, we see no trend at all. In Central Western Europe, North Western Europe, and Southern Europe, losses do also occur when management is less intensive. This may be partly due to a more complex approach towards carbon modeling in some case studies, where C-storage in harvested wood products was included in the assessment.
Figure 5.
Sensitivity of the Helsinki class Forest Resources in relation to management intensity, by forest region, social environment, and species composition. Deviation from business as usual: “−” (red), “0” (blue). “+” (green): decreased, unchanged, increased ecosystem service provision compared to business as usual. Scenario Category: Less intensive (“less”), more intensive treatment (“more”), and near business as usual (“nbu”). Forest Regions: “SE”—Southern Europe, “EE”—Eastern Europe, “CWE”—Central Western Europe, “WE”—Western Europe, “NWE”—North Western Europe, “NE”—Northern Europe.
In relation to the social environment (Figure 5, middle panel), a general trend—losses and gains associated, respectively, with more and less intensive management—is evident; however, there is no marked difference between rural and near city case studies. The same is true for species composition (Figure 5, right panel); however, only in mixed species settings did no losses in forest resources occur with reduced management intensity.
Summary: Forest resources are in general reduced with more intensive management, and less intensive treatment may lead to considerable gains in some regions. This general trend is most pronounced in mixed species settings.
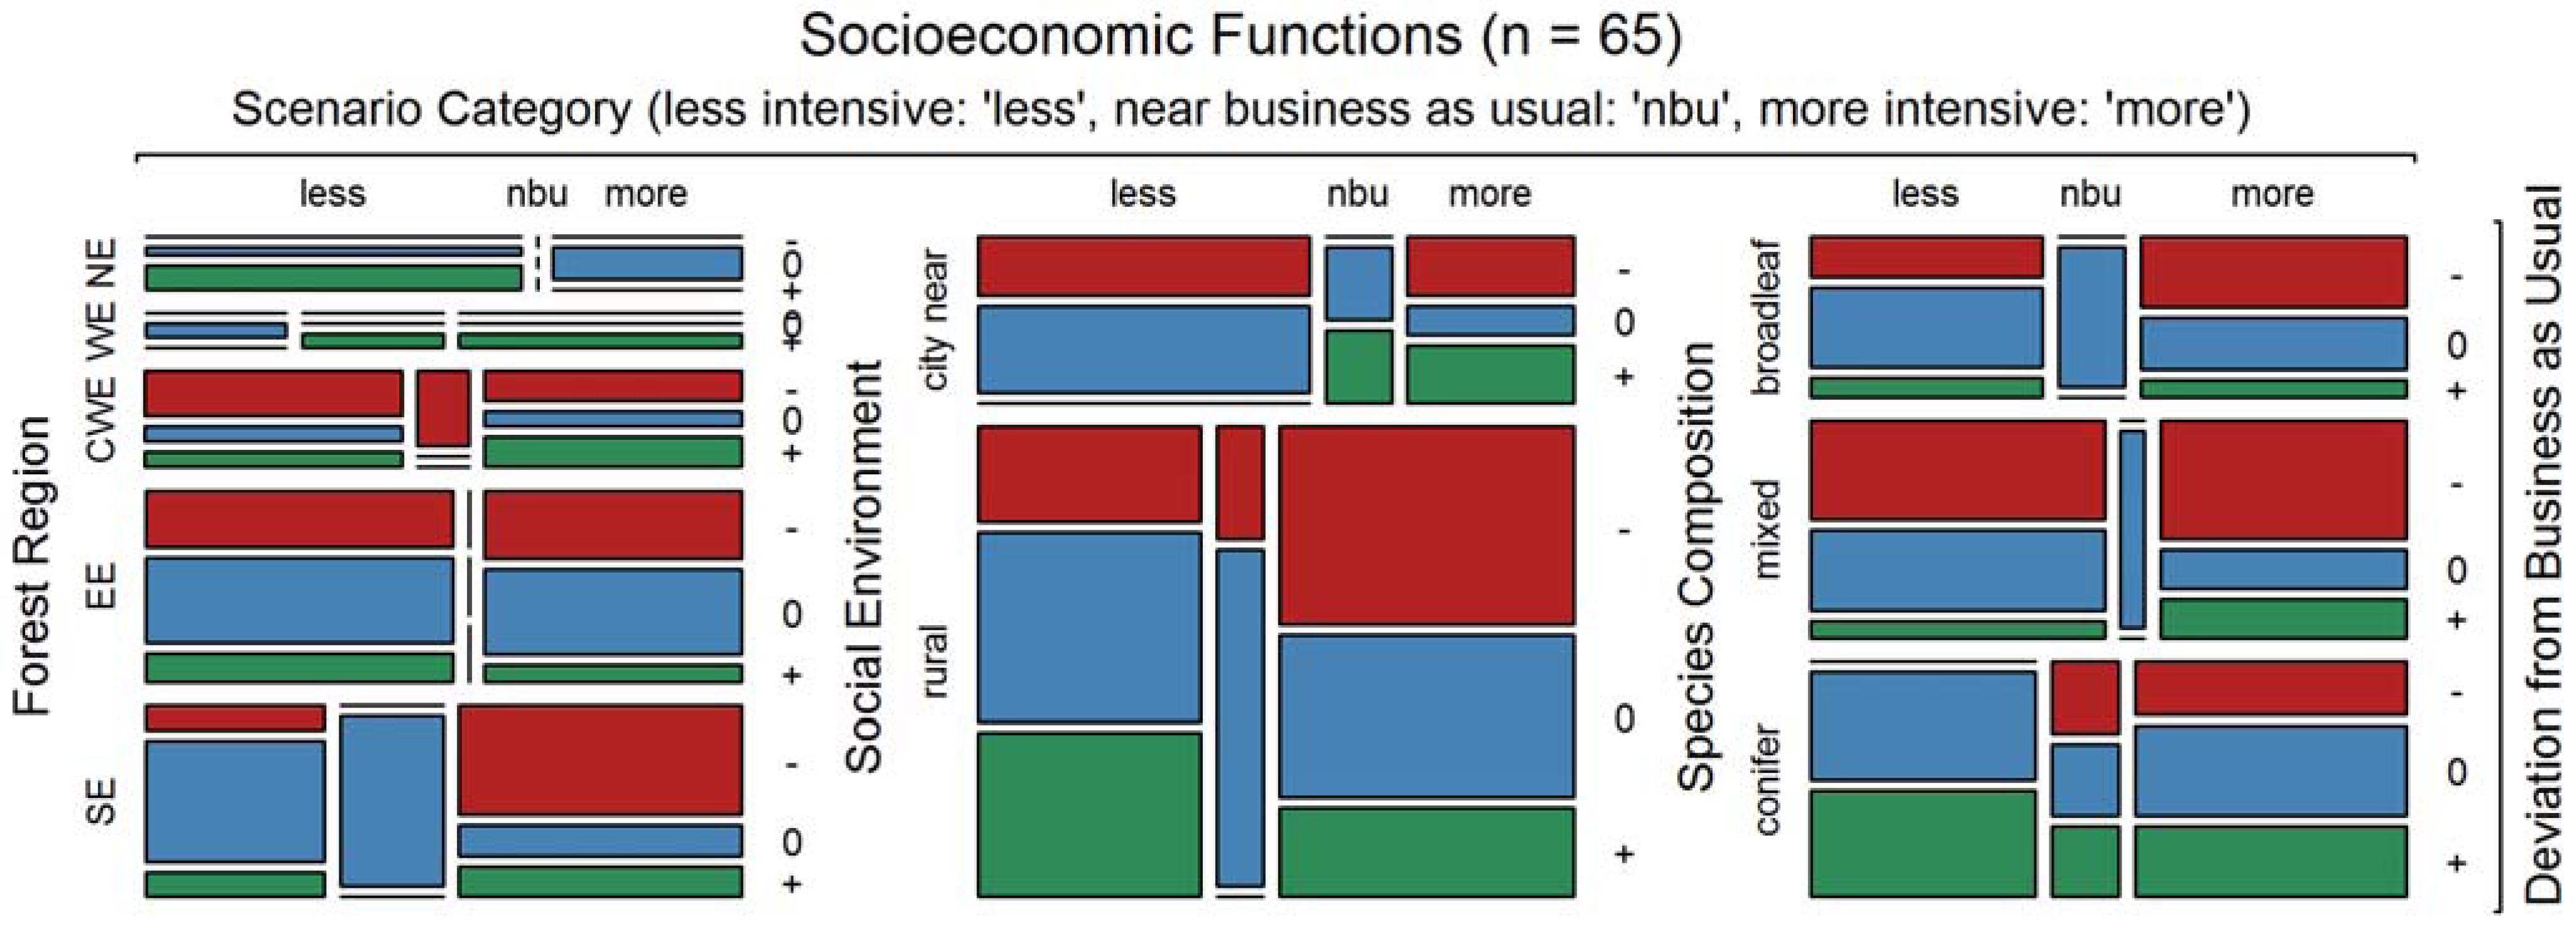
3.2.3. Socioeconomic Functions/Market Services
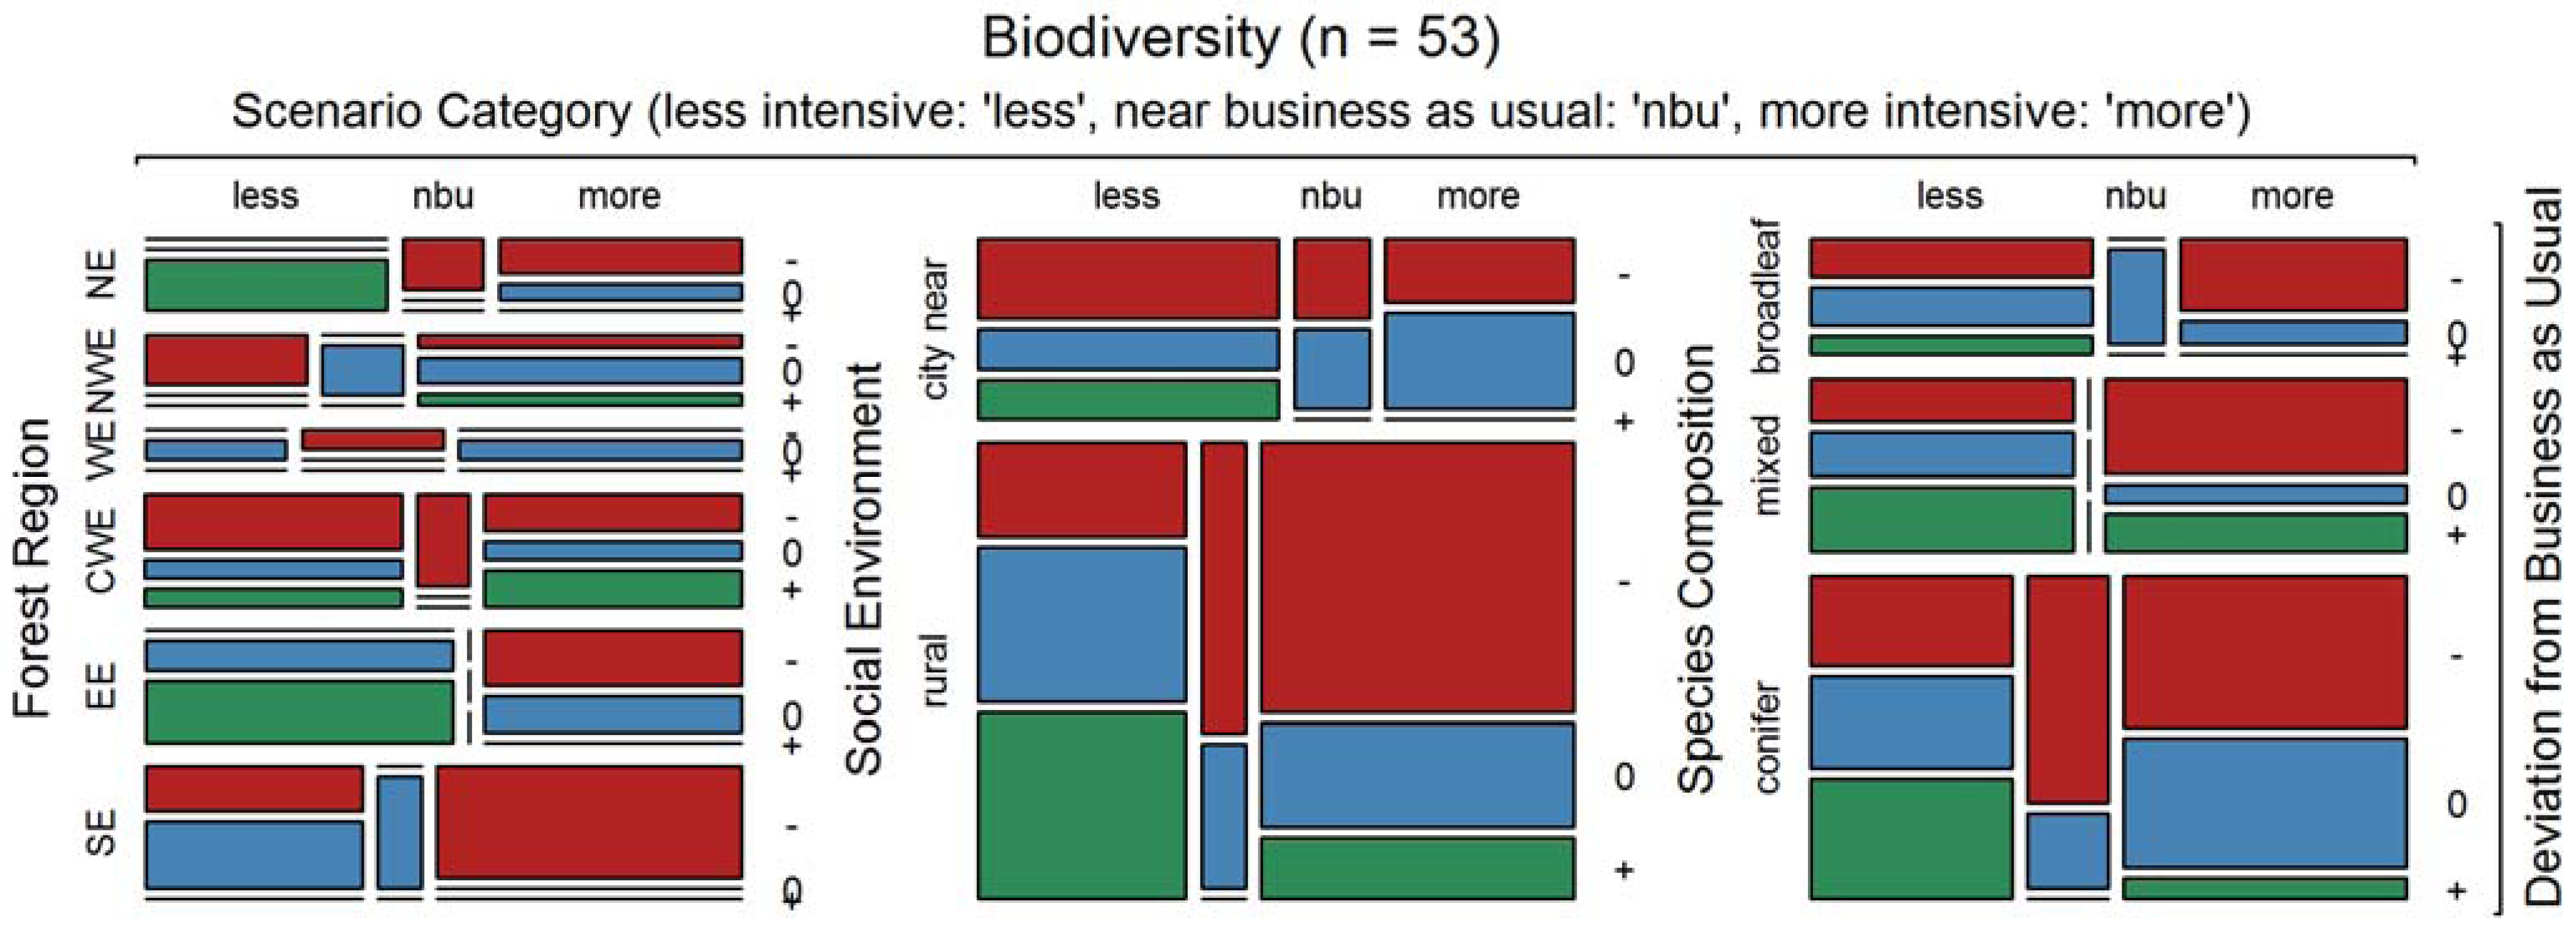
Besides recreation and tourism, which solely define the FORSYS class of market services, the Helsinki class of socioeconomic functions also includes landscape aesthetics and hunting. As the latter two are only reported for a few case studies, the socioeconomic functions and market services classes are almost identical, which is also true in terms of the results obtained for both groups. Therefore, Figure 6, which depicts the outcomes for the socioeconomic functions class, represents the market services class as well.
Figure 6.
Sensitivity of the Helsinki socioeconomic functions class in relation to management intensity, by forest region, social environment, and species composition. Deviation from business as usual: “−” (red), “0” (blue), and “+” (green): decreased, unchanged, and increased ecosystem service provision compared to business as usual. Scenario Category: Less intensive (“less”), more intensive treatment (“more”), and near business as usual (“nbu”). Forest Regions: “SE”—Southern Europe, “EE”—Eastern Europe, “CWE”—Central Western Europe, “WE”—Western Europe, “NWE”—North Western Europe, “NE”—Northern Europe.
Socioeconomic functions were not investigated in the North West European case studies, and only a few indices were reported from Northern Europe and Western Europe. In contrast, a strong emphasis was placed on these functions in Southern Europe and Eastern Europe (Figure 6, left panel). The results are quite region-specific. Less intensive management mainly does not change the provision of socioeconomic functions in Southern Europe, while in Eastern Europe it leads to no change or even an increase in two-thirds of cases only. In Central Western Europe, less intensive management decreases socioeconomic function levels more often than not. More intensive management drastically decreases the provision in Southern Europe, while in Eastern Europe the sensitivity to intensification is quite low. There, still more than half of the cases show no change or an increased provision under intensified management. In Central Western Europe, intensification increased provision in more cases than less intensive treatments. For the few cases in Western and Northern Europe, more intensive management leads to an increase or no change in the provision of socioeconomic functions compared to the levels provided by business as usual management.
In near-city environments, the frequency of losses in socioeconomic functions is the same for less intensive and more intensive management (~40% of the cases). However, in contrast to less intensive management, there are also a considerable number of cases where the provision of socioeconomic functions improves with management intensification (Figure 5, middle panel). These trends are reversed in rural environments. In most cases, less intensive treatment leads to no change or increased provision of socioeconomic functions. More intensive management increases the frequency of losses in the provision of socioeconomic functions substantially (nearly 50% of the cases).
Conifer-dominated forest landscapes exhibit improved provision of socioeconomic functions in 50% of the cases when less intensive management is applied; no case resulted in a reduced provision. In broadleaf-dominated areas less intensive management mostly leads to no change, although both increases and decreases in provision occur. The highest frequency of reducing the provision of socioeconomic functions with less intensive management comes in mixed species settings; this is due to the loss of attractive species mixtures in the course of reducing management intensity. More intensive management induces a decrease in the provision of socioeconomic functions in many of the coniferous species settings, but the majority of cases still results in no change or an improvement. In broadleaf-dominated areas, intensification increases the number of cases of reduced provision of socioeconomic functions to about 50%, while a few cases only result in a gain. Intensification in mixed species forest areas results in decreased provision in a majority of cases; near business as usual scenarios exhibit indifferent behavior in relation to treatment intensity and species composition.
Summary: The provision of socioeconomic functions (and therefore also market service provision) generally decreases with more intensive management. However, we observe strong region-specific differences that are due to regional forest history and societal perceptions and preferences. Social environment seems to matter, as less intensive management does not lead to an improved provision in any of the near-city cases while it frequently does in rural ones. In mixed species and broadleaf dominated regions, business as usual seems to be an optimum middle course.
3.2.4. Biodiversity
For the ecosystem services that belong to the Helsinki class biodiversity, there seem to be two opposing trends when related to the forest regions (Figure 7, left panel). The first is a clear trend towards biodiversity losses with more intensive management, which can be identified in Southern Europe, Eastern Europe, and Northern Europe. Second, in Central Western Europe and North Western Europe, losses prevail with less intensive management, while no change and increased provision dominate when management is more intensive. Only the results we obtained for Western Europe do not conform to either trend.
Figure 7.
Sensitivity of biodiversity provision in relation to management intensity, by forest region, social environment, and species composition. Deviation from business as usual: “−” (red), “0” (blue), and “+” (green): decreased, unchanged, and increased ecosystem service provision compared to business as usual. Scenario Category: Less intensive (“less”), more intensive treatment (“more”), and near business as usual (“nbu”). Forest Regions: “SE”—Southern Europe, “EE”—Eastern Europe, “CWE”—Central Western Europe, “WE”—Western Europe, “NWE”—North Western Europe, “NE”—Northern Europe.
In the investigated rural regions (Figure 7, middle panel), there is a very pronounced trend; with less intensive management, biodiversity decreases only in a few cases while no change and, especially, increased provision dominate. More intensive management leads to lower biodiversity in about 60% of the cases, but no change and even improved provision also occurs. Near-city forest areas do not show such clear trends, with slightly more losses than gains in biodiversity associated with less intensive management, while there are no gains associated with near business as usual and more intensive management.
Management effects do not differ greatly for different species compositions (Figure 7, right panel). Across all species settings, losses in biodiversity are more frequent when management is intensified, while less intensive management produces more gains. Intensive management in mixed stands results in both losses and gains in more cases than for other species compositions.
Summary: The regional opposite trends in biodiversity provision as a result of different management intensities are not visible when considering social environment and species composition. In the latter two cases, more intensive management leads in most cases to biodiversity loss, while less intensive management results in many cases with a gain in biodiversity provision. This trend is most clear in rural environments and conifer and broadleaf species settings.
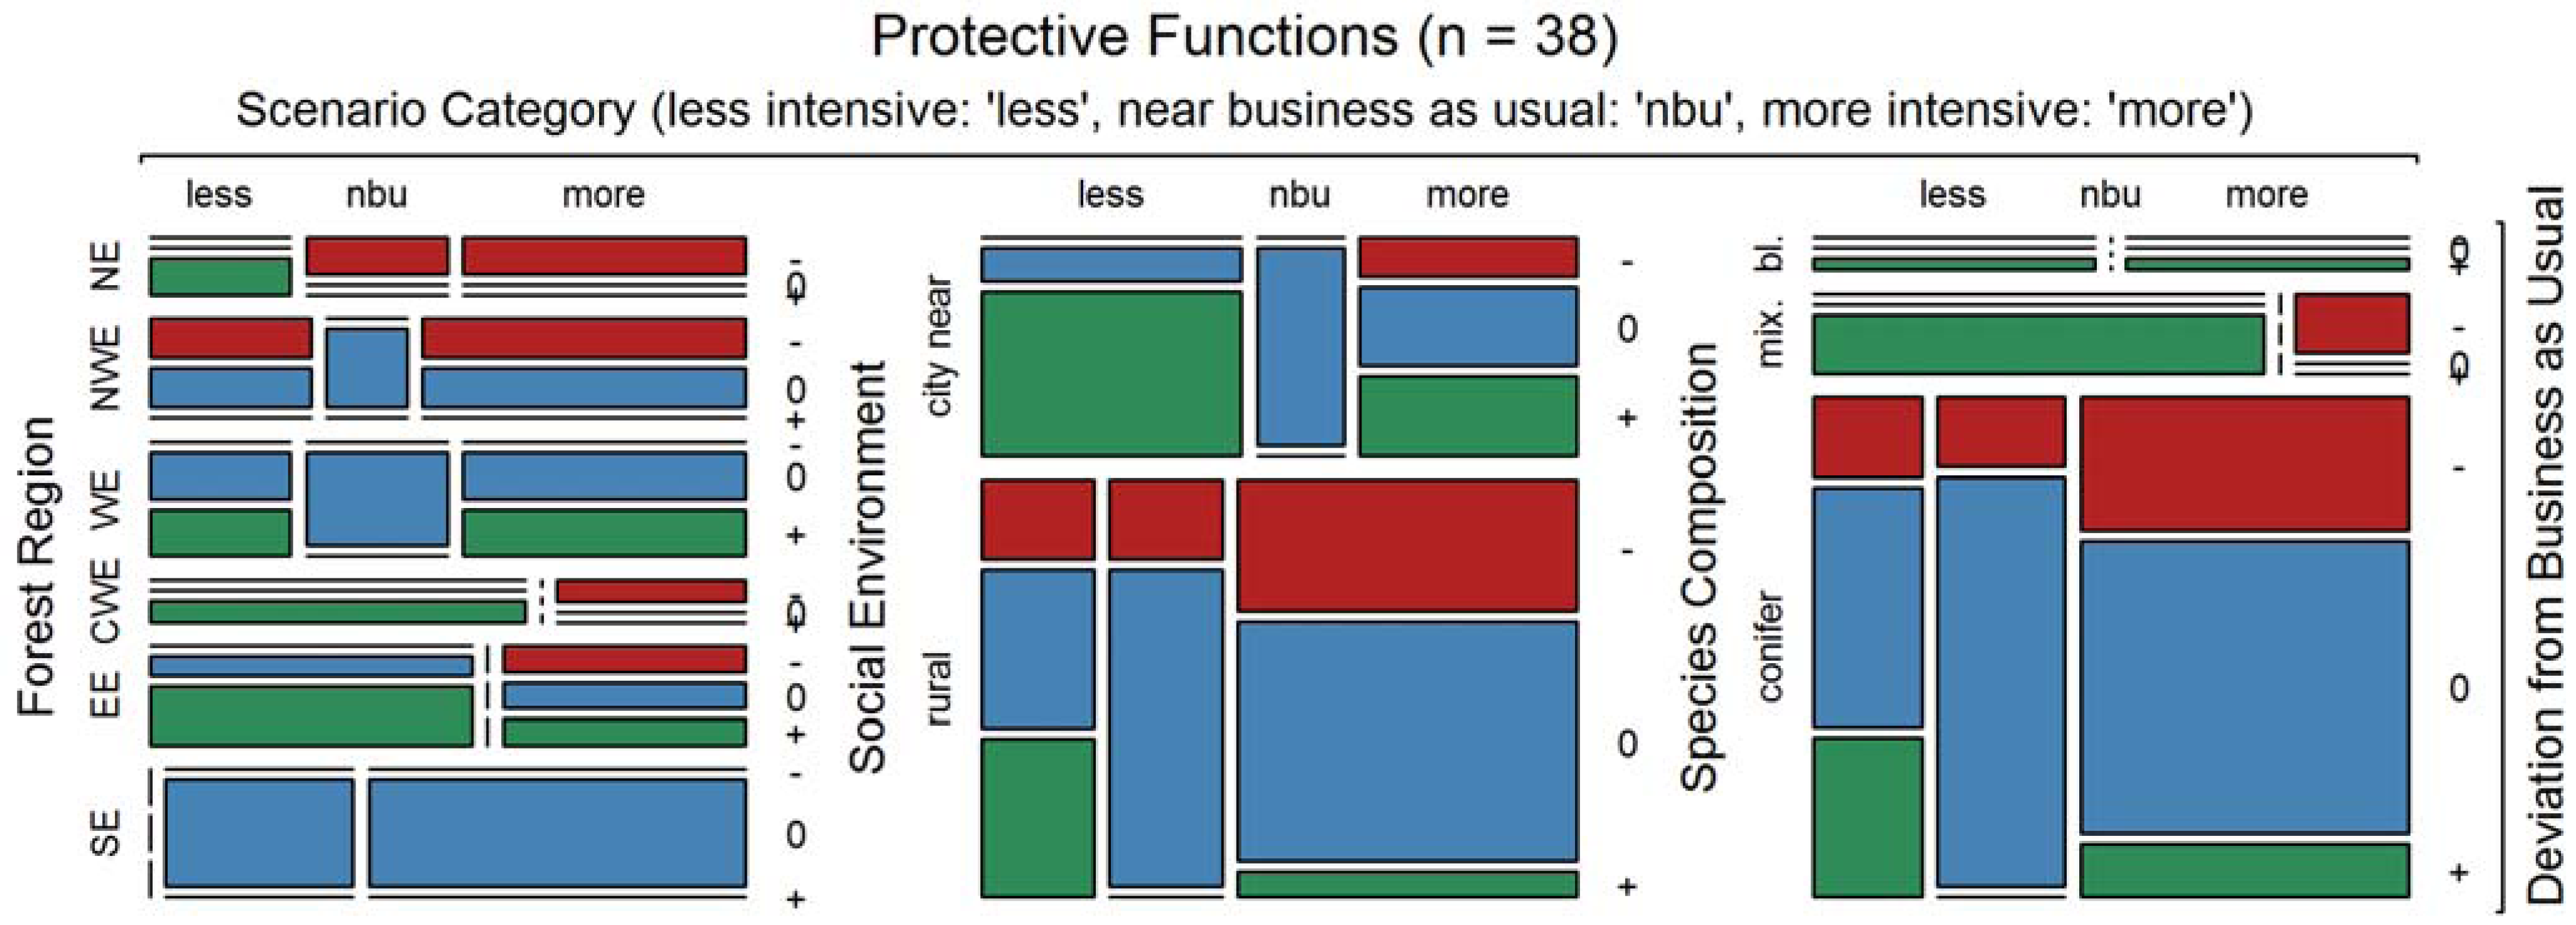
3.2.5. Protective Functions
As heterogeneous as the Helsinki group of protective functions is, so non-uniform are the outcomes associated with management intensity by regions (Figure 8, left panel). No trend with management intensity can be seen in the provision of protective functions in Southern Europe, Western Europe (comprising no change or improvement), and North West Europe (comprising no change or decline). In contrast, a strong trend was identified in Northern Europe and Central West Europe, where less intensive management leads to gains, and more intensive management leads to losses, in the provision of protective forest functions; a similar but weaker trend was identified for the Eastern European case studies.
Figure 8.
Sensitivity of the provision of protective functions in relation to management intensity, by forest region, social environment, and species composition. Deviation from business as usual: “−” (red), “0” (blue), and “+” (green): decreased, unchanged, and increased ecosystem service provision compared to business as usual. Scenario Category: Less intensive (“less”), more intensive treatment (“more”), and near business as usual (“nbu”). Forest Regions: “SE”—Southern Europe, “EE”—Eastern Europe, “CWE”—Central Western Europe, “WE”—Western Europe, “NWE”—North Western Europe, “NE”—Northern Europe.
Less intensive management in near-city forests mostly leads to gains in protective functions, while no losses are found (Figure 8, middle panel). No change and gains in provision dominate (~80%) when management is more intensive. While less intensive management in rural areas mostly leads to gains or no change in the provision of protective functions, losses also occur. No change prevails with more intensive management, but the number of cases with a loss in provision increases considerably, while very few cases result in gains.
For broadleaved dominated regions, represented by only a few cases, both less and more intensive management results in gains in the provision of protective functions (Figure 8, right panel). A very strong trend exists for mixed species areas, where less intensive management is only accompanied by gains and more intensive management by losses in the provision of protective functions. Most results are available for conifer-dominated areas. Here, trends are weak; no change and gains in provision prevail when management is less intensive, almost no change is observed with near business as usual scenarios, and considerably more loss and less gain in the provision of protective functions occurs when treatment is more intensive.
Summary: Protective functions are regionally very different and, therefore, very different management effects exist by region. Near-city forests produce more gains than rural forests when management intensity is reduced. Losses in the provision of protective functions are more (and gains less) frequent when management is intensified in both social environments. The same trend occurs in conifer-dominated landscapes, while in mixed-species settings gains associated with less intensive management contrast with losses in provision associated with intensification.
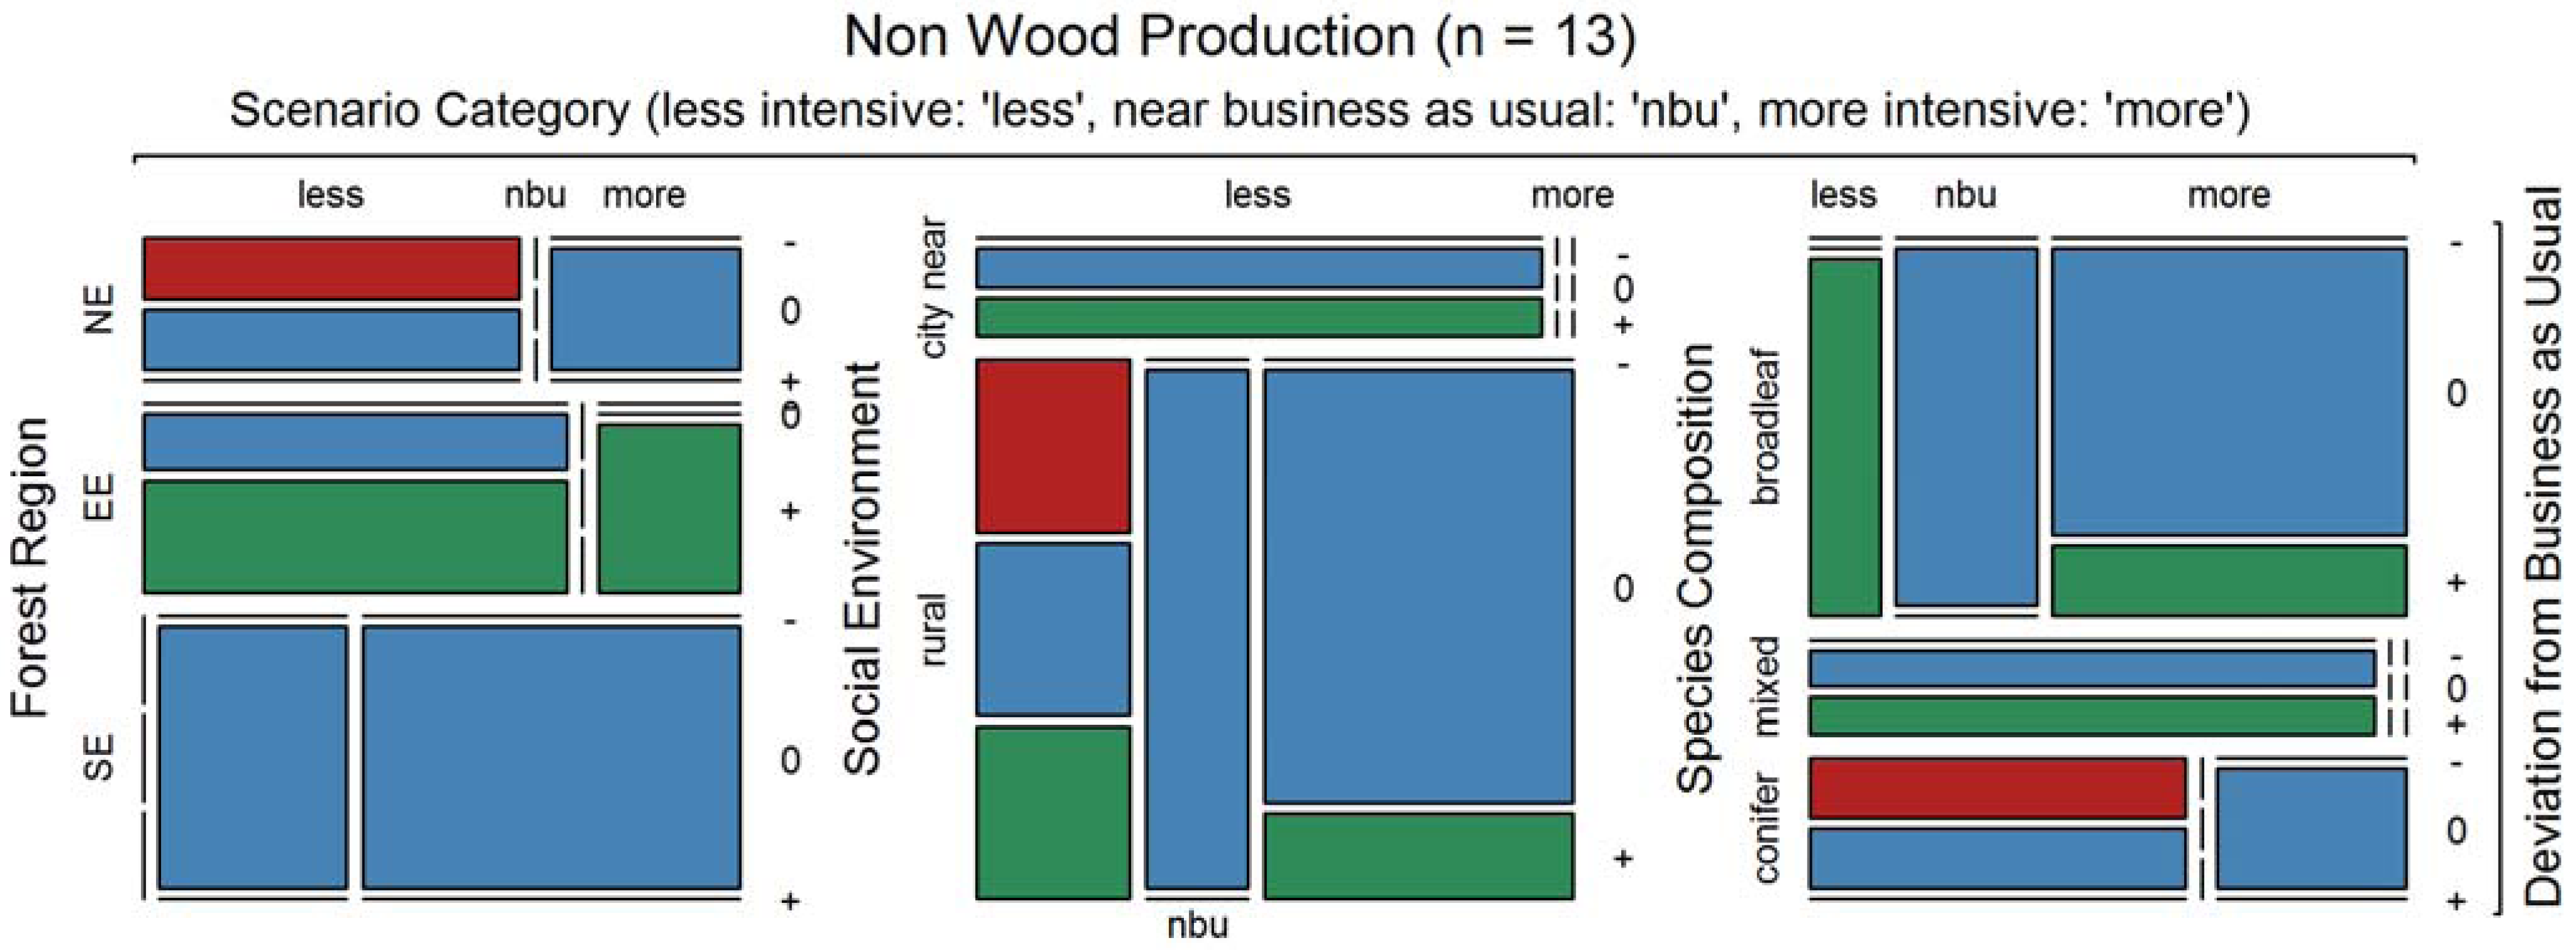
3.2.6. Non-Wood Production/Market Non-Wood Products
Ecosystem services belonging to the Helsinki class of non-wood production, which is equivalent to the FORSYS class of market non-wood products, were only investigated in a few case studies (n = 13) in the Southern, Eastern, and Northern Europe forest regions. Mushroom production is included, as well as cork and pine cone production and reindeer herding.
In Southern Europe, where non-wood production was only investigated in near business as usual and more intensive management scenarios, the results show no difference between near business as usual and intensification (Figure 9, left panel). For the Eastern European case studies only a weak trend exists; while less intensive management results in no change or, more frequently to gains in non-wood production, more intensive management leads to increased production only. A weak relationship is also visible for Northern Europe. Less intensive management led either to losses or no change in non-wood production, while increased intensities did not result in non-wood production changes compared to the level associated with business as usual management.
Figure 9.
Sensitivity of non-wood production in relation to management intensity, by forest region, social environment, and species composition. Deviation from business as usual: “−” (red), “0” (blue), and “+” (green): decreased, unchanged, and increased ecosystem service provision compared to business as usual. Scenario Category: Less intensive (“less”), more intensive treatment (“more”), and near business as usual (“nbu”). Forest Regions: “SE”—Southern Europe, “EE”—Eastern Europe, “CWE”—Central Western Europe, “WE”—Western Europe, “NWE”—North Western Europe, “NE”—Northern Europe.
In the few cases where results for near-city areas are available, information only exists for less intensive management, where non-wood production either increased or remained unchanged (Figure 9, middle panel). In rural areas, no change dominates in more intensive and near business as usual scenarios, with the non-wood production losses associated with less intensive management occurring only in the Northern European case studies.
The results for conifer-dominated areas (Figure 9, right panel) simply reflect those for Northern Europe (Figure 9, left panel). In broadleaf-dominated areas, less intensive management results in gains in non-wood production. For the other two treatment intensities no change is the most prominent outcome. For mixed species settings, the only available information is a balanced outcome between no change and increased non-wood production, when management is less intensive.
Summary: Due to the limited amount of available results, the trends related to non-wood production (equivalent to non-wood market product provision) have to be interpreted with caution. Obviously, their importance is not significant in many regions, especially Western Europe, North Western Europe, and Central Western Europe (Figure 2). Non-wood production does not seem to be highly sensitive to management intensity; almost exclusively no change and, less frequently, increases in provision were found as intensity changed.
3.2.7. Non-Market Services
In contrast to market non-wood products, the FORSYS class of non-market services is very large and prominent in all investigated European forest regions (cf. Figure 3). This class comprises biodiversity, carbon storage, landscape aesthetics, and all kinds of protection services. Although parts of the non-market services have been analyzed above in higher-resolution Helsinki classes, we also show the results for this aggregated class in order to be compatible with the FORSYS classification. When split into forest regions, we frequently find losses in non-market service provision being connected with more intensive management (Figure 10, left panel). The only exception is Western Europe, where intensification brings about unchanged or increased non-market service provision only. In Southern Europe we frequently observe losses with both less intensive and more intensive management. Except for Southern Europe and North West Europe, we observe a general trend towards fewer losses and more gains with lower intensity.
In near-city as well as in rural forest areas, unchanged and increased non-market service provision dominate when management is less intensive (Figure 10, middle panel). In both kinds of social environment, management intensification leads to a higher loss risk at the expense of gain chances, where the latter effect is far more pronounced under rural conditions.
Figure 10.
Sensitivity of non-market services in relation to management intensity, by forest region, social environment, and species composition. Deviation from business as usual: “−” (red), “0” (blue), and “+” (green): decreased, unchanged, and increased ecosystem service provision compared to business as usual. Scenario Category: Less intensive (“less”), more intensive treatment (“more”), and near business as usual (“nbu”). Forest Regions: “SE”—Southern Europe, “EE”—Eastern Europe, “CWE”—Central Western Europe, “WE”—Western Europe, “NWE”—North Western Europe, “NE”—Northern Europe.
In mixed species areas lower non-market service provision with less intensive management is rare, while losses are dominating when management is intensified. The gains show exactly the reverse pattern. Broadleaf- and conifer-dominated case studies behave very similar to each other. In both kinds of settings non-market service provision is less treatment-sensitive compared to mixed species areas. The overall trend is, however, the same: Frequent losses with more intensive treatment come with less frequent gains.
Summary: Non-market services tend to show a higher loss risk when more intensive treatment is applied, albeit with region-wise exceptions. Often, gain chances are higher with less intensive treatment. Concerning species composition, non-market services are most treatment-sensitive under mixed species frame conditions.
3.2.8. Generalization
The previous analyses allow for the production of a generalized qualitative ranking of ecosystem service categories in terms of their sensitivity to management intensity (Table 7). Wood production (syn. market wood products), forest resources, and biodiversity react strongly to different management intensities. While wood production increases and forest resources decrease when management intensifies, biodiversity also reacts strongly, but both increased and decreased provision are possible, depending on the local forest history and cultural setting, as mentioned previously. The FORSYS class of non-market service provision reacts less strongly to management intensity changes than the three categories above, but change is still considerable. In general, provision tends to decrease with higher management intensity. Only a weak sensitivity was identified for the Helsinki classes of protective functions and socioeconomic functions, the latter being virtually identical to the market services FORSYS class. Non-wood production (syn. market non-wood production) levels do not, in general, show any clear relationship with management intensity.
3.3. Tradeoffs, Synergies
Based on the sensitivities of the ecosystem services to management intensity, as analyzed above and summarized in Table 7, a qualitative summary of tradeoffs and synergies is produced (Table 8). We use the term tradeoff for describing situations where a gain in one ecosystem service leads to a loss in another. In cases where a greater provision of one ecosystem service goes along with a greater provision of another, we use the term synergy.
Table 7.
Generalized sensitivity of ecosystem service categories to management intensity. The signs “+” and “−” indicate whether the correlation with management intensity is in general positive or negative.
| Ecosystem Service Category | Sensitivity to Management Intensity | |
|---|---|---|
| wood production/market wood products. | strong | + |
| forest resources | strong | − |
| biodiversity | strong | + and − possible |
| non-market services | intermediate | − |
| protective functions | weak | − |
| socioeconomic functions/market services | weak | − |
| non-wood production/market non-wood products | none | |
Table 8.
Tradeoffs (upper triangle, shaded light gray) and synergies (lower triangle, shaded dark gray) between the investigated ecosystem service categories. In case of analogies between FORSYS and Helsinki categories, the Helsinki category name is used in this table.
| Wood Production | Forest Resources | Socioeconomic Functions | Biodiversity | Protective Functions | Non-Wood Production | Non-Market Services | |
|---|---|---|---|---|---|---|---|
| wood production | strong | weak | strong (region-specific) | weak | intermediate | ||
| forest resources | strong (region-specific) | ||||||
| socioeconomic functions | weak | weak (region-specific) | |||||
| biodiversity | strong (region-specific) | strong (region-specific) | weak (region-specific) | weak (region-specific) | weak (region-specific) | ||
| protective functions | weak | weak | weak (region-specific) | ||||
| non-wood production | |||||||
| non-market services | intermediate | weak | weak (region-specific) | weak |
Wood production (syn. market wood products) displays a strong tradeoff with forest resources. In other words, it is very unlikely to have high wood production and large stocks of forest resources in the same area at the same time. A strong tradeoff as well as a great synergy between wood production and biodiversity can occur. This outcome is very region-specific (Table 7). Except for non-wood production (syn. market non-wood production), where neither a considerable tradeoff nor synergy is present, wood production in general is in a weak (socioeconomic functions/market services, protective functions) or intermediate (non-market services) tradeoff with the other ecosystem service categories when treatment intensity is changed.
Apart from wood production, most other ecosystem service categories show a weak synergy with each other. Dependent on forest region and history, biodiversity shows a tradeoff or a synergy with almost any other ecosystem service category, except with non-wood production (market non-wood production). The provision of the latter seems to be very elastic in relation to the provision levels of other ecosystem service categories as well as management intensity.
4. Discussion
Based on 20 case study areas throughout Europe, this study comes to statements about the relative importance of given ecosystem service categories and their sensitivity to the intensity of forest management. The latter was analyzed in the context of the covariables forest region, social environment, and species composition. Although these covariables partly correlate and thus must be interpreted with care, this allows us to make conclusions about management steering possibilities, tradeoffs and synergies, in terms of different ecosystem services’ provision, as presented above.
The ecosystem service categories that show a strong sensitivity to management intensity are wood production/market wood products (positive correlation), forest resources (negative correlation), and biodiversity. Surprisingly, biodiversity can react in both ways to management, negatively or positively. The latter finding agrees well with a recent meta-analysis [], while the former disagrees with it. Our interpretation suggests that the former trend is prevailing in regions where the general development is from low intensity management to greater intensity, while the latter trend occurs in regions where there is a trend from plantation management to more close-to-nature forestry. Most other ecosystem service categories show only weak and negative correlations with management intensity. We could also identify different tradeoffs and synergies in the provision of different ecosystem services. A strong tradeoff exists between the maintenance of forest resources and wood production. Strong connections also exist between biodiversity and wood production and forest resources. Whether these connections are tradeoffs or synergies is region-specific. Remarkably, though, both are possible. An issue that is not fully covered by this study is the risk of calamities, especially in over-dense conifer stands, which may in some places result from low-intensity management and often bear an increased risk of storm or snow damage with subsequent insect attacks. Clearly undesired by forest owners who strive for a steady timber production, the consequences of such calamities for other ecosystem services’ provision are non-trivial.
Climate change and its possible effects were deliberately not considered in this study. The overwhelming majority of the contributing models are empirical, covering forest growth dynamics best under current climate conditions. Instead of burdening our study with the additional uncertainty of climate scenarios (cf. []), we chose simulation time spans, 30 years in most cases, which seemed short enough to assume no substantially different results under changing climate. Europe-wide forest growth and management scenarios including climate change usually take into account considerably longer time frames [,]. As a recent empirical study shows [], past climate change (together with the fertilizing effects of increased N-immissions and CO2 supply) has accelerated forest dynamics in Central Europe. Remarkably, though, this study hints that typical stand structures stayed virtually the same; only their progression accelerated. As most of the ecosystem services investigated in the study at hand are connected to structural forest properties, we take that as another argument for the stability of our results. To our knowledge, the study at hand is the only one covering such a broad spectrum of ecosystem services on the European level. Our outcomes, however, are not implausible in the context of other large-scale studies that focused on a smaller set of ecosystem services, often carbon budgets and wood supply, as summarized in [].
Besides the wide range of ecosystem services investigated, methodological heterogeneity is a characteristic of this study. The forest growth models and DSS that were applied, and the forest data that were used for defining the initial state for the scenarios, included very different approaches across the contributing countries and case studies. The same is true for the indices that were taken as a measure for a given ecosystem service’s provision. This may seem problematic in terms of comparability on the one hand. On the other hand, however, this procedure ensured that in each case study the best available models and indices were used, which exactly fit into the regionally relevant information supply and demand (cf. [,]). As each model is built for being applied to the most important tree species in a given region, we are confident that a more precise and more relevant collection of forest development scenarios across Europe can hardly be achieved at the time being. However, we do not see the study at hand as a competitor to large-scale studies with one single model [,], more as a bottom-up complement to the usual top-down approach.
In two countries, namely Bulgaria and the Netherlands, the applied models (SIBYLA [] and LandClim [], respectively) have not been developed and formally validated with data from the relating case studies. However, in terms of natural conditions the Bulgarian case study regions are inside the range of applicability of the model SIBYLA; in addition, the simulation results were examined for plausibility and approved by local experts. The model LandClim is a process-based model that covers a broad range of natural conditions including the case study area where it has been applied, South East Veluwe. See Supplementary Information 3 for more details and literature.
It is important to state that the calculated management scenarios were not initially defined in order to assess ecosystem service provision against management intensity. They were derived from case study-specific societal and policy framework scenarios considered to drive forest managers’ behavior [,]. As such, they result from a so far rather unique collaboration between social scientists and forest growth and management modelers. Their definition, based on local stakeholder workshops as well as locally experienced social and natural scientists, ensured that the scenarios stayed in a plausible and therefore useful framework. However, aggregating the scenarios by treatment intensity as defined above for the purpose of this study turned out to be a straightforward procedure. Our confidence in this grouping is supported by the absolutely plausible behavior of wood production when related to treatment intensity.
As another important point to mention, the case study areas were not selected with the purpose of being representative in the sense of a forest inventory. Instead, the most important selection criterion was relevance for the respective country. Therefore, the case study areas represent situations where typical and relevant problems have to be dealt with. This fits well with the choice of models, indices, and data as discussed above. From that point of view, our study’s most prominent weakness—heterogeneity in methods and data—might be its most prominent strength.
5. Conclusions
At the European level, ecosystem service steering potential by forest management seems to be highest for wood production, forest resources, and biodiversity. Non-wood production, by contrast, where regional differences are high and our information base is smallest, seems to be very elastic when related to management intensity, at least as seen from a pan-European perspective. Strong tradeoffs were observed between the stocks of forest resources and wood production. Biodiversity may both, be in a strong tradeoff or in synergy with wood production, depending on a given region’s forest conditions and history. Except for non-wood production, almost any other ecosystem service group shows a weak tradeoff with wood production. The covariables species composition and social environment are of punctual interest only, while forest region often makes an important difference in terms of an ecosystem service’s treatment sensitivity. This confirms region-specific approaches to forest management in Europe.
Concerning the choice of methods, the coherent results of this study seem to justify a subsidiary approach—upscaling from local tools and data to the European level.
Acknowledgements
This project has received funding from the European Union’s Seventh Program for research, technological development and demonstration under grant agreement No 282887 (INTEGRAL).
Author Contributions
Peter Biber, José G. Borges, and Ola Sallnäs designed the study and interpreted the consolidated results. Peter Biber performed the analyses and wrote the paper. Maarten Nieuwenhuis, Ralf Moshammer, and Hans Pretzsch contributed to writing the paper. All authors contributed substantial data, meta-information, and result interpretation.
Conflicts of Interest
The authors declare no conflict of interest.
Supplementary Materials
References
- Von Gadow, K.; Pukkala, T.; Tomé, M. Sustainable Forest Management (Managing Forest Ecosystems); Springer: Amsterdam, The Netherland, 2000; p. 386. [Google Scholar]
- Glück, P. Criteria and Indicators for Sustainable Forest Management in Europe. In Proceedings of the XX IUFRO World Congress, Working Group S6. Tampere, Finland, 6–12 August 1995; p. 5.
- MCPFE. Resolution H1: General guidelines for the sustainable management of forests in Europe. In Proceedings of the 2nd Ministerial Conference on the Protection of Forests in Europe, Helsinki, Finland, 16–17 June 1993; p. 5.
- Hanewinkel, M.; Cullmann, D.A.; Schelhaas, M.J.; Nabuurs, G.J.; Zimmermann, N.E. Climate change may cause severe loss in the economic value of European forest land. Nat. Clim. Change 2013, 3, 203–207. [Google Scholar] [CrossRef]
- Schröter, D.; Cramer, W.; Leemans, I.; Prentice, C.; Araújo, M.B.; Arnell, N.W.; Bondeau, A.; Bugmann, H.; Carter, T.R.; Gracia, C.A.; et al. Ecosystem Service Supply and Vulnerability to Global Change in Europe. Science 2005, 310, 1333–1337. [Google Scholar]
- Maracchi, G.; Sirotenko, O.; Bindi, M. Impacts of present and future climate variability on agriculture and forestry in the temperate regions: Europe. Clim. Chang. 2005, 70, 117–135. [Google Scholar] [CrossRef]
- Mohren, G.M.J. Large-scale scenario analysis in forest ecology and forest management. For. Policy Econ. 2003, 5, 103–110. [Google Scholar] [CrossRef]
- Karjalainen, T.; Pussinen, A.; Liski, J.; Nabuurs, G.J.; Eggers, T.; Lapveteläinen, T.; Kaipainen, T. Scenario analysis of the impacts of forest management and climate change on the European forest sector carbon budget. For. Policy Econ. 2003, 5, 141–155. [Google Scholar] [CrossRef]
- INTEGRAL Project Consortium. Future-Oriented Integrated Management of European Forest Landscapes. Available online: http://www.integral-project.eu (accessed on 12 December 2014).
- INTEGRAL Project Consortium. INTEGRAL 2nd Policy Brief: Future Scenarios of Forest Management in Europe. Available online: http://www.integral-preoject.eu (accessed on 12 December 2014).
- Borges, J.G.; Nordström, E.M.; Garcia-Gonzalo, J.; Hujala, T.; Trasobares, A. Computer-Based Tools for Supporting Forest Management. The Experience and the Expertise World-Wide; Department of Forest Resource Management, Swedish University of Agricultural Sciences: Umeå, Sweden, 2014; p. 503. [Google Scholar]
- Fabrika, M.; Ďurský, J. Algorithms and software solution of thinning models for SIBYLA growth simulator. J. For. Sci. 2005, 51, 431–445. [Google Scholar]
- Le Moguédec, G.; Dhôte, J.F. Fagacées: A tree-centered growth and yield model for sessile oak (Quercus petraea L.) and common beech (Fagus sylvatica L.). Ann. For. Sci. 2012, 69, 257–269. [Google Scholar]
- Lemoine, B. Growth and yield of maritime pine (Pinus pinaster Ait): The average dominant tree of the stand. Ann. Sci. For. 1991, 48, 593–611. [Google Scholar] [CrossRef]
- Dufour-Kowalski, S.; Courbaud, B.; Dreyfus, P.; Meredieu, C.; de Coligny, F. Capsis: An open software framework and community for forest growth modelling. Ann. For. Sci. 2012, 69, 221–233. [Google Scholar] [CrossRef]
- Pretzsch, H.; Biber, P.; Dursky, J. The single tree-based stand simulator SILVA: construction, application and evaluation. Abstr. For. Ecol. Manag. 2002, 162, 3–21. [Google Scholar] [CrossRef]
- Pretzsch, H. Forest Dynamics, Growth and Yield; Springer Verlag: Berlin, Germany, 2010; p. 664. [Google Scholar]
- Remsoft. Forestry. Available online: http://www.remsoft.com/forestry.php (accessed on 12 December 2014).
- Sallnäs, O. A matrix growth model of the Swedish forest. Stud. For. Suec. 1990, 183, 1–23. [Google Scholar]
- Schelhaas, M.J.; Eggers, J.; Lindner, M.; Nabuurs, G.J.; Pussinen, A.; Päivinen, R.; Schuck, A.; Verkerk, P.J.; van der Werf, D.C.; Zudin, S. Model Documentation for the European Forest Information Scenario Model (EFISCEN 3.1.3); Alterra Rapport 1559, EFI Technical Report 26; Cereales Publishers: Wageningen, Netherland, 2007. [Google Scholar]
- Petrauskas, E.; Kuliešis, A. Scenario-based analysis of possible management alternatives for Lithuanian forests in the 21st century. Balt. For. 2004, 10, 72–82. [Google Scholar]
- Schumacher, S.; Bugmann, H.; Mladenoff, D.J. Improving the formulation of tree growth and succession in a spatially explicit landscape model. Ecol. Model. 2004, 180, 175–194. [Google Scholar] [CrossRef]
- Hengeveld, G.M.; Didion, M.; Clerkx, S.; Elkin, C.; Nabuurs, G.J.; Schelhaas, M.J. The landscape-level effect of individual owner adaptations to climate change in Dutch forests. Reg. Environ. Chang. 2014. [Google Scholar] [CrossRef]
- Barreiro, S.; Garcia-Gonzalo, J.; Borges, J.G.; Tomé, M.; Marques, S. SADfLOR Tutorial. A Web-Based Forest and Natural Resources Decision Support System (Work in Progress); FORCHANGE, ISA: Lisbon, Portugal, 2013; p. 39. [Google Scholar]
- Garcia-Gonzalo, J.; Borges, J.G.; Palma, J.; Zuzibarreta-Gerendiain, A. A decision support system for management planning of Eucalyptus plantations facing climate change. Ann. For. Sci. 2014, 71, 187–199. [Google Scholar] [CrossRef]
- Fabrika, M.; Ďurský, J. Implementing Tree Growth Models in Slovakia. In Sustainable Forest Management. Growth Models for Europe; Hasenauer, H., Ed.; Springer: Berlin, Germany, 2006; pp. 315–341. [Google Scholar]
- Wikström, P.; Edenius, L.; Elfving, B.; Eriksson, L.O.; Lämås, T.; Sonesson, J.; Öhman, K.; Wallerman, J.; Waller, C.; Klintebäck, F. The Heureka forestry decision support system: An overview. Math. Comput. For. Nat. Resour. Sci. 2011, 3, 87–94. [Google Scholar]
- INTEGRAL Project Consortium. INTEGRAL ForestWiki. Available online: https://forestwiki.jrc.ec.europa.eu/integral/index.php/Category:Country (accessed on 12 December 2014).
- Schall, P.; Ammer, C. Quantifying forest stand management intensity in Central European forests. Eur. J. For. Res. 2013, 132, 397–397. [Google Scholar] [CrossRef]
- Hartigan, J.; Kleiner, B. Mosaics for contingency tables. In Computer Science and Statistics, Proceedings of the 13th Symposium on the Interface, Pittsburgh, PA, USA, 12–13 March 1981; pp. 268–273.
- Meyer, D.; Zeileis, A.; Hornik, K. The Strucplot Framework: Visualizing Multi-Way Contingency Tables with vcd. J. Stat. Softw. 2006, 17, 1–48. [Google Scholar] [CrossRef]
- Verschuyl, J.; Riffell, S.; Miller, D.; Bently Wigley, T. Biodiversity response to intensive biomass production from forest thinning in North American forests—A meta-analysis. For. Ecol. Manag. 2011, 261, 221–232. [Google Scholar] [CrossRef]
- Kramer, K.; Mohren, G.M.J. Long-Term Effects of Climate Change on Carbon Budgets of Forests in Europe; Alterra-Report 194; Alterra: Wageningen, Netherland, 2001. [Google Scholar]
- Pretzsch, H.; Biber, P.; Schütze, G.; Uhl, E.; Rötzer, T. Forest stand growth dynamics in Central Europe have accelerated since 1870. Nature Communi. 2014. [Google Scholar] [CrossRef]
- Pretzsch, H.; Grote, R.; Reineking, B.; Rötzer, T.; Seifert, S. Models for forest ecosystem management: A European perspective. Ann. Bot. 2008, 101, 1065–1087. [Google Scholar] [CrossRef] [PubMed]
- Pretzsch, H. Application and evaluation of the growth simulator SILVA 2.2 for forest stands, forest estates and large regions. Forstwiss. Cent. 2002, 121, 28–51. [Google Scholar]
- Nabuurs, G.J.; Päivinen, R.; Schanz, H. Sustainable management regimes for Europe’s forests—A projection with EFISCEN until 2050. For. Policy Econ. 2001, 3, 155–173. [Google Scholar] [CrossRef]
© 2015 by the authors; licensee MDPI, Basel, Switzerland. This article is an open access article distributed under the terms and conditions of the Creative Commons Attribution license (http://creativecommons.org/licenses/by/4.0/).