Article

Applying Effective Population Size Estimates of Kandelia obovata Sheue, Liu and Yong to Conservation and Restoration Management

1
Department of Life Science, National Taiwan Normal University, Taipei 116, Taiwan
2
The Key Laboratory for Silviculture and Conservation of Ministry of Education, College of Forestry, Beijing Forestry University, Beijing 100083, China
3
School of Life Science and Engineering, Chongqing Three Gorges University, Chongqing 404001, China
*
Author to whom correspondence should be addressed.
These authors contributed equally to this work.
Forests 2015, 6(5), 1439-1453; https://doi.org/10.3390/f6051439
Submission received: 17 December 2014 / Revised: 26 March 2015 / Accepted: 21 April 2015 / Published: 28 April 2015

Abstract

:
Effective population size (Ne) is a crucial metric for evaluating the current status of genetic diversity and conservation management. Population of Kandelia obovata, a mangrove species that is patchily distributed along the estuaries off Southeastern China, is genetically structured. Here, we applied skyline analyses to infer the demographic history of K. obovata based on Amplified Fragment Length Polymorphisms (AFLP) data. Congruent trends of population growth rate among populations, but concurrent change in Ne estimates, were inferred in all populations. The recent rapid habitat expansion explains the high census population size but small Ne of populations in Northern Taiwan. Our study also revealed lower Ne of reforested populations than their sources. In silico demographic analyses simulate the small or biased sampling of seedlings for reforestation and revealed over 90% and 99% Ne reduction when only 1/2 and 1/10 samples were collected, respectively. These results emphasize the importance of a comprehensive sampling of seeds for restoration. Overall, this study rendered, not only the current Ne of K. obovata populations, but also indicates the importance of Ne estimation on restoration.

Graphical Abstract

1. Introduction

Effective population size (Ne) has long been recognized as an important issue in conservation management [1,2,3,4,5,6]. Genetic estimates of Ne are based on random process of sampling from a real population in a given variance of allele frequency or are based on the amount of inbreeding [5,7], and can make a good prediction of the current status of genetic variation developed over time [1]. Ne has been suggested as a major relevant indicator for evaluating the conservation status and threats to the genetic health of populations [4]. Comparing the current and ancestral Ne is helpful for understanding the demographic dynamics and the stability of any given population, and are of more immediate importance than estimating genetic variation in determining the minimum viable sizes of wild populations [8]. In plants, Ne is not only response to the genetic variation but it is also highly correlated with factors such as the mating system and population structure [6]. For example, significantly decreased outcrossing rates in thinned and younger populations of Kandelia obvata Sheue, Liu and Yong indicates that dense leaves and twigs are the pollen flow barriers of mangrove species and cause a lower growth rate of Ne than the census population size (Nc) [9]. In addition to the mating system and population structure, variation in offspring number, age- and stage-structure of a population, spatial structure and natural selection are possible explanatory factors affecting Ne [7].
Mature mangrove forest provides a multitude of habitats for abundant wildlife and maintains high biodiversity in the tropical and subtropical estuary ecosystem [10,11,12], while the complexity of mangroves forest is usually determined by abiotic factors [13,14]. Previous studies have shown that the topography and ocean currents affect population structure and genetic diversity of mangroves along the coasts of the South China Sea [15,16,17]. Multiple factors including the topography and anthropogenic colonization were also suggested to be responsible for the current population structure of K. obovata off Southeastern China [18]. In addition to the extrinsic determinants, intrinsic factors, such as limited propagule dispersability and mating system of K. obovata, could influence the intra-population substructure [19]. The structured populations reflect non-random mating within population or asymmetric gene flow between populations, and such non-random association of gametes would cause major reductions in the Ne [20,21,22]. In addition, biased sampling of nursery seedlings for reforestation could also reduce the Ne of restored populations from their sources cf. [18,23]. Reforestation is a common strategy for the mangrove restoration in Southeast Asian countries. After decades of reforestation history, these artificial mangrove forests could have been matured with a large Nc. Therefore, it is important to monitor the Nc and estimate the Ne of reforested populations for evaluating the degree of Ne reduction from their sources caused by the human-mediated founder effect.
Ne estimation is helpful for planning the conservation strategies and selective breeding programs by means of accessing genetic variation of species. In addition, Ne reflects the status of population structure, breeding system, and demography history (see review [7]). Early population-genetic studies typically used simple parametric models to interpret demographic dynamics, such as the mismatch analysis and site-frequency-spectrum analysis [24,25]. Skyline-plot methods that are used in this study consider the genetic change of lineages and are based on the coalescent theory [26], leading to more accurate inference of demographic history. Therefore, skyline-plot methods have been applied to management and conservation studies of wildlife, such as kangaroo mice, billfishes, and Galapagos giant tortoises [27,28,29].
Kandelia obovata are mainly distributed along the coasts of the northern South China Sea, Southeastern China, the western coasts of Taiwan, and the Ryukyu archipelagos. Past genetic surveys indicated that both intrinsic and extrinsic properties resulted in a frequent gene flow between populations [9,18,19,30], however, the limited distributions around the estuaries caused structured populations [18,31,32]. Because of the habitat limitations and competition from other mangrove species, the Nc of local populations of K. obovata are not high, except for the only known pure-stand mangrove forest at the estuary of the Danshuei River (JW population, Figure 1) in Northern Taiwan, which is the largest K. obovata population in the world [33]. Ruan et al. [18] reported the genetic diversity and population structure of eight populations of K. obovata off the Southeastern China coast, including five natural populations (FuDing (FD), ZhangJiang Estuary (ZJ), and ShenZhen (SZ) along the southeastern coasts of Mainland China, DongZhaiGang (DZG) on the Northeastern Hainan Island, and JuWei (JW) on the Northern Taiwan Island) and three restored populations (YueQing Bay (YQ) and LongGang (LG1 and LG2) in the north of FD) (Figure 1).
Figure 1. The population samples of K. obovata in this study. The upper left panel shows the relative position of the study area.
Forests 06 01439 g001
For inferring the demographic history, Amplified Fragment Length Polymorphism (AFLP) was used in this study. AFLP is a dominant genetic marker, providing distinguishing power for detecting population dynamics, and it is applicable for accessing the genetic structures between natural populations and between the reforested populations and their source populations in K. obovate [18]. Although the observed heterozygosity cannot be obtained in dominant marker for coalescent analyses, it is still useful for individual discrimination in population breeding and reforestation research [34]. Furthermore, AFLP fingerprinting can also provide genome-wide polymorphisms to access the genomic diversity and Ne of populations, which is undoubtedly a cheap and useful genetic marker for evaluating the outcome of ex situ conservation. This genome-wide polymorphic information provides materials for estimating the past and current Ne and eventually allows the tracing of the trajectory of demographic dynamics. Furthermore, these data, which are based on the deduction of Ne from both natural and restored populations, are useful to evaluate the change in Ne caused by biased sampling of seedlings for reforestation.
In this study, we estimated the most recent demography of K. obovata populations along the southeastern coast of China by using skyline analysis, based on the reversible-jump Markov chain Monte Carlo (rjMCMC) method, which allows simulation of posterior distribution of parameters in more varying dimensions than traditional Markov chain Monte Carlo [35]. The rjMCMC skyline analysis is a genealogical method that operates under the coalescence framework. Therefore, we can infer the Ne dynamics by estimating the change of genetic diversity through genealogical time. We aimed to draw inferences for three subjects: (1) the current Ne of K. obovata populations; (2) the effect of adaptive loci on the demographic inferences; and (3) the effect of small or biased sampling of seedlings on Ne of restored populations.

2. Experimental Section

2.1. Data Collection

We used the AFLP data that were used for inferring the population structure of K. obovata in Southeastern China [18] for estimating the Ne in this study. The AFLP data were collected from the Dryad Digital Repository [36]. In total, 221 loci from 226 samples were used for the demographic analyses. For excluding the effect of local adaptation on the genetic variation, the Fdist approaches were used for identifying the outlier (adaptive) loci [37,38]. The 221 loci were further sieved into (1) total loci; (2) the loci within 99% CI divergence (FST); and (3) the loci within 95% CI divergence [18]. The datasets that fall into these three categories were used in further demographic analyses.

2.2. Data Analyses

We used the rjMCMC approach to estimate Ne, and the Ne through time was computed using the mcmc.popsize function [39], a part of APE package [40] performed in R language. The classic skyline-plot method implemented in mcmc.popsize function was employed to trace regional changes in Ne over time. The parametric classic and rjMCMC skylines are phylogenetic-based approaches. The phylogenetic trees of all lineages and individuals among total population of K. obovata were reconstructed by the Neighbor Joining (NJ) method, based on the distance matrix generated by AFLP loci [18]. Branch lengths on the NJ tree were set as the number of substitutions, i.e., the differences in the number of loci. One-thousand-times bootstrap replicates were used to evaluate the robustness of tree topologies and the 50% consensus tree were used as input to perform the skyline analyses. After the NJ tree being generated, we computed relative divergent times for all branching points using the RelTime method [41]. One-million-steps Markov-chain simulations were performed for the rjMCMC estimation and the first 10,000 steps were dropped as burn-in, with a set thinning factor = 1000. For confirming the accuracy of Ne estimates, the NJ trees were generated multiple times by different random seeds and skyline analyses were performed independently. Accuracy of demographic inferences was confirmed from at least three-time convergent results of skyline analyses.
For evaluating the effect of biased sampling for restoration, we randomly resampled individuals of 1/2, 1/3, 1/5, and 1/10 sample sizes from FD population, which is the source population of reforested LG1 and LG2, and equally expanded to 30 samples in each resampling. This resampling simulated the biased sampling of sibling seeds from the same tree. The resampled lineages were then used to perform the skyline analyses, as described above. Accuracy of Ne estimates was confirmed by repeating sampling at least three times.

3. Results and Discussion

3.1. Influence of Demographic Inference on Adaptive Loci

AFLP data from a total of 226 individuals of K. obovata were used to estimate their demographic history [18]. However, the AFLP loci results can only provide the presence (dominant) or absence (recessive) of DNA bands, therefore, the deduced time in the skyline plots of Ne will only be indicative of the relative coalescent times per unit substitutions. Because the positive selection and balancing selection could cause extremely high and low genetic differentiation between populations, respectively, the positive and negative outlier loci could be taken as the loci responding to, or linked to, the traits under natural selection, i.e., the adaptive loci [37,38]. Adaptive loci would affect the demographic estimation [42]. In contrast, the loci with genetic differentiation within the CI could be taken as the neutral loci. Genetic variation of neutral loci is contributed by stochastic processes (drift) and under the mutation-selection-drift equilibrium [37,43]. Therefore the neutral loci can accurately measure demographic history by excluding the influence of allele frequency by episodes of local environmental change (i.e., natural selection) [42]. We used two criteria, the 99% CI and the 95% CI to identify the neutral loci. From 221 AFLP loci, 179 loci were extracted under a criterion of 95% confidence interval (CI) and were thought to be neutral [18], and a total of 209 loci were categorized as neutral when the criterion was set to 99% CI. The overall mean distance of total AFLP loci, loci of 99% CI, and loci of 95% CI are 79.38, 75.42, and 64.35, respectively. Neighbor-Joining trees were reconstructed using total loci and neutral loci of 99% CI and 95% CI criteria for the rjMCMC skyline plot analysis (Supplementary Figure S1). If the substitution rate of an AFLP locus was suggested at a value of the order of 10−4 per substitution per year cf. [44,45], the time can be traced back to approximately 1.796 thousand years ago (kya), 1.804 kya, and 1.797 kya, respectively. If using the substitution rate inferring from long-lived species (about 4 × 10⁻³ per substitution per year, e.g., Pinus [46]), the estimated time is approximately 4.490 kya, 4.510 kya, and 4.493 kya, respectively. In other words, we intended to disclose the recent-past demographic history of K. obovata population in Southeastern China.
The demographic history of total population of K. obovata revealed gradual increase in Ne and a rapid rate-shift at the 20~15 substitution-units ago, approximately 0.9~0.675 or 2.22~1.688 kya, estimated by substitution rates of 10−4 or 4 × 10⁻³ per substitution per year, respectively (Figure 2 and Supplementary Figures S2A, S3A and S4A). The rapid-rate-shift events occurred in all populations but at slightly different times (Figure 3). Congruent demographic trends of K. obovata populations indicated that the genetic variation of K. obovata could be more sensitive to global climate dynamics rather than local environmental changes. For example, the time of rapid growth of Ne roughly corresponds to the Medieval Warm Period or Roman Climate-Optimum (estimated by substitution rate 10−4 or 4 × 10⁻³ per substitution per year, respectively) [47,48,49,50], in which the Asia was warmer [51]. Slight differences in the time-shift estimation of Ne might be caused by the bias of migration effect and substructure in temporal methods [52]. Systematic estimation bias, especially the underestimation of local Ne is common when the studied populations were connected by gene flow [52], which could also influence the Ne estimation in populations of K. obovata with no or low obstructed gene flow [18]. Figure 3 shows identical trends of demographic history from the estimates of three different sets of loci (i.e., total loci, loci of 99% CI, and loci of 95% CI) with slight differences in time units of rapid-rate-shift events. The estimates of Ne skylines by loci of 95% CI showed an apparently shorter time to coalesce and relatively recent rapid-rate-shift events in every population than the estimates by total loci and loci of 99% CI, but there were no differences in Ne estimated by the three different sets of loci (Figure 3 and Supplementary Figures S2–S4). These estimates indicated a mild effect of adaptive loci on current Ne estimation but more interference on the inference of demographic history.
Figure 2. Demographic skylines of total populations of K. obovata in Southeastern China estimated by loci of 95% CI. Dotted lines are the classic skylines; thin and bold lines are the medians and 95% CI of skylines are estimated by rjMCMC method.
Forests 06 01439 g002
Figure 3. The rjMCMC skylines of (A) total populations and (BI) every single population of K. obovata in Southeastern China. Black, red, and blue lines are the estimated median values of total loci, 99% CI loci, and 95% CI loci, respectively.
Forests 06 01439 g003

3.2. Current Ne of K. obovata

3.2.1. Ne of Natural Populations
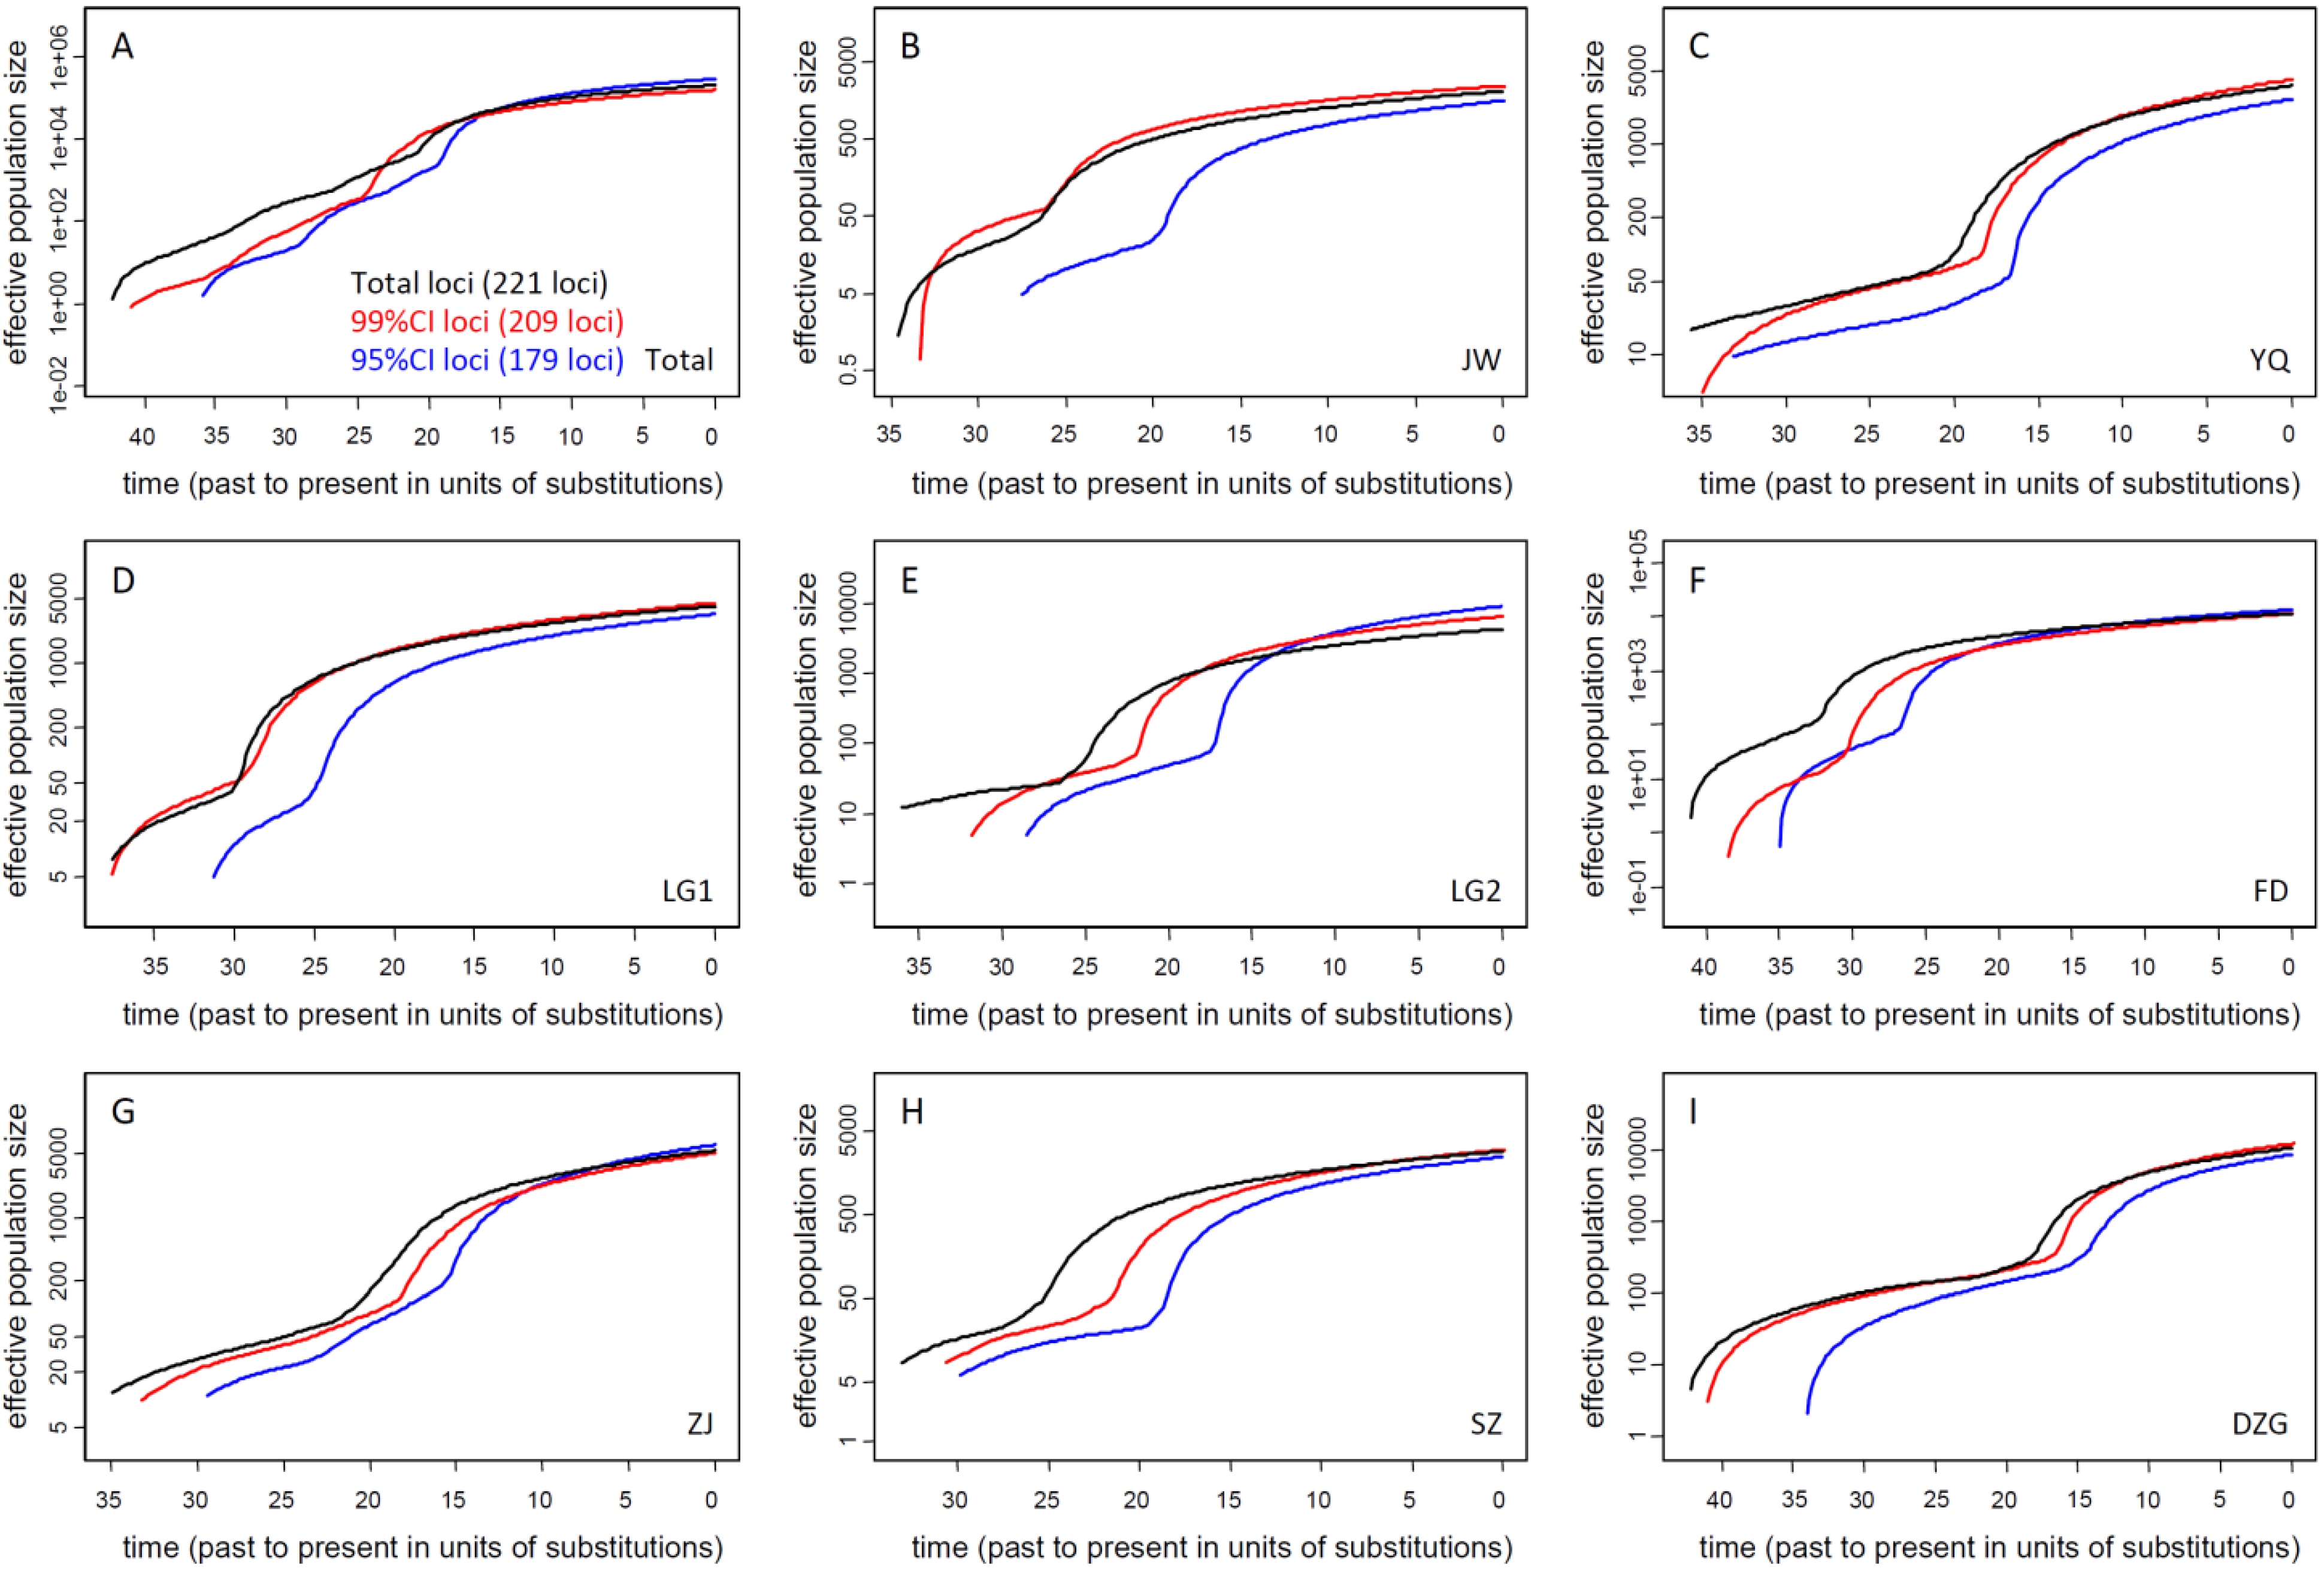
The current Ne of total population, estimated by datasets of total AFLP loci and the loci of 99% and 95% CI, are 2.42 × 10⁵, 2.29 × 10⁵, and 1.88 × 10⁵, respectively; the Ne of five natural populations estimated by three different sets of loci ranges between 2.37 × 10³ (NeJW) ~ 1.47 × 10⁴ (NeDZG), 2.59 × 10³ (NeJW) ~ 1.50 × 10⁴ (NeDZG), and 1.79 × 10³ (NeJW) ~ 1.39 × 10⁴ (NeFD), respectively; the Ne of three reforested populations estimated by three different sets of loci ranges between 3.91 × 10³(NeYQ) ~ 4.20 × 10³ (NeLG2), 3.97 × 10³ (NeLG1) ~ 6.98 × 10³ (NeLG2), and 2.62 × 10³ (NeYQ) ~ 8.67 × 10³ (NeLG2), respectively (Table 1 and Supplementary Table S1). The overlapped CI of current Ne of all populations estimated by three kinds of datasets showed non-significant differences of Ne estimates (Table 1 and Supplementary Table S1), indicating a minor effect of selective pressures on the current Ne estimation of K. obovata.
The most northern and southern natural populations, FD and DZG, showed larger Ne than the other populations. There are two most probable explanations for a population with large Ne: (1) maintenance of large amount of ancestral polymorphisms or (2) the melting pot receiving genes from different sources. The DZG was closer to the Northern South China Sea, the location of ancestral populations of several Southeast Asian mangrove species [15,18]. The large Ne of DZG is probably due to the preservation of a large amount of ancestral polymorphism. Another high Ne population, FD, might be due to the receiving of allochthonous genes or even have different sources from other sampled populations [18]. FD is the most northern natural population on the coast of China, which receives the cool China Coast Current from the East China Sea and the warmer northward South China Sea Current [53], which might bring propagules from different sources, such as the Ryukyus, Northern Taiwan, and the Southern China populations. The Ryukyu archipelagos are closer to FD. Genotypes of Ryukyu populations and the Northern Taiwan population might differ from populations around the Chinese coasts [18]. Gene flow between these populations could be accelerated by complicated ocean currents and seashore currents as well as long-distance dispersed pollinators cf. [19,54]. In fact, our previous study has shown that FD possesses a genetic composition different from that of other populations around the China coasts [18]. Additionally, FD has the longer coalescent times (41.08, 38.43, and 34.94 time units, in three different AFLP loci set estimates, respectively) and the earliest time of rapid-rate shift (approximately 25~35 substitution-units ago) than other populations (Figure 4), suggesting early stabilization in NeFD dynamics. If FD has identical sources with other populations around the China coasts, we could predict a similar coalescent history because similar or identical genotypes were sampled to infer demography. However, the other populations around China coasts have later growth-rate shift in Ne, suggesting later expansion demographies and different genetic compositions from FD, despite similar trends of increased Ne in all populations (Figure 4).
JW and DZG are continental-island populations off Mainland China (Figure 1) but have contrast Ne estimates: The DZG has the largest Ne while the JW has the smallest Ne in all sampled populations (Table 1). In fact, the JW population is a pure-stand mangrove forest and has a very large Nc, which might suggest a consequence of rapid expansion of population size. The area of pure-stand forest of K. obovata in the Danshuei River estuary, where the JW was located, was 47.62 hectare (ha) and 47.15 ha in 1978 and 1986, respectively, but rapidly expanded to 81.43 ha in 1994 and 103.80 ha in 1998 [55]. The current area of the Danshuei River Mangrove Wetland is approximately 190 ha was proclaimed by the Taiwanese Government [18], which is comprised of the Wazihwei Nature Reserve (30 ha), the Guandu Nature Reserve (55 ha), and the Danshuei River Mangrove Nature Reserve (76.41 ha) [33]. Although the rapid expansion of wetland habitat since 1986 (roughly four-fold areas within 30 years) increased the NcJW, genetic variation cannot be accumulated in such a short time to create the corresponding NeJW. Although the NeJW does not increase as quickly as the NcJW, the large area of K. obovata pure-stand forest still increased the water conductivity, high nutrient concentrations in water, and complicated microbial ecosystem to enrich the local biodiversity [56]. Protection of wetlands will be helpful for maintaining the complexity of mangrove ecosystem and can protect the biodiversity in estuaries.
Table 1. Summary of the current Ne of K. obovata off Southeastern China estimated by the neutral loci of a criterion of 95% CI.
ALLJWFDZJSZDZGYQ *LG1 *LG2 *
Mean1882891792139226284258191783094370310053
Median163113155011847502922017818262430748666
95% CI65730–437432554–42893644–376091273–18864825–64322009–25295826–82151105–102591926–26150
* Reforested populations. YQ was reforested in 1957, sourced from unknown population in Fujian Province; LG1 and LG2 were reforested in 1999 and 2008, respectively, sourced from FD.
Figure 4. The Ne through-time-plots of the FD population estimated from 30 samples (N = 30) and the reforested population simulated from 1/2 (N = 15), 1/3 (N = 10), 1/5 (N = 6), and 1/10 (N = 3) sample size of FD. (A) The classic skylines; (B) the medians of rjMCMC skylines; (C) the 95% CI of rjMCMC skylines. The rjMCMC skylines estimated from 20% and 10% Nc of FD are not shown due to small sample sizes (N = 6 and N = 3, respectively). Individual simulation plots are shown in Supplementary Figure S5.
Forests 06 01439 g004

3.2.2. Ne of Reforested Populations and Ne Reduction of Biased Sampling for Restoration

The Ne of reforested population YQ (NeYQ) estimated by total loci and loci of 99% and 95% CI are 4562, 4898, and 3094, respectively; the NeLG1 are 4752, 4480, and 3073 and the NeLG2 are 5597, 7710, and 10053 were estimated by three different dataset (Table 1 and Supplementary Table S1). Because we did not know the exact source of YQ, the comparison of Ne was made only for LG1, LG2 and their source population FD. The LG2 reforested in 2008 showed relatively higher Ne, which is roughly 40%~70% Ne of the source population FD; while the LG1 reforested in 1999 exhibited roughly 20%~30% Ne of FD. Greater differences of Ne between LG1 and LG2 were obtained when removing adaptive loci (i.e., NeLG1 = 4752 vs. NeLG2 = 5597 in the estimates of total loci and NeLG1 = 3073 vs. NeLG2 = 10053 in the estimates of loci of 95% CI), indicating the bigger effect of drift than natural selection on the Ne estimation. The adaptive convergence might shade the differences of Ne. Unlike the natural populations, the adaptive loci are likely to more severely affect the Ne estimates, especially on LG2, in which roughly two-fold differences were found between 95%-CI-loci estimation (NeLG2 = 10053) and total-loci estimation (NeLG2 = 5597). The severe influence of adaptive loci on larger-Ne population (LG2) than small-Ne population (LG1) is consistent with a case of sunflowers that the adaptive divergence is positively correlated with the Ne of the species with large Ne but not of the species with small Ne [57]. The dramatically different estimates of adaptive divergence on larger-Ne population could be due to the easier accumulation of adaptive variations between high-differentiated lineages, which have higher Ne estimates [57].
Even after neglecting the effect of the adaptive loci on Ne estimation, the NeLG1 and NeLG2 are still smaller than the NeFD of source population (Table 1). Therefore, we assume that the reduced Ne of the restored population is probably due to the biased sampling of seedlings during reforestation [18]. The artificial propagation for restoring mangroves usually adopts a sampling strategy of collecting propagules from small fractions of mother trees for convenience rather than extensive sampling, which could cause a bottleneck effect and highly susceptible to genetic drift for the next generation [58]. A greenhouse experiment has shown that the genetic diversity of restored population is decided by the number of sources but does not relate to the size of sources [59]. Therefore, for decreasing the risk of reduction of genetic diversity, and to increase the genetic diversity, a proper suggestion for the reforestation of K. obovata should be a comprehensive sampling of seedlings [23,59].
For testing the degree of Ne reduction of small or biased sampling of seedlings for restoration, simulated populations generated by resampling of 1/2, 1/3, 1/5, and 1/10 sample sizes from FD and equally expanded 30 samples were used to evaluate the reduction of Ne. The simulated results showed a dramatic reduction of Ne (over 90% reductions) at a resampling of 1/2 sample sizes (Ne < 1000, estimated by rjMCMC method), and over 99% reductions of Ne at a resampling of 1/10 sample sizes (Ne < 100, estimated by classic skyline analyses, the rjMCMC estimation failed because genetic variation is too small) (Figure 4).
It should be noted that the Ne reduction could be overestimated because we did not consider the situation that outcrossing would lead different genotypes of resampling. However, this simulation still provides evidence of a dramatic reduction of Ne and a decreased genetic diversity of reforested population than that of the source population under incomprehensive sampling of seeds (propagules), which reflects the strong effect of demographic stochasticity on selective breeding [60]. The lost genetic diversity of restored or reforested populations is the next conservation issue, because these populations regenerated by seedlings would be the reservoir of genetic diversity [23,58], but their genetic diversity may gradually been lost because not all seedlings will reach the adult stage [58]. The restored or reforested populations with small Ne are at higher risk in inbreeding depression, genetic variability loss, and fixation of new deleterious mutations than that of the source populations [60]. In addition, the genetic diversity of natural populations could also be affected (decreased or replaced) by these artificial forests via gene flow [61,62].

4. Conclusions

In this study, AFLP loci were used to investigate the demographic history of K. obovata in the recent-past period of roughly 1.8 kya, during which the population size was gradually increased with a short-span rapid growth of Ne inferred by the rjMCMC skyline analysis, and showed a current Ne of approximately 2 × 10⁵ in total populations, in Southeastern China. The time of rapid growth of K. obovata population matched to the Medieval Warm Period and the population dynamics are therefore thought to be mainly affected by global climate changes instead of local environments. Smaller Ne of every single population, rather than the total population, suggests that the genotypes are not randomly dispersed in every single population, which caused differentiated or structured populations. The southeast and the northeast natural populations, DZG and FD, showed the largest Ne, which probably reflect the maintenance of large ancestral polymorphisms in DZG and a melting pot receiving allochthonous genes from other areas in FD. The JW population in Northern Taiwan Island has the smallest Ne although it was the largest pure-stand mangrove forest comprised of K. obovata. The contrast Ne and Nc of JW could be due to recent habitat expansion approximately 30 years ago. Relatively small Ne was inferred in reforested populations LG1 and LG2 than the natural population of FD. By excluding the effect of natural selection (i.e., removing adaptive loci), the reduction of Ne of reforested populations is suggested as a result of small or biased sampling of seedlings from the mother population. A simple in silico demographic analysis indicated over 90% and 99% reductions of Ne under 1/2 and 1/10 sampling for reforestation, respectively. This simulation indicates a dramatic decrease of Ne of restored populations under small-size sampling from source populations. This study unveiled not only the current status of the Ne of K. obovata, but also emphasizes the importance of the comprehensive sampling of seeds for the restoration projects.

Acknowledgments

Funds are partially supported by Ministry of Science and Technology, R.O.C (MOST 102-2621-B-003-005-MY3) to Pei-Chun Liao. This article was also subsidized by the National Taiwan Normal University (NTNU), Taiwan.

Author Contributions

Pei-Chun Liao conceived the study. Yu Ruan, Bing-Hong Huang, and Pei-Chun Liao analyzed the data. All authors wrote and approved the manuscript.

Conflicts of Interest

The authors declare no conflict of interest.

Supplementary Materials

References

  1. Ellstrand, N.C.; Elam, D.R. Population genetic consequences of small population size: Implications for plant conservation. Annu. Rev. Ecol. Syst. 1993, 24, 217–242. [Google Scholar] [CrossRef]
  2. Lynch, M.; Lande, R. The critical effective size for a genetically secure population. Anim.Conserv. 1998, 1, 70–72. [Google Scholar] [CrossRef]
  3. Franklin, I.R.; Frankham, R. How large must populations be to retain evolutionary potential? Anim. Conserv. 1998, 1, 69–70. [Google Scholar] [CrossRef]
  4. Hare, M.P.; Nunney, L.; Schwartz, M.K.; Ruzzante, D.E.; Burford, M.; Waples, R.S.; Ruegg, K.; Palstra, F. Understanding and estimating effective population size for practical application in marine species management. Conserv. Biol. 2011, 25, 438–449. [Google Scholar] [CrossRef] [PubMed]
  5. Jamieson, I.G.; Allendorf, F.W. How does the 50/500 rule apply to MVPs? Trends Ecol. Evol. 2012, 27, 578–584. [Google Scholar] [CrossRef] [PubMed]
  6. Schoen, D.J.; Brown, A.H.D. Intraspecific variation in population gene diversity and effective population size correlates with the mating system in plants. Proc. Natl. Acad. Sci. USA 1991, 88, 4494–4497. [Google Scholar] [CrossRef] [PubMed]
  7. Charlesworth, B. Effective population size and patterns of molecular evolution and variation. Nat. Rev. Genet. 2009, 10, 195–205. [Google Scholar] [CrossRef] [PubMed]
  8. Lande, R. Genetics and demography in biological conservation. Science 1988, 241, 1455–1460. [Google Scholar] [CrossRef] [PubMed]
  9. Chen, X.Y. Effects of plant density and age on the mating system of Kandelia candel Druce (Rhizophoraceae), a viviparous mangrove species. Hydrobiologia 2000, 432, 189–193. [Google Scholar] [CrossRef]
  10. Nagelkerken, I.; Blaber, S.J.M.; Bouillon, S.; Green, P.; Haywood, M.; Kirton, L.G.; Meynecke, J.O.; Pawlik, J.; Penrose, H.M.; Sasekumar, A.; Somerfield, P.J. The habitat function of mangroves for terrestrial and marine fauna: A review. Aquat. Bot. 2008, 89, 155–185. [Google Scholar] [CrossRef]
  11. Lewis, R.R.; Gilmore, R.G. Important considerations to achieve successful mangrove forest restoration with optimum fish habitat. Bull. Mar. Sci. 2007, 80, 823–837. [Google Scholar]
  12. Kathiresan, K.; Bingham, B.L. Biology of mangroves and mangrove ecosystems. Adv. Mar. Biol. 2001, 40, 81–251. [Google Scholar]
  13. Lee, S.Y. Tropical mangrove ecology: Physical and biotic factors influencing ecosystem structure and function. Aust. J. Ecol. 1999, 24, 355–366. [Google Scholar] [CrossRef]
  14. Feller, I.C.; Lovelock, C.E.; Berger, U.; McKee, K.L.; Joye, S.B.; Ball, M.C. Biocomplexity in mangrove ecosystems. Annu. Rev. Mar. Sci. 2010, 2, 395–417. [Google Scholar] [CrossRef]
  15. Liao, P.C.; Hwang, S.Y.; Huang, S.; Chiang, Y.C.; Wang, J.C. Contrasting demographic patterns of Ceriops tagal (Rhizophoraceae) populations in the South China Sea. Aust. J. Bot. 2011, 59, 523–532. [Google Scholar] [CrossRef]
  16. Liao, P.C.; Chiang, Y.C.; Huang, S.; Wang, J.C. Gene flow of Ceriops tagal (Rhizophoraceae) across the Kra Isthmus in the Thai-Malay Peninsula. Bot. Stud. 2009, 50, 193–204. [Google Scholar]
  17. Liao, P.C.; Havanond, S.; Huang, S. Phylogeography of Ceriops tagal (Rhizophoraceae) in Southeast Asia: The land barrier of the Malay Peninsula has caused population differentiation between the Indian Ocean and South China Sea. Conserv. Genet. 2007, 8, 89–98. [Google Scholar] [CrossRef]
  18. Ruan, Y.; Huang, B.H.; Lai, S.J.; Wan, Y.T.; Li, J.Q.; Huang, S.; Liao, P.C. Population genetic structure, local adaptation, and conservation genetics of Kandelia obovata. Tree Genet. Genomes 2013, 9, 913–925. [Google Scholar] [CrossRef]
  19. Geng, Q.F.; Lian, C.L.; Goto, S.; Tao, J.M.; Kimura, M.; Islam, M.D. S.; Hogetsu, T. Mating system, pollen and propagule dispersal, and spatial genetic structure in a high-density population of the mangrove tree Kandelia candel. Mol. Ecol. 2008, 17, 4724–4739. [Google Scholar] [CrossRef] [PubMed]
  20. Wang, J.L. Inbreeding coefficient and effective size for an X-linked locus in nonrandom mating populations. Heredity 1996, 76, 569–577. [Google Scholar] [CrossRef]
  21. Kimura, M.; Maruyama, T. Pattern of neutral polymorphism in a geographically structured population. Genet. Res. 1971, 18, 125–131. [Google Scholar] [CrossRef] [PubMed]
  22. Caballero, A.; Hill, W.G. Effective size of nonrandom mating populations. Genetics 1992, 130, 909–916. [Google Scholar] [PubMed]
  23. Broadhurst, L.M.; Lowe, A.; Coates, D.J.; Cunningham, S.A.; McDonald, M.; Vesk, P.A.; Yates, C. Seed supply for broadscale restoration: Maximizing evolutionary potential. Evol. Appl. 2008, 1, 587–597. [Google Scholar] [PubMed]
  24. Rogers, A.R.; Harpending, H. Population growth makes waves in the distribution of pairwise genetic differences. Mol. Biol. Evol. 1992, 9, 552–569. [Google Scholar] [PubMed]
  25. Watterson, G.A. On the number of segregating sites in genetical models without recombination. Theor. Popul. Biol. 1975, 7, 256–276. [Google Scholar] [CrossRef] [PubMed]
  26. Ho, S.Y. W.; Shapiro, B. Skyline-plot methods for estimating demographic history from nucleotide sequences. Mol. Ecol. Resour. 2011, 11, 423–434. [Google Scholar] [CrossRef] [PubMed]
  27. Light, J.E.; Hafner, J.C.; Upham, N.S.; Reddington, E. Conservation genetics of kangaroo mice, Genus Microdipodops. J. Mamm. Evol. 2013, 20, 129–146. [Google Scholar] [CrossRef]
  28. Bernard, A.M.; Shivji, M.S.; Prince, E.D.; Hazin, F.H. V.; Arocha, F.; Domingo, A.; Feldheim, K.A. Comparative population genetics and evolutionary history of two commonly misidentified billfishes of management and conservation concern. BMC Genet. 2014, 15, 141. [Google Scholar] [CrossRef] [PubMed]
  29. Garrick, R.C.; Kajdacsi, B.; Russello, M.A.; Benavides, E.; Hyseni, C.; Gibbs, J.P.; Tapia, W.; Caccone, A. Naturally rare versus newly rare: Demographic inferences on two timescales inform conservation of Galapagos giant tortoises. Ecol. Evol. 2015, 5, 676–694. [Google Scholar] [CrossRef] [PubMed]
  30. Chiang, T.Y.; Chiang, Y.C.; Chen, Y.J.; Chou, C.H.; Havanond, S.; Hong, T.N.; Huang, S. Phylogeography of Kandelia candel in East Asiatic mangroves based on nucleotide variation of chloroplast and mitochondrial DNAs. Mol. Ecol. 2001, 10, 2697–2710. [Google Scholar] [CrossRef] [PubMed]
  31. Chen, S.B.; Ding, W.Y.; Qiu, J.B.; Wang, G.Y.; Zhou, Z.M.; Chen, J.F.; Ai, W.M.; Wang, C.Y.; Xie, Q.L. The genetic diversity of the mangrove Kandelia obovata in China revealed by ISSR analysis. Pak. J. Bot. 2010, 42, 3755–3764. [Google Scholar]
  32. Islam, M.S.; Lian, C.L.; Kameyama, N.; Hogetsu, T. Analyses of genetic population structure of two ecologically important mangrove tree species, Bruguiera gymnorrhiza and Kandelia obovata from different river basins of Iriomote Island of the Ryukyu Archipelago, Japan. Tree Genet. Genomes 2012, 8, 1247–1260. [Google Scholar] [CrossRef]
  33. Forestry Bureau, COA. Taiwan, Nature Conservation. Available online: http://conservation.forest.gov.tw/ (accessed on 26 March 2015).
  34. Varshney, R.K.; Chabane, K.; Hendre, P.S.; Aggarwal, R.K.; Graner, A. Comparative assessment of EST-SSR, EST-SNP and AFLP markers for evaluation of genetic diversity and conservation of genetic resources using wild, cultivated and elite barleys. Plant Sci. 2007, 173, 638–649. [Google Scholar] [CrossRef]
  35. Ho, S.Y.; Shapiro, B. Skyline-plot methods for estimating demographic history from nucleotide sequences. Mol. Ecol. Resour. 2011, 11, 423–434. [Google Scholar] [CrossRef] [PubMed]
  36. AFLP loci, Dryad Digital Repository. Available online: http://dx.doi.org/10.5061/dryad.pb3tr (accessed on 23 April 2015).
  37. Excoffier, L.; Hofer, T.; Foll, M. Detecting loci under selection in a hierarchically structured population. Heredity 2009, 103, 285–298. [Google Scholar] [CrossRef] [PubMed]
  38. Beaumont, M.A.; Balding, D.J. Identifying adaptive genetic divergence among populations from genome scans. Mol. Ecol. 2004, 13, 969–980. [Google Scholar] [CrossRef] [PubMed]
  39. Opgen-Rhein, R.; Fahrmeir, L.; Strimmer, K. Inference of demographic history from genealogical trees using reversible jump Markov chain Monte Carlo. BMC Evol. Biol. 2005, 5, 6. [Google Scholar] [CrossRef] [PubMed] [Green Version]
  40. Paradis, E.; Claude, J.; Strimmer, K. APE: Analyses of phylogenetics and evolution in R language. Bioinformatics 2004, 20, 289–290. [Google Scholar] [CrossRef] [PubMed]
  41. Tamura, K.; Battistuzzi, F.U.; Billing-Ross, P.; Murillo, O.; Filipski, A.; Kumar, S. Estimating divergence times in large molecular phylogenies. Proc. Natl. Acad. Sci. USA. 2012, 109, 19333–19338. [Google Scholar] [CrossRef] [PubMed]
  42. Wu, Q.; Zheng, P.P.; Hu, Y.B.; Wei, F.W. Genome-scale analysis of demographic history and adaptive selection. Protein Cell 2014, 5, 99–112. [Google Scholar] [CrossRef] [PubMed]
  43. Storz, J.F.; Wheat, C.W. Integrating evolutionary and functional approaches to infer adaptation at specific loci. Evolution 2010, 64, 2489–2509. [Google Scholar] [CrossRef] [PubMed]
  44. Campbell, D.; Bernatchez, L. Generic scan using AFLP markers as a means to assess the role of directional selection in the divergence of sympatric whitefish ecotypes. Mol. Biol. Evol. 2004, 21, 945–956. [Google Scholar] [CrossRef] [PubMed]
  45. Tero, N.; Aspi, J.; Siikamaki, P.; Jakalaniemi, A.; Tuomi, J. Genetic structure and gene flow in a metapopulation of an endangered plant species, Silene tatarica. Mol. Ecol. 2003, 12, 2073–2085. [Google Scholar] [CrossRef] [PubMed]
  46. Kuchma, O.; Vornam, B.; Finkeldey, R. Mutation rates in Scots pine (Pinus sylvestris L.) from the Chernobyl exclusion zone evaluated with amplified fragment-length polymorphisms (AFLPs) and microsatellite markers. Mutat. Res. Genet. Toxicol. Environ. 2011, 725, 29–35. [Google Scholar] [CrossRef]
  47. Dansgaard, W. Greenland Ice Core Studies. Palaeogeogr. Palaeocl. 1985, 50, 185–187. [Google Scholar] [CrossRef]
  48. Mann, M.E.; Zhang, Z.H.; Rutherford, S.; Bradley, R.S.; Hughes, M.K.; Shindell, D.; Ammann, C.; Faluvegi, G.; Ni, F.B. Global signatures and dynamical origins of the Little Ice Age and Medieval Climate Anomaly. Science 2009, 326, 1256–1260. [Google Scholar] [CrossRef] [PubMed]
  49. Loehle, C. A 2000-year global temperature reconstruction based on non-tree ring proxies. Energy Environ. 2007, 18, 1049–1058. [Google Scholar] [CrossRef]
  50. Loehle, C.; McCulloch, J.H. Correction to: A 2000-year global temperature reconstruction based on non-tree ring proxies. Energy Environ. 2008, 19, 93–100. [Google Scholar] [CrossRef]
  51. Yamada, K.; Kamite, M.; Saito-Kato, M.; Okuno, M.; Shinozuka, Y.; Yasuda, Y. Late Holocene monsoonal-climate change inferred from Lakes Ni-no-Megata and San-no-Megata, northeastern Japan. Quat. Int. 2010, 220, 122–132. [Google Scholar] [CrossRef]
  52. Ryman, N.; Allendorf, F.W.; Jorde, P.E.; Laikre, L.; Hossjer, O. Samples from subdivided populations yield biased estimates of effective size that overestimate the rate of loss of genetic variation. Mol. Ecol. Resour. 2014, 14, 87–99. [Google Scholar] [CrossRef] [PubMed]
  53. Jan, S.; Wang, J.; Chern, C.S.; Chao, S.Y. Seasonal variation of the circulation in the Taiwan Strait. J. Mar. Syst. 2002, 35, 249–268. [Google Scholar] [CrossRef]
  54. Sun, M.; Wong, K.C.; Lee, J.S.Y. Reproductive biology and population genetic structure of Kandelia candel (Rhizophoraceae), a viviparous mangrove species. Am. J. Bot. 1998, 85, 1631–1637. [Google Scholar] [CrossRef] [PubMed]
  55. Lee, C.-T. Changes of mangrove (Kandelia candel (L.) Druce) distribution in Tanshui estuary. Hwa Kang Geogr. J. 2003, 16, 59–69. [Google Scholar]
  56. Liao, P.C.; Huang, B.H.; Huang, S. Microbial community composition of the Danshui river estuary of northern Taiwan and the practicality of the phylogenetic method in microbial barcoding. Microb. Ecol. 2007, 54, 497–507. [Google Scholar] [CrossRef] [PubMed]
  57. Strasburg, J.L.; Kane, N.C.; Raduski, A.R.; Bonin, A.; Michelmore, R.; Rieseberg, L.H. Effective population size is positively correlated with levels of adaptive divergence among annual sunflowers. Mol. Biol. Evol. 2011, 28, 1569–1580. [Google Scholar] [CrossRef] [PubMed]
  58. Nazareno, A.G.; dos Reis, M.S. At risk of population decline? An ecological and genetic approach to the threatened palm species Butia eriospatha (Arecaceae) of Southern Brazil. J. Hered. 2014, 105, 120–129. [Google Scholar] [CrossRef] [PubMed]
  59. Gustafson, D.J.; Gibson, D.J.; Nickrent, D.L. Genetic diversity and competitive abilities of Dalea purpurea (Fabaceae) from remnant and restored grasslands. Int. J. Plant Sci. 2002, 163, 979–990. [Google Scholar] [CrossRef]
  60. Lande, R. Anthropogenic, ecological and genetic factors in extinction and conservation. Res. Popul. Ecol. 1998, 40, 259–269. [Google Scholar] [CrossRef]
  61. Keller, M.; Kollmann, J.; Edwards, P.J. Genetic introgression from distant provenances reduces fitness in local weed populations. J. Appl. Ecol. 2000, 37, 647–659. [Google Scholar] [CrossRef]
  62. Liao, P.C.; Tsai, C.C.; Chou, C.H.; Chiang, Y.C. Introgression between cultivars and wild populations of Momordica charantia L. (Cucurbitaceae) in Taiwan. Int. J. Mol. Sci. 2012, 13, 6469–6491. [Google Scholar] [CrossRef] [PubMed]

