
Residual Long-Term Effects of Forest Fertilization on Tree Growth and Nitrogen Turnover in Boreal Forest

Abstract
:1. Introduction
2. Materials and Methods
2.1. Study Area

| Sites (n) | Control | N1 | N2 | F-value | p-value |
|---|---|---|---|---|---|
| 7 | 7 | 7 | |||
| Elevation a.s.l. (m) | 334 ± 21 | 358 ± 20 | 334 ± 17 | 0.54 | 0.59 |
| Temperature sum (gdd) | 937 ± 6 | 900 ± 22 | 923 ± 11 | 1.59 | 0.23 |
| Slope (1 to 5) | 2.00 ± 0.22 | 1.86 ± 0.26 | 1.72 ± 0.18 | 0.41 | 0.67 |
| Site index (H100, m) | 20.6 ± 0.2 | 19.7 ± 0.3 | 20.4 ± 0.3 | 3.00 | 0.08 |
| Trees (ha−1) | 2721 ± 378 | 2982 ± 416 | 2532 ± 206 | 0.43 | 0.65 |
| Tree age (years) | 10.4 ± 0.2 | 10.4 ± 0.2 | 10.3 ± 0.2 | 0.80 | 0.47 |
2.2. Data Collection
2.3. Experimental Design and Statistical Analyses
3. Results
| Within Subjects | Degrees of Freedom | F-value | p-value |
|---|---|---|---|
| Year | 1.43 | 948.88 | <0.001 |
| Year · Treatment | 2.86 | 3.33 | 0.037 |
| Error (year) | 25.72 | 1217.1 | |
| Between subjects | |||
| Treatment | 2 | 5.09 | 0.018 |
| Error | 18 | ||

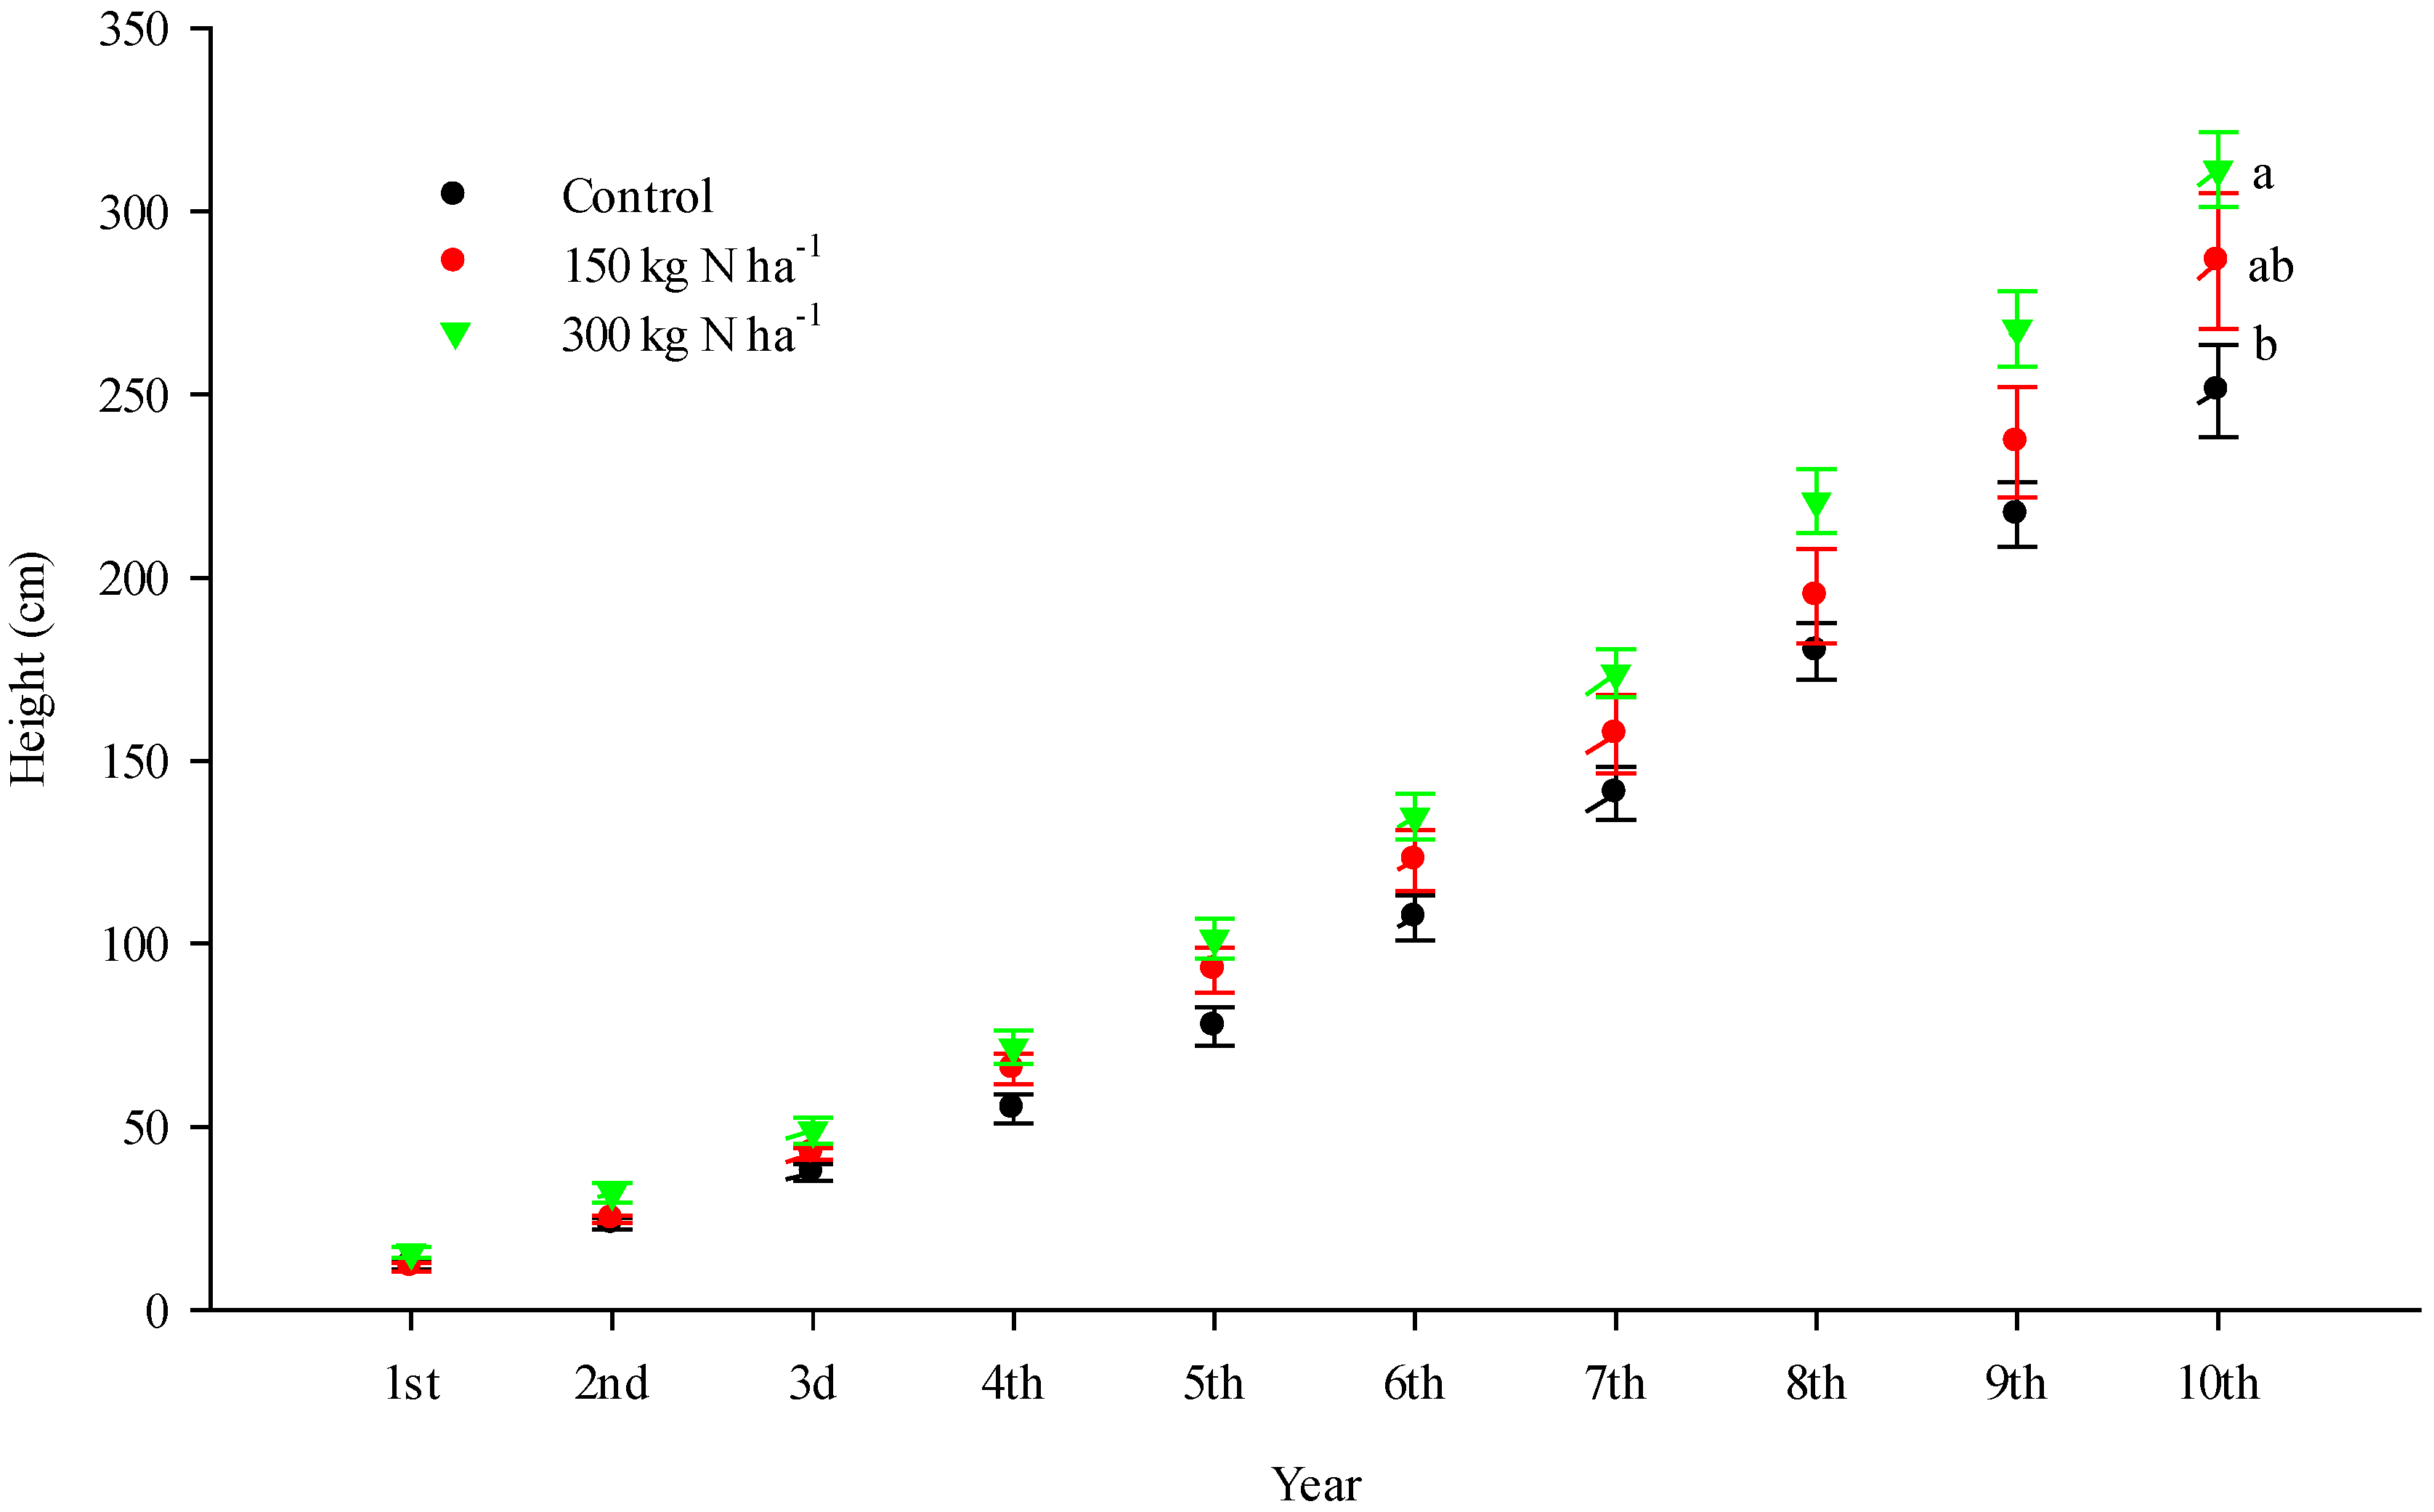
| Treatment | Needle N Concentration | DBH | Tree Height | Total Mineralization | Total Soil Mobile N |
|---|---|---|---|---|---|
| (%-DW) | (mm, 2010) | (cm, 2010) | (N mg g−1 DW soil) | (mg capsule−1) | |
| C | 1.19 ± 0.05 a | 31 ± 5 a | 251 ± 12 a | 0.083 ± 0.012 a | 0.057 ± 0.023 a |
| N1 | 1.38 ± 0.05 b | 34 ± 5 a | 286 ± 13 ab | 0.090 ± 0.021 a | 0.072 ± 0.022 ab |
| N2 | 1.35 ± 0.04 b | 39 ± 4 a | 311 ± 17 b | 0.293 ± 0.109 b | 0.099 ± 0.020 b |
| F-value | 5.04 | 0.75 | 4.50 | 5.22 | 3.71 |
| P-value | 0.018 | 0.486 | 0.026 | 0.016 | 0.045 |
4. Discussion
5. Conclusions
Acknowledgments
Author Contributions
Conflicts of Interest
References
- Tamm, C.O. Nitrogen in terrestrial ecosystems: Questions of productivity, vegetational changes, and ecosystem stability. In Ecological Studies Analysis and Synthesis; Springer-Verlag Berlin Heidelberg: Berlin, Germany, 1991; p. 115. [Google Scholar]
- Vitousek, P.M.; Howarth, R.W. Nitrogen limitation on land and in the sea: How can it occur? Biogeochemistry 1991, 13, 87–115. [Google Scholar] [CrossRef]
- Nohrstedt, H.O. Response of coniferous forest ecosystems on mineral soils to nutrient additions: A review of Swedish experiences. Scand. J. For. Res. 2001, 16, 555–573. [Google Scholar] [CrossRef]
- Simonsen, R.; Rosvall, O.; Gong, P.C.; Wibe, S. Profitability of measures to increase forest growth. For. Policy Econ. 2010, 12, 473–482. [Google Scholar] [CrossRef]
- Kardell, L. Skogsgödslingen I backspegeln. In Debatten om Storskogsbrukets Kvävegödsling I Sverige ca 1960–2009; Future Forests Working Report; Future Forests: Umeå, Sweden, 2010. [Google Scholar]
- Lindkvist, A.; Kardell, O.; Nordlund, C. Intensive forestry as progress or decay? An analysis of the debate about forest fertilization in Sweden, 1960–2010. Forests 2011, 2, 112–146. [Google Scholar] [CrossRef]
- Albaugh, T.J.; Allen, H.L.; Fox, T.R. Historical patterns of forest fertilization in the southeastern United States from 1969 to 2004. South. J. Appl. For. 2007, 31, 129–137. [Google Scholar]
- Brockley, R.P. Fertilization of lodgepole pine in western Canada. In Proceedings of the Enhanced Forest Management, Fertilization & Economics Conference, Edmonton, AB, Canada, 1–2 March 2001; pp. 44–55.
- Saarsalmi, A.; Malkonen, E. Forest fertilization research in Finland: A literature review. Scand. J. For. Res. 2001, 16, 514–535. [Google Scholar] [CrossRef]
- Näslund, B.Å.; Stendahl, J.; Samuelsson, H.; Karlsson, L.; Kock-Hansson, G.; Svensson, H.; Engvall, C. Kvävegödsling på skogsmark. Underlag för Skogsstyrelsen Föreskrifter och Allmänna Råd om Kvävegödsling; Näslund, B.Å., Ed.; Swedish Forest Agency: Jönköping, Sweden, 2013; p. 48. Available online: http://www.regelradet.se/wp-content/files_mf/13702638072013_178_Rapport_kvavegodsling.pdf (accessed on 7 April 2015).
- Enander, G.; Samuelsson, H. Skogsstyrelsens Allmänna Råd Till Ledning för Hänsyn Enligt 30 § Skogsvårdslagen (1979:429) vid Användning av Kvävegödselmedel på Skogsmark. Skogssstyrelsen. SKSFS 2007, 3, 5. [Google Scholar]
- Pettersson, F. New Predictive Functions Reveal Same Growth Response to N Fertilization as 30 Years Ago; SkogsForsk (Forestry Research Institute of Sweden): Uppsala, Sweden, 1994; p. 6. [Google Scholar]
- Priha, O.; Smolander, A. Nitrification, denitrification and microbial biomass N in soil from 2 N-fertilized and limed norway spruce forests. Soil Biol. Biochem. 1995, 27, 305–310. [Google Scholar] [CrossRef]
- Smolander, A.; Priha, O.; Paavolainen, L.; Steer, J.; Malkonen, E. Nitrogen and carbon transformations before and after clear-cutting in repeatedly N-fertilized and limed forest soil. Soil Biol. Biochem. 1998, 30, 477–490. [Google Scholar] [CrossRef]
- Högbom, L.; Jacobsson, S. Kväve 2002—En konsekvensbeskrivning av skogsmarksgödsling i sverige. Skogforsk Redogörelse. 2002, 6. Available online: http://shop.skogsstyrelsen.se/shop/9098/art64/4645964-efc63c-1547.pdf (accessed on 7 April 2015).
- Peterson, C.E.; Gessel, S.P. Forest Fertilization in the Pacific Northwest: Results of the Regional Forest Nutrition Research Project; General Technical Report; Pacific Northwest Forest and Range Experiment Station, USDA Forest Service: Washington, DC, USA, 1983; pp. 365–369.
- Johansson, K.; Ring, E.; Hogbom, L. Effects of pre-harvest fertilization and subsequent soil scarification on the growth of planted Pinus Sylvestris seedlings and ground vegetation after clear-felling. Silva Fennica 2013, 47. [Google Scholar] [CrossRef]
- Footen, P.W.; Harrison, R.B.; Strahm, B.D. Long-term effects of nitrogen fertilization on the productivity of subsequent stands of douglas-fir in the pacific northwest. For. Ecol. Manage. 2009, 258, 2194–2198. [Google Scholar] [CrossRef]
- Hedwall, P.O.; Nordin, A.; Strengbom, J.; Brunet, J.; Olsson, B. Does background nitrogen deposition affect the response of boreal vegetation to fertilization? Oecologia 2013, 173, 615–624. [Google Scholar] [CrossRef] [PubMed]
- Strengbom, J.; Nordin, A. Commercial forest fertilization causes long-term residual effects in ground vegetation of boreal forests. For. Ecol. Manag. 2008, 256, 2175–2181. [Google Scholar] [CrossRef]
- Melin, J.; Nommik, H. Fertilizer nitrogen distribution in a Pinus slvestris/Picea abies ecosystem, central Sweden. Scand. J. For. Res. 1988, 3, 3–15. [Google Scholar] [CrossRef]
- Nohrstedt, H.O. Effects of repeated nitrogen fertilization with different doses on soil properties in a Pinus-sylvestris stand. Scand. J. For. Res. 1990, 5, 3–16. [Google Scholar] [CrossRef]
- Strengbom, J.; Nordin, A. Physical disturbance determines effects from nitrogen addition on ground vegetation in boreal coniferous forests. J. Veg. Sci. 2012, 23, 361–371. [Google Scholar] [CrossRef]
- Ahti, T.; Hämet-Ahti, L.; Jalas, J. Vegetation zones and their sections in northwestern Europe. Ann. Bot. Fenn. 1968, 5, 169–211. [Google Scholar]
- Womach, J.; Becker, G.S.; Blodgett, J.; Buck, G.; Canada, C.; Chite, R.; Cody, B.; Copeland, C.; Corn, L.; Cowan, T.; et al. Agriculture: A Glossary of Terms, Programs, and Laws, 2005th ed.; BiblioGov: Columbus, OH, USA, 2005; p. 282. [Google Scholar]
- Phil-Karlsson, G.; Akselsson, C.; Ferm, M.; Hellsten, S.; Hultberg, H.; Karlsson, P.E. Totaldeposition av Kväve Till Skog; Svensk Miljöinstitutet AB: Stockholm, Sweden, 2011. [Google Scholar]
- Driessen, P.; Deckers, J.; Spaargaren, O.; Nachtergaele, F. Lecture notes on the major soils of the world. Diagnostic horizons, properties and materials. In World Reference Base for Soil Resources (WRB); Driessen, P.M., Deckers, J., Spaargaren, O., Eds.; Food and Agriculture Organization: Rome, Italy, 2000; pp. 121–124. [Google Scholar]
- Chesworth, W. Moisture regimes. In Encyclopedia of Soil Science; Chesworth, W., Ed.; Springer: Dordrecht, Netherlands, 2008; p. 485. [Google Scholar]
- Påhlsson, L. Vegetationstyper I norden. In Nordiska Ministerrådet Copenhagen; Nordic Council of Ministers: Copenhagen, Denmark, 1995; pp. 145–146. [Google Scholar]
- Mauchly, J.W. Significance test for sphericity of a normal n-variate distribution. Ann. Math. Stat. 1940, 11, 204–209. [Google Scholar] [CrossRef]
- Nason, G.; Myrold, D.D. Nitrogen Fertilizers: Fates and Environmental Effects in Forests; Institute of Forest Resources Contrib. 73. College of Forest Resources, University of Washington: Seattle, WA, USA, 1992; pp. 67–81. Available online: http://www.cfr.washington.edu/research.smc/rfnrp/2FFC_Chap6.pdf (accessed on 7 April 2015).
- Bauer, G.; Schulze, E.D.; Mund, M. Nutrient contents and concentrations in relation to growth of Picea abies and Fagus sylvatica along a European transect. Tree Physiol. 1997, 17, 777–786. [Google Scholar] [CrossRef] [PubMed]
- Iivonen, S.; Kaakinen, S.; Jolkkonen, A.; Vapaavuori, E.; Linder, S. Influence of long-term nutrient optimization on biomass, carbon, and nitrogen acquisition and allocation in Norway spruce. Can. J. For. Res. 2006, 36, 1563–1571. [Google Scholar] [CrossRef]
- Binkley, D.; Reid, P. Long-term increase of nitrogen availability from fertilization of douglas-fir. Can. J. For. Res. 1985, 15, 723–724. [Google Scholar] [CrossRef]
- Melin, J.; Nommik, H.; Lohm, U.; Flowerellis, J. Fertilizer nitrogen budget in a Scots pine ecosystem attained by using root-isolated plots and N15 tracer technique. Plant Soil 1983, 74, 249–263. [Google Scholar] [CrossRef]
- Lundmark-Thelin, A.; Johansson, M.B. Influence of mechanical site preparation on decomposition and nutrient dynamics of Norway spruce (Picea abies (L.) Karst) needle litter and slash needles. For. Ecol. Manag. 1997, 96, 101–110. [Google Scholar] [CrossRef]
- Vitousek, P.M.; Matson, P.A. Disturbance, nitrogen availability, and nitrogen losses in an intensively managed loblolly pine plantation. Ecology 1985, 66, 1360–1376. [Google Scholar] [CrossRef]
- Rosén, K.; Aronson, J.A.; Eriksson, H.M. Effects of clear-cutting on streamwater quality in forest catchments in central Sweden. For. Ecol. Manag. 1996, 83, 237–244. [Google Scholar] [CrossRef]
- Pettersson, F.; Högbom, L. Long-term growth effects following forest nitrogen fertilization in Pinus sylvestris and Picea abies stands in Sweden. Scand. J. For. Res. 2004, 19, 339–347. [Google Scholar] [CrossRef]
- Hogbom, L.; Nohrstedt, H.O.; Lundstrom, H.; Nordlund, S. Soil conditions and regeneration after clear felling of a Pinus sylvestris l. Stand in a nitrogen experiment, central Sweden. Plant Soil 2001, 233, 241–250. [Google Scholar] [CrossRef]
- Högbom, L.; Nohrstedt, H.Ö.; Lundström, H.; Nordlund, S. Kvävegödsling Kan ge Varaktiga Effekter i Marken (Nitrogen Fertilization Can Have Long Term Effects on Soils); Skogforsk: Uppsala, Sweden, 2000; p. 4. (In Swedish) [Google Scholar]
- Olsson, B.A.; Kellner, O. Long-term effects of nitrogen fertilization on ground vegetation in coniferous forests. For. Ecol. Manag. 2006, 237, 458–470. [Google Scholar] [CrossRef]
- Hägglund, B. Forecasting Growth And Yield In Established Forests. An Outline And Analysis Of The Outcome Of A Subprogram Within The Hugin Project; Swedish University of Agricultural Sciences: Umeå, Sweden, 1981; p. 145. [Google Scholar]
- Hägglund, B. Samband Mellan Ståndortsindex h100 Och Bonitet För Tall Och Gran i Sverige; Swedish University of Agricultural Sciences: Umeå, Sweden, 1981; p. 90. [Google Scholar]
© 2015 by the authors; licensee MDPI, Basel, Switzerland. This article is an open access article distributed under the terms and conditions of the Creative Commons Attribution license (http://creativecommons.org/licenses/by/4.0/).
Share and Cite
From, F.; Strengbom, J.; Nordin, A. Residual Long-Term Effects of Forest Fertilization on Tree Growth and Nitrogen Turnover in Boreal Forest. Forests 2015, 6, 1145-1156. https://doi.org/10.3390/f6041145
From F, Strengbom J, Nordin A. Residual Long-Term Effects of Forest Fertilization on Tree Growth and Nitrogen Turnover in Boreal Forest. Forests. 2015; 6(4):1145-1156. https://doi.org/10.3390/f6041145
Chicago/Turabian StyleFrom, Fredrik, Joachim Strengbom, and Annika Nordin. 2015. "Residual Long-Term Effects of Forest Fertilization on Tree Growth and Nitrogen Turnover in Boreal Forest" Forests 6, no. 4: 1145-1156. https://doi.org/10.3390/f6041145
APA StyleFrom, F., Strengbom, J., & Nordin, A. (2015). Residual Long-Term Effects of Forest Fertilization on Tree Growth and Nitrogen Turnover in Boreal Forest. Forests, 6(4), 1145-1156. https://doi.org/10.3390/f6041145