Article

A Process-Based Approach to Estimate Chinese Fir (Cunninghamia lanceolata) Distribution and Productivity in Southern China under Climate Change

1
Department of Forest Resources Management, University of British Columbia, 2424 Main Mall, Vancouver V6T 1Z4, BC, Canada
2
Department of Forest and Conservation Sciences, University of British Columbia, 2424 Main Mall, Vancouver V6T 1Z4, BC, Canada
3
Faculty of Forestry, University of British Columbia, 2424 Main Mall, Vancouver V6T 1Z4, BC, Canada
*
Author to whom correspondence should be addressed.
These authors contributed equally to this work.
Forests 2015, 6(2), 360-379; https://doi.org/10.3390/f6020360
Submission received: 14 October 2014 / Revised: 18 December 2014 / Accepted: 22 January 2015 / Published: 2 February 2015

Abstract

:
Understanding the distribution and productivity of Chinese fir (Cunninghamia lanceolata) under climate change is critical given the ecological and economic importance of the species. Recently, process-based growth models have grown in their popularity given their simplicity and data availability, and they are increasingly being used to map the distribution and productivity of tree species. In this paper, we study the extent of variation of the current range shift and the productivity of the species under a changing climate. We used the Physiological Principles in Predicting Growth (3-PG) model, which calculates the extent to which climatic variables affect photosynthesis and growth of a species. These variables were then used in a decision-tree model to develop rules to provide a basis for predicting the distribution of the species under current climatic conditions. Once the distribution model was developed the productivity of the species was then assessed. Using climate projections we then simulated the growth and distribution into the future. Results indicate a northward shift from the current range. The growth model also indicates minor increases in productivity in some of the existing distribution areas, principally in central China with limited productivity predicted in newly emerged stands. We conclude that this dual modeling approach has potential to quantify impacts of climate change on selected species and examining differences in climate projections on range and productivity estimation.

1. Introduction

Across China, plantations of Chinese fir (Cunninghamia lanceolata (Lamb.) Hook) and Masson Pine (Pinus massoniana) have been utilized for more than one thousand years [1,2,3]. As one of the most important subtropical coniferous species, Chinese fir plays a major role in the environment, timber supply, and human society. According to Lei [4], forest inventory data indicates that Chinese fir occupies 30% of all plantations in China, covering approximately 9 million ha, principally in southern China with its timber accounting for one quarter of China’s national commercial timber production [5]. Since 1949 the area of Chinese fir plantations has nearly tripled with an increased focus on afforestation and reforestation [6,7,8,9,10]. Chinese fir is a valued timber species due to its high quality wood (i.e., straight and decay resistant) as well as having significant cultural and historic values in China. Chinese fir is often used in building construction and furniture manufacturing [2] as well as in the provision of other ecosystem services including local water supply and organic matter storage [11].
Fast growing plantations also provide an opportunity for increasing terrestrial carbon stocks and therefore are suggested as an approach to efficiently mitigate the impacts of global climate change [12]. Chinese fir is characterized by its fast growth rate when grown in a monoculture plantation, producing volumes of up to 450 m3/ha after 25 years [1,2]. Therefore, a comprehensive knowledge of Chinese fir in terms of its contribution in carbon sequestration will allow a better development of plantation, afforestation, and forest management strategies in general throughout China.
Given the ecological, social, and carbon values of Chinese fir, improving our understanding and knowledge of Chinese fir growth and how a changing climate may alter the distribution is needed. This is important particularly due to its popularity as a fast growing plantation species and concerns that the volume yields and carbon storage may progressively deteriorate over multiple rotations [13,14,15]. Understanding the distribution and productivity of the species both now and into the future is critical, when linked to local management strategies, such as silvicultural practices, as it provides an estimate of the commercial value of the species, timber supply, and assessment of the other ecosystem goods and services the species provides.
Climatic factors such as temperature and precipitation strongly affect the physiology of a tree species [16,17], and as a result, changes in climate are likely to alter both the distribution and growth of the species in the future. China, like most regions globally, is undergoing climatic changes in terms of temperature, precipitation, and accordingly their seasonal and regional variations [18,19,20].
In response to climate change, four possible responses of both organisms and ecosystems are expected—first, changes in phenology and physiology of living organisms; second, changes in the distribution of species; third, changes in the community compositions and interactions among components; fourth, the arrangement and dynamics of ecosystems [21]. Once climate changes beyond the tolerances of a species, the survival and productivity of the species will be compromised. Under this changing climate regime, it is unclear whether the historic colonized distributions of certain species will remain and stay as productive as they currently are.
Modeling growth and species distributions is therefore necessary for assessing forest stands and will specifically benefit foresters in terms of scheduling harvest rotation, predicting profits, and more importantly mitigating a changing climate. Conventional statistical growth and yield approaches are often used to predict future stand growth but are based on past climate/growth relations and are therefore limited in their capacity to estimate stand growth under more variable future climate conditions. In addition, changes in future climate are likely to alter the structure of Chinese fir’s geographic distribution. Yet, to model species distribution often requires sophisticated algorithms and detailed parametrization.
In this paper we assessed the impact of changing climate on Chinese fir by applying a simple process-based model in two phases. First, we input species’ parameters and climate projections into a simple physiological model driven with monthly climate data to derive the environmental constraints on the species range. Second, we employed the constraints generated in the first phase to predict the productivity and distribution of the species. Both current and future climate projections were modeled in this study for further analysis and comparisons.
With this research we build on the work of Liu et al. (2014) [22] who recently used a PnET modeling approach to access both productivity (i.e., NPP) and distribution changes in Chinese fir across southern China under different climate change projections. We advance knowledge in two key ways: First by applying a hybrid physiological model, with which we can, in detail, assess the main climatic restrictions to growth of the species across its entire range, which is important for assessing the future impacts of climate change. Second, utilizing a hybrid model, which allows the prediction of variables of key interest to forest managers, such as stand volume and basal area—the growth potential of future forest plantations can be spatially and temporally assessed.

2. Experimental Section
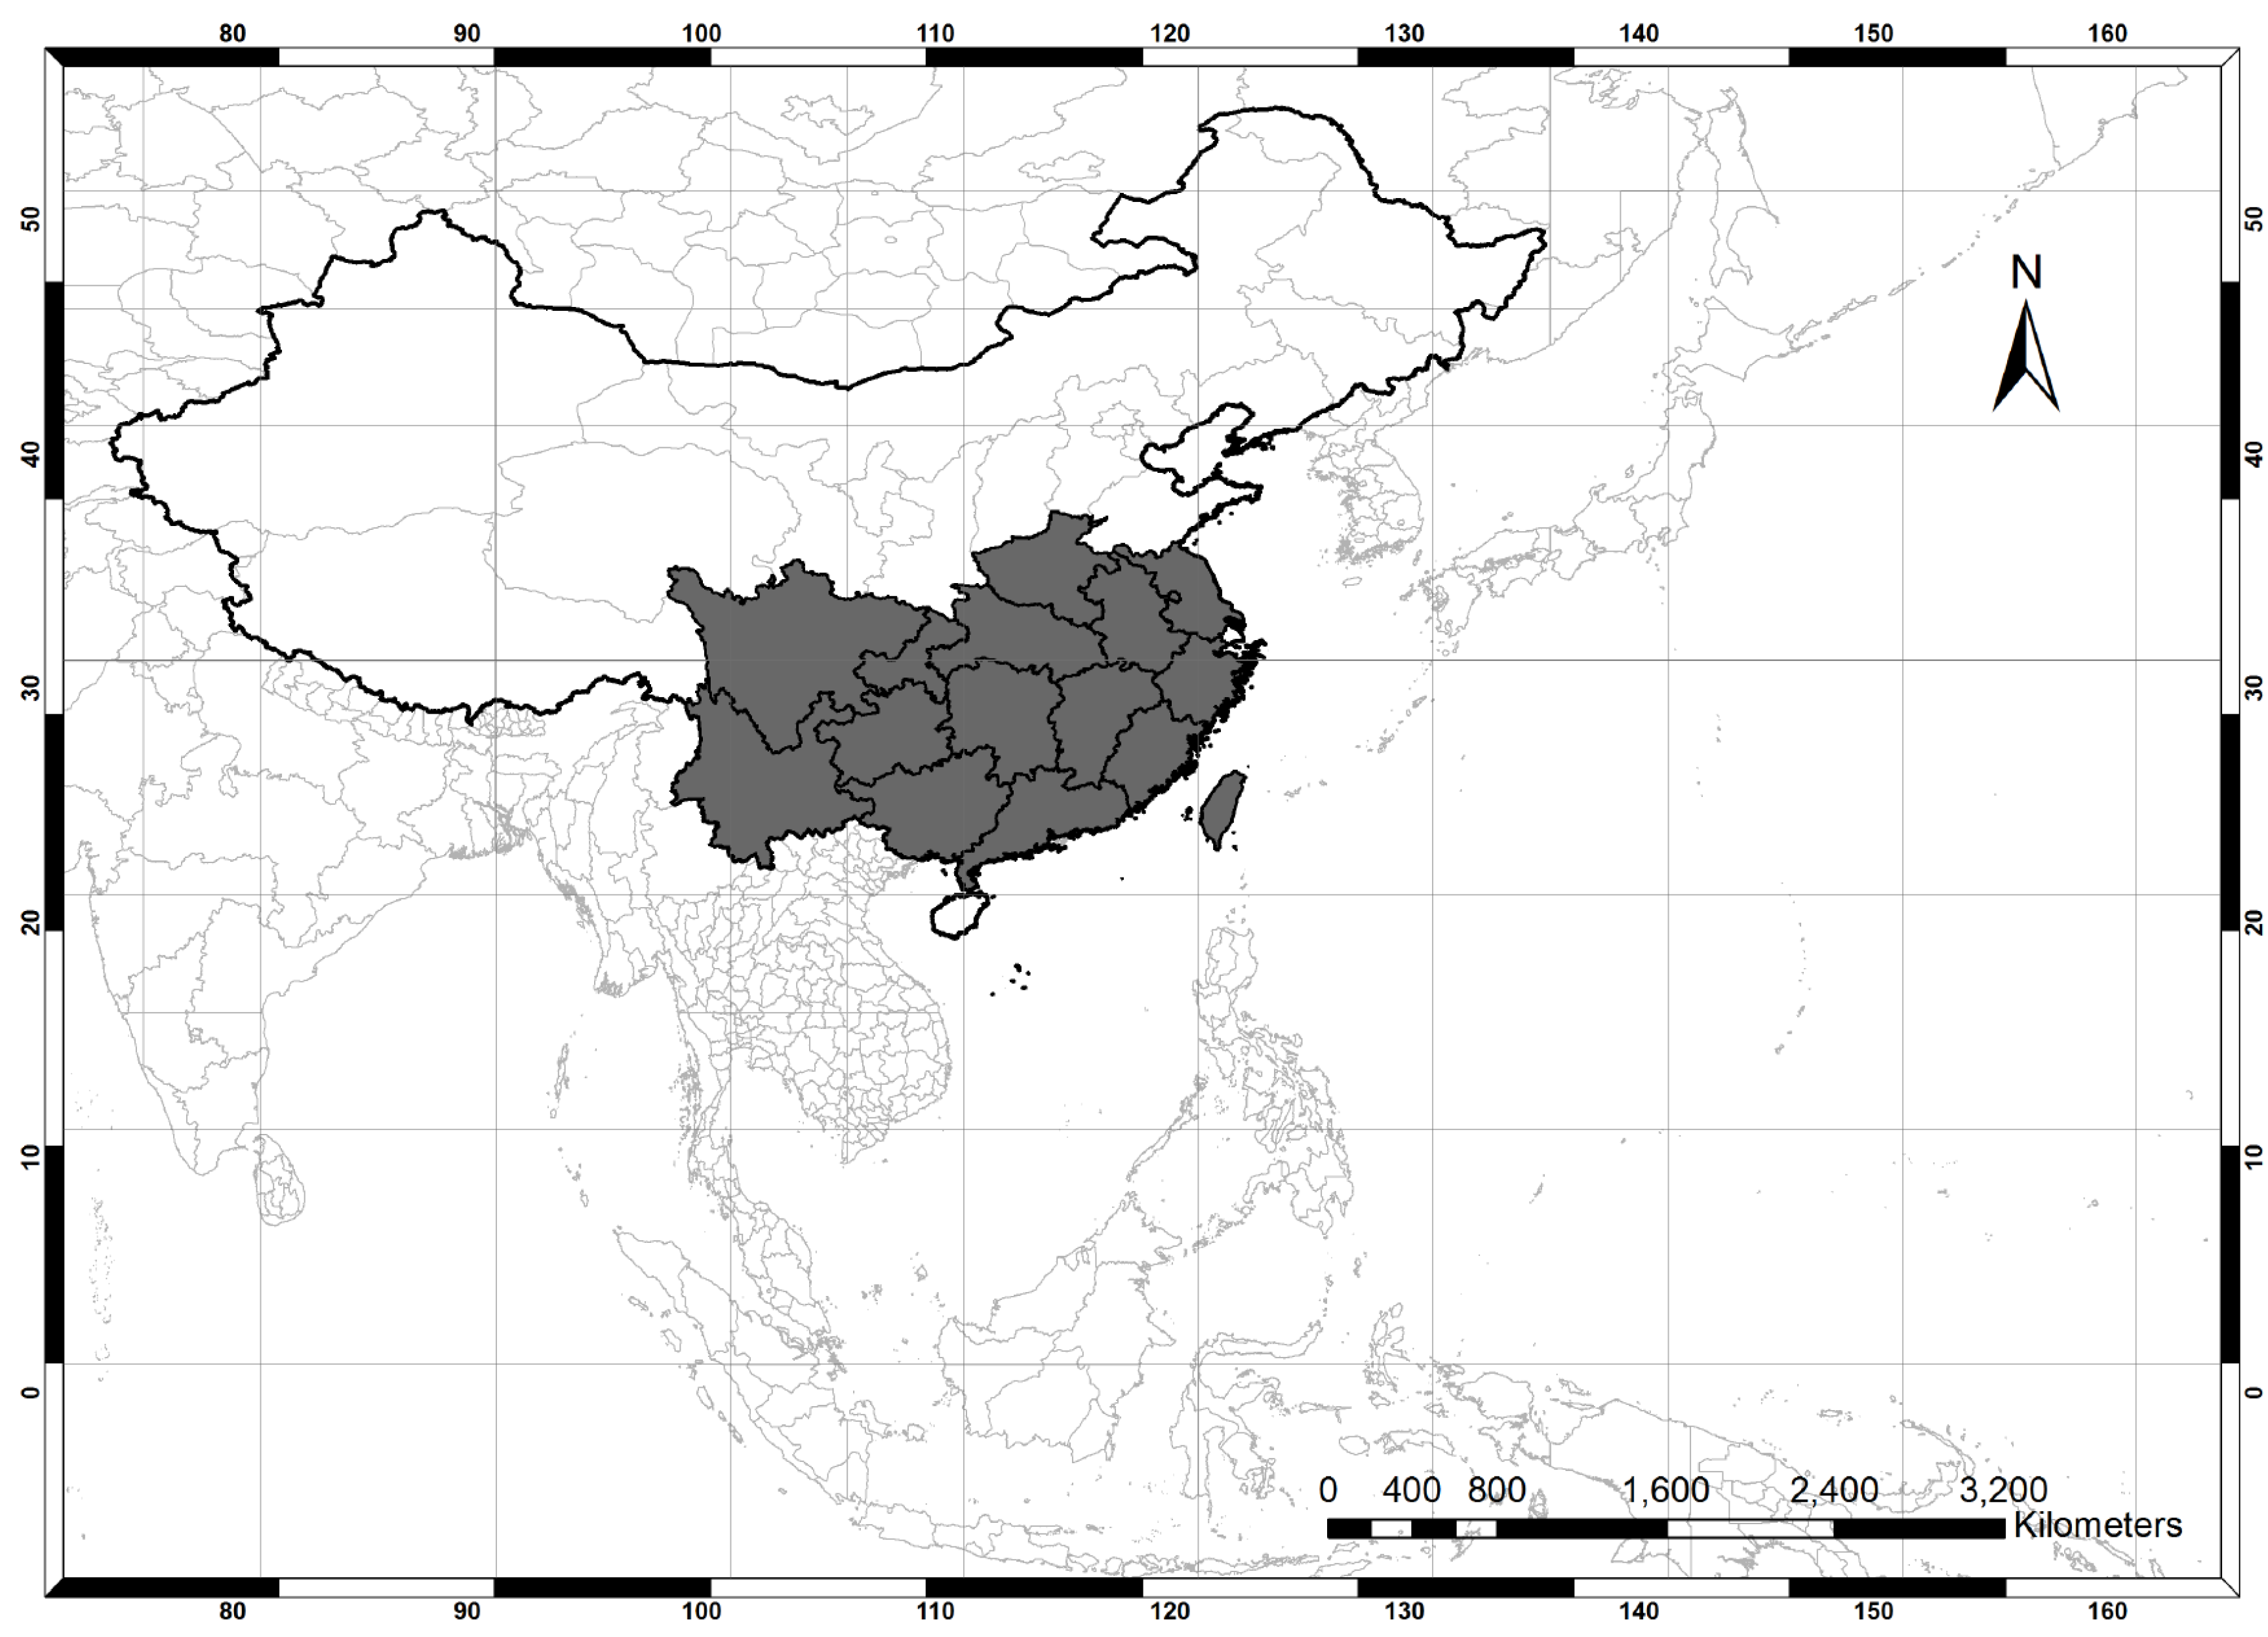
2.1. Study Area

Our research is focused on southern, sub-tropic region of China (Figure 1) where the current distribution of Chinese fir extends from the pacific coast of Fujian, Zhejiang in the east, to the south coast of Guangdong and Guangxi, to the west of Yunnan, Sichuan, to the north of Shanxi and Henan Provinces. The elevation ranges from 800 m above sea level in the Southeast to 2500 m in the southwest. The annual mean temperature ranges from 15 °C–20 °C and the mean temperature in January of 1 °C–2 °C. However it is sensitive to lack of humidity and requires annual precipitation around 800–2000 mm. The best suitable microclimate normally ranges between monthly 16 °C–19 °C and the annual precipitation around 1300–1800 mm [2]. Chinese fir requires deep fertile well-drained-acidic soil with a pH value around 4.5–6.5, but can also grow on slightly alkaline soil [2].
Figure 1. Study area—Provinces with present natural distribution of Chinese fir.
Forests 06 00360 g001

2.2. Climate Data

ClimateAP [23] was used to generate climate data across the region. ClimateAP is a climate data downscaling tool developed for the Asia Pacific region, which extracts and downscales PRISM [24] and WorldClim [25] 1961–1990 monthly normal data (2.5 × 2.5 arc minute, approximately 4 × 4 km) to produce seasonal and annual climate variables for specific locations (scale-free) based on latitude, longitude, and elevation. The output of the program includes both directly calculated and derived climate variables. We used climate normals (30 year averages) of monthly data for the period between 1961 and 1990 to represent the reference or current climate conditions (i.e., baseline), which are commonly used in climate niche modeling and is common practice in the literature. Often, selection of the baseline period has been limited by availability of desired climate data [26]. For this study, we generated climate data at 1 km spatial resolution for the reference normal period 1961–1990 (current) and climate data for 2020s (2011–2040) using the Coupled Global Climate Model 3 (CGCM3) from the Canadian Centre for Climate Modelling and Analysis with two future projections A1B and A2. The A1B represents a moderate projection assuming a fast growth in global population and economy and a rapid adoption of new technologies in mitigating climate change. A2 is a severe projection assuming fast population and economic growth, while the adoption of new technologies in climate change mitigation is limited.
A step change approach was used where we modeled the distribution and productivity using the climate normals for the current period and the predicted 2020 normals for the future projections.

2.3. Chinese Fir Presence Data

Presence observations for Chinese fir were obtained from the digital version of Vegetation Map of China (1:1000,000) provided by “Environmental & Ecological Science Data Center for West China, National Natural Science Foundation of China”(link: http://westdc.westgis.ac.cn). The shape file of the distribution map was rasterized at the spatial resolution of 0.00833 arc minute (approximately 1 km). Each data point within polygons of presence was then assigned a presence of Chinese fir.

2.4. 3-PG Model Description

The 3-PG model (Physiological Principles in Predicting Growth) [27] is a simplified process-based, single species, stand growth model. 3-PG calculates gross primary productions (GPP) using utilizable, absorbed photosynthetically active radiation and canopy quantum efficiency. It is a relatively simplified model, which applies well-established physiological relationships and proven constants [27,28]. The calculation of respiration is not necessary by 3-PG model; instead, the model uses the ratio of net to gross primary production (NPP/GPP) [27]. Given its simplicity, 3-PG is more accessible to local forest managers than other research models, which often depend upon complicated physiological principles. Compared to other simplified models that produce total carbon fixed and biomass, 3-PG also yields tree mass along with allocation to stem, foliage, and roots based on allocation equations [27]. This makes the 3-PG model more practical when distributions of biomass and tree growth constraints become a major concern to foresters.
Similar to other models, 3-PG requires a range of inputs which can be summarized into three categories—climate data, species parameters (listed in Table 1), and site variables. Climate data are provided in monthly time steps and include total short wave radiation, mean precipitation, number of frost days, and minimum and maximum temperatures [27]. Information about soil depth, available soil water (ASW), initial stocking and stand age and individual species parameters are also required [29]. These site variables and species parameters can be derived from the literature and field measurements [30]. 3-PG utilizes climate modifiers which are dimensionless numbers ranging from 0 to 1, representing the extent to which a climatic factor can constrain photosynthesis by high daytime vapor pressure deficits (VPD), soil water deficits, and extreme minimum/maximum temperatures [27]. The 3-PG model estimates the site productivity and climatic modifiers for a given species at a stand level. Site productivity is expressed at either annual or monthly time steps and includes stand density (TPH), leaf area index (LAI), mean annual increment (MAI), mean diameter at breast height (DBH, also known as DOB1.3), stand volume, and basal area (BA). For this study, species parameters for Chinese fir are shown in Table 1. They were derived as noted by [2,31,32]. One of the key benefits of the 3-PG model is that it is a physiological model driven by key physiological parameters. As a result, parameters do not need to be empirically fitted every time. We note that we have undertaken this approach successfully in a number of previous papers [28,29,30,33,34].
Table 1. Physiological Principles in Predicting Growth (3-PG) Parameters of Chinese fir.
Meaning/CommentsNameUnitValueSource
Allometric relationships & partitioning
Foliage: Stem partitioning ratio @ D = 2 cmpFS20.72This study
Foliage: Stem partitioning ratio @ D = 20 cmpFS200.38This study
Constant in the stem mass v. diameter. relationshipaS0.0118[32]
Power in the stem mass v. diameter. relationshipnS3.223[32]
Maximum fraction of net primary production (NPP) to rootspRx0.6[32]
Minimum fraction of NPP to rootspRn0.2[32]
Litterfall & root turnover
Maximum litterfall rategammaFx1/month0.0485[32]
Litterfall rate at t = 0gammaF01/month0.001[32]
Age at which litterfall rate has median valuetgammaFmonths23This study
Average monthly root turnover rategammaR1/month0.02[32]
Temperature modifier (fT)
Minimum temperature for growthTmindegree °C0[32]
Optimum temperature for growthToptdegree °C17.5[32]
Maximum temperature for growthTmaxdegree °C40[32]
Frost modifier (fFRost)
Days production lost per frost daykFdays1.0[32]
Soil water modifier (fSW)
Moisture ratio deficit for fq = 0.5SWconst0.6This study
Power of moisture ratio deficitSWpower7This study
Fertitlity effects
Value of “m” when FR = 0m00Default
Value of “fNutr” when FR = 0fN00.4This study
Power of (1-FR) in “fNutr”fNn1This study
Age modifier (fAge)
Maximum stand age used in age modifierMaxAgeyears150This study
Power of relative age in function for fAgenAge4Default
Relative age to give fAge = 0.5rAge0.95Default
Stem mortality & self-thinning
Max. stem mass per tree @ 1000 trees/hectarewSx1000kg/tree175This study
Power in self-thinning rulethinPower1.3This study
Specific leaf area
Specific leaf area at age 0SLA0m2/kg8This study
Specific leaf area for mature leavesSLA1m2/kg4This study
Age at which specific leaf area = (SLA0+SLA1)/2tSLAyears3[32]
Light interception
Extinction coefficient for absorption of PAR by canopyK0.5Default
Age at canopy coverfullCanAgeyears3[32]
Maximum proportion of rainfall evaporated from canopyMaxIntcptn0.033This study
LAI for maximum rainfall interceptionLAImaxIntcptn5This study
Production and respiration
Canopy quantum efficiencyalphamolC/molPAR0.033[32]
Ratio NPP/GPPY0.5[32]
Conductance
Maximum canopy conductanceMaxCondm/s0.02[32]
LAI for maximum canopy conductanceLAIgcx3This study
Defines stomatal response to VPDCoeffCond1/mBar0.05Default
Canopy boundary layer conductanceBLcondm/s0.2This study
Basic Density
Minimum basic density—For young treesrhoMint/m30.3This study
Maximum basic density—For older treesrhoMaxt/m30.37This study

2.5. Model Runs

The 3-PG model was applied in two phases: First to obtain the current and future species distribution and secondly to estimate the productivity including stand volume (m3/ha), and NPP (MgC/ha/year) of the species in areas where it is predicted to currently occur and to occur under the applied climate projections.

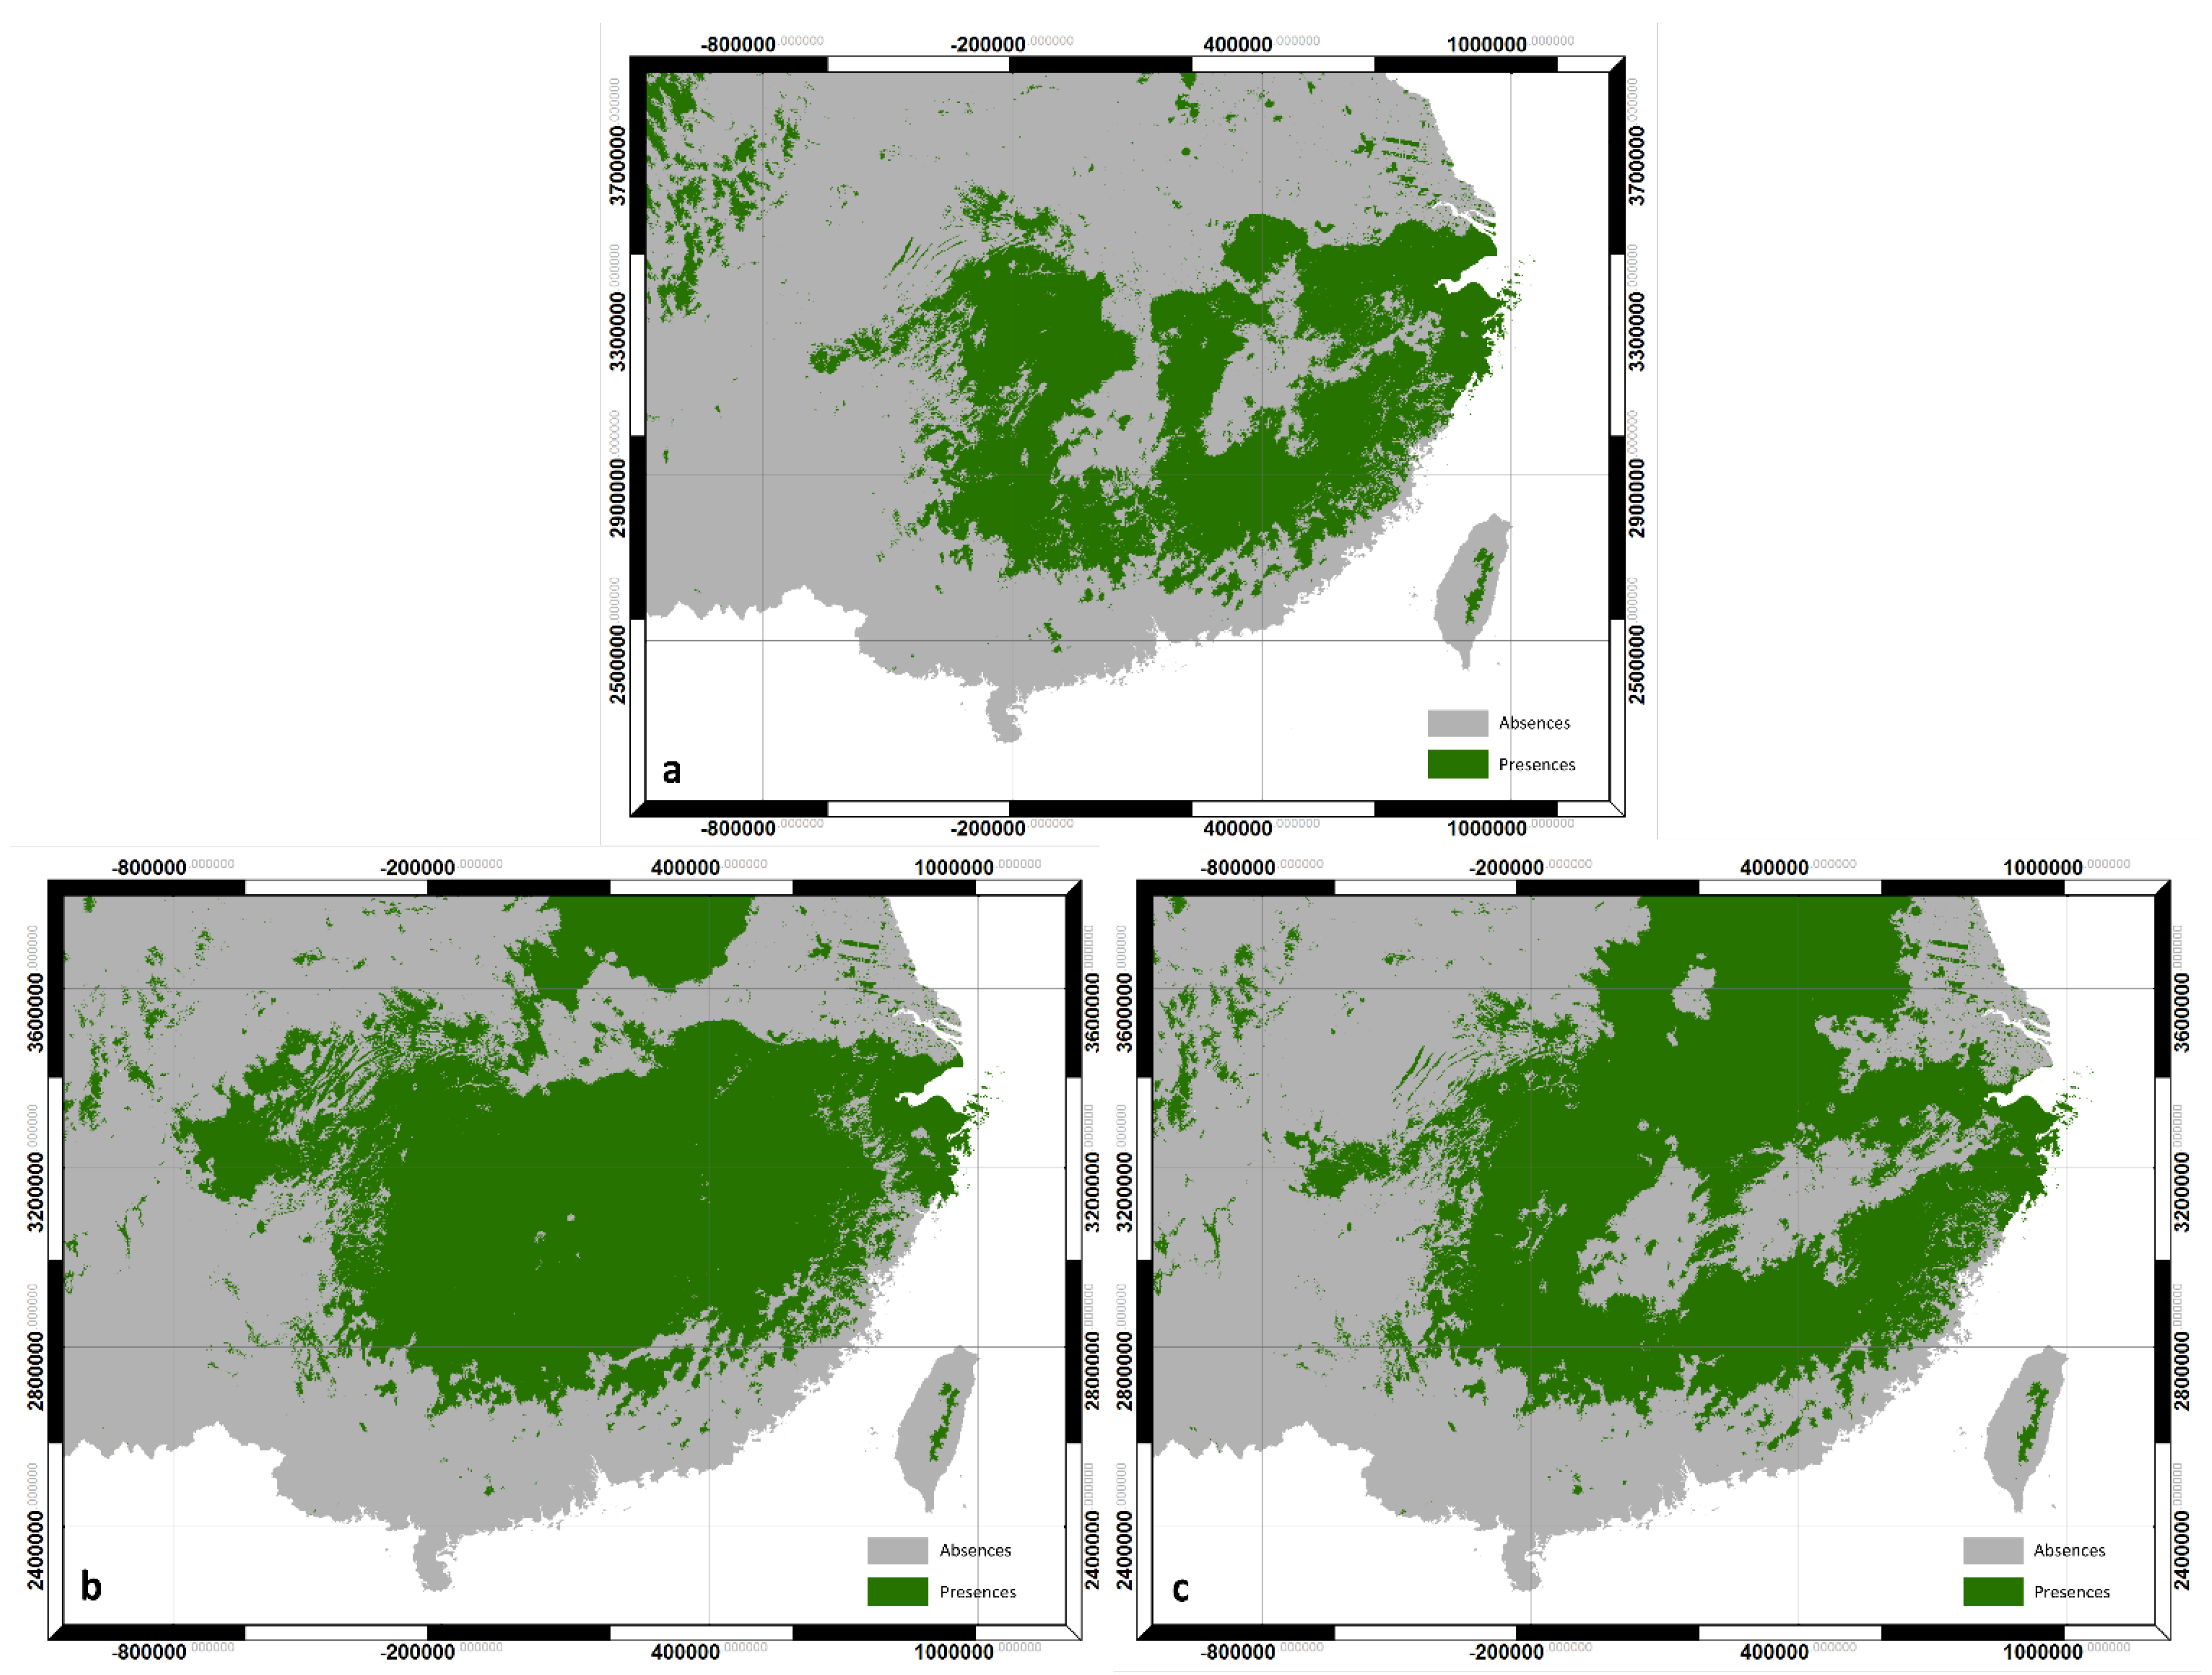
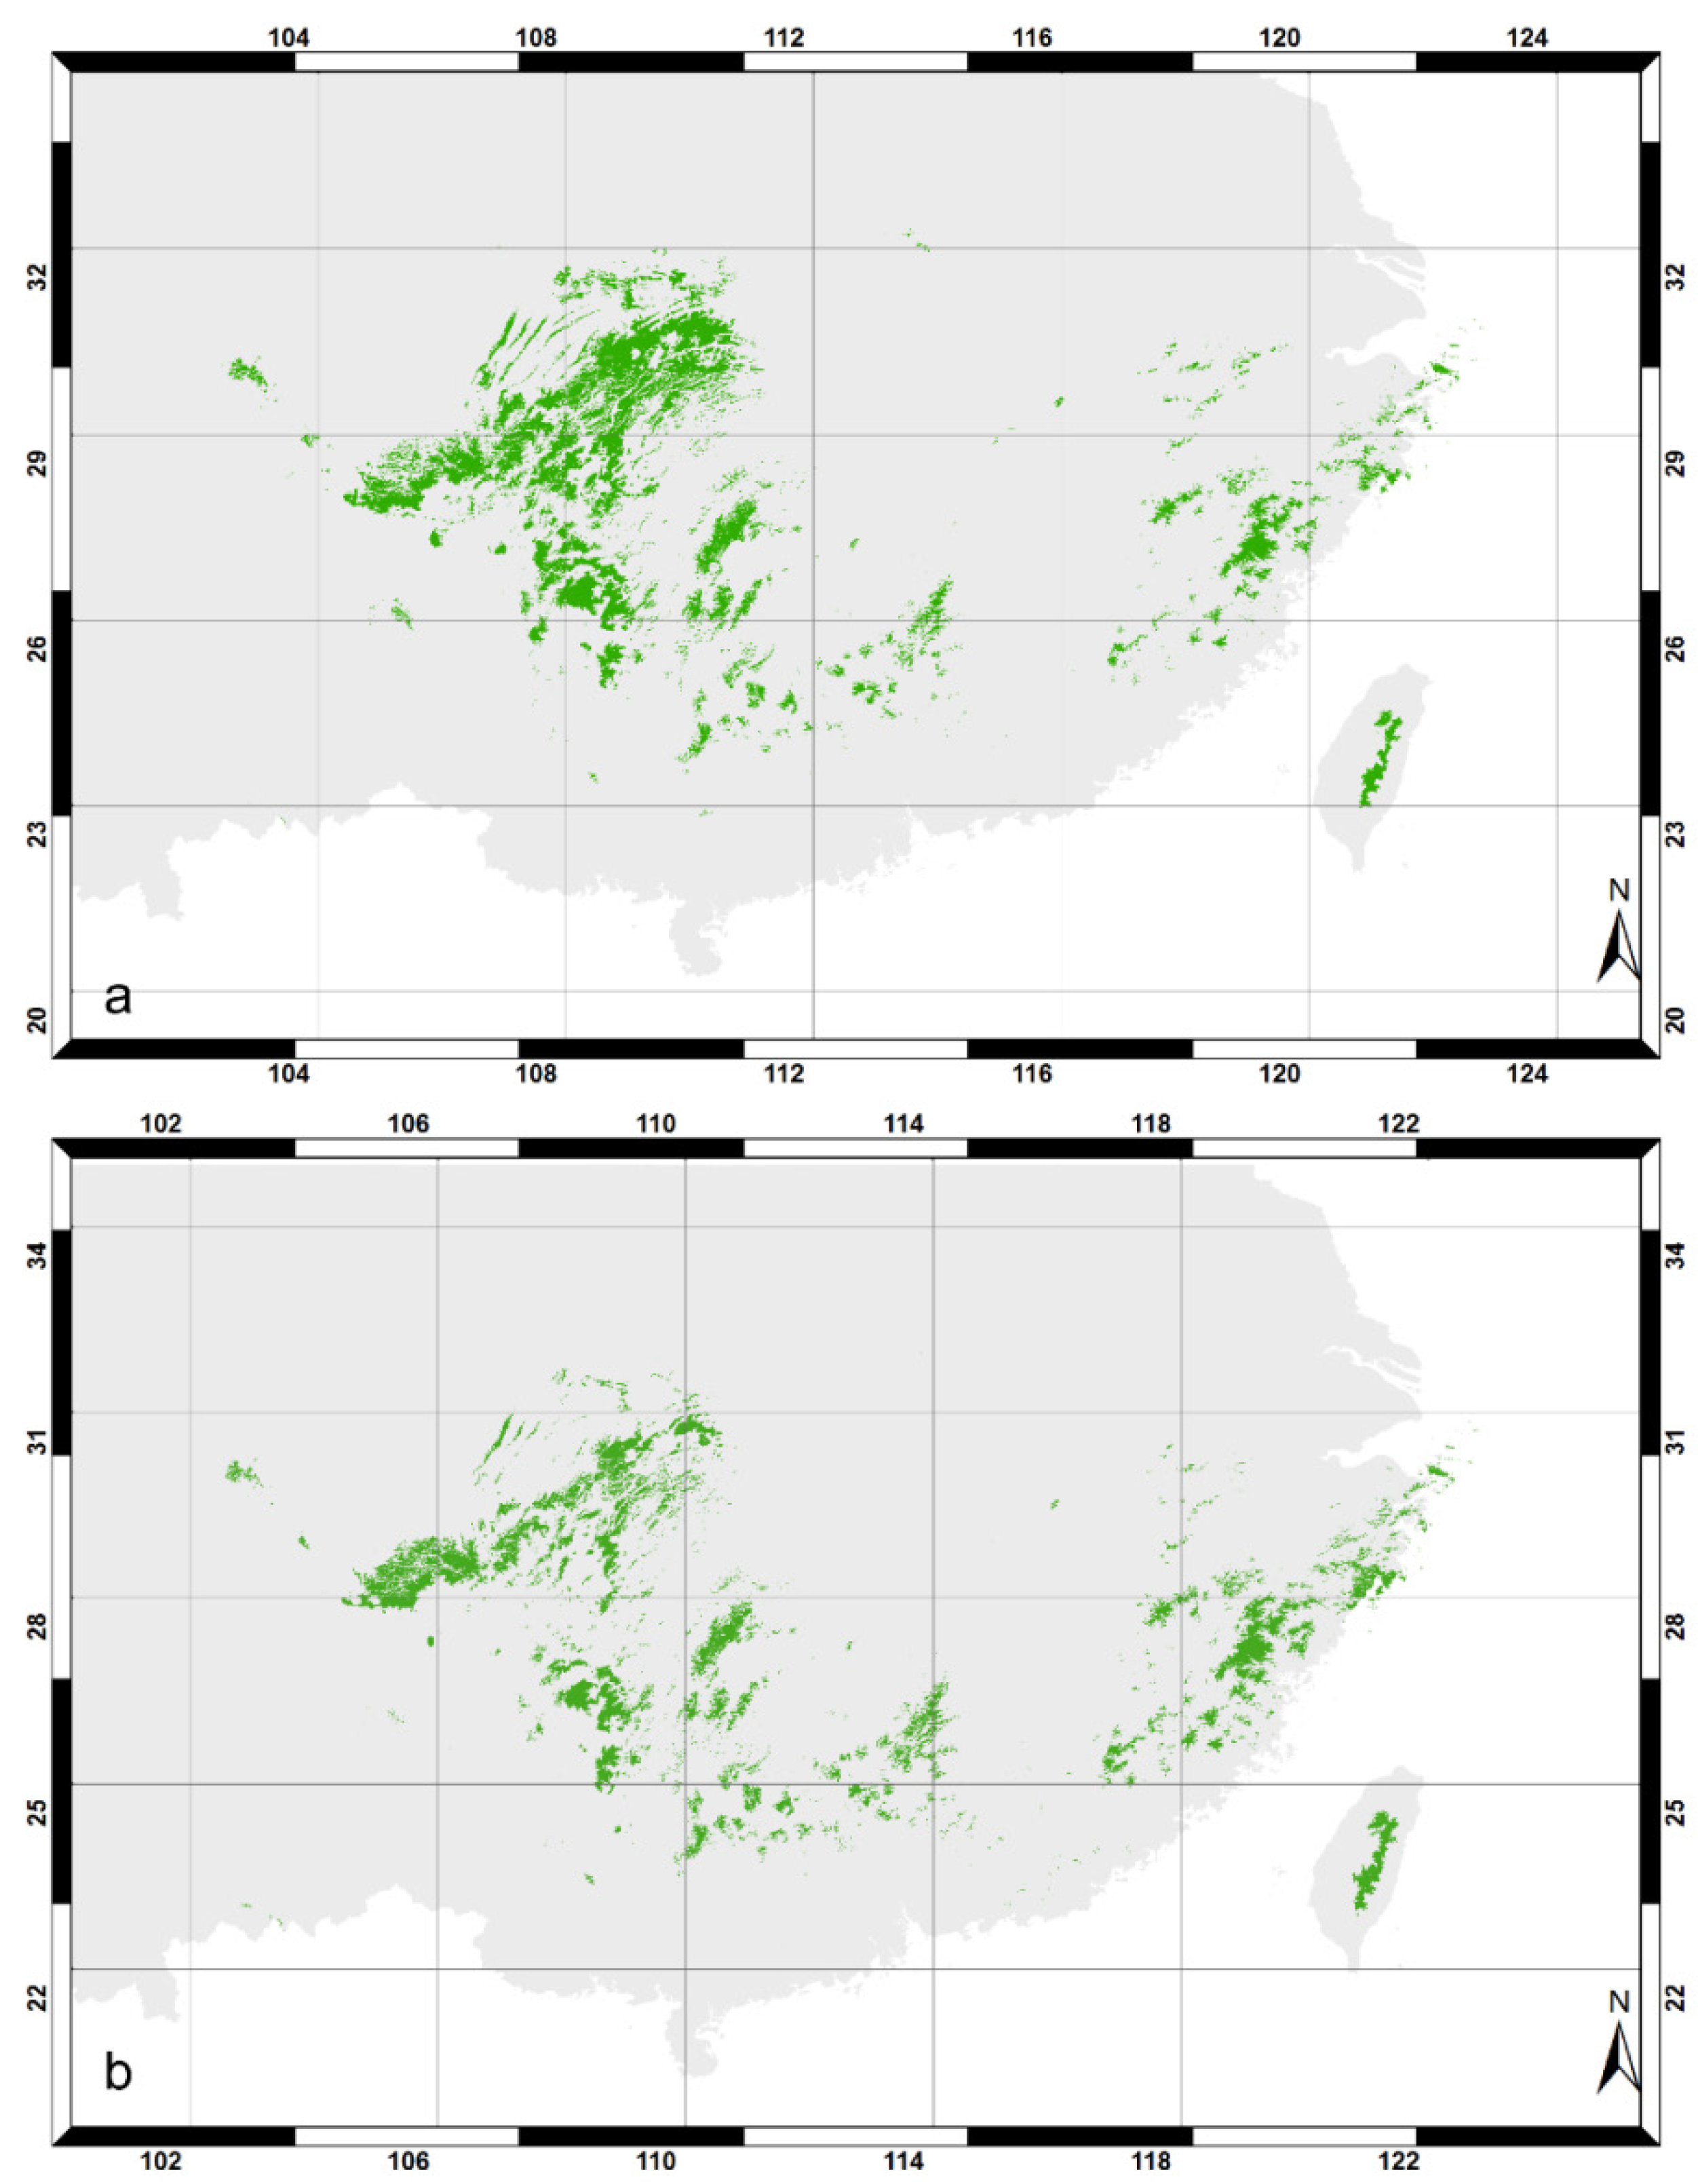
2.5.1. Distribution Modeling

To simulate the distribution of the species the 3-PG model was run for 20 years using the current, climate, and a second and third run completed using the modeled climate normals for the 2020s (2011–2040) using the A1 and A1B climate projections to reach maximum LAI and canopy closure. The simulations were then stopped and the four monthly modifiers were extracted. The degree that available soil water, suboptimal temperature, frost, and VPD restricted photosynthesis was then determined for winter (December–February), spring (March–May), summer (June–August) and fall (September–November), as well as annually.
A decision-tree analysis was then applied to assess the extent to which the 3-PG modifiers could predict the distribution of Chinese fir. This type of analysis is increasingly common for ecological research, as decision tree approaches are not dependent on the assumption of normally distributed data and are well-suited to dealing with collinear and categorical datasets [28,35,36,37]. Decision tree approaches automatically separate the dependent variables (presence or absence of the species) into a series of choices that not only identifies the importance of each constraining variable, but also establishes thresholds that best separate one species from another [28]. The decision-tree analysis was undertaken with a 10-fold cross validation technique, similar to a “jackknifing” procedure, which starts by using all available data (the reference tree). The total dataset is partitioned randomly into 10 equally sized groups (or folds). One set is held in reserve, while the other nine are pooled and a model is generated. The accuracy of the model is assessed using the remaining 10% of the data not used in model development. This process is then repeated ten times, resulting in ten different test trees and ten different accuracy assessments. The decision rules of the ten models are then merged to produce a final decision tree with an overall accuracy assessed by averaging the independent results of the ten simulations [38].
Presence-only data were used to train the decision tree model using an approach adapted from [39], who undertook a detailed review of methods to predict species distributions from presence only data and proposed approaches which were then assessed against actual presence/absence data. Following this approach we first generated a number of random “pseudo” absences matching the number of presences. These points were randomly located through the region however they had to be at least 1 km away from existing presences. An initial decision tree was then used to predict likely absences using the modifiers generated by the 3-PG model. Random “pseudo” absences which had a less than or equal to 30% probability of being a “true” absence were removed from the absence list. A second and final decision model was then developed using the filtered “pseudo” absences along with the presences to predict the current Chinese fir distribution. To predict the future distribution under climate projections A1B and A2 we applied to the same decision rules.

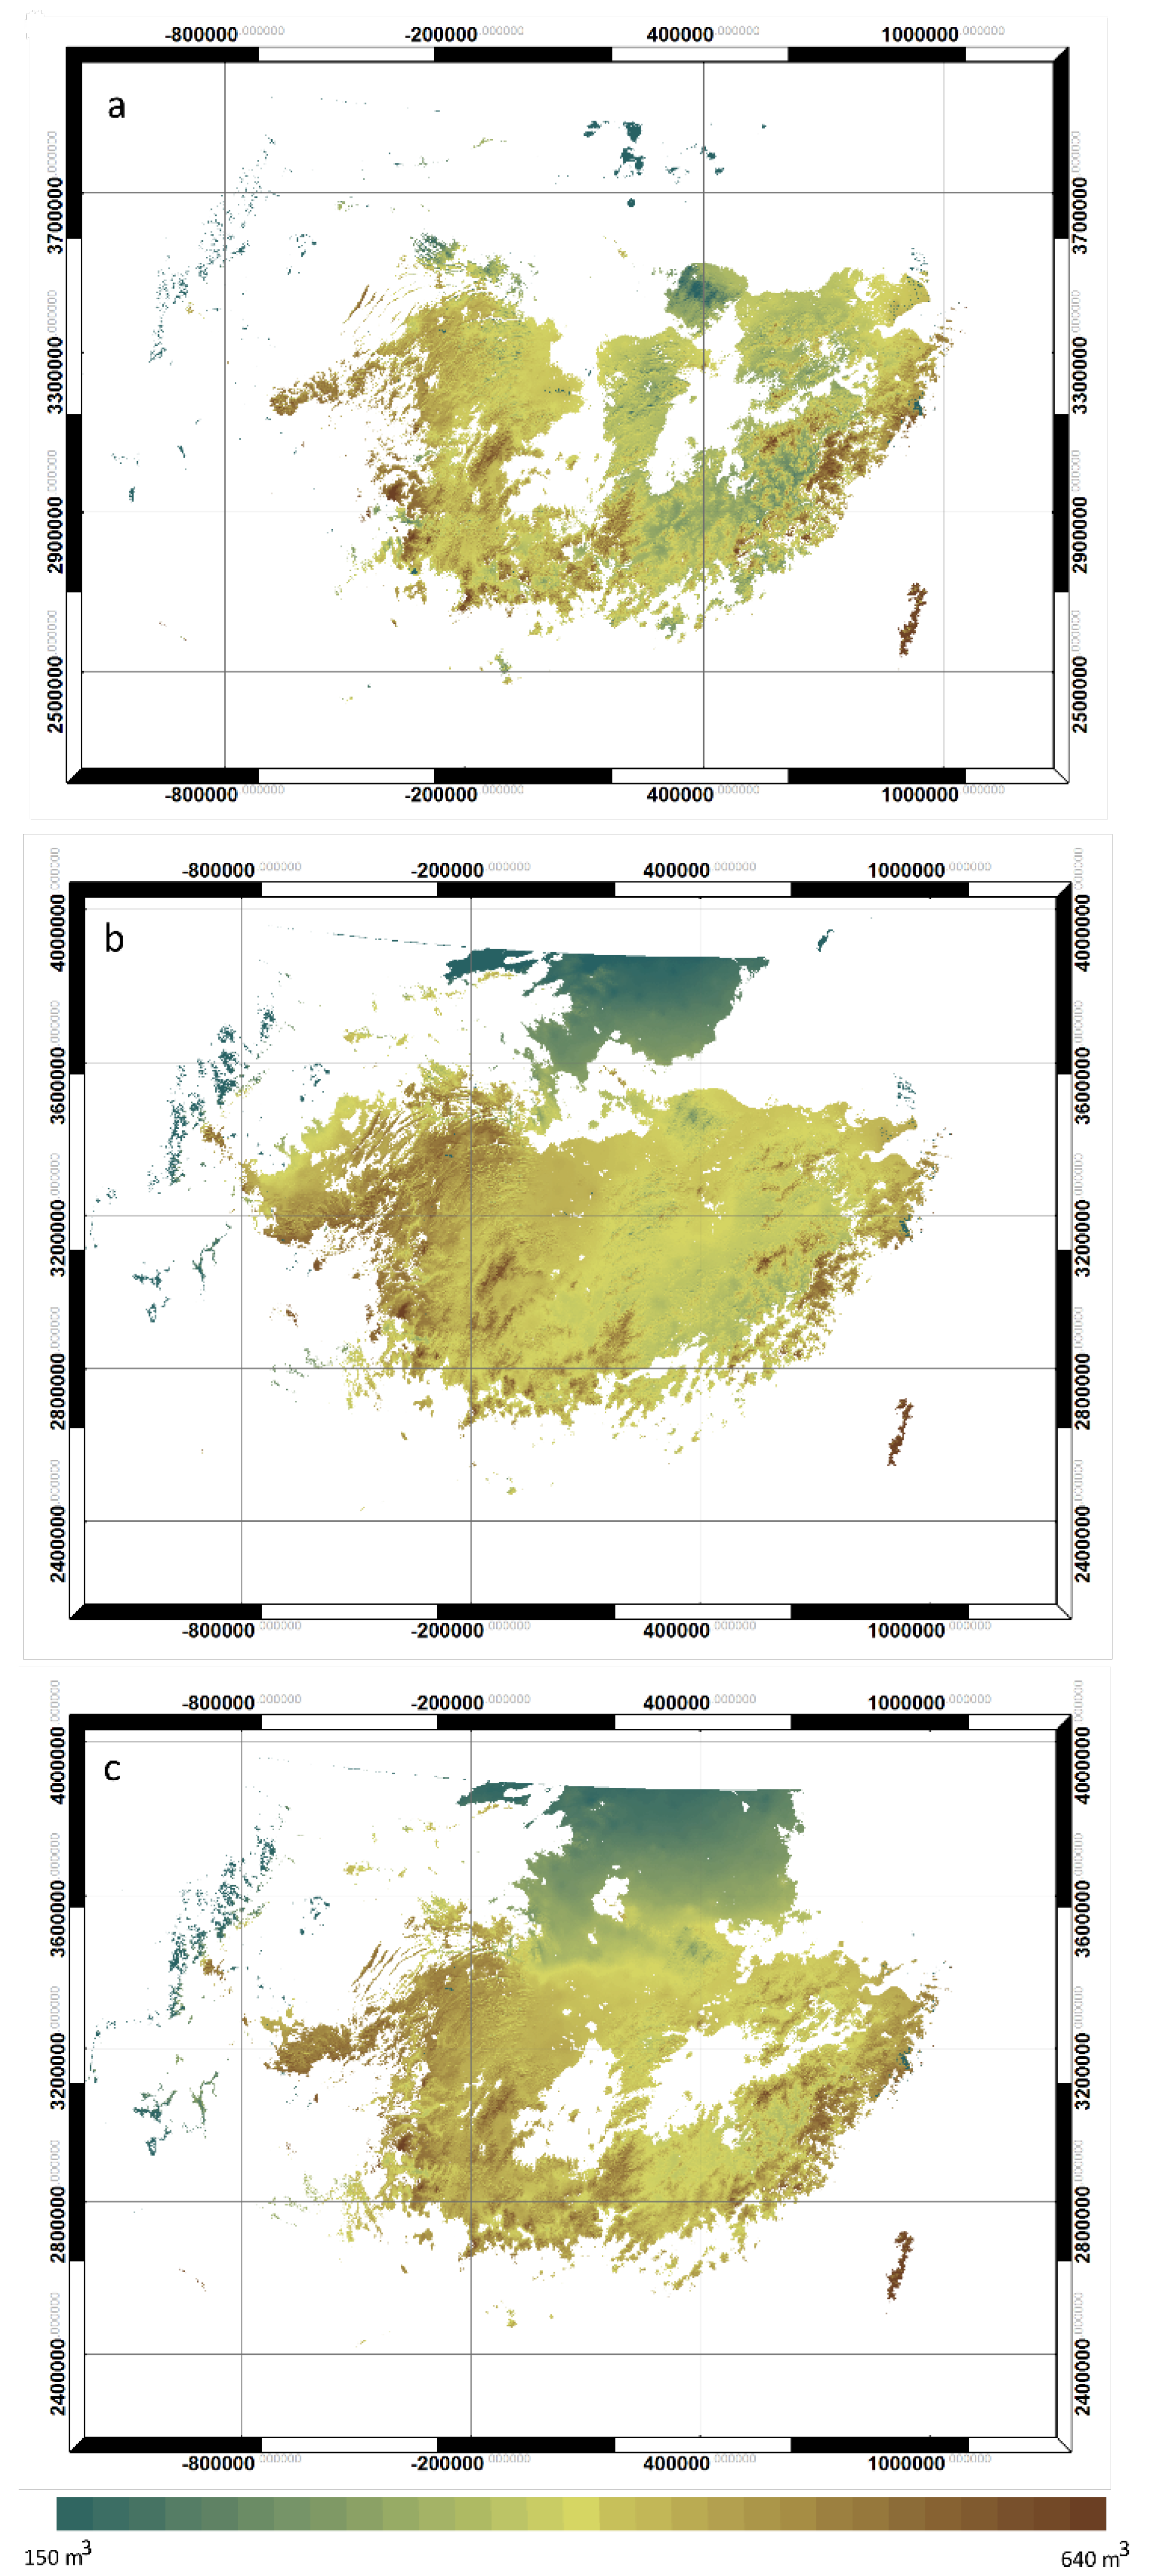
2.5.2. Productivity Modeling

To predict the productivity of the species, 3-PG was again run for a period of 20 years. Predictions of stand volume and NPP were then extracted and analyzed. The species distribution models generated in the previous phase were then applied as masks to clip model predictions to locations where Chinese fir was predicted to be present. A threshold of 450 m3/ha was then used to extract and calculate the total area of predicted present sites that have an equal or greater volume than the pre-set threshold value.

3. Results and Discussion

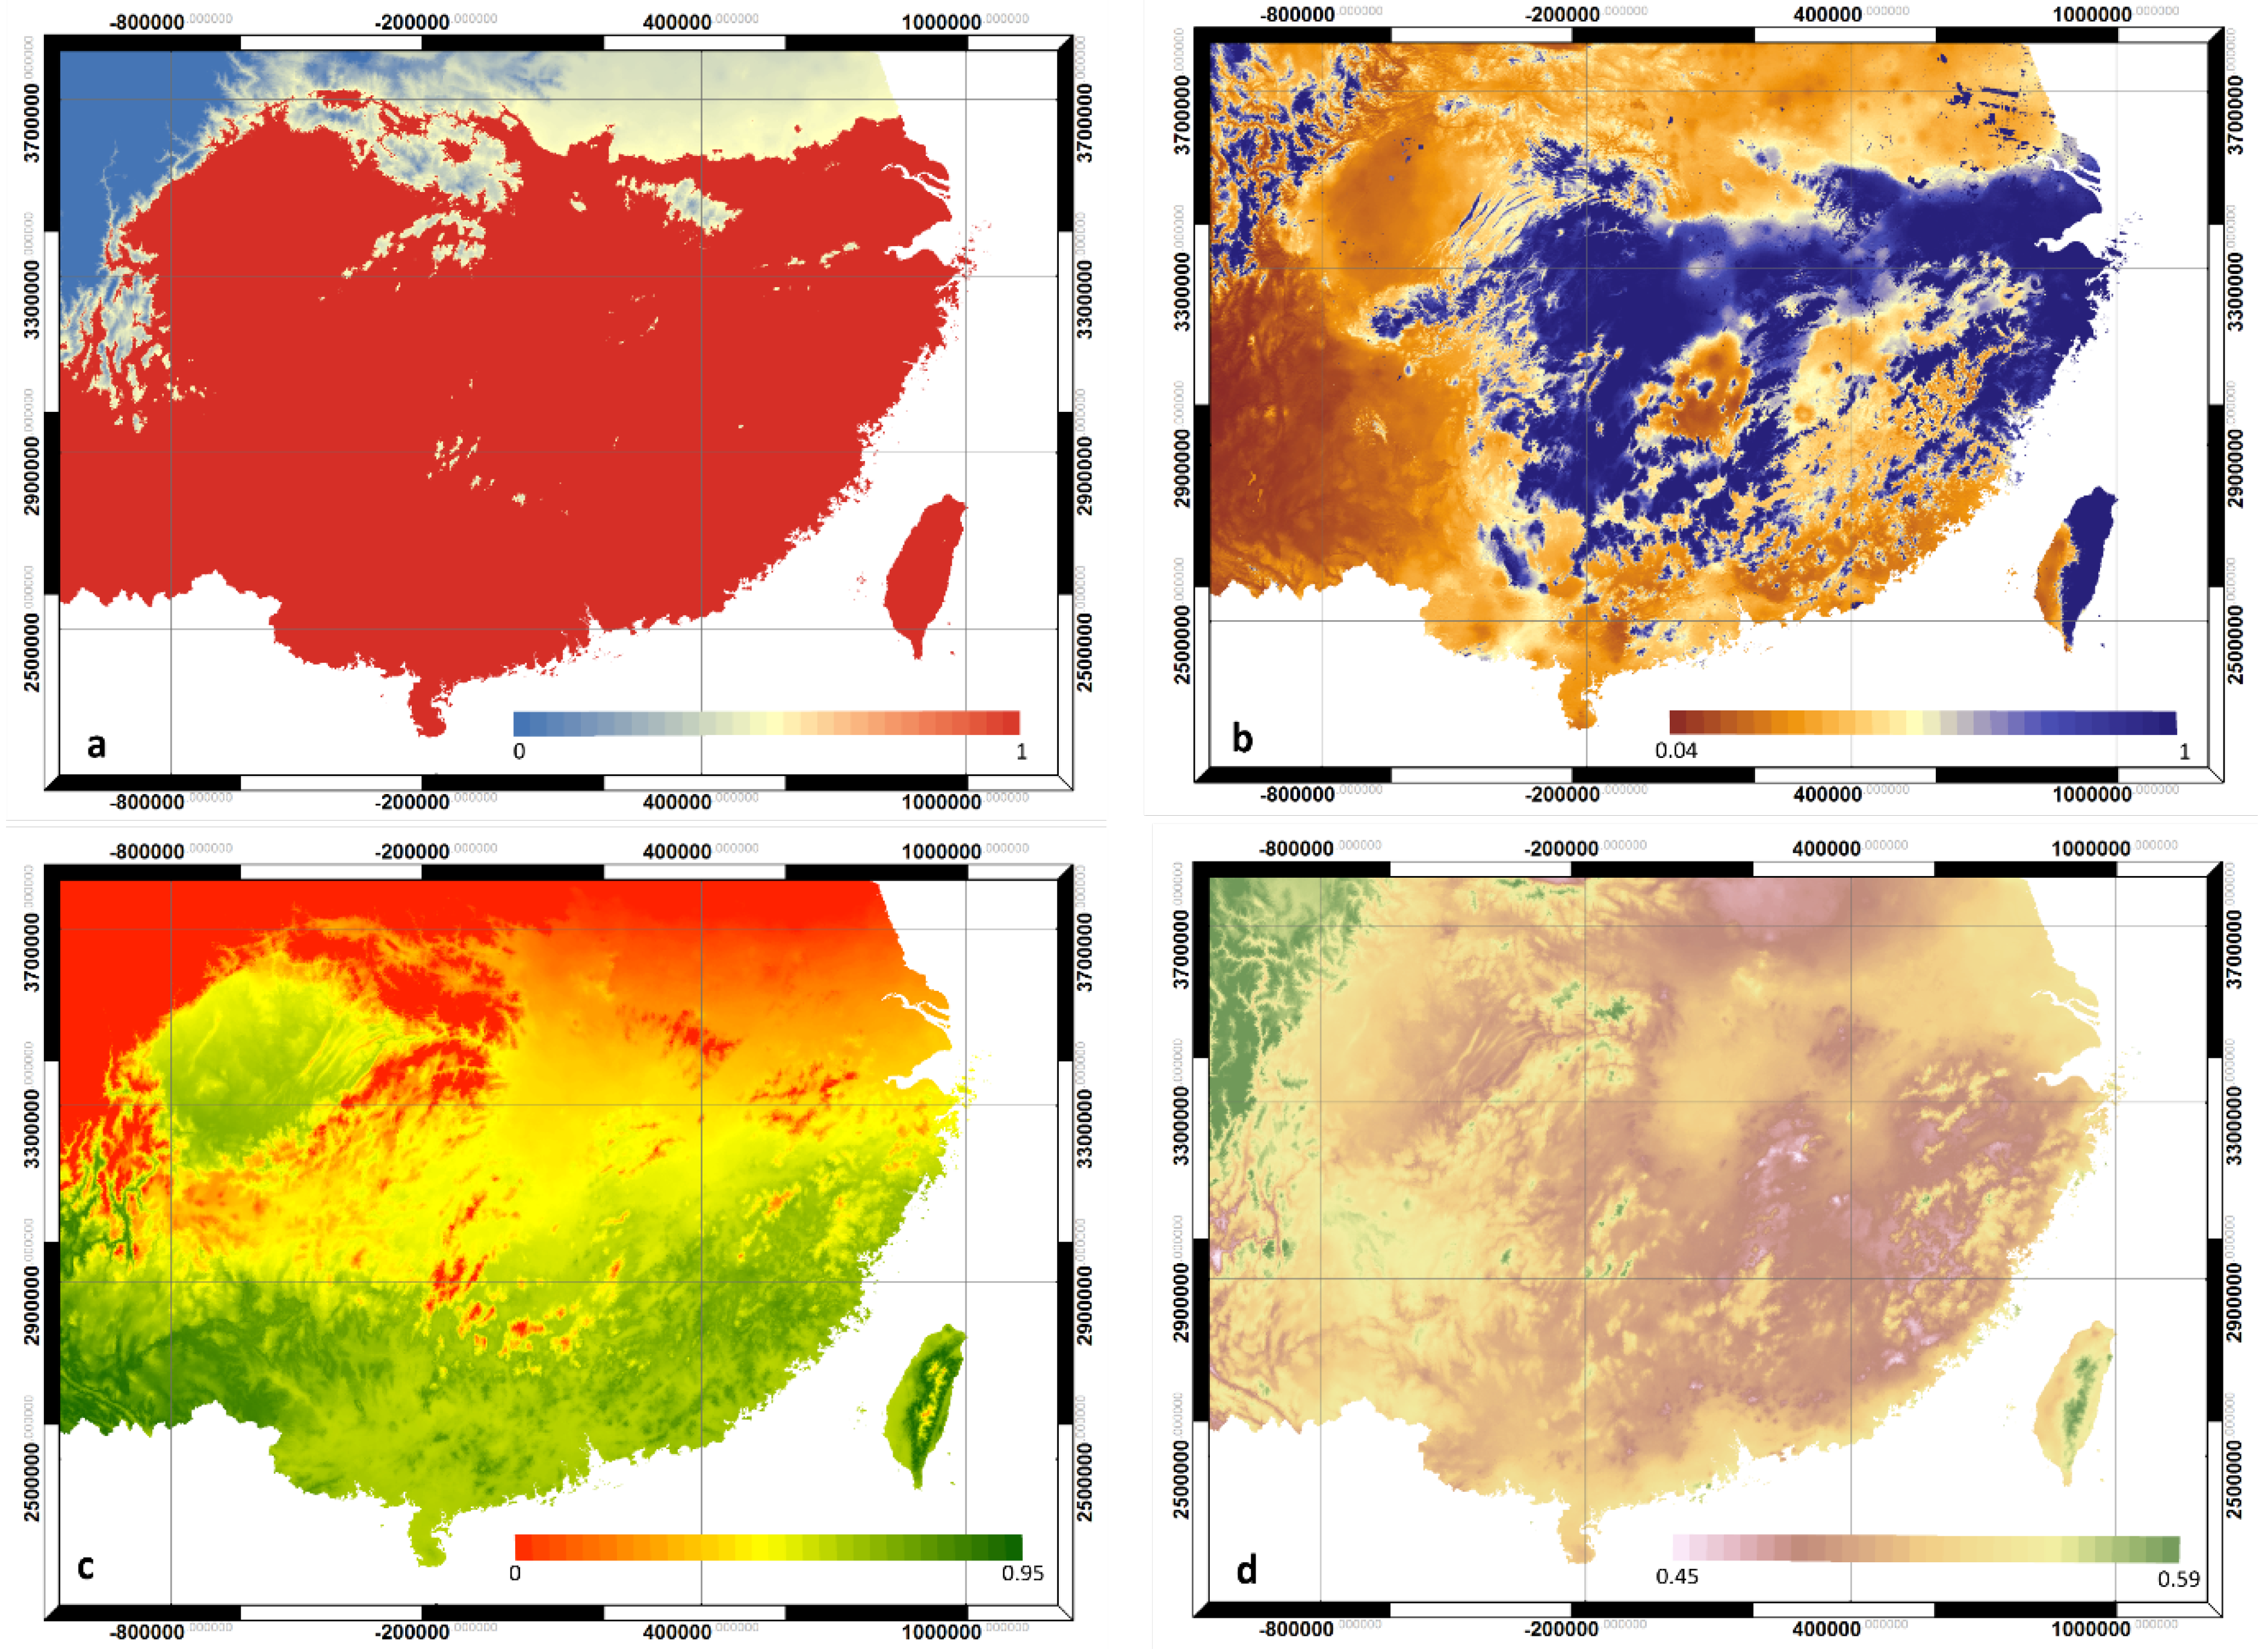
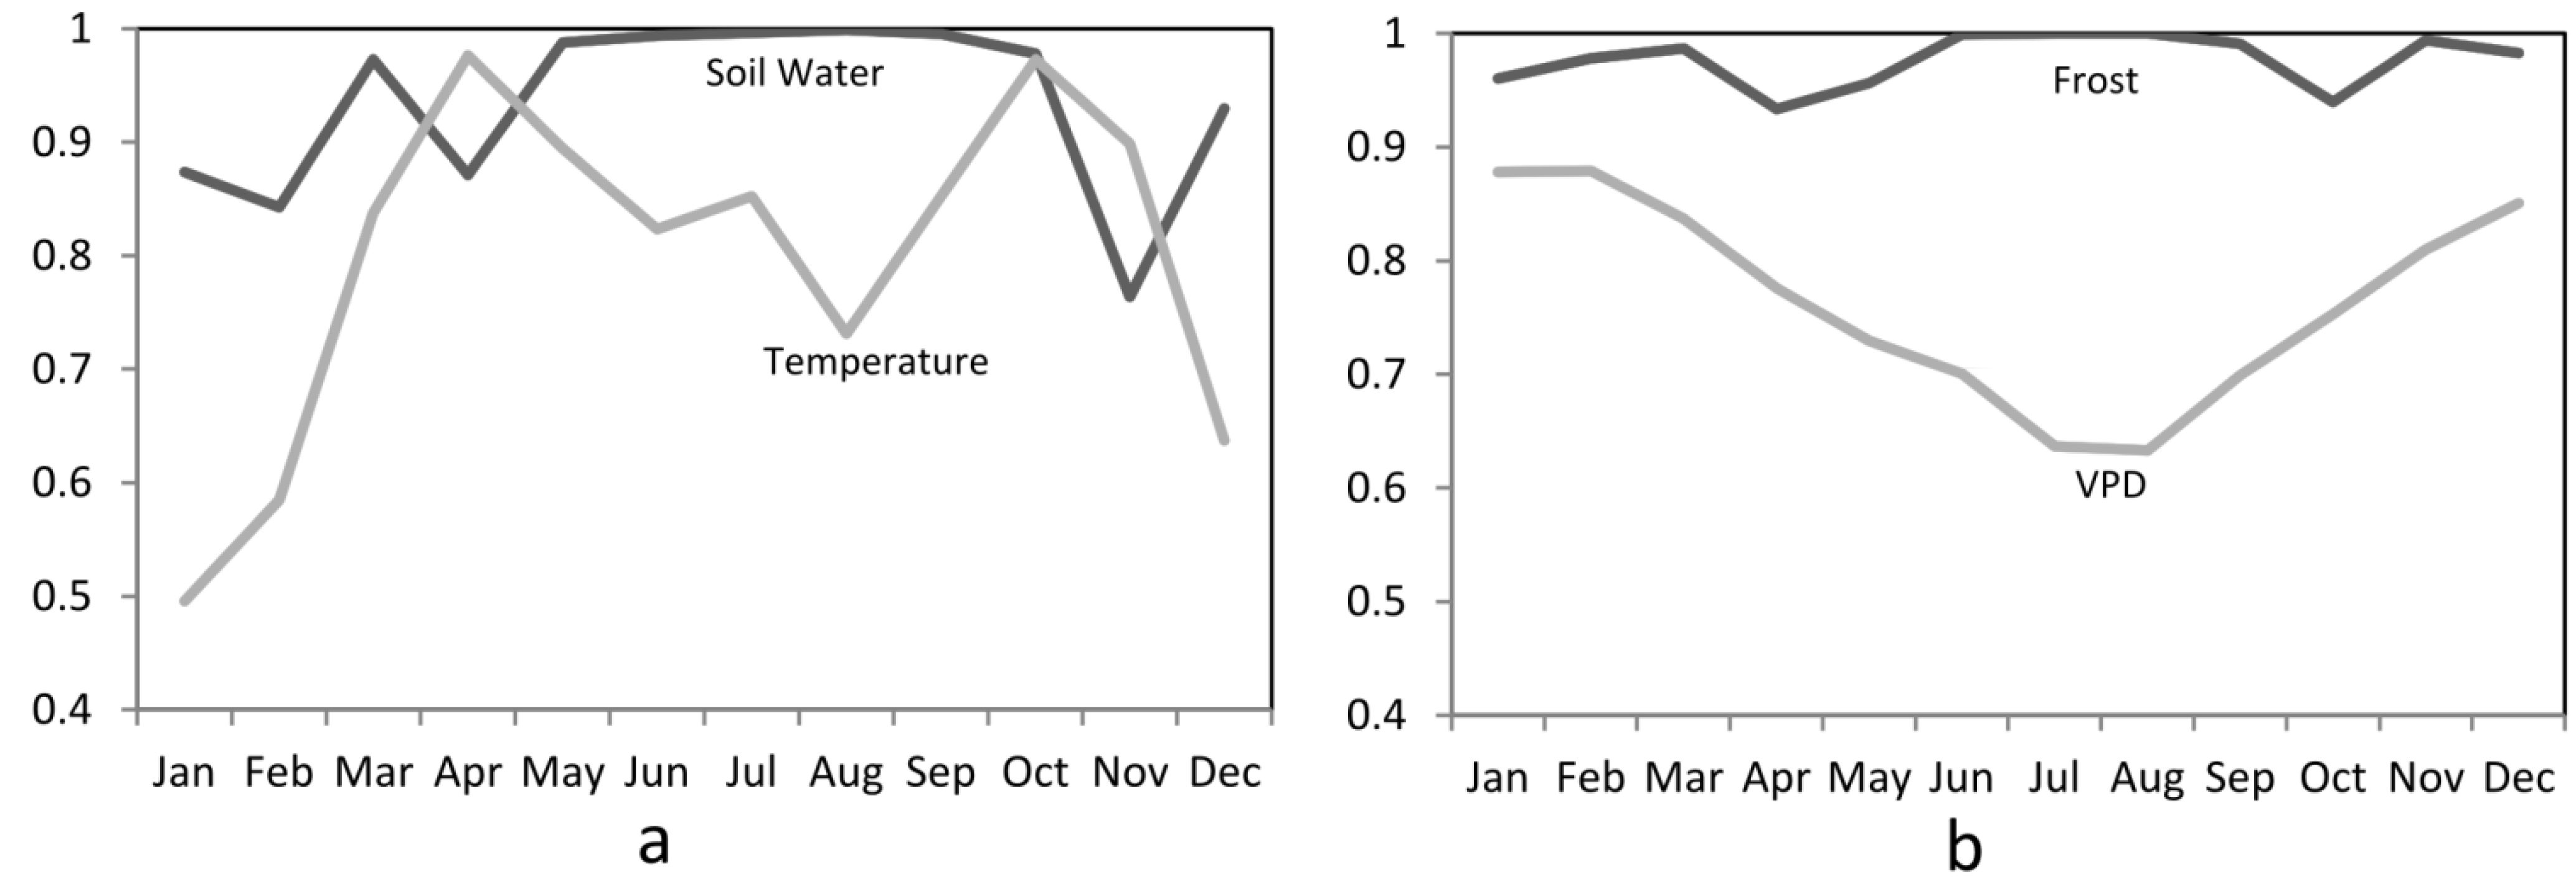
3.1. Climate Modifiers

The spatial variation in the climatic modifiers as they constrain photosynthesis for Chinese fir during the most unfavorable month is shown in Figure 2a–d. Optimum conditions for photosynthesis are indicated by the number 1; whereas zero indicates complete shutdown for at least one month out of each year. Deviations from frost and optimum temperature conditions imposed greater constraints in the north west of the region with little constraint along the coastal regions of the country. The impact of soil water is more spatially variable with the Yangtze River basin and the northern tip of Fujian province along with the northeastern coastal regions having less drought constraint compared to inland and southern areas. High evaporative demand during the summer is typical throughout much of the interior.
The importance of each of the climatic modifiers used in the model was ranked during the decision tree analysis (Figure 3). A higher score in Figure 3 does not indicate more limitations on tree growth, but indicates the likelihood of each climate variable on changing the results of the decision tree model on predicting species’ distribution. The results indicate that the most important modifiers that impact the distribution of the species are fall vapor pressure deficit, winter temperature, and winter soil water. Other climatic modifiers, such as summer VPD and fall temperature also drive the distribution but are less significant (<20%).
Figure 2. Spatial variation of climatic modifiers produced by the 3-PG model. All modifiers were scaled between zero and one, where one represents the optimum condition for Chinese fir growth and zero indicates growth shutdown for at least one month; (a) Frost; (b) soil water; (c) temperature; (d) evaporative demand (VPD).
Forests 06 00360 g002
Figure 3. Overall importance (%) of 3-PG climatic modifiers.
Forests 06 00360 g003
The monthly climate modifier trajectories under current climate are shown in Figure 4. Frost is the least critical modifier, which is to be expected given the location of our study area where winters tend to be relatively warm and dry. In contrast, optimal temperature conditions for the species occur bi-modally throughout the year in early spring and late fall. Temperatures and VPD in mid-summer are the two most restrictive modifiers due to temperatures exceeding 38 °C in some areas, well surpassing the species’ optimum of 17 °C. In warmer months, regional atmospheric air pressure drops with an increment of VPD leading to a reduction of stomatal conductance, explaining the dip in VPD.
Figure 4. Climatic modifiers in a monthly time-step; (a) Soil water and temperature, (b) frost and VPD.
Forests 06 00360 g004

3.2. Decision Tree

A confusion or error matrix allows an assessment of the performance of the algorithm and is often used to assess model accuracy [40]. The accuracy of the decision tree shows absences (n = 24,832) had an overall 70.3% accuracy; whereas presences (n = 69,999) have a higher overall accuracy of 88%. According to the confusion matrix of predicted and actual presence/absence, an internal model agreement of predicted versus actual presence/absence, known as the kappa index, is calculated to be 0.60.
The predicted distribution of Chinese fir under current climate conditions is shown in Figure 5a, matching field observations that the species grows between approximately 21° to 35° N and 101° to 121° E in mainland China as well as the central area of Taiwan. This result agrees with other distributional studies of the species in both the mainland and Taiwan natural Chinese fir forests [2,41,42]. Given the accuracy of the model and the confidence from this agreement, we applied the decision tree rules to the two future climate projections to assess the Chinese fir distributions under projected climate conditions. Figure 5b and c indicate that under climate projection A1B and A2, the species is likely to experience a northward shift with minor changes in the south resulting in an overall increase in species distribution area compared to current climate conditions. Comparing the two projected climate projections, Figure 5b shows that for projection A1B, regions in the central region of China are likely to become more suitable for Chinese fir, however the northward shift is not as marked as under the A2 projection.

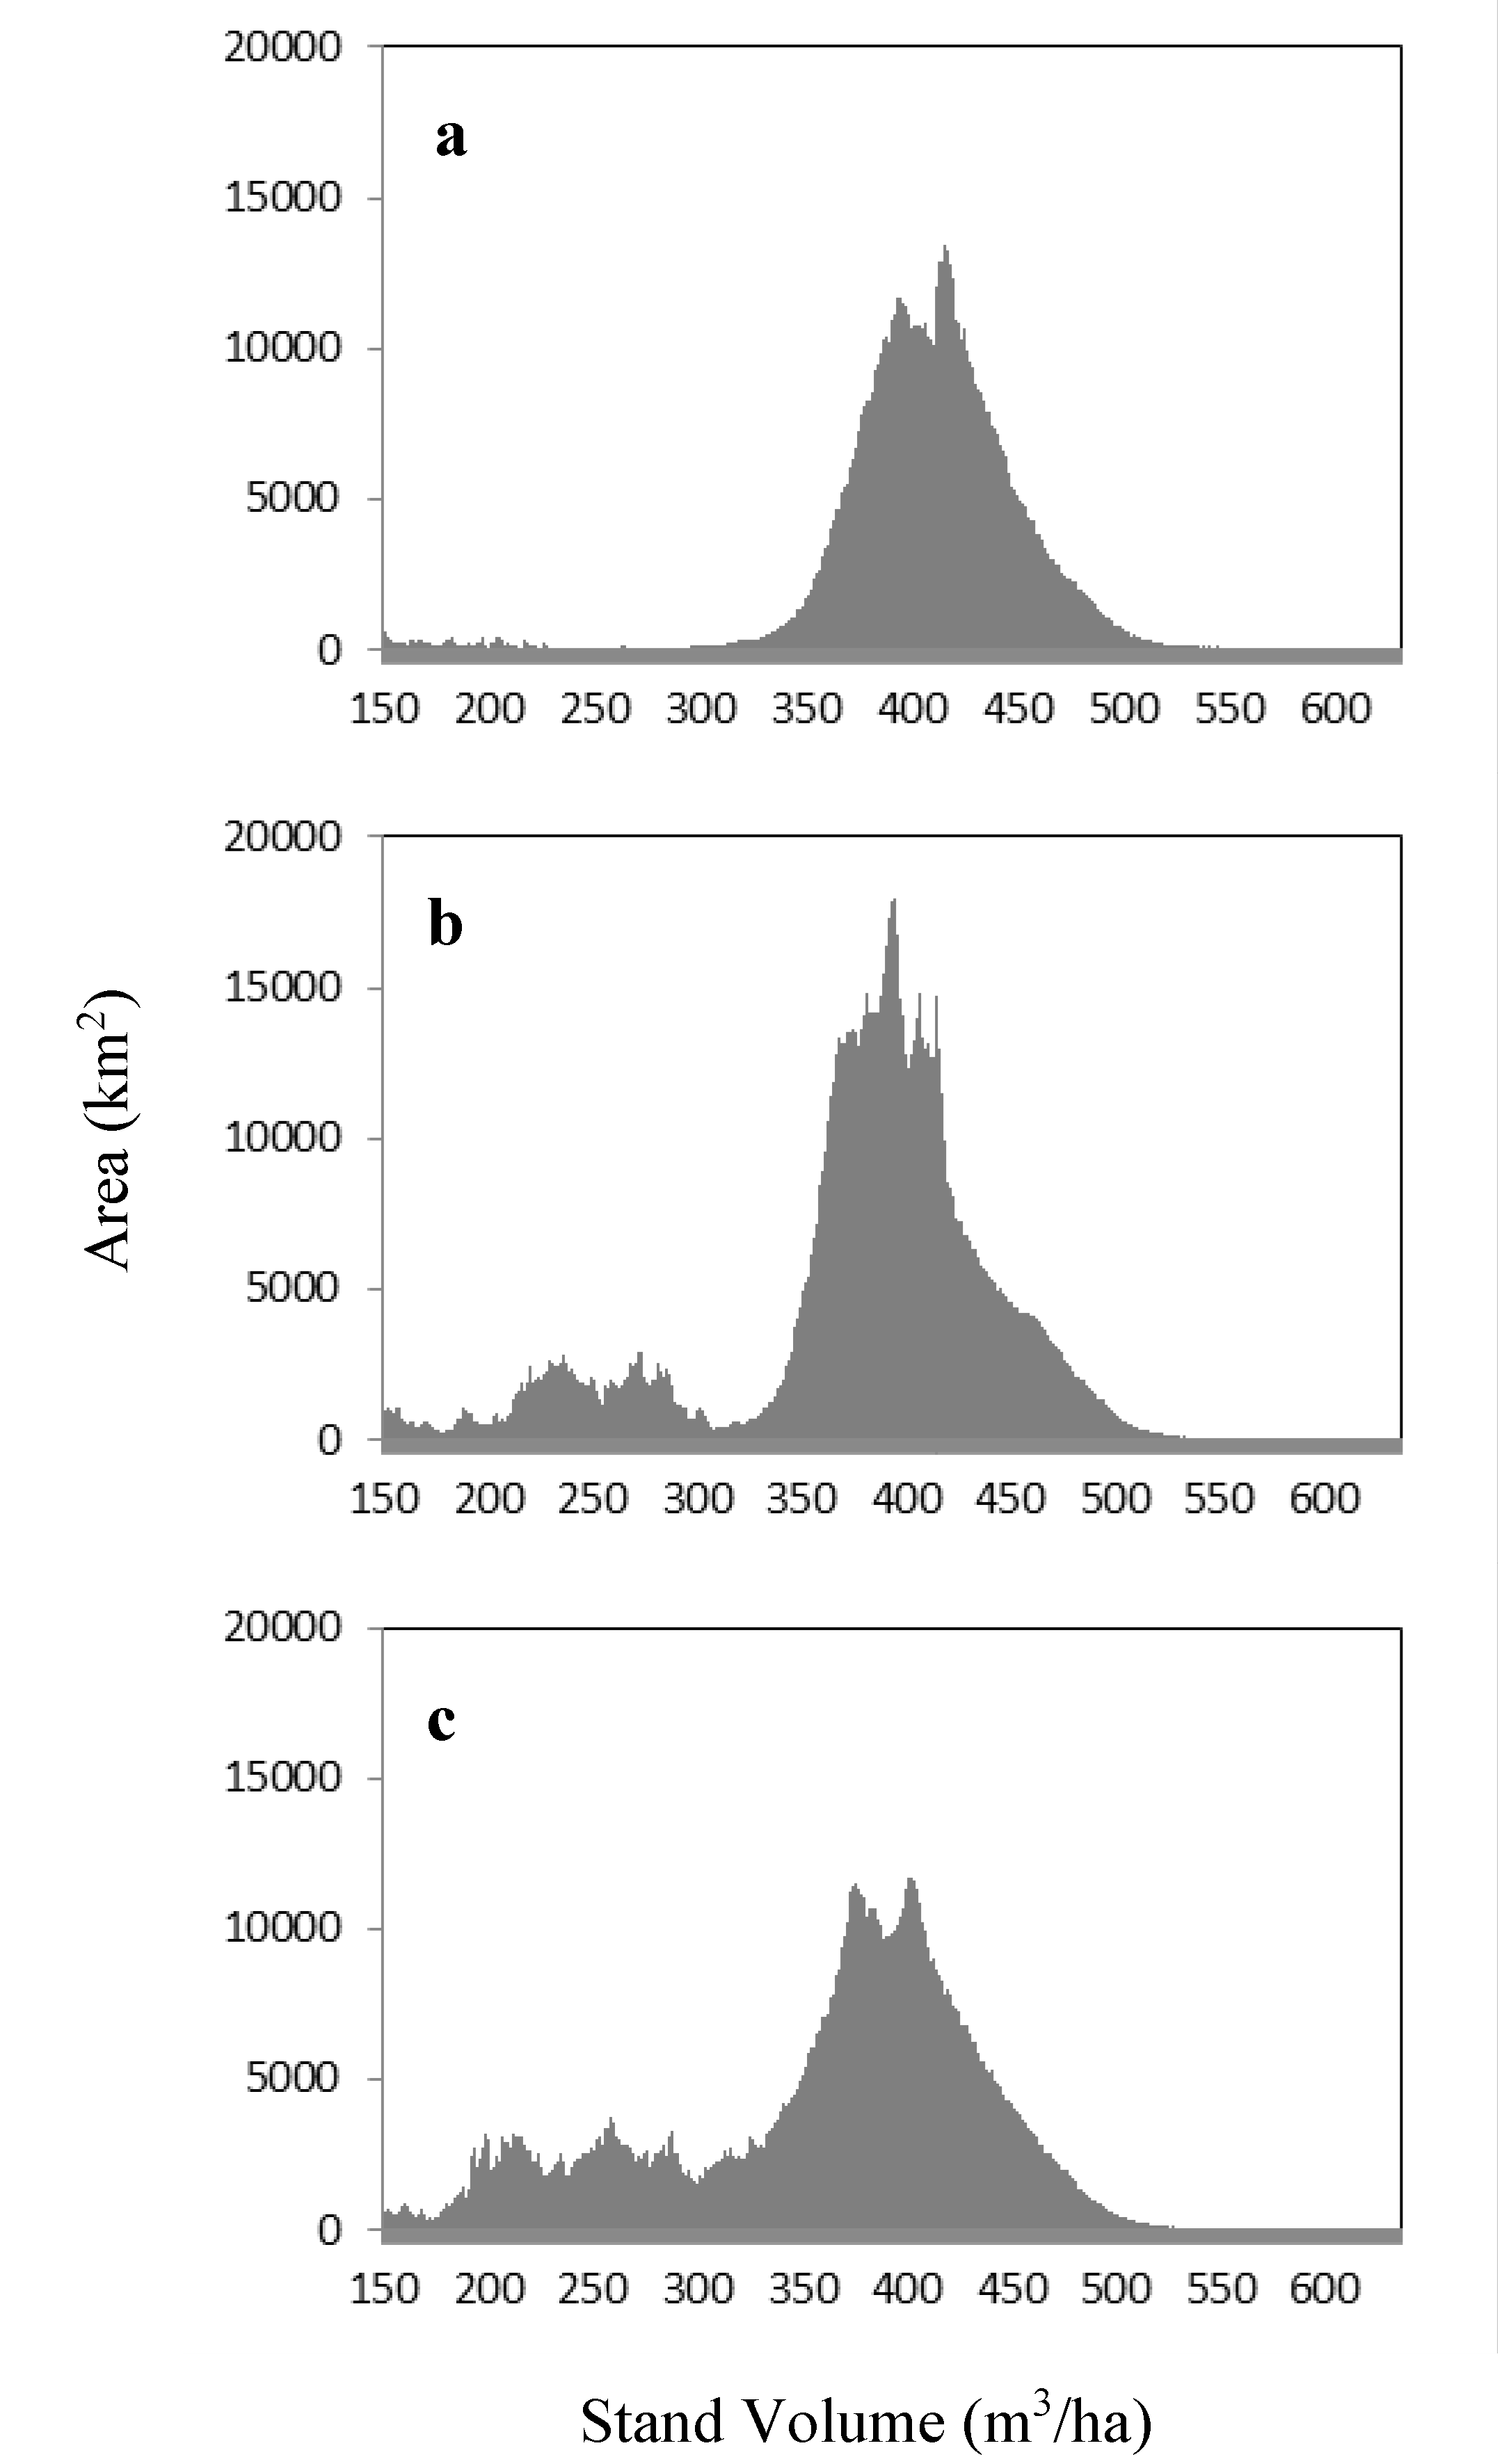
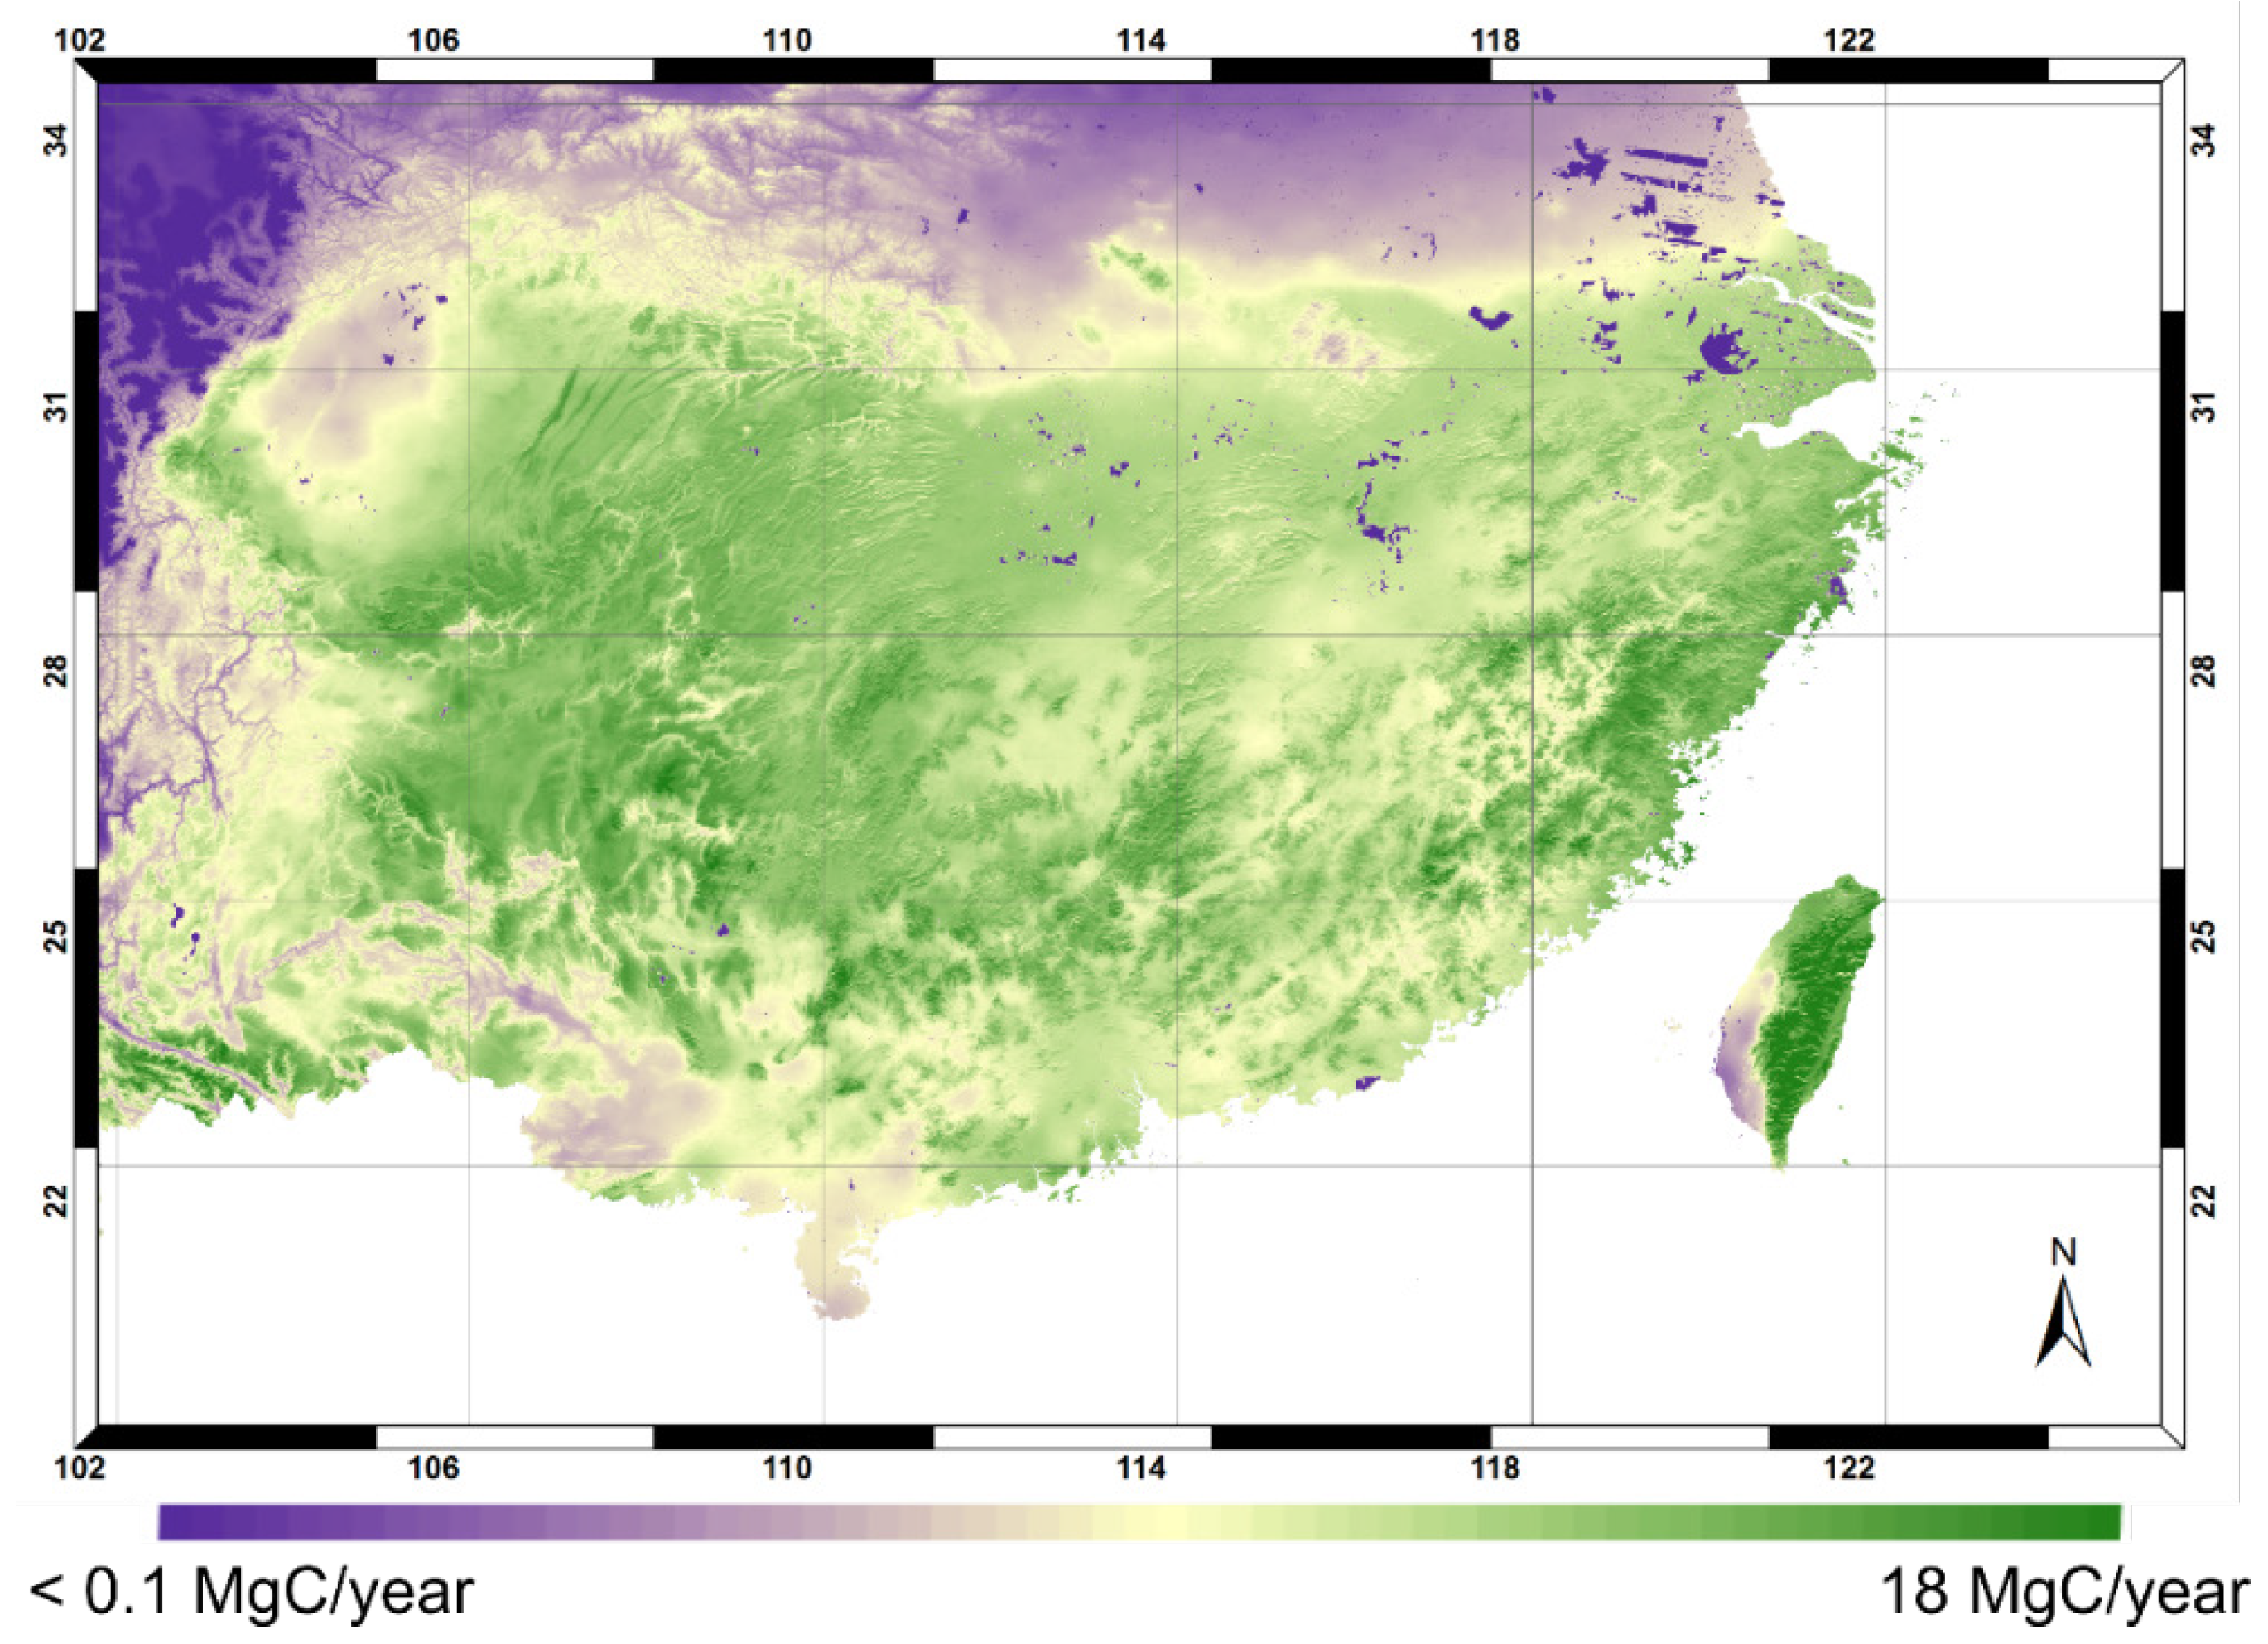
3.3. Productivity and NPP Estimates

Using stand volume as a key productivity indicator provides an indication of the growth potential under the various climate projections. Results are masked by the distribution ranges predicted in the previous phase. The results indicate stand volume at 20 year ranges from 150 to 650 m3/ha. Highly productive stands were modeled to occur in the south-east coastal regions, east interior areas, and central Taiwan; while stands with relatively poor productivity occurred in the northern part of the study area. It is these areas that are projected to become more suitable for Chinese fir into the future. Based on historic data [2,43], we assume that areas with 450 m3/ha or greater stand volume at age 20 are most suitable for productive Chinese fir plantations. Results suggest that in total, 4.3% (~12,000,000 ha; Figure 6a and 3.3% (~9,000,000 ha; Figure 6b) of the modeled species distributions have a stand volume of more than 450 m3/ha under projection A1B and A2, respectively. Both projections indicate that Taiwan and central China would potentially be the most suitable for Chinese fir plantation.
Figure 5. Chinese fir distribution under different climate projections; (a) current; (b) A1B projection; (c) A2 projection.
Forests 06 00360 g005
Figure 6. High productive sites (>450 m3/ha stand volume) within predicted present areas; (a) A1B projection; (b) A2 projection.
Forests 06 00360 g006
Existing stands, if not diminished by climate change, tend to gain more growth over the same growing period under the projected climate. In Figure 7b and c it is apparent that stands currently occupying areas in southern Sichuan and northern Guizhou provinces (center of the study area) are likely to develop into more productive forests based on these stand volume predictions.
Distributions of the productivity regimes for stand volume are shown in Figure 8. Under the current climate conditions (Figure 8a), the distribution is more symmetrical than under the change projections where the shape is skewed towards lower productivity stands. It is also apparent that peaks of productivity are slightly shifted to lower values from the current climate to predicted future climate conditions. This change in productivity distribution results from the newly established distribution of the species in the northern region of the study area (Figure 7). The peak in distribution in the A1B projection is explained by the increase in area where the climate is projected to become more suitable for Chinese fir. Compared to A1B, which represents a moderate development and population growth, the A2 projection demonstrates a more severe decline in volume, as the A2 climate projection mimics greater population increase, economic development, and limited climate adaptation and mitigation activities.
Figure 7. Volume (m3/ha) at age of 20 years, predicted by 3-PG; (a) current climate; (b) A1B projection; (c) A2 projection.
Forests 06 00360 g007
Figure 8. Histograms of predicted volume (m3/ha) with areas (km2) under climate projections; (a) current (baseline); (b) A1B projection; (c) A2 projection.
Forests 06 00360 g008
Net primary production was also calculated using the 3-PG model. Figure 9 shows the current annual carbon uptake of Chinese fir (baseline), averaging 18 Mg/Dry matter/ha/per year, or 930 g carbon/m2/year across the region. Figure 10 shows the percent change between the baseline and two future climate projections. Although changes in NPP are more profound in projection A1B (Figure 10a), both projections indicate a NPP decrease in southern China and a noticeable increase (>50%) in central China.
Figure 9. Total NPP (MgC/year) of Chinese fir under current climate.
Forests 06 00360 g009
Figure 10. Percent changes in NPP between baseline and climate projection; (a) A1B projection; (b) A2 projection.
Forests 06 00360 g010

3.4. Model Application and Limitation

Understanding and quantifying the potential climate impacts on Chinese fir offers benefits to forest managers. Chinese fir is considered as one of the most important conifer species in China, especially in southern China where timber is a major economic driver. Our work indicates that climate change will likely have a dramatic impact on Chinese fir growth and distribution. Forest managers at a local scale will need to adapt by developing management strategies that are best suited to future climates. At the provincial or national level, distribution patterns and forest productivity will assist forest policy-makers to generate more accurate and scientific-based policies. Information on both the distribution and productivity of Chinese fir is important for forest management. Although, impacts on plantation productivity under changing climate is critical for local managers, distributional information is of equal importance as it offers information on the potential suitable locations of planting Chinese fir in the future. Therefore, combined with other regional factors (e.g., economic limitation, local demands etc.) the results of this work could contribute to the decision-making process by providing candidate plantation locations as well as their productivities, both of which will assist local managers better adapt the changing climate.
The 3-PG model estimates the mean annual NPP of 930 gC·m−2·a−1, which is 10% higher than the national field data of 840 gC·m−2·a−1 provided by [43]. Since the NPP calculated in this study is for stands at their maximum growth potential or peak stand productivity (age 20 years), we believe that these estimates of Chinese fir are reasonable and correspond well to other studies. The NPP change predicted by 3-PG model provides a spatial and temporal outlook of climate change impacts on Chinese fir’s carbon stocking. Although Liu et al. (2014) [22] achieved similar results in terms of species geographic distribution and NPP estimates using PnET-II and MaxEnt models, a 3-PG based modeling approach, besides offering accurate carbon stocking predictions, is also able to provide more insights into the direct relationship between climate change, local forest industry needs as well as nation-wide afforestation strategies by providing more commonly used forest parameters (e.g., stand volume, DBH, stem density [29]; Figure 6). The use of 3-PG model combined with decision tree model has shown to be capable of predicting and mapping the impact imposed by climate change. Previously the model has been applied to species including lodgepole pine (Pinus contorta) and Douglas-fir (Pseudotsuga menziesii) in the Pacific region of North America [44,45]. In addition, by comparing the species distribution and NPP change maps from Liu et al. (2014) [22], we believe that the results of this study provide a valid and analytical estimate of Chinese fir productivity under a changing climate and encourage the model application to other species and with more climate projections if possible.
Compared to bioclimatic modeling approaches, which assume that there is an equilibrium between the species distribution and its current climate [46,47], physiological models such as the 3-PG model, utilize the physiological tolerance of the species in their predictions of the climate. For example length of daylight period, cloudiness, and other considerations are inherently dealt with in this approach.
As with any modeling approach, assumptions and caveats are made and required. For the 3-PG model we applied the same species parameters across all climate projections and we did not consider any changes in species’ intra genetic variability. Similarly with our exclusive focus on Chinese fir, we assumed that other species did not benefit from the changing climate and gradually out-competed Chinese fir. More caveats are that the newly established stands may be more vulnerable to forest disturbances (i.e., fire, wind, and insect etc.), and that patterns of natural disturbances do not remain the same through time.
The development of Dynamic Global Vegetation Models (DGVMs), on the other hand, requires much more sophisticated and complex parameterizations and validations that are able to represent physical, biophysical, and physiological processes [48,49]. The complexities of DGVMs prevent the model from applications to a specific species and region [50]. Although the DGVMs output is more likely to generate more accurate simulations, the potential and value of physiological models cannot be underestimated in a sense of offering the best available guide to regional level management.

4. Conclusions

Results of this research using a simple physiological modeling (3-PG) combined with decision tree analysis, suggest that Chinese fir is likely to expand northward into Northern China with low productivity stands initially occurring in these regions. This result agrees well with previous studies [2,22,41,42]. Among all of the climatic modifiers, fall VPD, winter temperature, and winter soil water are the three key factors that drive the distribution of the species over the region. Under a changing climate, warmer temperatures will extend the species-growing season but also increase temperature stress in summer.
This work provides a physiologically driven assessment of the distribution and productivity of Chinese fir, generating relevant information for the local forest and plantation managers (i.e., estimation of volume) as well nation-wide policies-makers (i.e., information on carbon stocking assessment) on how a changing climate impacts Chinese fir’s distribution and productivity.

Acknowledgments

This research was supported by a research grant “Adaptation of Asia-Pacific Forests to Climate Change” (project #APFNet/2010/PPF/001) founded by the Asia-Pacific Network for Sustainable Forest Management and Rehabilitation.

Author Contributions

The authors contributed equally to the overriding concepts and referenced examples within the paper. The lead author wrote early drafts of the manuscript with contributions from the other authors through the editorial process.

Conflicts of Interest

The authors declare no conflict of interest.

References

  1. Wu, Z.L. Chinese-fir; China Forestry Publishing House: Beijing, China, 1984. (In Chinese) [Google Scholar]
  2. Yu, X. Silviculture of Chinese fir; Fujian Sciences & Technology Press: Fuzhou, China, 1997. (In Chinese) [Google Scholar]
  3. Yang, Y.S. Studies on the Sustainable Management of Chinese Fir Plantations; Chinese Forestry Press: Beijing, China, 1998. [Google Scholar]
  4. Lei, J.F. Forest Resources in China; China Forestry Publish House: Beijing, China, 2005; p. 172. [Google Scholar]
  5. He, Z.Y. Study on problems of soil degradation in continuous cropping Chinese fir plantation. In Research on Site Degradation of Timber Plantation; Sheng, W.T., Ed.; Chinese Science & Technology Press: Beijing, China, 1992; pp. 243–250. (In Chinese) [Google Scholar]
  6. CMOF. Statistics of Forest Resource in China (1977–1981); Department of Forest Resource and Management, CMOF: Beijing, China, 1983. (In Chinese) [Google Scholar]
  7. CMOF. Statistics of Forest Resource in China (1984–1988); Department of Forest Resource and Management, CMOF: Beijing, China, 1989. (In Chinese) [Google Scholar]
  8. CMOF. Statistics of Forest Resource in China (1989–1993); Department of Forest Resource and Management, CMOF: Beijing, China, 1994. (In Chinese) [Google Scholar]
  9. CMOF. Statistics of Forest Resource in China (1994); Department of Forest Resource and Management, CMOF: Beijing, China, 1995. (In Chinese) [Google Scholar]
  10. SFA. State Forestry Administration (SFA) Statistics of Forest Resource in China (1994–1998); Department of Forest Resource and Management, SFA: Beijing, China, 2000. (In Chinese) [Google Scholar]
  11. Wang, B.; Li, S.N.; Guo, H. The assessment of forest ecosystem services evaluation in Jiangxi Province. Jiangxi Sci. 2007, 5, 554–587. [Google Scholar]
  12. Huang, M.; Ji, J.; Li, K.; Liu, Y.; Yang, F.; Tao, B. The ecosystem carbon accumulation after conversion of grasslands to pine plantations in subtropical red soil of South China. Tellus 2007, 59, 439–448. [Google Scholar] [CrossRef]
  13. Fang, Q. Influences of continuous cropping on soil fertility and stand growth in Chinese fir plantation. Sci. Silv. Sin. 1987, 23, 389–397. (In Chinese) [Google Scholar]
  14. Yang, Y.; Zhang, R.; He, Z. Change on the stand productivity of 29-year-old Chinese fir plantation in different rotations. J. Fujian Col. For. 1997, 18, 202–206. (In Chinese) [Google Scholar]
  15. Ma, X.; Fan, S.; Chen, S.; Lin, S. Study on biomass productivity of Chinese fir plantations after successive planting. Sci. Silv. Sin. 2003, 39, 78–83. [Google Scholar]
  16. Andrewartha, H.G.; Birch, L.C. The Distribution and Abundance of Animals; University of Chicago Press: Chicago, IL, USA, 1954. [Google Scholar]
  17. McCarty, J.P. Ecological consequences of recent climate change. Conserv. Biol. 2001, 15, 320–331. [Google Scholar] [CrossRef]
  18. Qian, W.; Zhu, Y. Climate change in China from 1880 to 1998 and its impact on the environmental condition. Clim. Chang. 2001, 50, 419–444. [Google Scholar] [CrossRef]
  19. Wang, Z.; Ding, Y.; He, J.; Jun, Y. An updated analysis of the climate change in China in recent 50 years. Acta Meteorol. Sin. 2004, 62, 228–236. [Google Scholar]
  20. Ding, Y.; Ren, G.; Zhao, Z.; Xu, Y.; Luo, Y.; Li, Q.; Zhang, J. Detection, causes and projection of climate change over China: An overview of recent progress. Adv. Atmos. Sci. 2007, 24, 954–971. [Google Scholar] [CrossRef]
  21. Walther, G.R.; Post, E.; Convey, P.; Menzel, A.; Parmesan, C.; Beebee, T.J.C.; Fromentin, J.; Hoegh-Guldberg, O.; Bairlein, F. Ecological responses to recent climate change. Nature 2002, 416, 389–395. [Google Scholar] [CrossRef] [PubMed]
  22. Liu, Y.; Yu, D.; Xun, B.; Sun, Y.; Hao, R. The potential effects of climate change on the distribution and productivity of Cunninghamia lanceolata in China. Environ. Monit. Assess. 2014, 186, 135–149. [Google Scholar] [CrossRef] [PubMed]
  23. Wang, T.; Hamann, A.; Spittlehouse, D.L.; Murdock, T. ClimateWNA—High-resolution spatial climate data for Western North America. J. Appl. Meteorol. 2012, 51, 16–29. [Google Scholar] [CrossRef]
  24. Daly, C. Variable Influence of Terrain on Precipitation Patterns: Delineation and Use of Effective Terrain Height in PRISM; Oregon State University: Corvallis, OR, USA, 2002. Available online: http://oldprism.nacse.org/pub/prism/docs/effectiveterrain-daly.pdf (accessed on 1 July 2014).
  25. Hijmans, R.J.; Cameron, S.; Parra, J.; Jones, P.G.; Jarvis, A. WorldClim, Version 1.3; University of California, Berkeley: Berkeley, CA, USA, 2005. [Google Scholar]
  26. IPCC Data Distribution Center. Available online: http://www.ipcc-data.org/sim/gcm_global/index.html (accessed on 1 March 2014).
  27. Landsberg, J.J.; Waring, R.H. A generalised model of forest productivity using simplified concepts of radiation-use efficiency, carbon balance and partitioning. For. Ecol. Manag. 1997, 95, 209–228. [Google Scholar] [CrossRef]
  28. Coops, N.C.; Hember, R.A.; Waring, R.H. Assessing the impact of current and projected climates on Douglas-Fir productivity in British Columbia, Canada, using a process-based model (3-PG). Can. J. For. Res. 2010, 40, 511–524. [Google Scholar] [CrossRef]
  29. Landsberg, J.; Coops, N.C. Modeling forest productivity across large areas and long periods. Nat. Res. Model. 1999, 12, 383–411. [Google Scholar] [CrossRef]
  30. Coops, N.C.; Waring, R.H.; Law, B.E. Assessing the past and future distribution and productivity of ponderosa pine in the Pacific Northwest using a process model, 3-PG. Ecol. Model. 2005, 183, 107–124. [Google Scholar] [CrossRef]
  31. Liu, X.Z.; Xiang, W.H.; Kang, W.X. Biomass dynamic pattern of Chinese fir plantation ecosystem. In Long-term Located Research on Forest Ecosystem; Liu, X.Z., Ed.; China Forestry Publish House: Beijing, China, 1993; pp. 18–22. [Google Scholar]
  32. Zhao, M.; Xiang, W.; Peng, C.; Tian, D. Simulating age-related changes in carbon storage and allocation in a Chinese fir plantation growing in southern China using the 3-PG model. For. Ecol. Manag. 2009, 257, 1520–1531. [Google Scholar] [CrossRef]
  33. Pearce, J.L.; Boyce, M.S. Modelling distribution and abundance with presence-only data. J. Appl. Ecol. 2006, 43, 405–412. [Google Scholar] [CrossRef]
  34. Fang, J.; Liu, G.; Xu, S. Biomass and net production of forest vegetation in China. Acta Ecol. Sin. 1996, 16, 497–508. [Google Scholar]
  35. De’Ath, G. Multivariate regression trees: A new technique for modeling species-environment relationships. Ecology 2002, 83, 1105–1117. [Google Scholar]
  36. Schwalm, C.R.; Black, T.A.; Amiro, B.D.; Arain, M.A.; Barr, A.G.; Bourque, C.P.A.; Dunn, A.L.; Flanagan, L.B.; Giasson, M.A.; Lafleur, P.M.; et al. Photosynthetic light use efficiency of three biomes across an east-west continental-scale transect in Canada. Agric. Meteorol. 2006, 140, 269–286. [Google Scholar] [CrossRef]
  37. Breiman, L.; Friedman, J.; Stone, C.J.; Olshen, R.A. Classification and Regression Trees; CRC Press: Bota Raton, FL, USA, 1984. [Google Scholar]
  38. Melendez, K.V.; Jones, D.L.; Feng, A.S. Classification of communication signals of the little brown bat. J. Acoust. Soc. Am. 2006, 120, 1095–1102. [Google Scholar] [CrossRef] [PubMed]
  39. Zaniewski, A.E.; Lehmann, A.; Overton, J.M. Predicting species spatial distributions using presence-only data: A case study of native New Zealand ferns. Ecol. Model. 2002, 157, 261–280. [Google Scholar] [CrossRef]
  40. Congalton, R.G. A review of assessing the accuracy of classifications of remotely sensed data. Remote Sens. Environ. 1991, 37, 35–46. [Google Scholar] [CrossRef]
  41. Yang, J.; Lin, T.; Kung, F. Geographic variation of China fir (Cunninghamia lanceolata (Lamb.) Hook) in Taiwan: Analysis of provenance division by ecotype and by province. Taiwan J. For. Sci. 2000, 15, 303–315. [Google Scholar]
  42. Chung, J.D.; Lin, T.P.; Tan, Y.C.; Lin, M.Y.; Hwang, S.Y. Genetic diversity and biogeography of Cunninghamia konishii (Cupressaceae), an island species in Taiwan: A comparison with Cunninghamia lanceolata, a mainland species in China. Mol. Phylogenet. Evol. 2004, 33, 791–801. [Google Scholar] [CrossRef] [PubMed]
  43. Yu, X. Chinese fir; Fujian Sciences & Technology Press: Fuzhou, China, 1982. (In Chinese) [Google Scholar]
  44. Coops, N.C.; Hember, R.A. Physiologically derived predictions of Douglas-fir site index in British Columbia. For. Chron. 2009, 85, 733–744. [Google Scholar] [CrossRef]
  45. Coops, N.C.; Waring, R.H. A process-based approach to estimate lodgepole pine (Pinus contorta Dougl.) distribution in the Pacific Northwest under climate change. Clim. Ch. 2011, 105, 313–328. [Google Scholar] [CrossRef]
  46. Woodward, F.I. The impact of low temperatures in control- ling the geographical distribution of plants. Philos. Trans. B 1990, 326, 585–593. [Google Scholar] [CrossRef]
  47. Pearson, R.G.; Dawson, T.P. Predicting the impacts of climate change on the distribution of species: Are bioclimate envelope models useful? Glob. Ecol. Biogeogr. 2003, 12, 361–371. [Google Scholar] [CrossRef]
  48. Woodward, F.I.; Beerling, D.J. The dynamics of vegetation change: Health warnings for equilibrium “dodo” models. Glob. Ecol. Biogeogr. Lett. 1997, 6, 413–418. [Google Scholar] [CrossRef]
  49. Cramer, W.; Bondeau, A.; Woodward, F.I.; Prentice, I.C.; Betts, R.A.; Brovkin, V.; Cox, P.M.; Fisher, V.; Foley, J.A.; Friend, A.D.; et al. Global response of terres-trial ecosystem structure and function to CO2 and climate change: Results from six dynamic global vegetation models. Glob. Chang. Biol. 2001, 7, 357–373. [Google Scholar] [CrossRef]
  50. Sykes, M.T.; Prentice, I.C.; Smith, B.; Cramer, W.; Venevsky, S. An introduction to the European terrestrial ecosystem modelling activity. Glob. Ecol. Biogeogr. 2001, 10, 581–593. [Google Scholar] [CrossRef]

