
The Influence of Stocking and Stand Composition on Productivity of Boreal Trembling Aspen-White Spruce Stands


Abstract
:1. Introduction
2. Materials and Methods
2.1. Study Sites and Data
- (1)
- The plot was primarily comprised of trembling aspen and/or white spruce.
- (2)
- No more than 10% of the total stand basal area was comprised of species other than trembling aspen and/or white spruce.
- (3)
- If other deciduous species were present in the plot, they were grouped with aspen, as long as they accounted for less than 10% of the total basal area.

| Variable | Mean (SD) | Maximum | Minimum | ||||||
|---|---|---|---|---|---|---|---|---|---|
| Aw | Sw | Mix | Aw | Sw | Mix | Aw | Sw | Mix | |
| Deciduous density (trees·ha−1) = TPHdec | 932 (782) | 70 (90) | 380 (409) | 5350 | 326 | 2863 | 222 | 0 | 25 |
| White spruce density (trees·ha−1) = TPHsw | 28 (33) | 1190 (850) | 737 (782) | 130 | 4593 | 4890 | 0 | 361 | 55 |
| Total density (trees·ha−1) = TPHtot | 962 (781) | 1270 (825) | 1125 (989) | 5350 | 4617 | 7038 | 237 | 381 | 200 |
| Total stand age (years) | 90 (23) | 147 (41) | 120 (25.1) | 132 | 264 | 195 | 40 | 78 | 46 |
| Spruce periodic annual increment in volume (m3·ha−1·year −1) = PAIVsw | 0.179 (0.28) | 6.61 (2.11) | 4.11 (2.3) | 0.98 | 10.3 | 12.7 | 0.01 | 2.3 | 0.001 |
| Aspen periodic annual increment in volume (m3·ha−1·year −1) = PAIVaw | 6.67 (2.5) | 0.17 (0.18) | 2.86 (2.8) | 12.8 | 0.66 | 21.7 | 3.24 | −0.15 | −0.21 |
| Total stand periodic annual increment in volume (m3·ha−1·year −1) = PAIVtot | 6.85 (2.57) | 6.62 (2.11) | 7.03 (3.02) | 13.41 | 10.7 | 24.6 | 3.28 | 2.68 | 1.58 |
| Percentage of basal area of white spruce = PBAsw | 1.90 (2.6) | 95.7 (3.76) | 55.6 (22.3) | 9.5 | 100 | 89 | 0.1 | 89.5 | 11.1 |
| Percentage of basal area of deciduous = PBAdec | 97.8 (2.6) | 3.89 (3.69) | 43.3 (22.2) | 100 | 10.8 | 89 | 90.5 | 0.1 | 11 |
| Deciduous basal area per hectare (m2·ha−1) = BAHdec | 37.4 (8.8) | 1.92 (1.85) | 17.9 (9.4) | 57.9 | 6.32 | 50.3 | 12.6 | 0.1 | 2.34 |
| White spruce basal area per hectare (m2·ha−1) = BAHsw | 0.74 (0.89) | 50.16 (10.91) | 26.7 (14.1) | 3.72 | 72.3 | 58 | 0.01 | 34.3 | 4.7 |
| Total stand basal area per hectare (m2·ha−1) = BAHtot | 38.22 (8.82) | 52.35 (10.36) | 45 (10.8) | 57.9 | 74.6 | 73.9 | 12.8 | 38.7 | 21.3 |
| Average white spruce height (m) = HTsw | 7.7 (7.5) | 20.1 (3.17) | 19 (4.3) | 28.6 | 25.3 | 27 | 0.1 | 11.4 | 8 |
| Average trembling aspen height (m) = HTaw | 22.3 (3.8) | 5.93 (10.3) | 21 (7.1) | 30.5 | 26 | 32 | 10.9 | 0.5 | 0.5 |
| Dynamic SDI deciduous = SDIdyd | 734 (174) | 34 (32) | 351 (184) | 1137 | 114 | 990 | 254 | 0 | 46 |
| Dynamic SDI white spruce = SDIdysw | 14 (19) | 909 (190) | 487 (246) | 66 | 1340 | 1029 | 0 | 604 | 55 |
| Total stand dynamic SDI = SDIdyt | 690 (184) | 906 (222) | 650 (206) | 1090 | 1305 | 1130 | 320 | 580 | 214 |
| Site index (m) = SI | 20 (2.0) | 16 (3.0) | 18 (2.3) | 25 | 20 | 23 | 16 | 8 | 9 |
| Nutrient regime = Nur | 3 | 3 | 3 | 5 | 4 | 5 | 2 | 3 | 2 |
| Moisture regime = Mor | 5 | 5 | 5 | 8 | 7 | 8 | 4 | 4 | 4 |
2.2. Data Analysis
3. Results
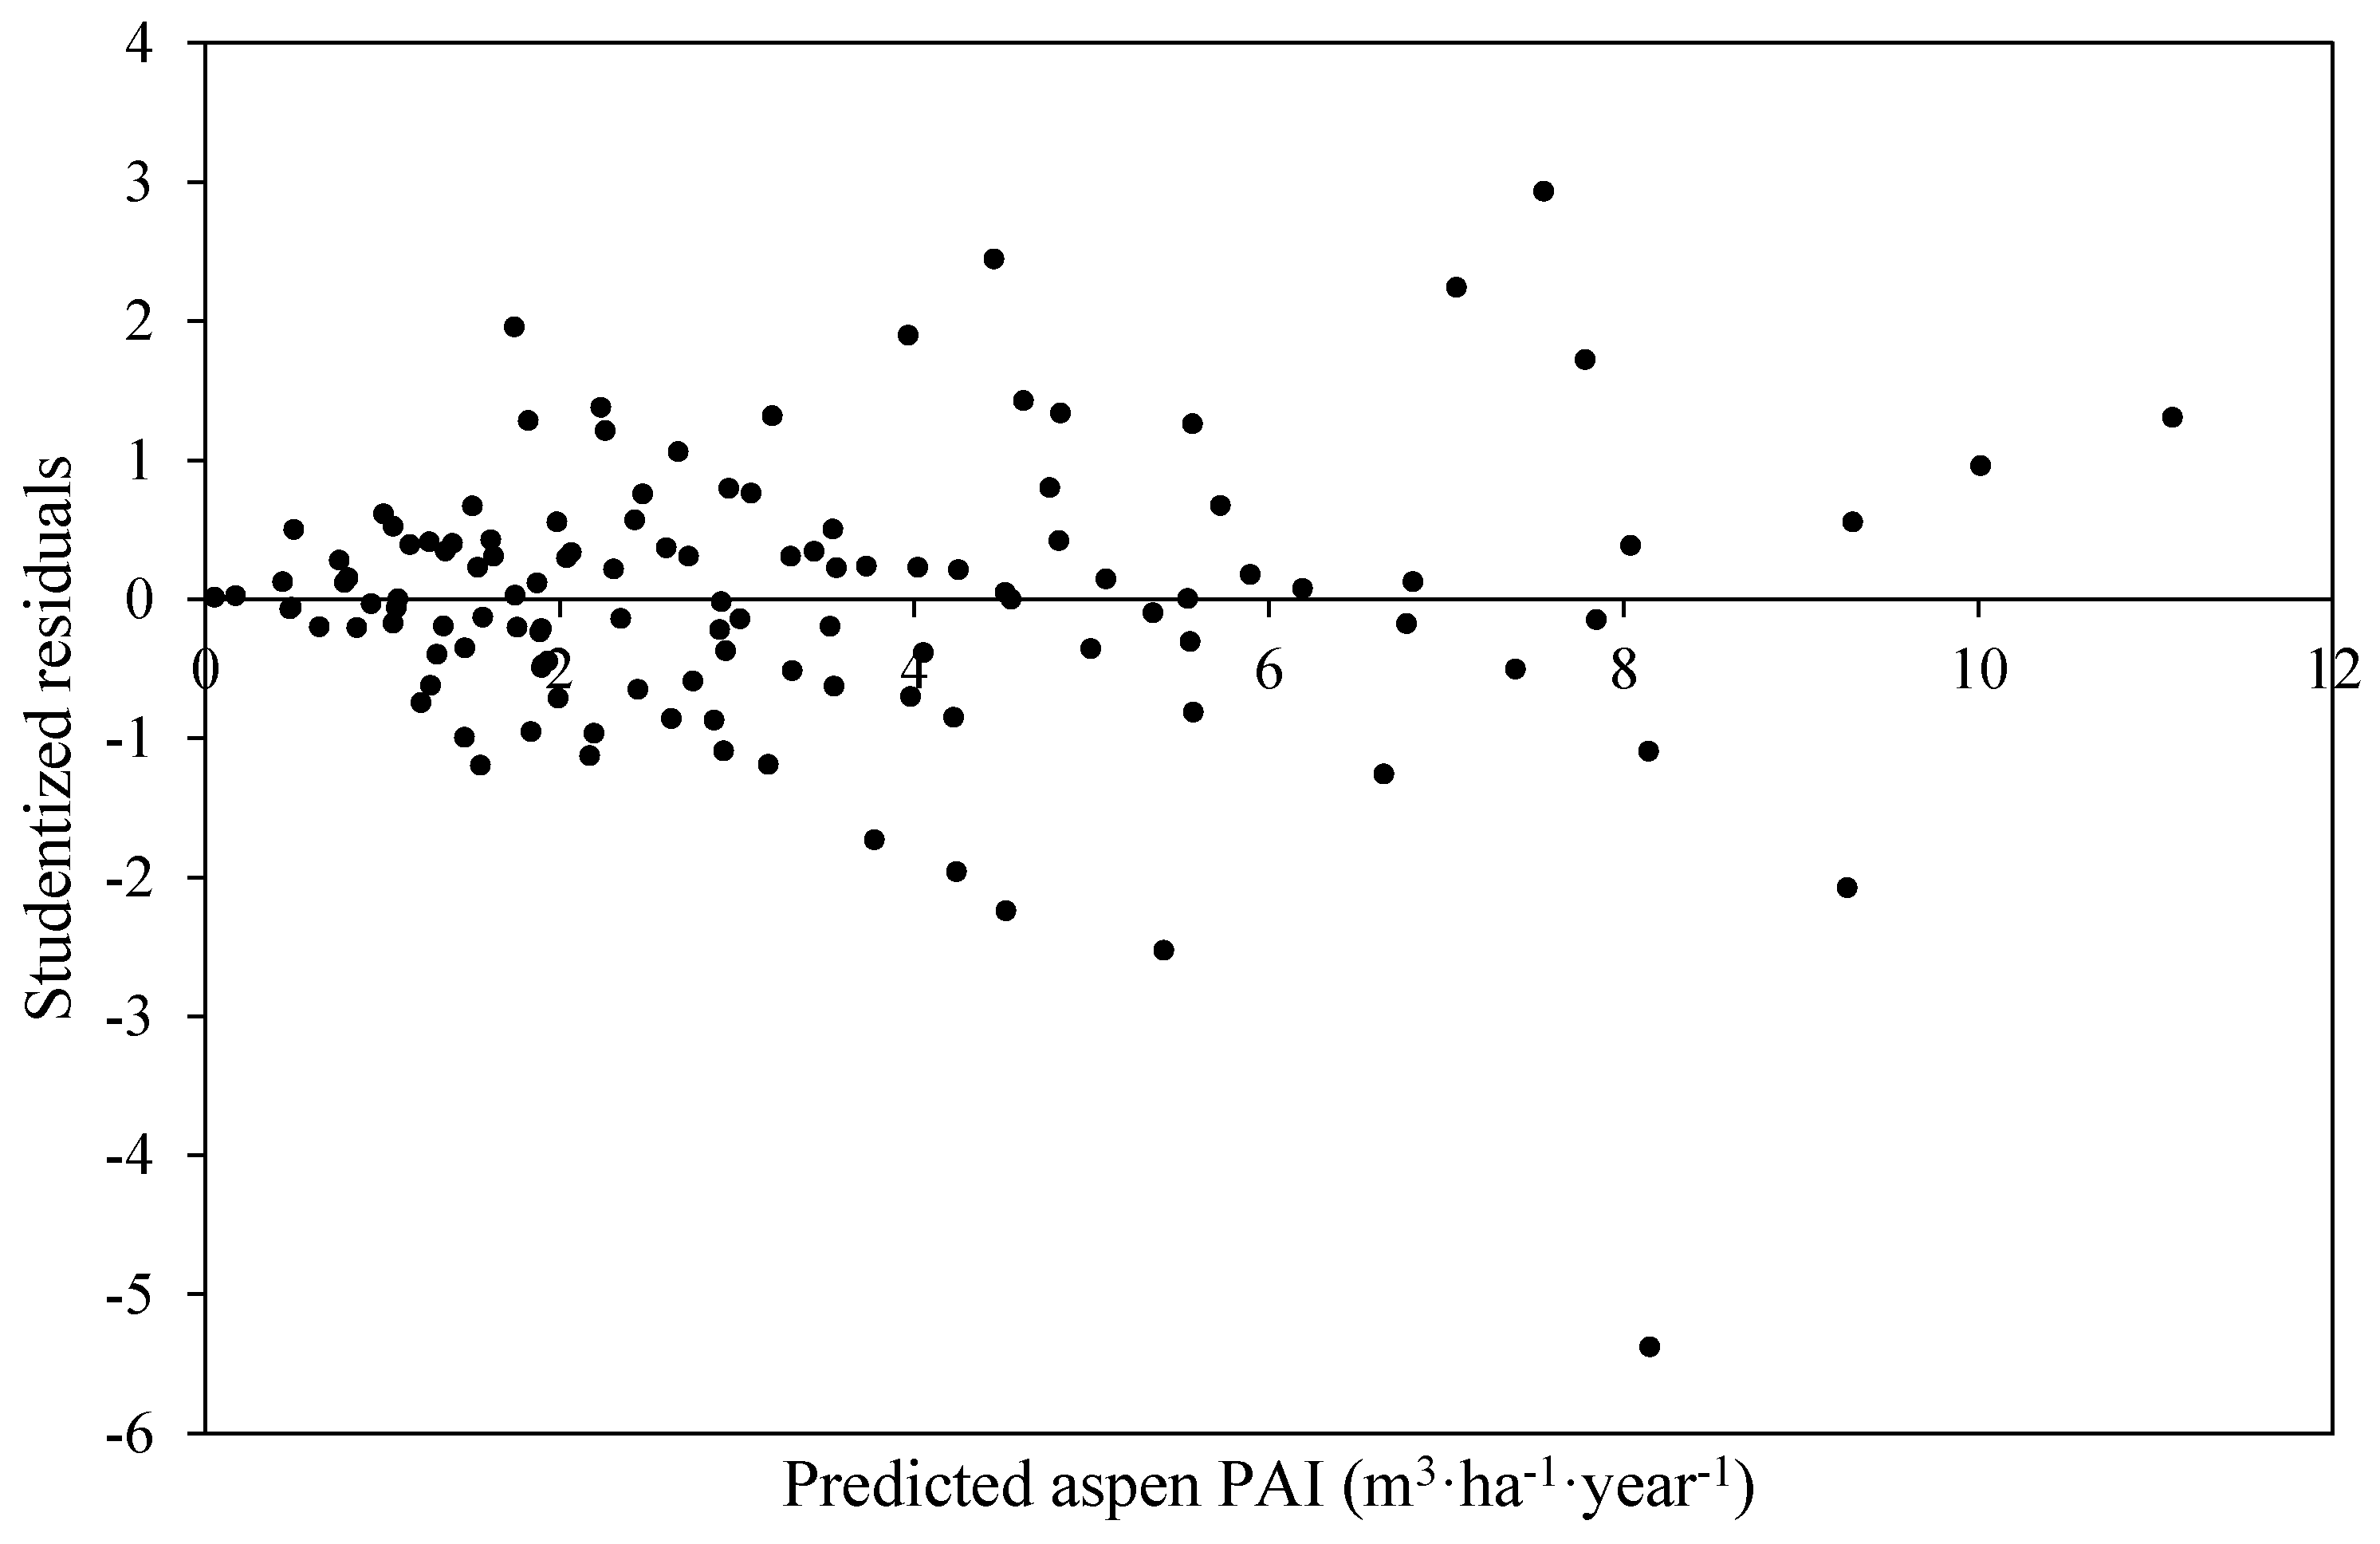
3.1. Trembling Aspen PAI in Volume
| Model | SSres | Parameter | Adj R2 | |||||
|---|---|---|---|---|---|---|---|---|
| β0 | β1 | β2 | β3 | β4 | β5 | |||
| PAIVaw = β0 × TPHdecβ1 × HTswβ2 × HTawβ3 | 261.7 | 4.2E-7 (5.5E-7) {3.0} | 1.02 (0.07) {0.08} | 0.20 (0.11) {0.07} | 2.96 (0.26) {0.05} | 0.80 | ||
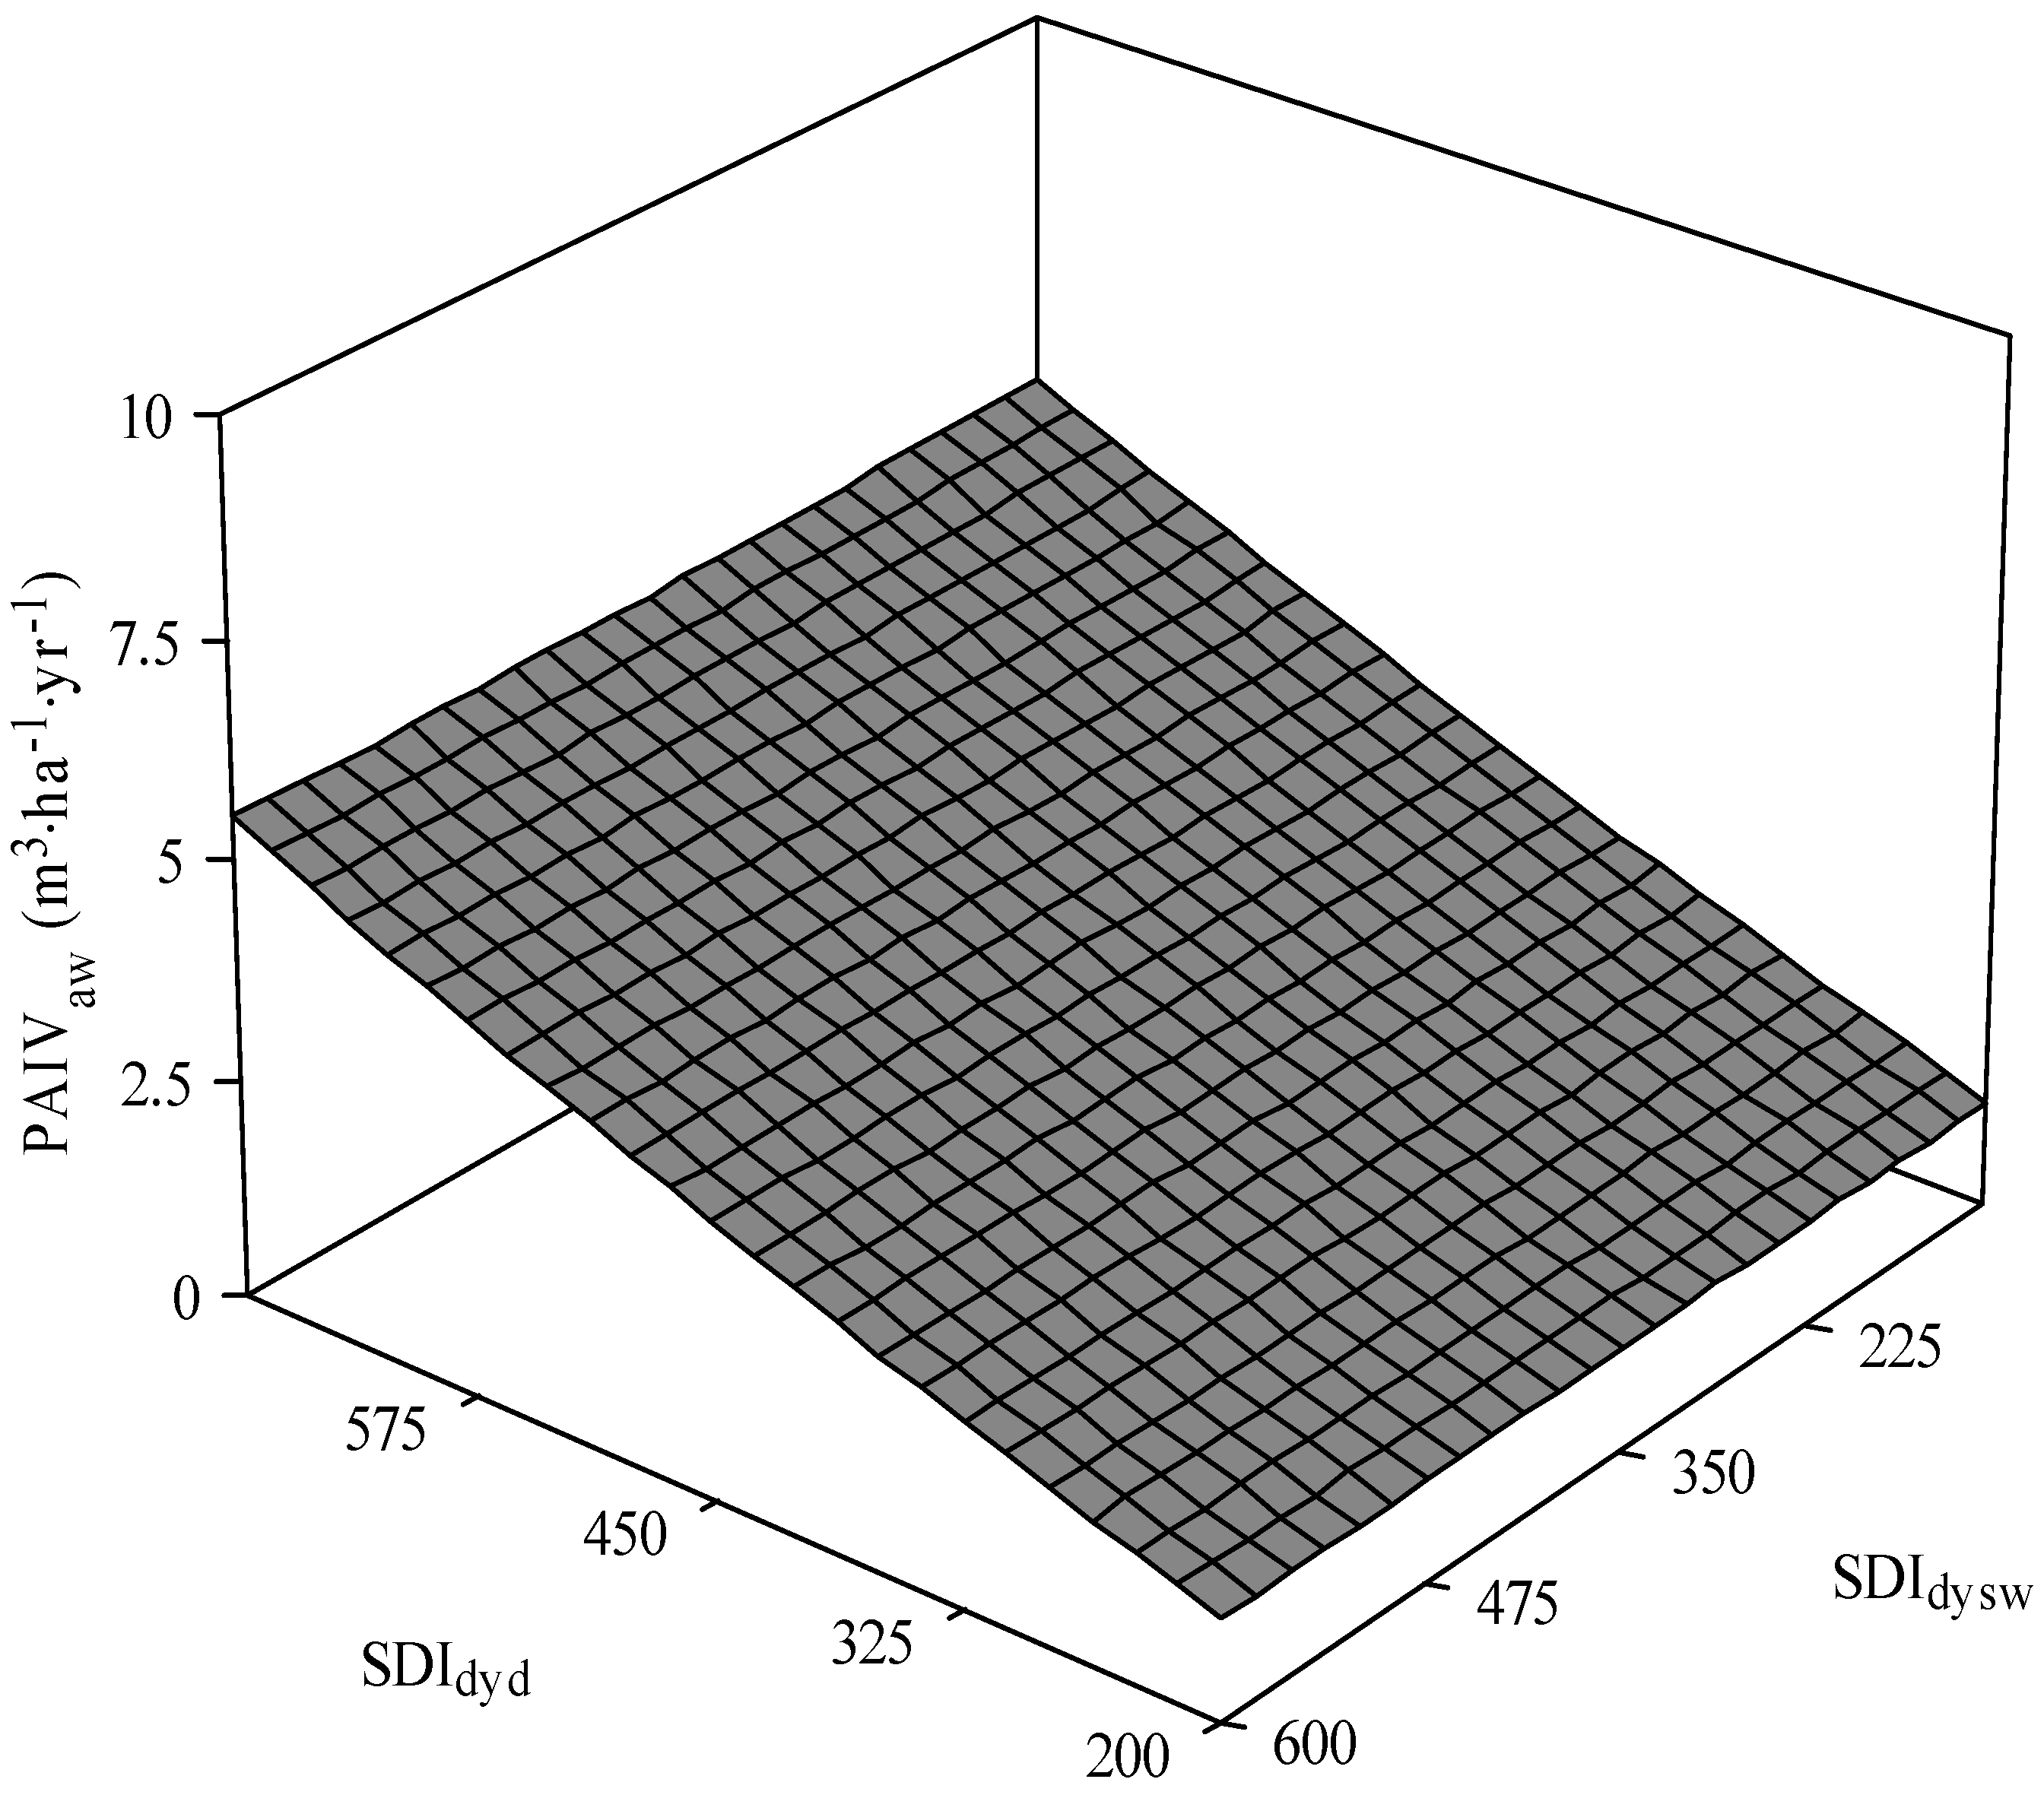
| PAIVaw = β0 × SDIdydβ1 × SDIdyswβ2 × HTswβ3 × HTawβ4 | 296.1 | 0.0002 (0.0002) {3.5} | 1.24 (0.12) {0.11} | 0.03 (0.03) {0.05} | 0.17 (0.14) {−0.06} | 0.65 (0.27) {0.08} | 0.75 | |
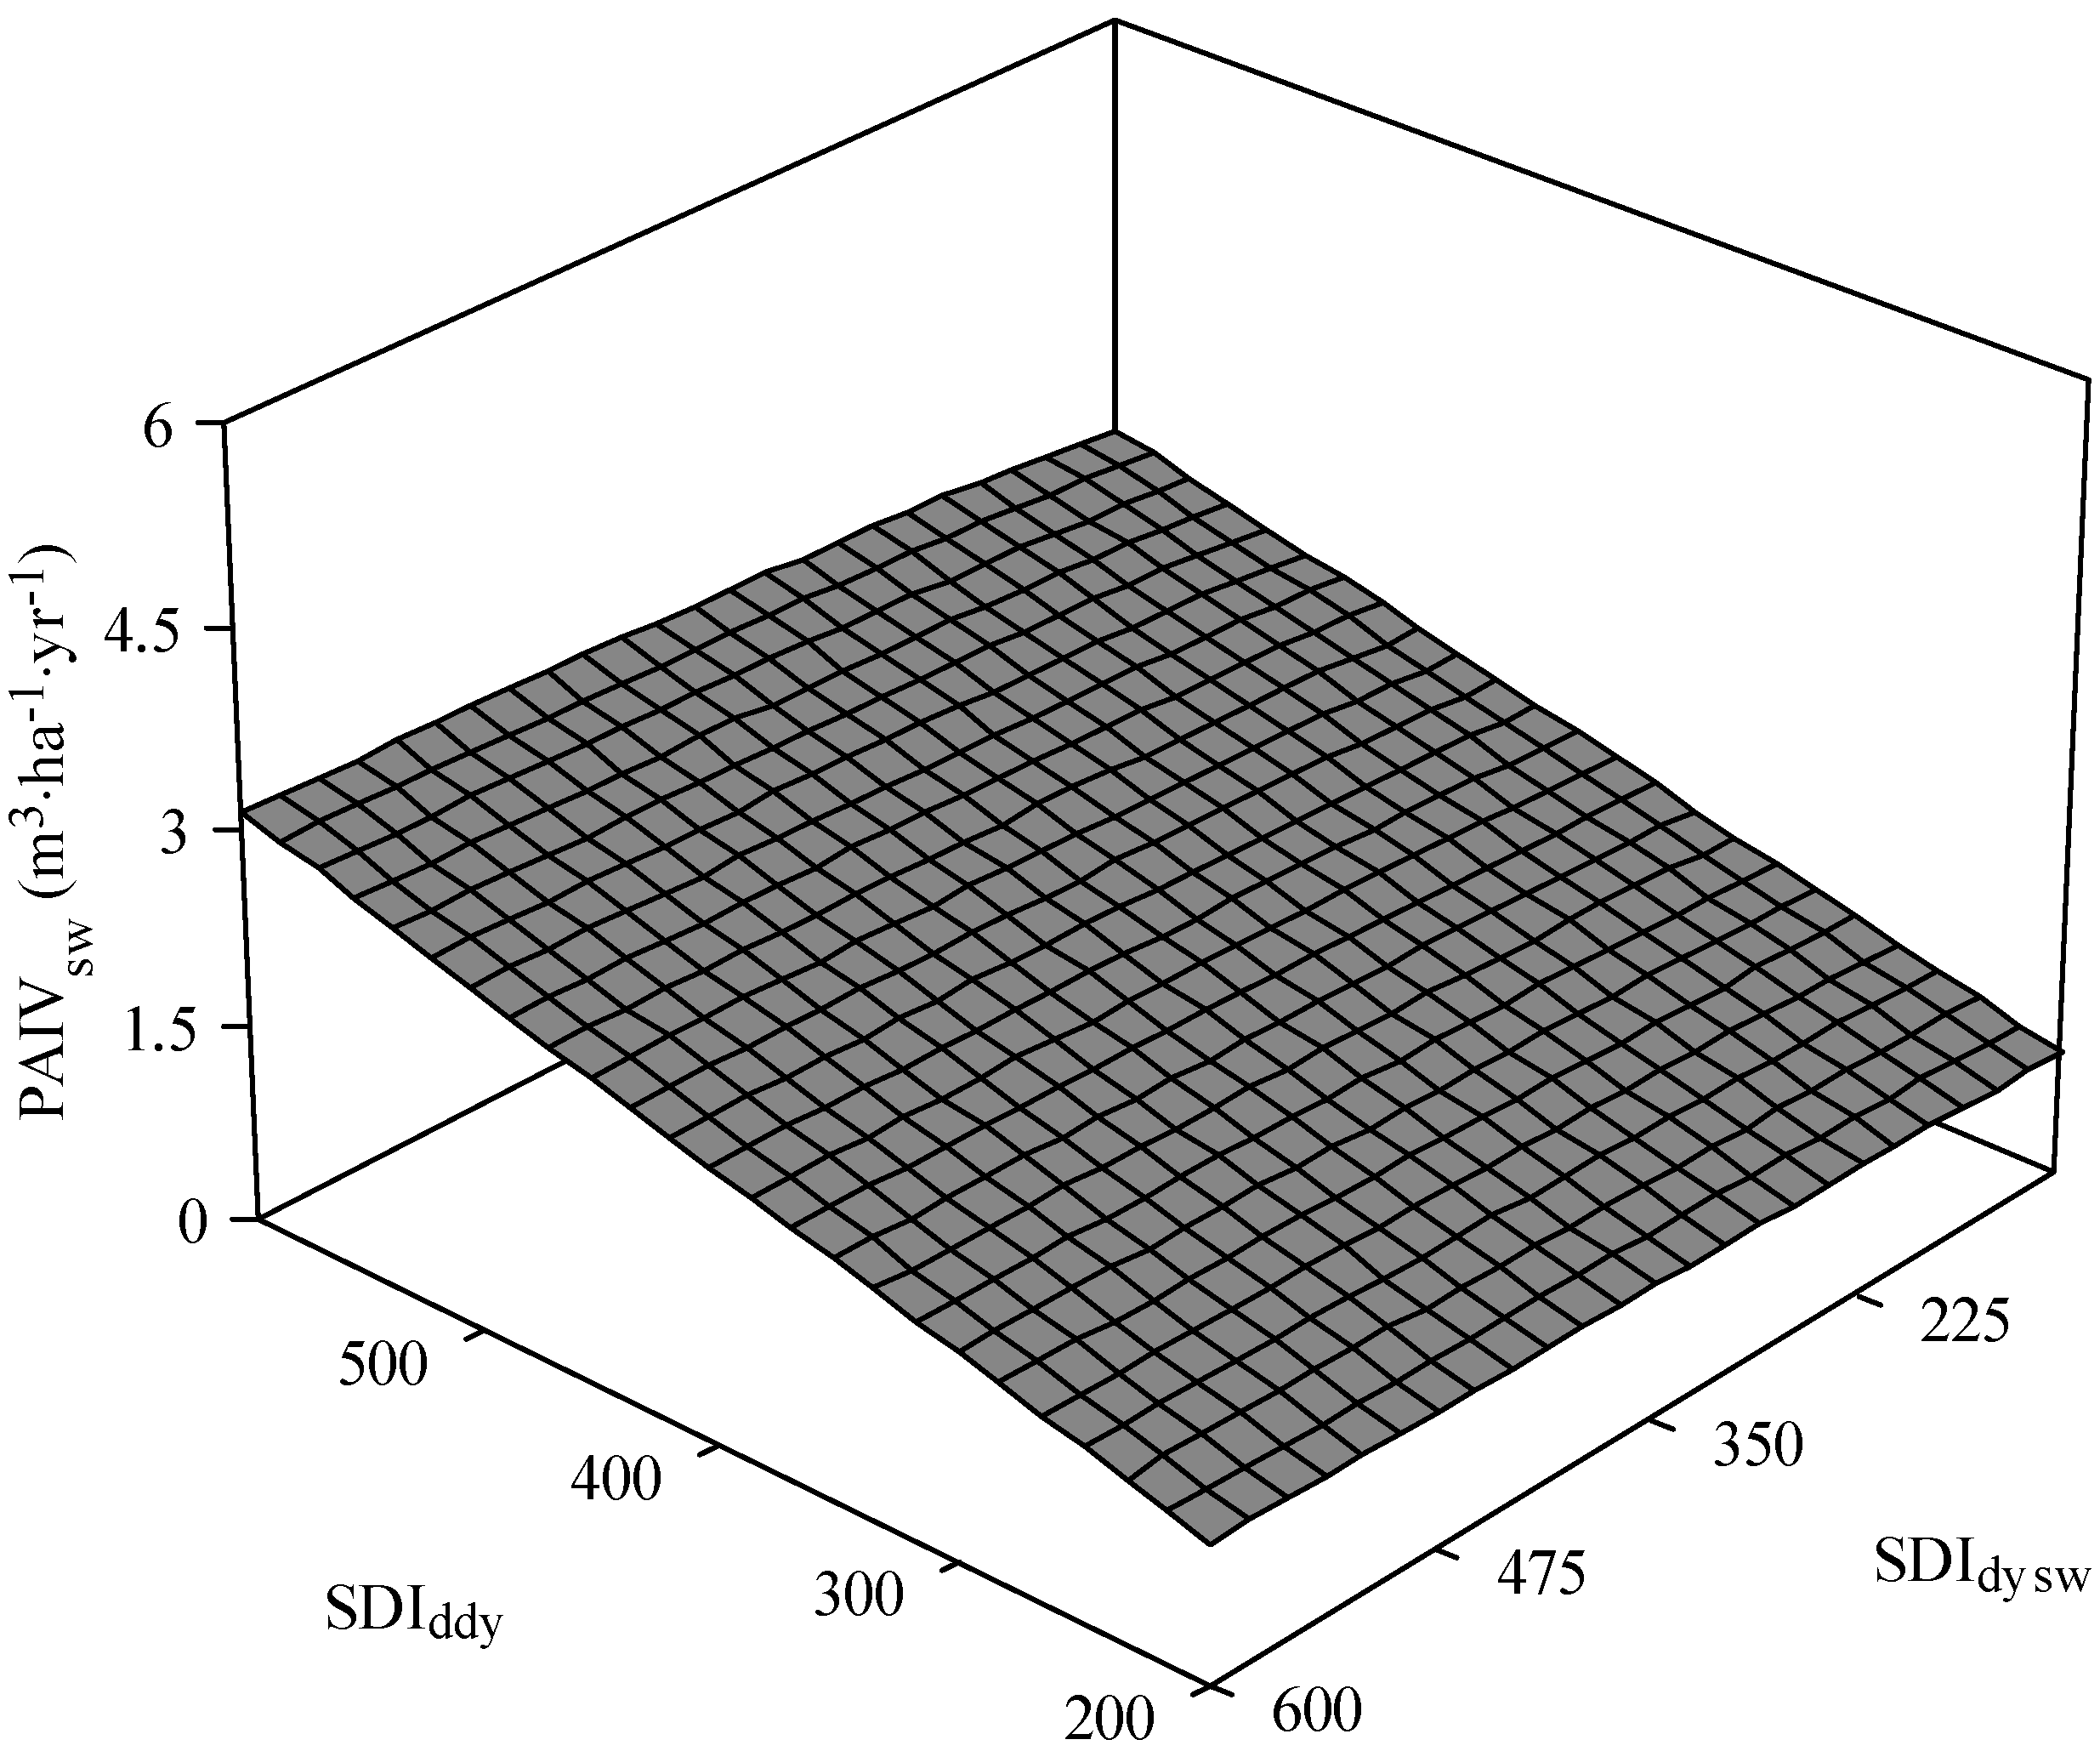
| PAIVsw = β0 × SDIdydβ1 × SDIdyswβ2 × HTswβ3 × HTawβ4 | 187.7 | 0.001 (0.001) {2.1} | 0.99 (0.09) {0.11} | 0.06 (0.04) {0.15} | 0.32 (0.18) {−0.05} | 0.15 (0.23) {0.16} | 0.84 | |
| PAIVsw = β0 × BAHdecβ1 × BAHswβ2 × HTswβ3 × HTawβ4 | 194.6 | 0.02 (0.17) {2.0} | 0.06 (0.04) {0.17} | 0.94 (0.09) {0.14} | 0.61 (0.18) {−0.03} | 0.04 ** (0.21) {0.15} | 0.83 | |
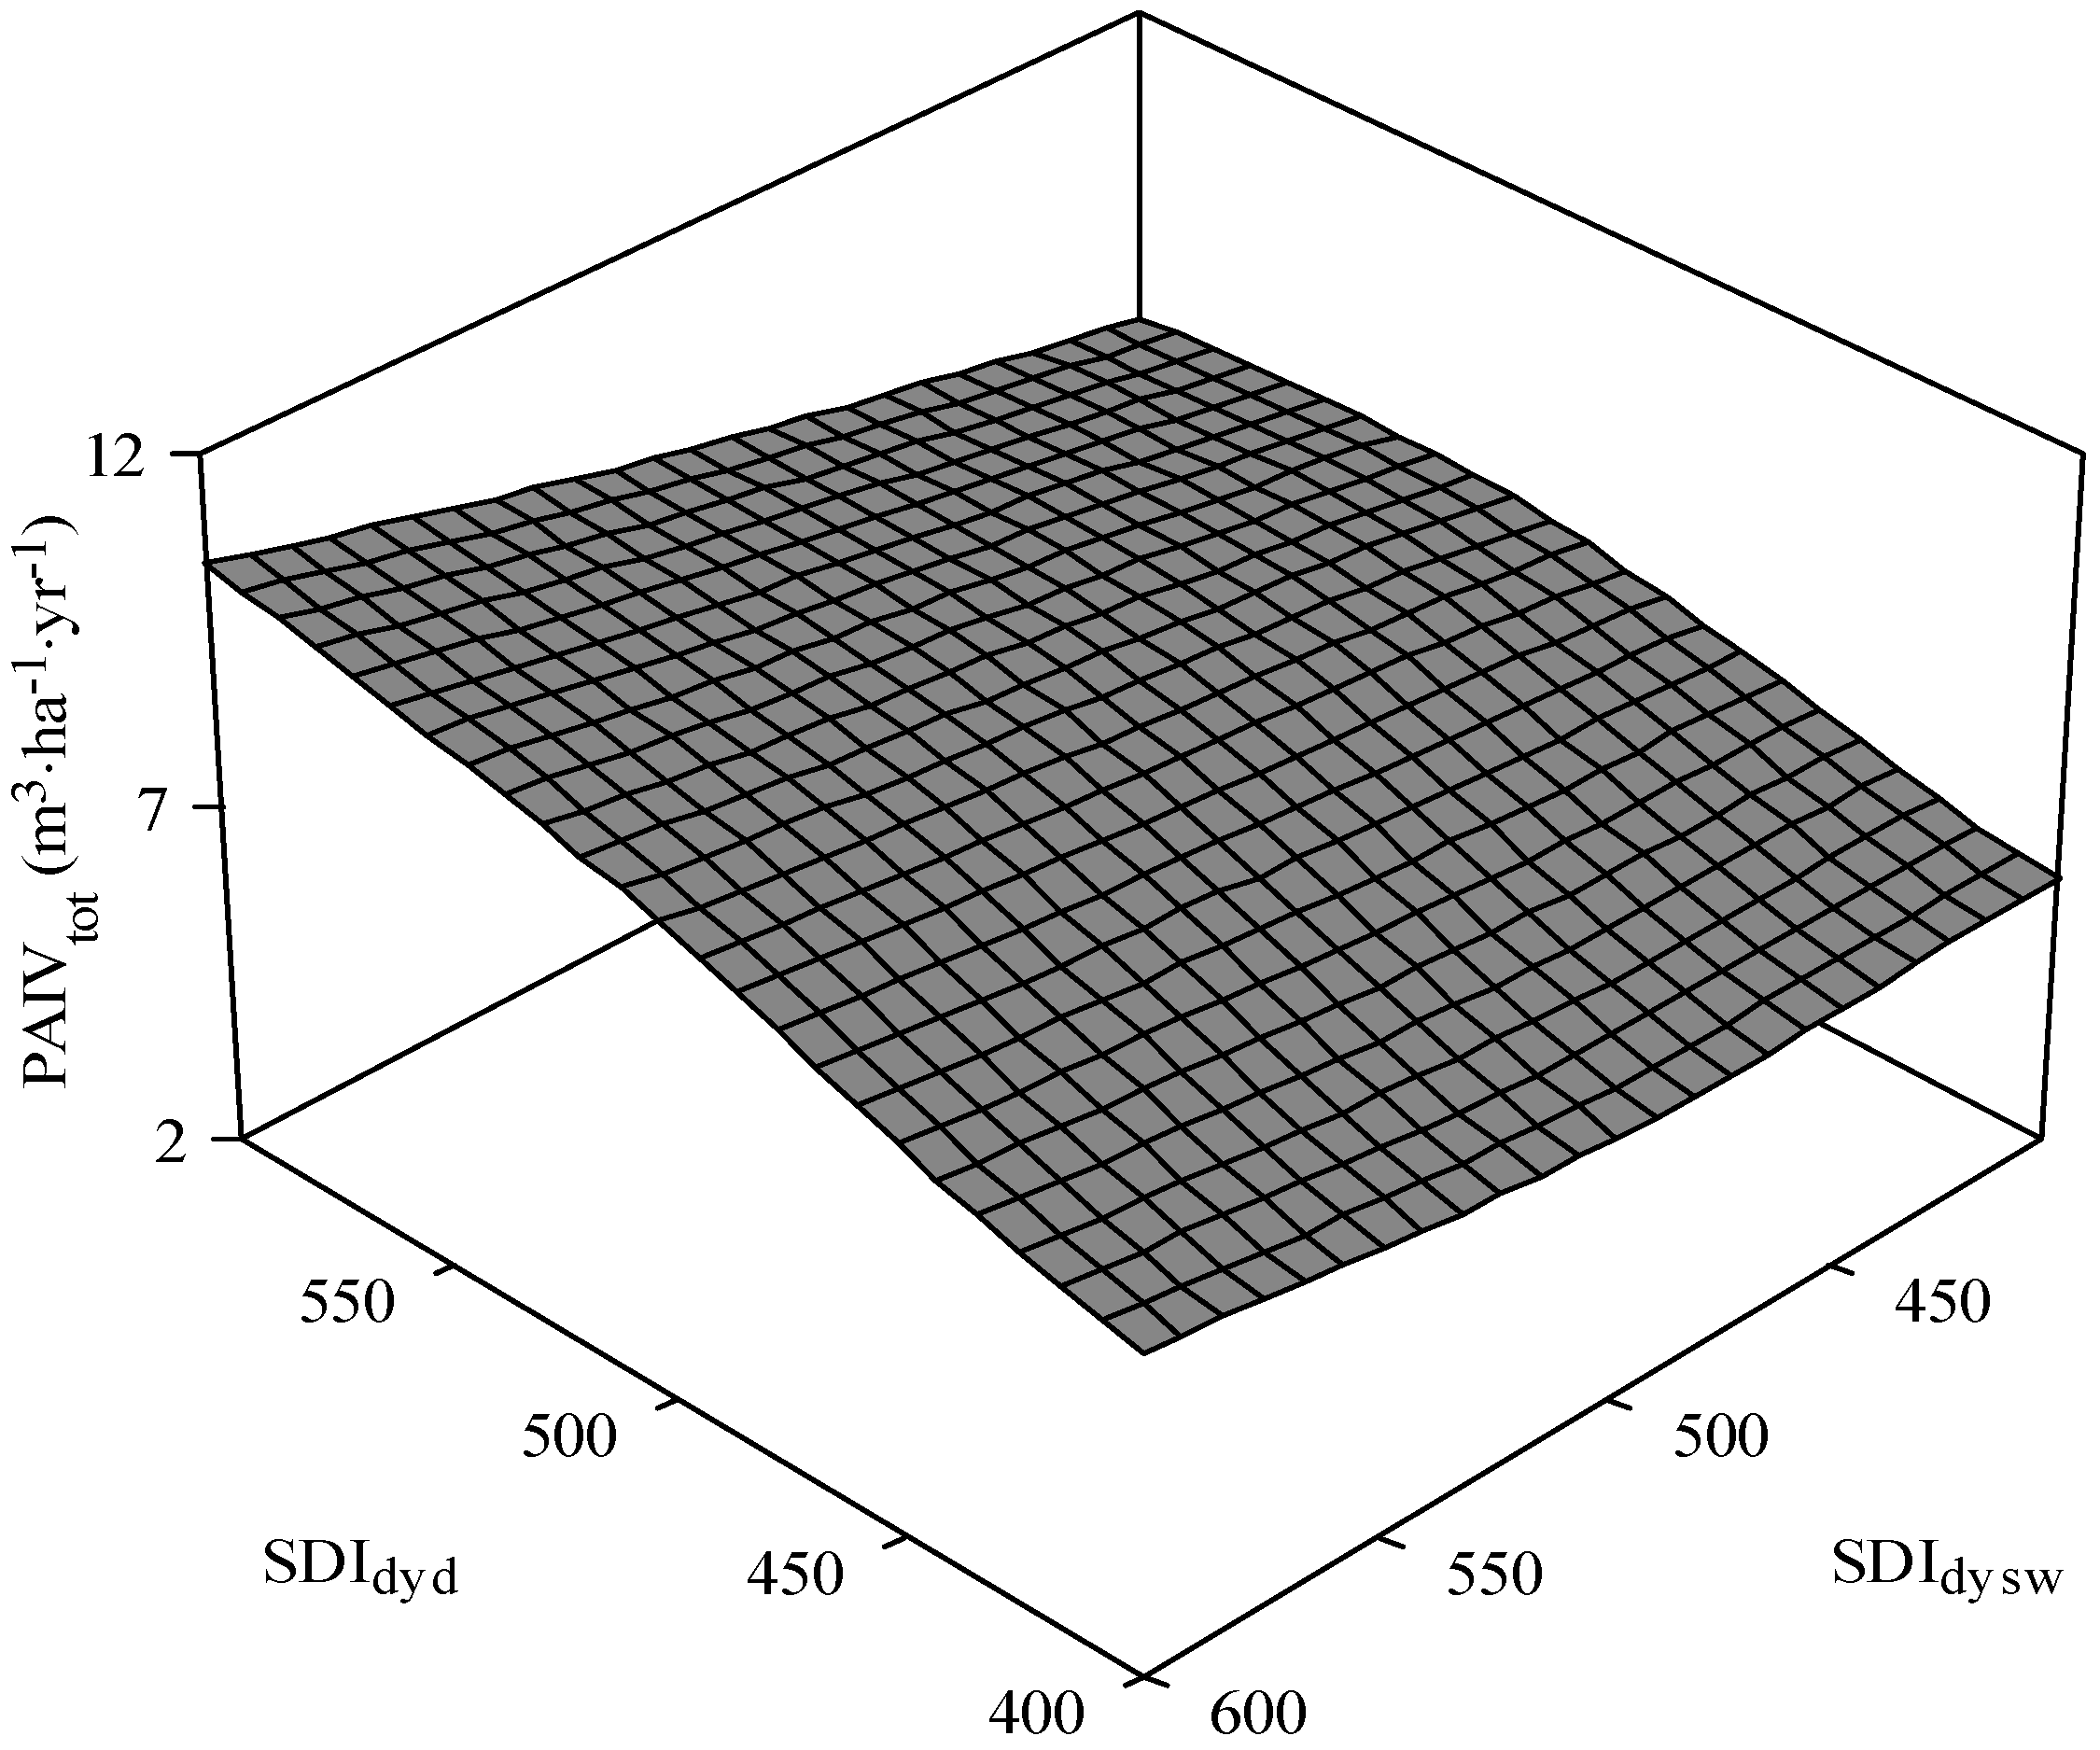
| PAIVtot = β0 × SDIdyswβ1 × SDIdydβ2 × HTswβ3 × HTawβ4 × PBAdecβ5 | 540.0 | 0.222 (0.16) {1.08} | −0.03 (0.03) {0.07} | 0.99 (0.17) {0.06} | 0.11 (0.14) {−0.05} | 0.31 (0.21) {0.11} | −0.93 (0.17) {−0.06} | 0.31 |
| PAIVtot = β0 × BAHdecβ1 × BAHswβ2 × HTswβ3 × HTawβ4 × PBAdecβ5 | 545.7 | 4.0 (2.5) {1.4} | 0.95 (0.16) {0.06} | −0.09 (0.03) {0.06} | 0.04 ** (0.14) {−0.04} | 0.32 (0.21) {0.11} | −0.88 (0.17) {–0.07} | 0.30 |
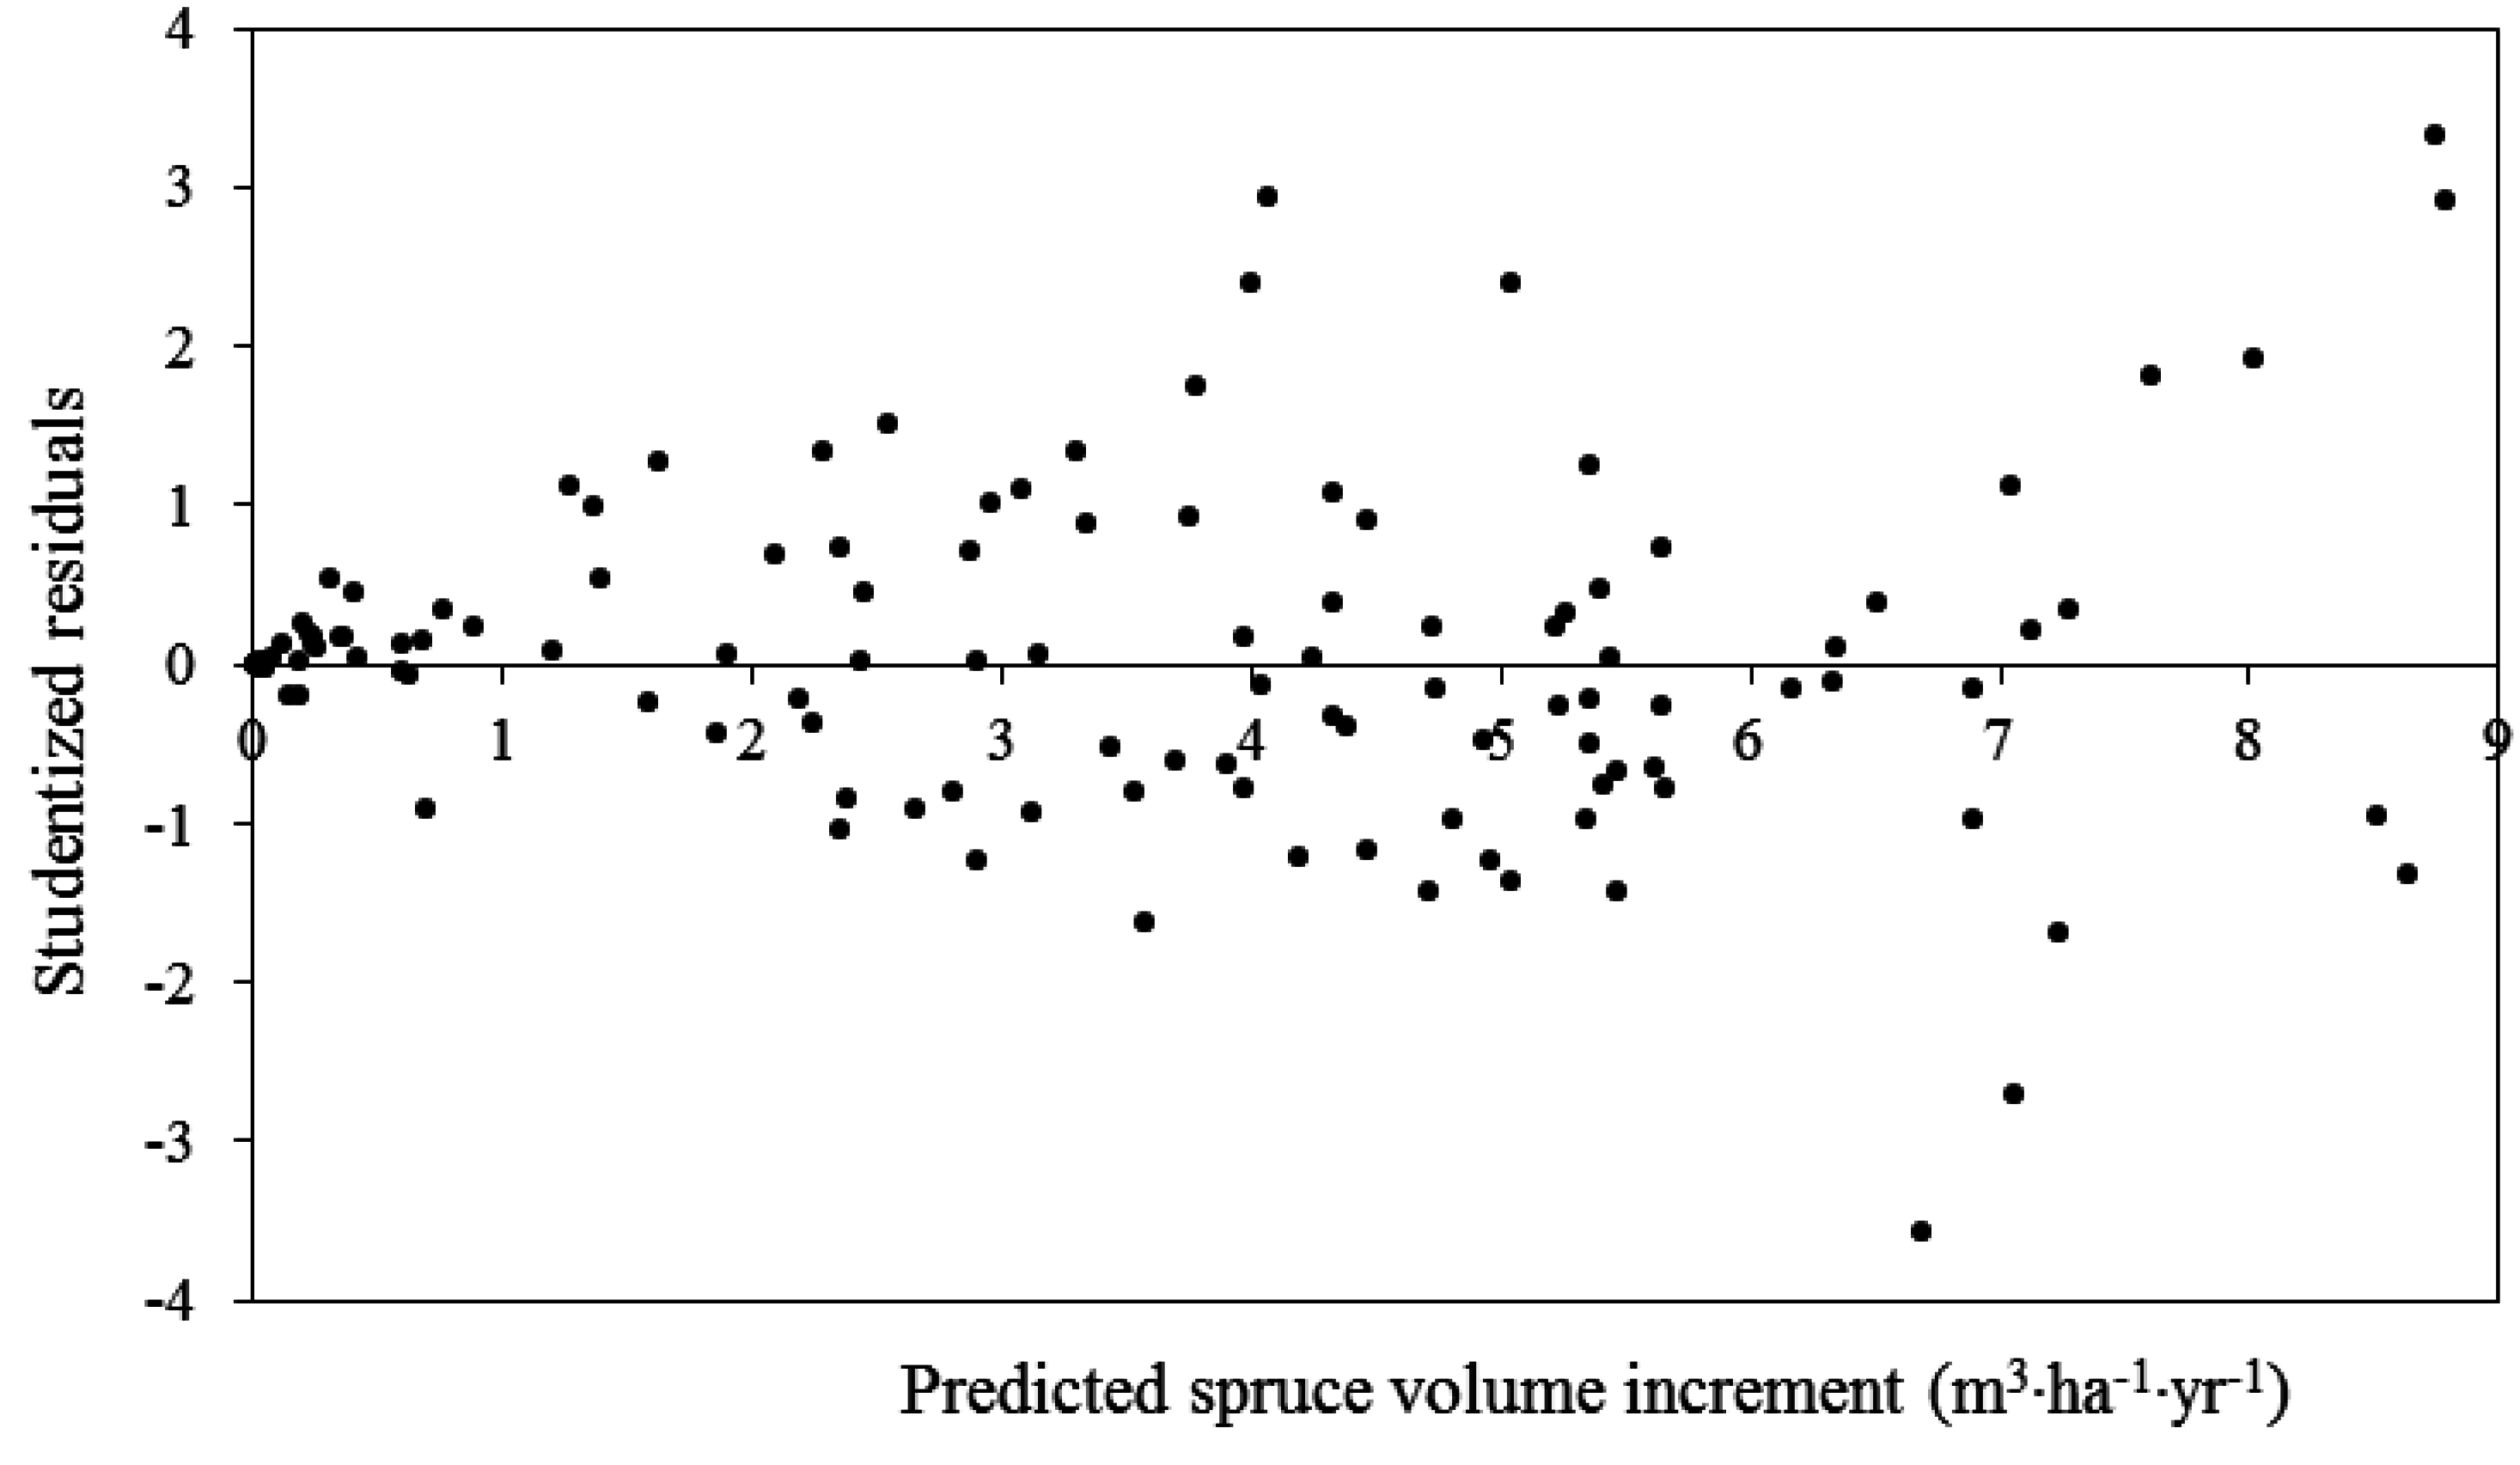
3.2. White Spruce PAI in Volume


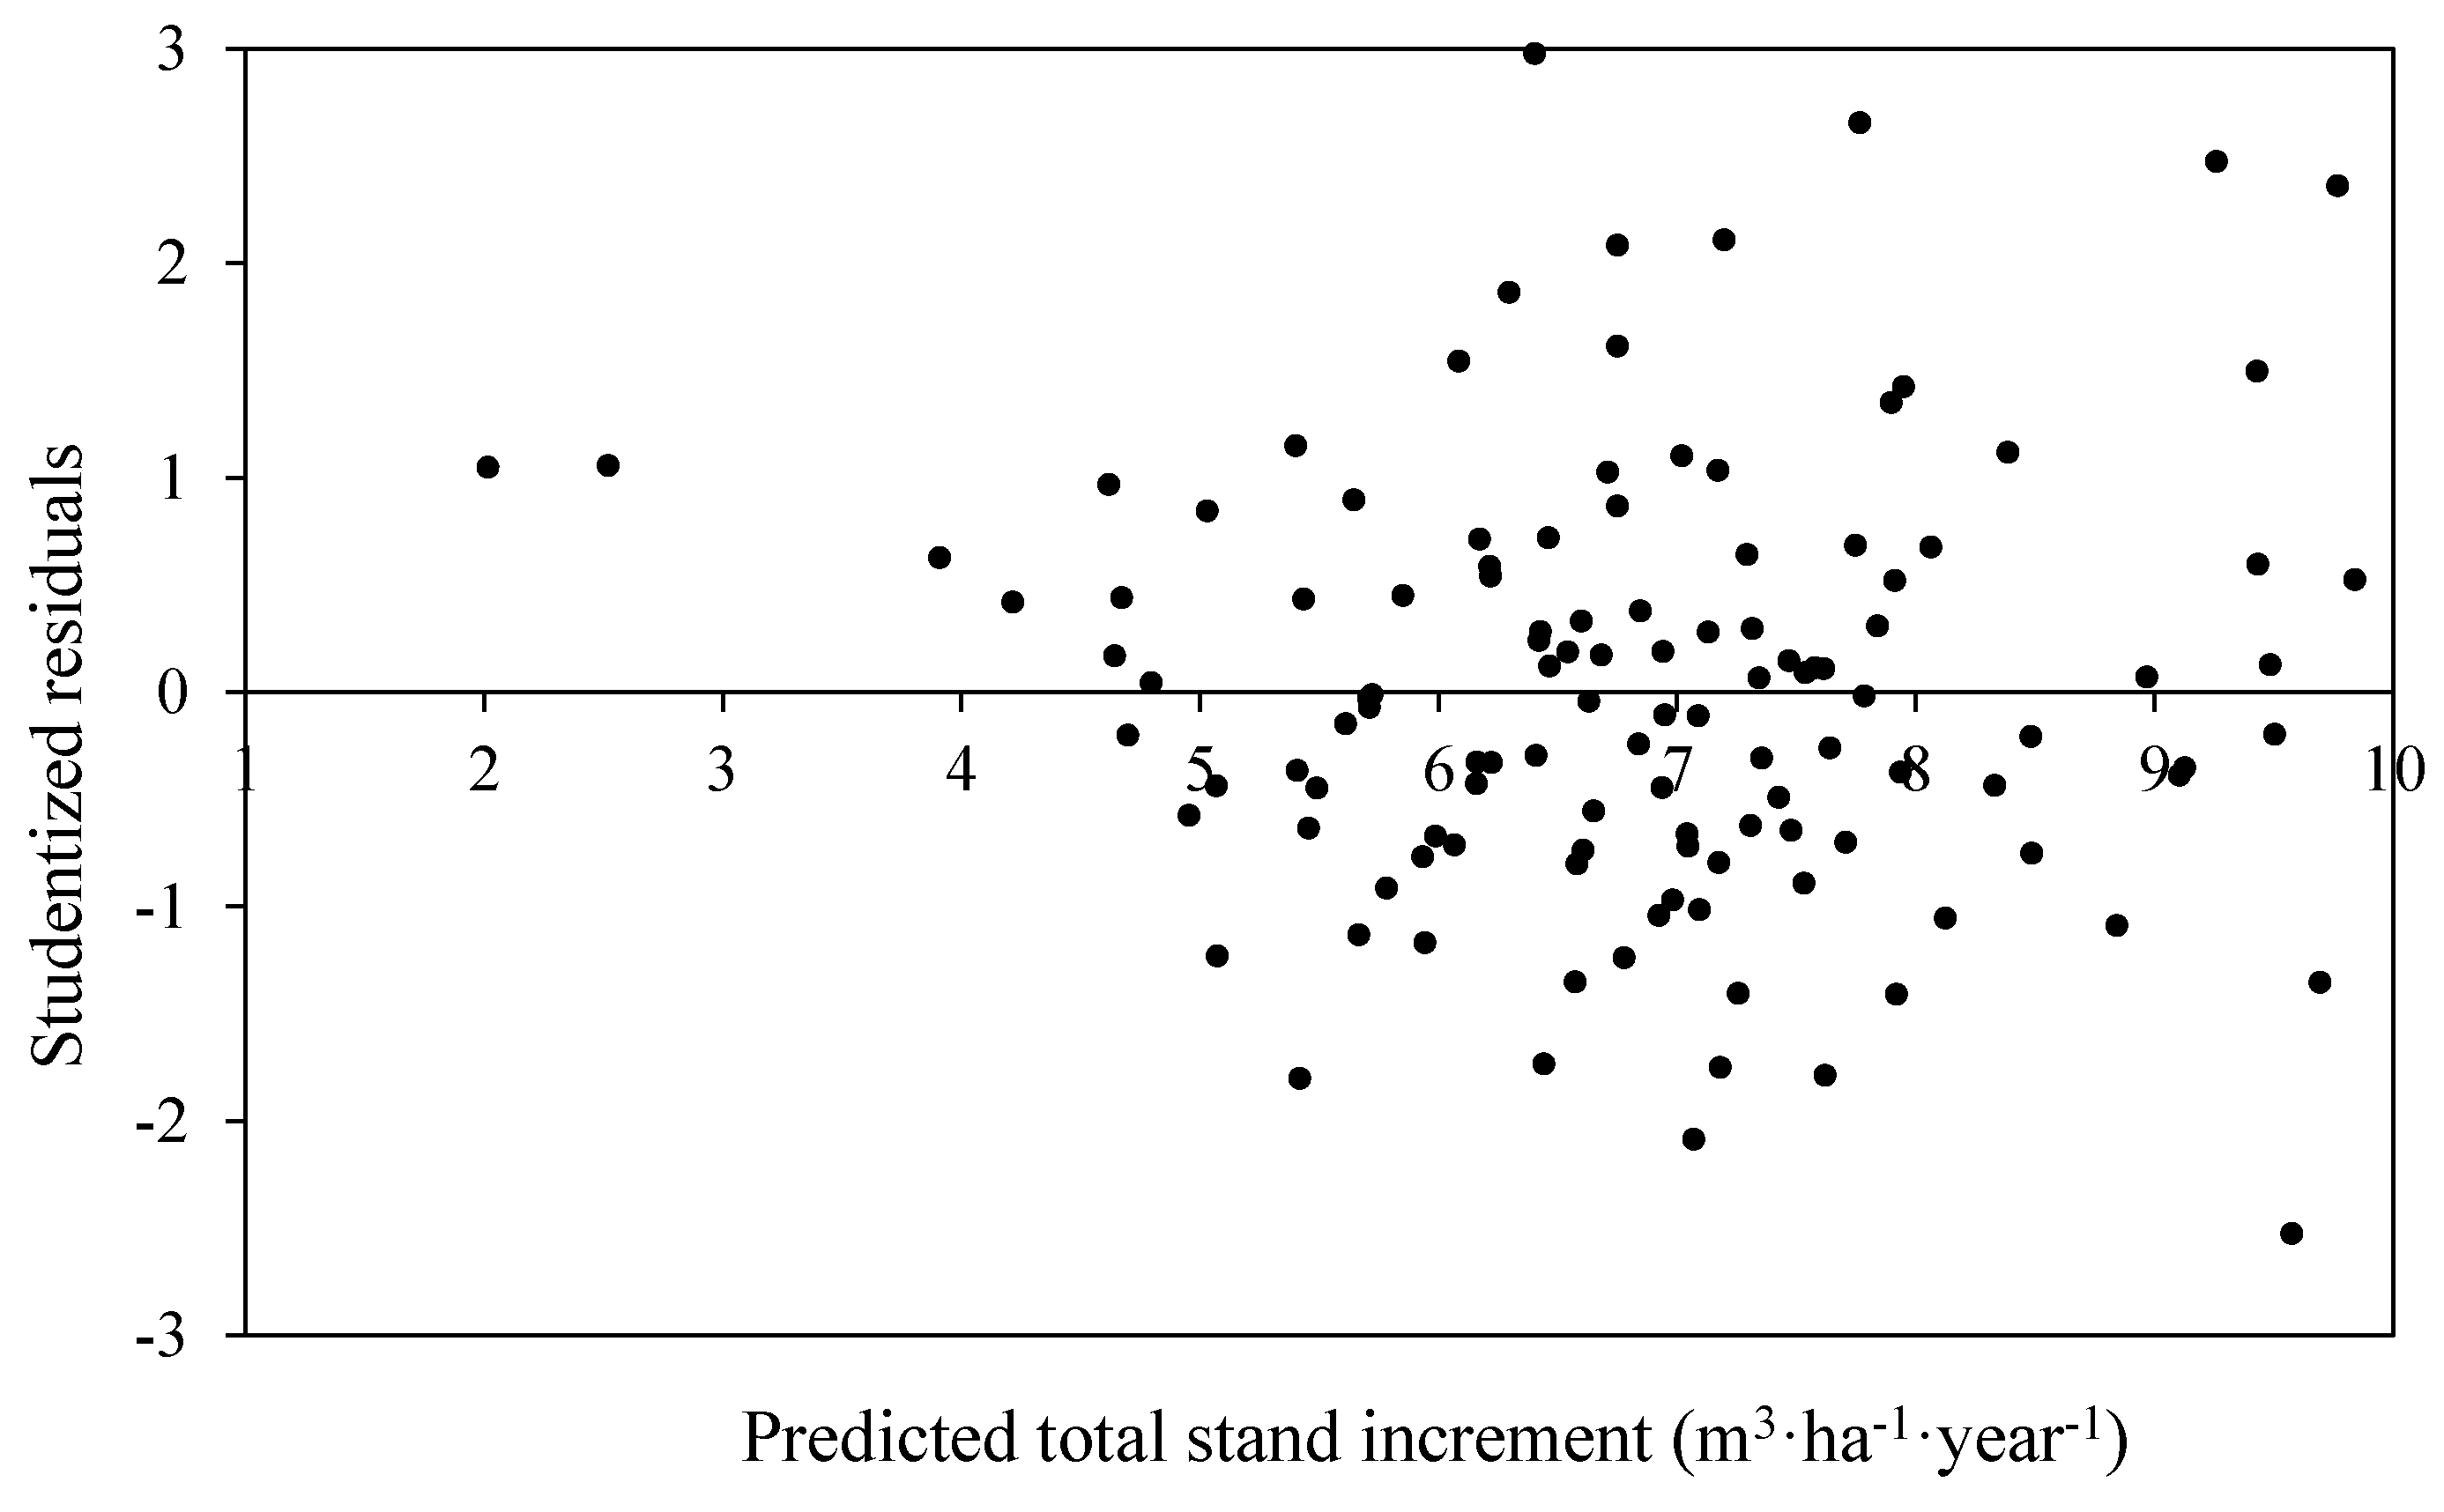
3.3. Total Stand PAI in Volume

4. Discussion
5. Conclusions
Acknowledgments
Author Contributions
Conflicts of Interest
References
- Drew, T.J.; Flewelling, W. Some recent Japanese theories of yield-density relationships and their application to Monterey pine plantations. For. Sci. 1977, 23, 517–534. [Google Scholar]
- Nyland, R.D. Silviculture: Concepts and Applications; Waveland Press Inc.: Long Grove, IL, USA, 2002; pp. 372–375. [Google Scholar]
- Davis, L.S.; Johnson, K.N.; Bettinger, P.; Howard, T.E. Forest Management: To Sustain Ecological, Economic, and Social Value, 4th ed.; Waveland Press Inc.: Long Grove, IL, USA, 2001; pp. 131–181. [Google Scholar]
- Smith, D.M.; Larson, B.C.; Kelty, M.J.; Ashton, P.M.S. The Practice of Silviculture: Applied Forest Ecology, 9th ed.; John Wiley & Sons: Hoboken, NJ, USA, 1997; pp. 69–98. [Google Scholar]
- Pretzsch, H. Forest Dynamics, Growth and Yield: From Measurement to Model; Springer-Verlag: Berlin/Heidelberg, Germany, 2009; pp. 1–20. [Google Scholar]
- Helms, J.A. The Dictionary of Forestry; Society of American Foresters: Bethesda, MD, USA, 1998; p. 210. [Google Scholar]
- Reineke, L.H. Perfecting a stand-density index for even-aged forests. J. Agric. Res. 1933, 46, 627–638. [Google Scholar]
- O’Hara, K.L.; Gersonde, R.F. Stocking control concepts in uneven-aged silviculture. Forestry 2004, 77, 131–143. [Google Scholar] [CrossRef]
- Innes, J.C.; Ducey, M.J.; Gove, H.J.; Leak, W.B.; Barrett, J.P. Size-density metrics, leaf area, and productivity in eastern white pine. Can. J. For. Res. 2005, 35, 2469–2478. [Google Scholar] [CrossRef]
- Long, J.N.; Shaw, J.D. The influence of compositional and structural diversity on forest productivity. Forestry 2010, 83, 121–128. [Google Scholar] [CrossRef]
- Vales, D.J.; Bunnell, F.L. Relationships between transmission of solar radiation and coniferous forest stand characteristics. Agric. For. Meteor. 1988, 43, 210–233. [Google Scholar] [CrossRef]
- Curtis, R.O. Stand density measures: An interpretation. For. Sci. 1970, 16, 403–414. [Google Scholar]
- Woodall, C.W.; Miles, P.D.; Vissage, J.S. Determining maximum stand density index in mixed species stands for strategic-scale stocking assessments. For. Ecol. Manag. 2005, 216, 367–377. [Google Scholar] [CrossRef]
- Peterson, E.B.; Peterson, N.M. Ecology, Management, and Use of Aspen and Balsam Poplar in the Prairie Provinces; Canadian Forest Service-Northern Forestry Center: Edmonton, AB, Canada, 1992; Volume 1, p. 252. [Google Scholar]
- Chen, H.Y.H.; Popadiouk, R.V. Dynamics of North American boreal mixedwoods. Environ. Rev. 2002, 10, 137–166. [Google Scholar] [CrossRef]
- Man, R.; Lieffers, V.J. Are mixtures of aspen and white spruce more productive than single species stands? For. Chron. 1999, 75, 505–513. [Google Scholar] [CrossRef]
- Comeau, P.G.; Kabzems, R.; McClarnon, J.; Heineman, J.L. Implications of selected approaches for regenerating and managing western boreal mixedwoods. For. Chron. 2005, 81, 559–574. [Google Scholar] [CrossRef]
- Filipescu, C.; Comeau, P.G. Aspen competition affects light and white spruce growth across several boreal sites in western Canada. Can. J. For. Res. 2007, 37, 1701–1713. [Google Scholar] [CrossRef]
- Filipescu, C.; Comeau, P.G. Competitive interactions between aspen and white spruce vary with stand age in boreal mixedwoods. For. Ecol. Manag. 2007, 247, 175–184. [Google Scholar] [CrossRef]
- Kelty, M.J. Comparative productivity of monocultures and mixed species stands. In The Ecology and Silviculture of Mixed Species Forests; Kelty, M.J., Larson, B.C., Eds.; Kluwer Academic Publishers: Dordrecht, The Netherlands, 1992; pp. 125–141. [Google Scholar]
- Kelty, M.J. The role of species mixtures in plantations forestry. For. Ecol. Manag. 2006, 233, 195–204. [Google Scholar] [CrossRef]
- Jose, S.; Williams, R.; Zamora, D. Belowground ecological interactions in mixed-species forest plantations. For. Ecol. Manag. 2006, 233, 231–239. [Google Scholar] [CrossRef]
- Vandermeer, J. The Ecology of Intercropping; Cambridge University Press: Cambridge, MA, USA, 1989; p. 237. [Google Scholar]
- Forrester, D.I. The spatial and temporal dynamics of species interactions in mixed-species forests: From pattern to process. For. Ecol. Manag. 2014, 312, 282–292. [Google Scholar] [CrossRef]
- MacPherson, D.M.; Lieffers, V.J.; Blenis, P.V. Productivity of aspen stands with and without a spruce understory in Alberta’s boreal mixedwood forests. For. Chron. 2001, 77, 351–356. [Google Scholar] [CrossRef]
- MacDonald, G.B. The emergence of boreal mixedwood management in Ontario: Background and prospects. In Advancing Boreal Mixedwood Management in Ontario; Smith, C.R., Crook, G.W., Eds.; Natural Resources Canada-CFS: Sault Ste. Marie, ON, Canada, 1996; p. 11. [Google Scholar]
- Lieffers, V.J.; Stadt, K.J. Growth of understory Picea glauca, Calamagrostis canadensis, and Epilobium angustifolium in relation to overstory light transmission. Can. J. For. Res. 1994, 24, 1193–1198. [Google Scholar] [CrossRef]
- Constabel, A.J.; Lieffers, V.J. Seasonal patterns of light transmission through boreal mixedwood canopies. Can. J. For. Res. 1996, 26, 1008–1014. [Google Scholar] [CrossRef]
- Groot, A.; Carlson, D.W. Influence of shelter on night temperatures, frost damage, and bud break of white spruce seedlings. Can. J. For. Res. 1996, 26, 1531–1538. [Google Scholar] [CrossRef]
- Groot, A. Effects of shelter and competition on the early growth of planted white spruce (Picea glauca). Can. J. For. Res. 1999, 29, 1002–1014. [Google Scholar] [CrossRef]
- Comeau, P.; Filipescu, C.N.; Kabzems, R.; DeLong, C. Early growth of white spruce underplanted beneath spaced and unspaced aspen stands in northeastern B.C. Can. J. For. Res. 2004, 34, 2277–2283. [Google Scholar] [CrossRef]
- Oliver, C.D.; Larson, B.C. Forest Stand Dynamics; Wiley: New York, NY, USA, 1996; p. 520. [Google Scholar]
- Beckingham, J.D.; Archibald, J.H. Field Guide to Ecosites of Northern Alberta; Special Report No 5; Natural Resources Canada; Canadian Forest Service-Northern Forestry Centre: Edmonton, AB, Canada, 1996. [Google Scholar]
- Forest Management Branch. Permanent Sample Plot (PSP) Field Procedures Manual; Alberta Sustainable Resource Development, Public Lands and Forest Division: Edmonton, AB, Canada, 2005. [Google Scholar]
- Huang, S.; Titus, S.J.; Lakusta, T.W.; Held, R.J. Ecologically Based Individual Tree Height-Diameter Models for Major Alberta Tree Species; Alberta Environment Protection, Land and Forest Services, Forest Management Division: Edmonton, AB, Canada, 1994; p. 27. [Google Scholar]
- Huang, S. Individual Tree Volume Estimation Procedures for Alberta: Methods for Formulation and Statistical Foundations; Technical Report # 1; Forest Resources Information Branch Land and Forest Services: Edmonton, AB, Canada, 1994; p. 80. [Google Scholar]
- Reyes-Hernandez, V.; Comeau, P.G.; Bokalo, M. Static and dynamic maximum size-density relationships for mixed trembling aspen and white spruce stands in western Canada. For. Ecol. Manag. 2013, 289, 300–311. [Google Scholar] [CrossRef]
- Long, J.N.; Daniel, T.W. Assessment of growing stock in uneven-aged stands. West. J. Appl. For. 1990, 5, 93–96. [Google Scholar]
- Shaw, J.D. Application of stand density index to irregularly structured stands. West. J. Appl. For. 2000, 15, 40–42. [Google Scholar]
- SAS. Statistical Analysis System for Windows; Ver. 9.2; SAS Institute: Cary, NC, USA, 2010. [Google Scholar]
- Ratkowsky, D.A. Handbook of Nonlinear Regression; Marcel Dekker Inc.: New York, NY, USA, 1990; p. 241. [Google Scholar]
- Yang, R.C. Growth Response of White Spruce to Release from Trembling Aspen; Information report NOR-X-302; Canadian Forest Service, Northern Forestry Centre: Edmonton, AB, Canada, 1989; p. 24. [Google Scholar]
- Légaré, S.; Paré, D.; Bergeron, Y. The responses of black spruce growth to an increased proportion of aspen in mixed stands. Can. J. For. Res. 2004, 34, 405–416. [Google Scholar] [CrossRef]
- Huang, J.G.; Stadt, K.J.; Dawson, A.; Comeau, P.G. Modelling growth-competition relationships in trembling aspen and white spruce mixed boreal forests of western Canada. PLoS ONE 2013, 8, e77607. [Google Scholar] [CrossRef] [PubMed]
- Westoby, M. The self-thinning rule. Adv. Ecol. Res. 1984, 14, 167–225. [Google Scholar]
- Weiskittel, A.; Gound, P.; Temesgen, H. Source of variation in the self-thinning boundary line for three species with varying levels of shade tolerance. For. Sci. 2009, 55, 84–93. [Google Scholar]
- Newton, P.F. Evaluating the Ecological Integrity of Structural Stand Density Management Models Developed for Boreal Conifers. Forests 2015, 6, 992–1030. [Google Scholar] [CrossRef]
- DeBell, D.S.; Harms, W.R.; Whitesel, C.D. Stockability: A major factor in productivity differences between Pinus taeda plantations in Hawaii and the southeastern United States. For. Sci. 1989, 35, 708–719. [Google Scholar]
- Harms, W.R.; DeBell, D.S.; Whitesell, C.D. Stand and tree characteristics and stockability in Pinus taeda plantations in Hawaii and South Carolina. Can. J. For. Res. 1994, 24, 511–521. [Google Scholar] [CrossRef]
- Harms, W.R.; Whitesell, C.D.; DeBell, D.S. Growth and development of loblolly pine in a spacing trial planted in Hawaii. For. Ecol. Manag. 2000, 126, 13–24. [Google Scholar] [CrossRef]
- Comeau, P.G.; White, M.; Kerr, G.; Hale, S.E. Maximum density-size relationships for Sitka spruce and coastal Douglas-fir in Britain and Canada. Forestry 2010, 83, 461–468. [Google Scholar] [CrossRef]
- Kozlowski, T.T.; Kramer, P.J.; Pallardy, S.G. The Physiological Ecology of Woody Plants; Academic Press: New York, NY, USA, 1991; p. 657. [Google Scholar]
- Callaway, R.M.; Walker, L.R. Competition and facilitation: A synthetic approach to interactions in plant communities. Ecology 1997, 78, 1958–1965. [Google Scholar] [CrossRef]
- Holmgren, M.; Scheffer, M.; Huston, M.A. The interplay of facilitation and competition in plant communities. Ecology 1997, 78, 1966–1975. [Google Scholar] [CrossRef]
- Langsaeter, A. Om tynning i enaldret gran-og furuskog (About thinning in even-aged stands of spruce, fir and pine). Medd. f.d. Nor. Skogforsoksves. 1941, 8, 131–216. [Google Scholar]
- Garber, S.M.; Maguire, D.A. Stand productivity and development in two mixed-species spacing trials in the Central Oregon Cascades. For. Sci. 2004, 50, 92–105. [Google Scholar]
- Pretzsch, H.; Block, J.; Dieler, J.; Dong, P.H.; Kohnle, U.; Nagel, J.; Spellman, H.; Zingg, A. Comparison between the productivity of pure and mixed stands of Norway spruce and European beech along an ecological gradient. Ann. For. Sci. 2010, 67, 712. [Google Scholar] [CrossRef]
© 2015 by the authors; licensee MDPI, Basel, Switzerland. This article is an open access article distributed under the terms and conditions of the Creative Commons by Attribution (CC-BY) license (http://creativecommons.org/licenses/by/4.0/).
Share and Cite
Reyes-Hernández, V.J.; Comeau, P.G. The Influence of Stocking and Stand Composition on Productivity of Boreal Trembling Aspen-White Spruce Stands. Forests 2015, 6, 4573-4587. https://doi.org/10.3390/f6124387
Reyes-Hernández VJ, Comeau PG. The Influence of Stocking and Stand Composition on Productivity of Boreal Trembling Aspen-White Spruce Stands. Forests. 2015; 6(12):4573-4587. https://doi.org/10.3390/f6124387
Chicago/Turabian StyleReyes-Hernández, Valentín J., and Philip G. Comeau. 2015. "The Influence of Stocking and Stand Composition on Productivity of Boreal Trembling Aspen-White Spruce Stands" Forests 6, no. 12: 4573-4587. https://doi.org/10.3390/f6124387
APA StyleReyes-Hernández, V. J., & Comeau, P. G. (2015). The Influence of Stocking and Stand Composition on Productivity of Boreal Trembling Aspen-White Spruce Stands. Forests, 6(12), 4573-4587. https://doi.org/10.3390/f6124387