Article

Applying Resilience Concepts in Forest Management: A Retrospective Simulation Approach

Ministry of Forests, Lands and Natural Resource Operations, Government of British Columbia, PO Box 9515 Stn, Provincial Government, Victoria, BC V8W 9C2, Canada
*
Author to whom correspondence should be addressed.
Forests 2015, 6(12), 4421-4438; https://doi.org/10.3390/f6124377
Submission received: 4 September 2015 / Revised: 9 November 2015 / Accepted: 19 November 2015 / Published: 1 December 2015

Abstract

:
Increasing the resilience of ecological and sociological systems has been proposed as an option to adapt to changing future climatic conditions. However, few studies test the applicability of those strategies to forest management. This paper uses a real forest health incident to assess the ability of forest management strategies to affect ecological and economic resilience of the forest. Two landscape scale strategies are compared to business as usual management for their ability to increase resilience to a climate-change induced mountain pine beetle outbreak in the Kamloops Timber Supply Area, British Columbia, Canada for the period 1980 to 2060. Proactive management to reduce high risk species while maintaining or increasing diversity through reforestation was found to be more resilient in terms of the metrics: post-disturbance growing stock, improved volume and stability of timber flow, and net revenue. However, landscape-scale indicators of diversity were little affected by management. Our results were robust to uncertainty in tree growth rates and timber value and show that adapting to climate change through improving the resilience of forested landscapes is an economically viable option.

1. Introduction

The 5th Assessment of the Intergovernmental Panel on Climate Change, Working Group II [1] identified with high confidence that under climate change there is a “Risk of loss of terrestrial and inland water ecosystems, biodiversity, and the ecosystem goods, functions, and services they provide for livelihoods”. Their report indicates that adaptation of our management systems is necessary to reduce impacts on society. The economic value of ecosystem services to society is high; for example, Costanza et al. [2] estimated an annual value in 2011 of 124.8 × 10¹² 2007 US$. Projected changes to forests under a changing climate include increased disturbance by fire, wind, pests and disease, and changes in survival and growth of species [3,4,5]. However, uncertainty is high as to where and when problems will develop, the degree of mortality and the magnitude of gains or losses in growth and, therefore, the socio-economic consequences. Parts of the western North America have already experienced biophysical, economic and social impacts as a result of a mountain pine beetle (Dendroctonus ponderosae Hopkins) epidemic [5] triggered mainly by milder winters as the climate warms [6].
If we expect a continuous flow of ecological goods and services in the future, then strategies to adapt to climate change are an important consideration for current forest management [1,7,8]. One framework to manage under this uncertainty is to increase forests resilience to disturbance [9,10,11,12,13]. In this study we use the resilience definition: “the capacity of a system to absorb disturbance and reorganize while undergoing change so as to still retain essentially the same function, structure, identity, and feedbacks” [14]. According to resilience theory, systems can respond to disturbances by growing along similar pathways as prior to the disturbance, or by reorganizing into a qualitatively different form. Resilience theory can be applied to socio-ecological systems such as forestry, where ecosystems and landscapes affect, and are affected by management practices and institutions [15]. Rist and Moen [16] describe the value of resilience theory as offering new ways to integrate social, economic and ecological interactions and complexity and thereby improving management’s ability to meet the challenges of climate change. One of the ways resilience theory does that is by inherently acknowledging change, disturbance, and uncertainty rather than the constancy and stability of previous forestry paradigms.
Quantifiable resilience indicators for forest management are the subject of a number of recent papers. DeRose and Long [17] provide a thoughtful framework and articulate the challenges of defining measurable indicators that are operationally relevant. They recommend structural and compositional stand and landscape indicators that reflect post-disturbance management goals over a clear time horizon. For example, indicators of resilience to spruce beetle could include surviving large trees (stand) and the potential for future spruce dominance (landscape). Seidl et al. [18] propose using the historical range of variability of two different ecosystem properties to “delineates the past basin of attraction of the system”. Together with social acceptance, the historical range of variability of ecosystem properties can be used to determine if altered disturbance rates are likely to exceed socio-ecological resilience. A third approach was taken by Duveneck and Scheller [19] with a resilience index for post-wildfire landscapes based on the recovery rate of species composition and aboveground biomass. A fourth approach was presented by Dymond et al. [20] where a landscape with greater socio-ecological resilience was defined as having higher species diversity (Shannon Diversity Index), post-disturbance green-tree volume (growing stock), post-disturbance harvest rates, annual net revenue, and net present value (NPV), in addition, more resilient landscapes had more consistent harvest rates and annual net revenue. We chose to follow this last approach because, based on our observations, we think these indicators reflect many aspects of the decision making process of forest planners in North America. The species diversity and volume indicators are similar conceptually to the approach of Duveneck and Scheller [19]. The harvest rate, net revenue, and NPV criteria in particular represent the socio-economic values of private companies, jobs in forest-dependent communities, and rent to land-owners. Only the species diversity indicator is as prescriptive for silviculturalists as recommended by DeRose and Long [17].
Biological diversity is a component of ecosystem resilience where it provides functional redundancy in key ecological processes [21,22]. Biological diversity can contribute to resilience through a bet-hedging effect (insurance hypothesis): buffering the temporal variability of productivity and increasing productivity over time [23]. A second aspect of resilience is the degree of impact on forest ecosystems due to expected pests, disease, and drought. Changing the species, structural, and age class composition through management is another way to potentially lower the severity of disturbances thereby increasing resilience (e.g., [12,13,24,25]). Dymond et al. [20] identified the potential benefits of greater tree species diversity in increasing socio-ecological resilience through proactive management of an extensive insect outbreak. Their study identified short-term reductions in annual net revenue as a trade-off for higher diversity, more consistent growing stocks, harvest rates and greater net revenue over time. However, we need to know how successful similar management strategies might be under different forest conditions.
Adapting to climate change by increasing species and structural complexity of forests will be strongly influenced by past management activities that have produced the current state of the forest. Templi et al. [26] assessed four management strategies to increase both species and structural diversity and reduce susceptibility to disturbance across two landscapes. The key drivers of the provision of ecosystem goods and services were the current conditions of the forest and the past management activities, the timing of climate change impacts, and the adaptive management strategy.
Other examples of landscape scale forestry studies highlight short term and long term tradeoffs in risk management strategies. Steenberg et al. [27] simulated targeting harvesting towards the species expected to be mal-adapted (decreasing productivity) under a changing climate in eastern Canada. That strategy was effective at converting the forest to well-adapted species and maintaining higher stocks of above-ground biomass compared to other management strategies. However, the harvest rate collapsed after the targeted species had been removed. Schou et al. [28] used a simulation approach to model the forest response and resulting economic values of management strategies to move away from an even aged monoculture forest. Harvesting the over-mature forest provided a significant cash flow up-front and reduced the variability between the long-term strategies. This made the choice among options less clear but providing for some planning flexibility. Cameron [12] identified early thinning and planting additional species as options to adapt Sitka spruce stands to a changing climate in Scotland.
Our study builds on the work of Dymond et al. [20] noted above. We consider the Kamloops Timber Supply Area (TSA) in southern British Columbia, adjacent to their Merritt TSA study area. The Kamloops TSA has higher diversity of tree and site conditions than Merritt TSA and therefore could have different ecological and economic responses to similar management strategies. Our assessment uses the mountain pine beetle (Dendroctonus ponderosae) epidemic in a historical retrospective approach to assess two potential management strategies for increasing resilience relative to business as usual. One alternative management strategy increased the species diversity of the tree seedlings being planted. The second alternative strategy decreased the area occupied by a high risk species through targeted harvest and increased species diversity through reforestation. We evaluated socio-ecological resilience using measures of tree species diversity, post-disturbance growing stock, net present value and revenue flow over the management unit as a whole, for the period 1980 to 2060.

2. Experimental Section
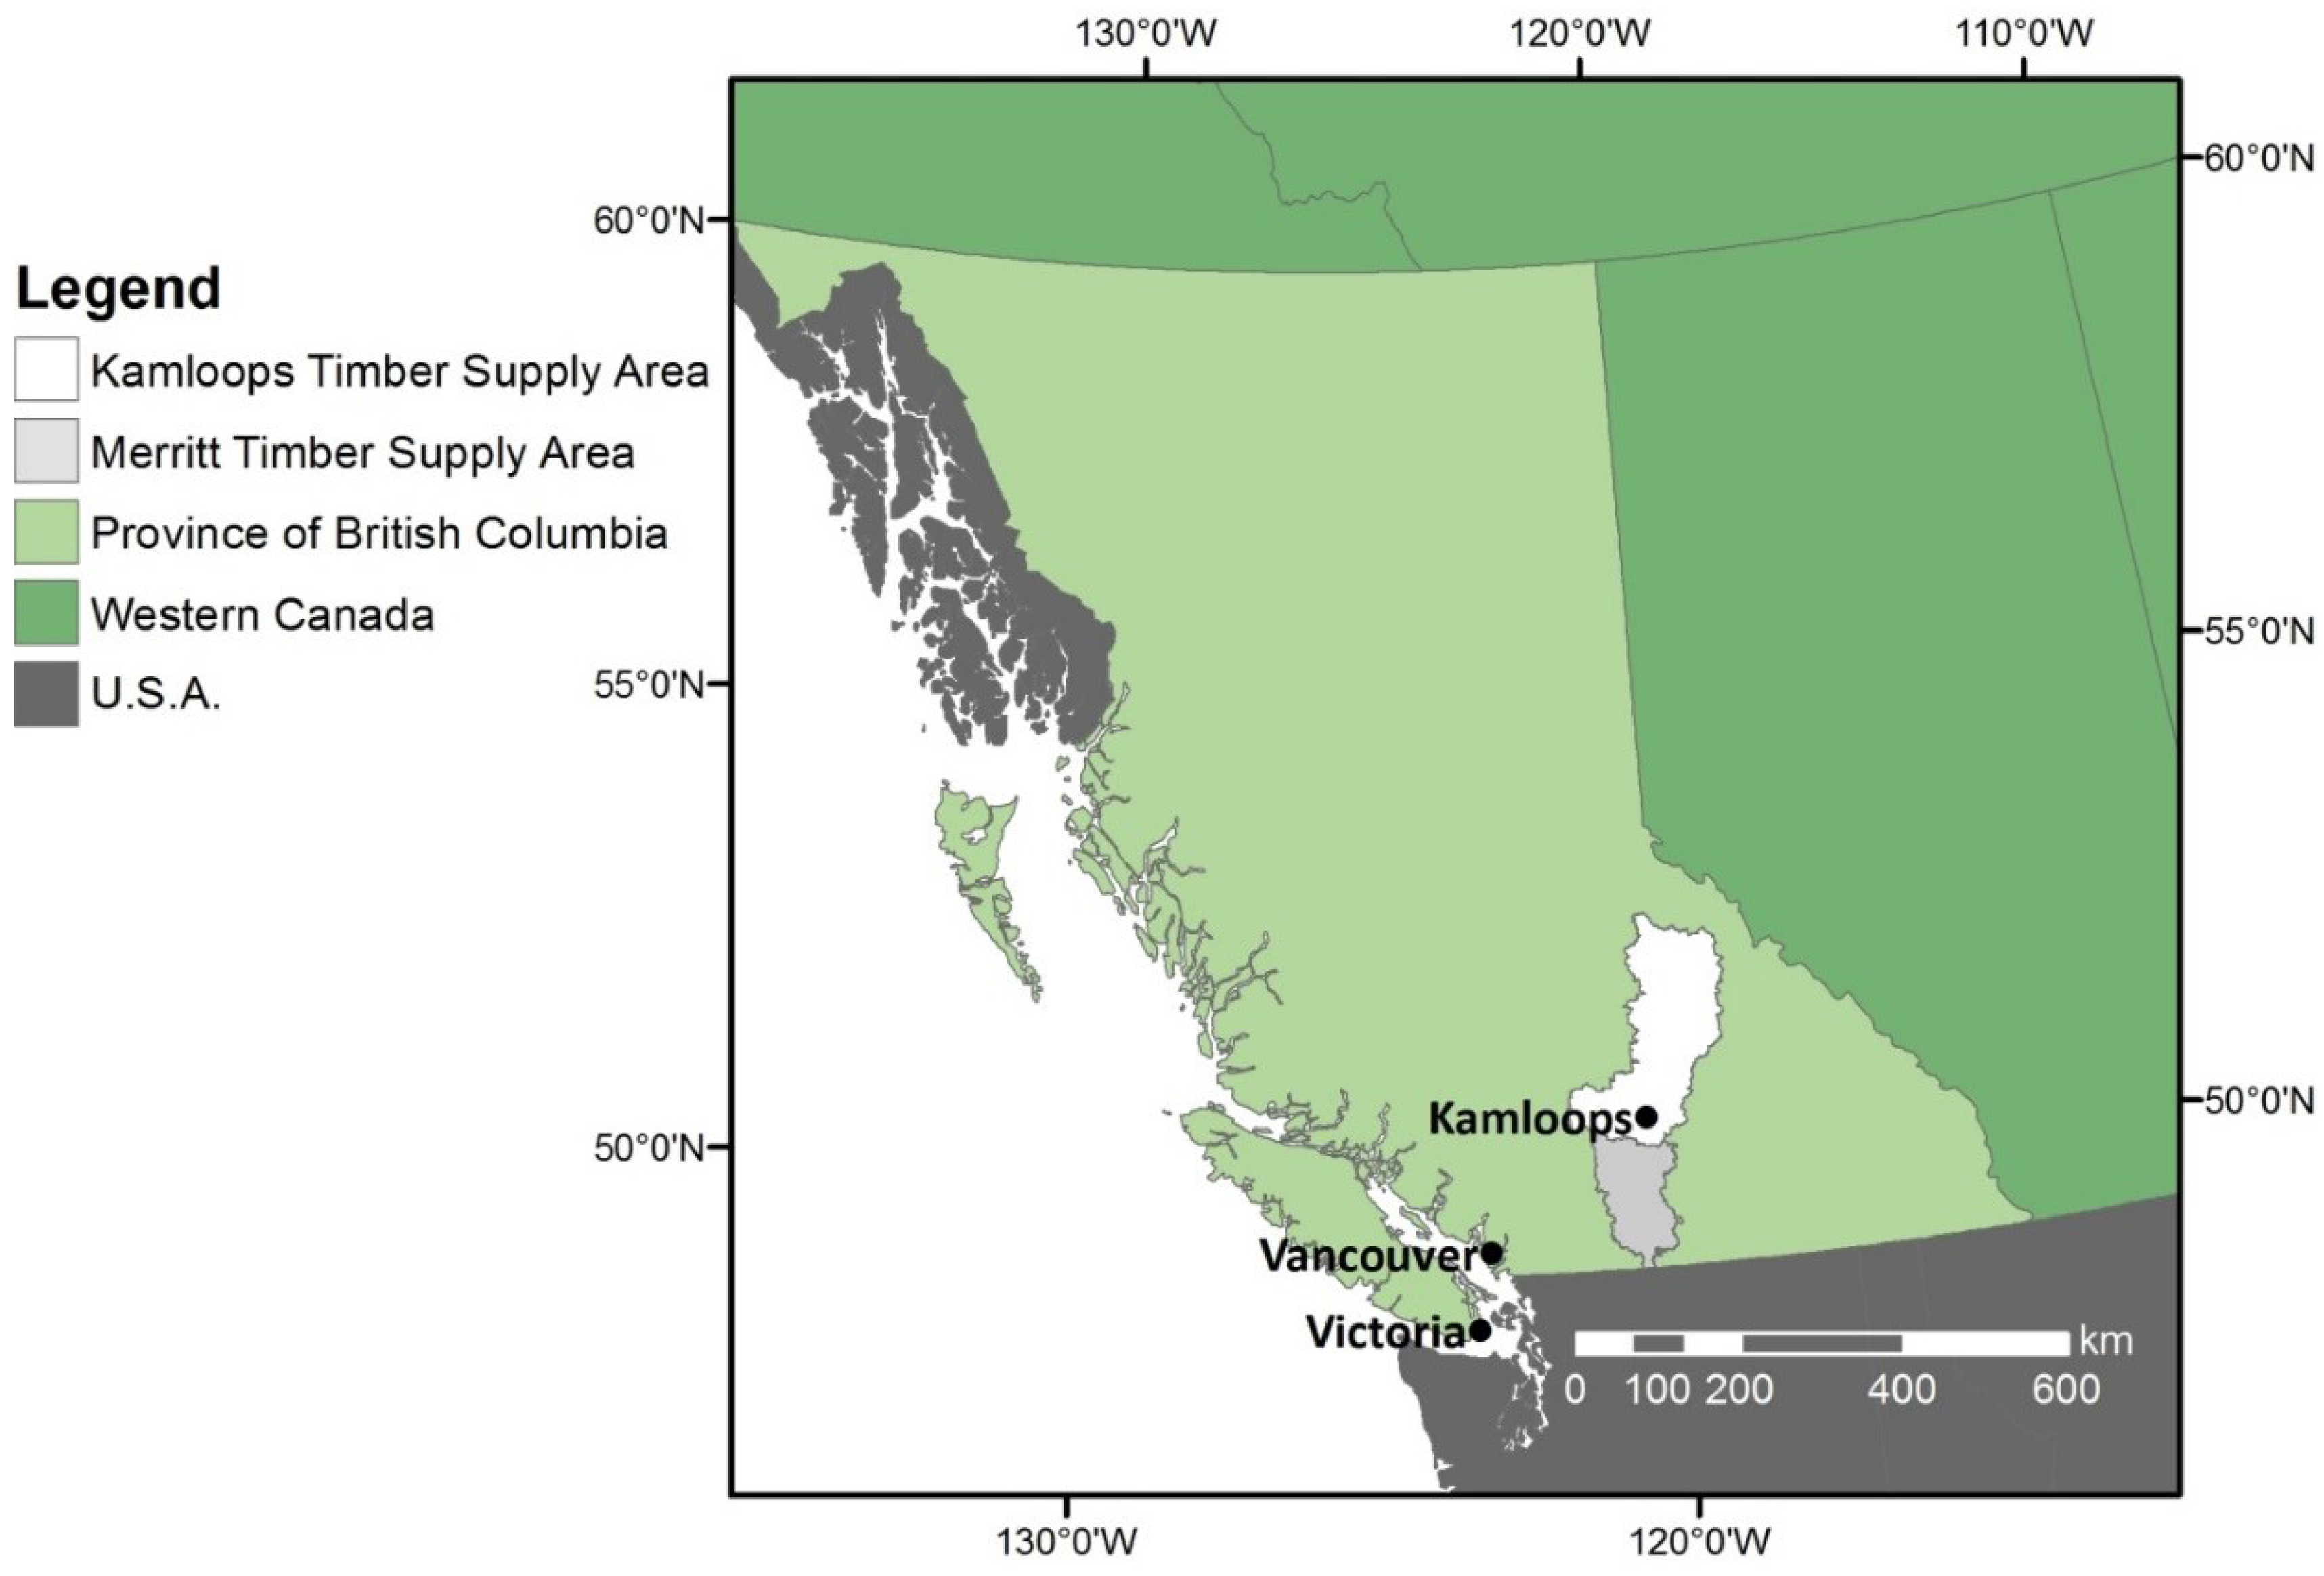
2.1. Study Area

The Kamloops TSA covers 27,700 km2 (Figure 1) and has terrain that ranges from wet, cool forested mountains to hot, dry grasslands in the valleys. The southern and western portions of the TSA are relatively warm and dry, supporting Douglas-fir (Pseudotsuga menziesii Mirb.) and lodgepole pine (Pinus contorta Dougl.) dominated forests, Ponderosa pine (Pinus ponderosa Dougl.) savannas, and grasslands (Table S1). The north-eastern growing conditions are wetter, providing habitat for western redcedar (Thuja plicata Don.) and western hemlock (Tsuga heterophylla Raf.) in valley bottoms and mixed interior spruce (Picea engelmannii Parry x Englem. x glauca (Moench) Voss) and subalpine fir (Abies lasiocarpa (Hook.) Nutt.) at higher elevations [29]. Forty-five percent of the area is in the timber harvesting land base (THLB) (61% of the forest and woodland) and remainder is in parks, inoperable areas, grassland, farmland and residential (Table S2).
Over the last 60 years, average annual temperatures in the study area have increased by about 1 °C [30]. Temperatures are projected to increase by a further 3 to 6 °C over the next 60 years [5,30]. July and August are projected to have up to 10% reduction in precipitation and up to 10% increase in the rest of the year. Changes in extreme conditions will likely also occur, in particular, dry periods during the summer will likely become more intense [31]. These changes will likely increase the risk of weather-related forest disturbance by pests and fire [32] and changes in tree survival and growth [33].
The recent mountain pine beetle epidemic started in the study area in 2000. By 2012 the beetle had killed about half of the pine volume (Table S2). In 2004, as a response to the beetle epidemic, the Government increased the annual allowable cut (maximum harvest rate) from 2.68 to 4.35 million (M) m3·year−1. The timber supply in the study area is forecast to decline by 54% by 2016 and this decrease is expected to reduce employment by 948 person-years within the study area and 1304 person-years provincially (Table S2).

2.2. Modelling

The modelling methodology is documented by Dymond et al. [20]. We conducted a historical retrospective approach starting in 1980 when reliable data on growing stock, harvest volumes by species and replanting area by species became available. We ran the simulation until 2060 to allow trees regenerated in the first few decades to become merchantable (rotation ages in the study area range from 60 years for lodgepole pine on good sites to 110 years for mixed interior spruce on poor sites, Table S2). The methodology was kept similar to those used for harvest scheduling while maintaining other values such as wildlife habitat and biodiversity. It is also useful to help bridge the cultural divide between ecological theorists and forest managers because it provides a methodology and results in a format that both groups can understand and discuss.
Briefly, the Critical Analysis by Simulation of Harvesting, version 6.21 (CASH6) [34] is a deterministic timber supply model with the resolution of forest inventory polygons. The forest inventory for the study area contained 386,163 polygons with an average size of 4.4 ha. The spatial model uses the inventory, growth and yield data, and regeneration assumptions to grow the forest over time [34]. It allows the user to impose various harvesting and silviculture strategies and apply constraints such as a minimum area as old growth forest.
Figure 1. Location of the study area: the Kamloops Timber Supply Area relative to the Merritt Timber Supply Area. (Adapted from [20]).
Forests 06 04377 g001
We evaluated different management strategies relative to “business as usual” (BAU) (Table 1 and Figure 2). The BAU strategy was defined from current and historical records specific to the study area (see Table S2 for data sources). We developed the alternative strategies to increase the diversity of tree species and reduce the area of high risk species (lodgepole pine) before the beetle epidemic in 2000–2020, and to increase the resilience of regenerated stands and logging revenue in the middle of the 21st century. In the mixed planting (MP) strategy, we increased the diversity (both richness and evenness) of reforestation activities compared to BAU (Table 1 and Figure 2). The early pine cut, mixed planting, increased natural regeneration (EMR) strategy, increased the harvesting of pine earlier than business as usual and increased the diversity in reforestation. The increase in pine harvesting resulted in reduced harvesting of other species for EMR so as to maintain the same as or lower than the historic volume of timber harvested under BAU. All strategies were compatible with forest management regulations and standards in British Columbia. The proportion of the harvest as lodgepole pine was either based on the historical records in the case of the BAU and MP strategies, or the availability of mature lodgepole pine on the landscape (the EMR strategy). For future decades, we determined the maximum, stable harvest rate that could be achieved within the regulated constraints.
The species mix for more diverse regeneration was site-dependent based on the growth strata (Table 1 and Figure 2). We used 81 different growth strata based on their climatic conditions, soil type, current species and site index. Assumptions about the exact species composition and density of seedlings, and therefore yield curves, depended on the growth strata. We only planted native species that are allowed under legislation.
Table 1. Harvesting and regeneration modelling criteria for each management strategy.
Strategy Name Harvesting Regeneration (see also Figure 4)
Business as usual (BAU)
  • Primarily clear cuts (92%)
  • 1980–2010 volume and species based on records
  • 18% of the harvest as pine in 1980–1989,
  • Primarily planted (81%)
  • Species based on records and plans
  • 35% of the area regenerated as lodgepole pine,
  • 7 species regenerated.
Mixed planting (MP)
  • Same as BAU.
  • Primarily planted (81%)
  • Diversity of species being planted increased at stand scale.
  • 23% of the area regenerated as lodgepole pine,
  • 9 species regenerated.
Early pine cut, mixed planting, increased natural regeneration, (EMR)
  • 80% clear cuts
  • More partial cuts (20%).
  • 1980–2000 volume same as BAU.
  • Lodgepole pine stands or portions of stands preferentially harvested.
  • 91% of the volume harvested was pine 1980–1989
  • Less planting (61%)
  • More natural regeneration (39%)
  • Number of species being planted in each stand increased over BAU.
  • 18% of the harvested area was simulated to grow back as lodgepole pine
  • 9 species regenerated.
Figure 2. Regeneration assumptions by proportion of area assigned to different species for the business as usual (BAU), mixed planting (MP) and the early pine cut, mixed planting, and increased natural regeneration (EMR) strategies for the Kamloops TSA. Bl = subalpine fir, Cw = western redcedar, Decid = deciduous, Fd = Douglas-fir, Hw = western hemlock, Lw = western larch, Pl = lodgepole pine, Py = Ponderosa pine, Sx = Engelmann X white spruce.
Forests 06 04377 g002
The MP and EMR strategies included the planting of western larch although it historically has not occurred in the study area. This extension of the range of larch is consistent with recommendations for climate change adaptation in Rehfeldt and Jacquish [35]. Using mixed planting in reforestation also provided the means to maintain higher valued species for future benefit. Western redcedar was included in regeneration for MP and EMR because of its economic value (218% of the value of a pine log) and importance for cultural reasons.
The CASH6 model provided a discounted cash flow assessment (NPV) of the harvesting and replanting strategies by including costs of operational actions such as cycle time and silviculture method over the 80-year simulation. For detailed methods see Dymond et al. [20]. Our economic analysis is at the landscape level and occurs within an actively managed forest similar to the approach taken by Shou et al. [28]. Canadian dollars used throughout unless otherwise noted.
The appropriate discount rate depends on ones’ expectation of risk, the attractiveness of the investment over the long term and social values [36]. A review of the literature on forestry investment analyses indicates discount rates from 1% to 9.75%, with a higher discount rate used when evaluating projects associated with high uncertainty [37]. The analysis is based on an 80 year time horizon; subsequently, discount rates of 1%, 3% and 5% are used to allow a comparison of net present values over time. These discount rates reflect a longer term, intergenerational consideration of the time value of money [38]. The use of lower rates also reflect the likely contribution of a more diverse forest to public good and other non-timber values not quantified within the analysis.
The uncertainty in the growth and yield data and in future timber value was assessed with a sensitivity analysis based on the impact of changes in Douglas-fir productivity and log prices on the THLB area and the harvest rates for BAU and EMR strategies.

2.3. Resilience Indicators

We used three indicators of diversity: species richness, the Shannon Diversity Index and the Berger-Parker Dominance Index. Species richness is simply the number of tree species listed in the forest inventory or model output. The Shannon Diversity index is a combined indicator which integrates the number of species and the relative abundance [39]. The Berger-Parker Dominance index is the volume of the most common species divided by the total volume and therefore reflects any lack of evenness of abundance among species. Our estimates of tree species richness are low compared to British Columbia as a whole (49 tree species, [40]) because we are focusing on commercial species. Therefore this study does not apply to the assessment or conservation of rare species or biodiversity overall.
The resilience indicators of post-disturbance growing stock and post-disturbance harvest rates flowed directly out of the CASH6 model projections. One assumption that greatly influenced the future harvest was that all future decades were required to have the same rate of harvest. This is a common assumption in harvest modelling, although it is not universal. Growing stock is defined as standing green trees with merchantable volume (operable volume above minimum harvest age by species).
Both annual net revenue and NPV over the simulation period were produced through the CASH6 model. They incorporate logging and hauling costs to the mill, reforestation costs, and log price at the mill. For more detail see Dymond et al. [20].

3. Results

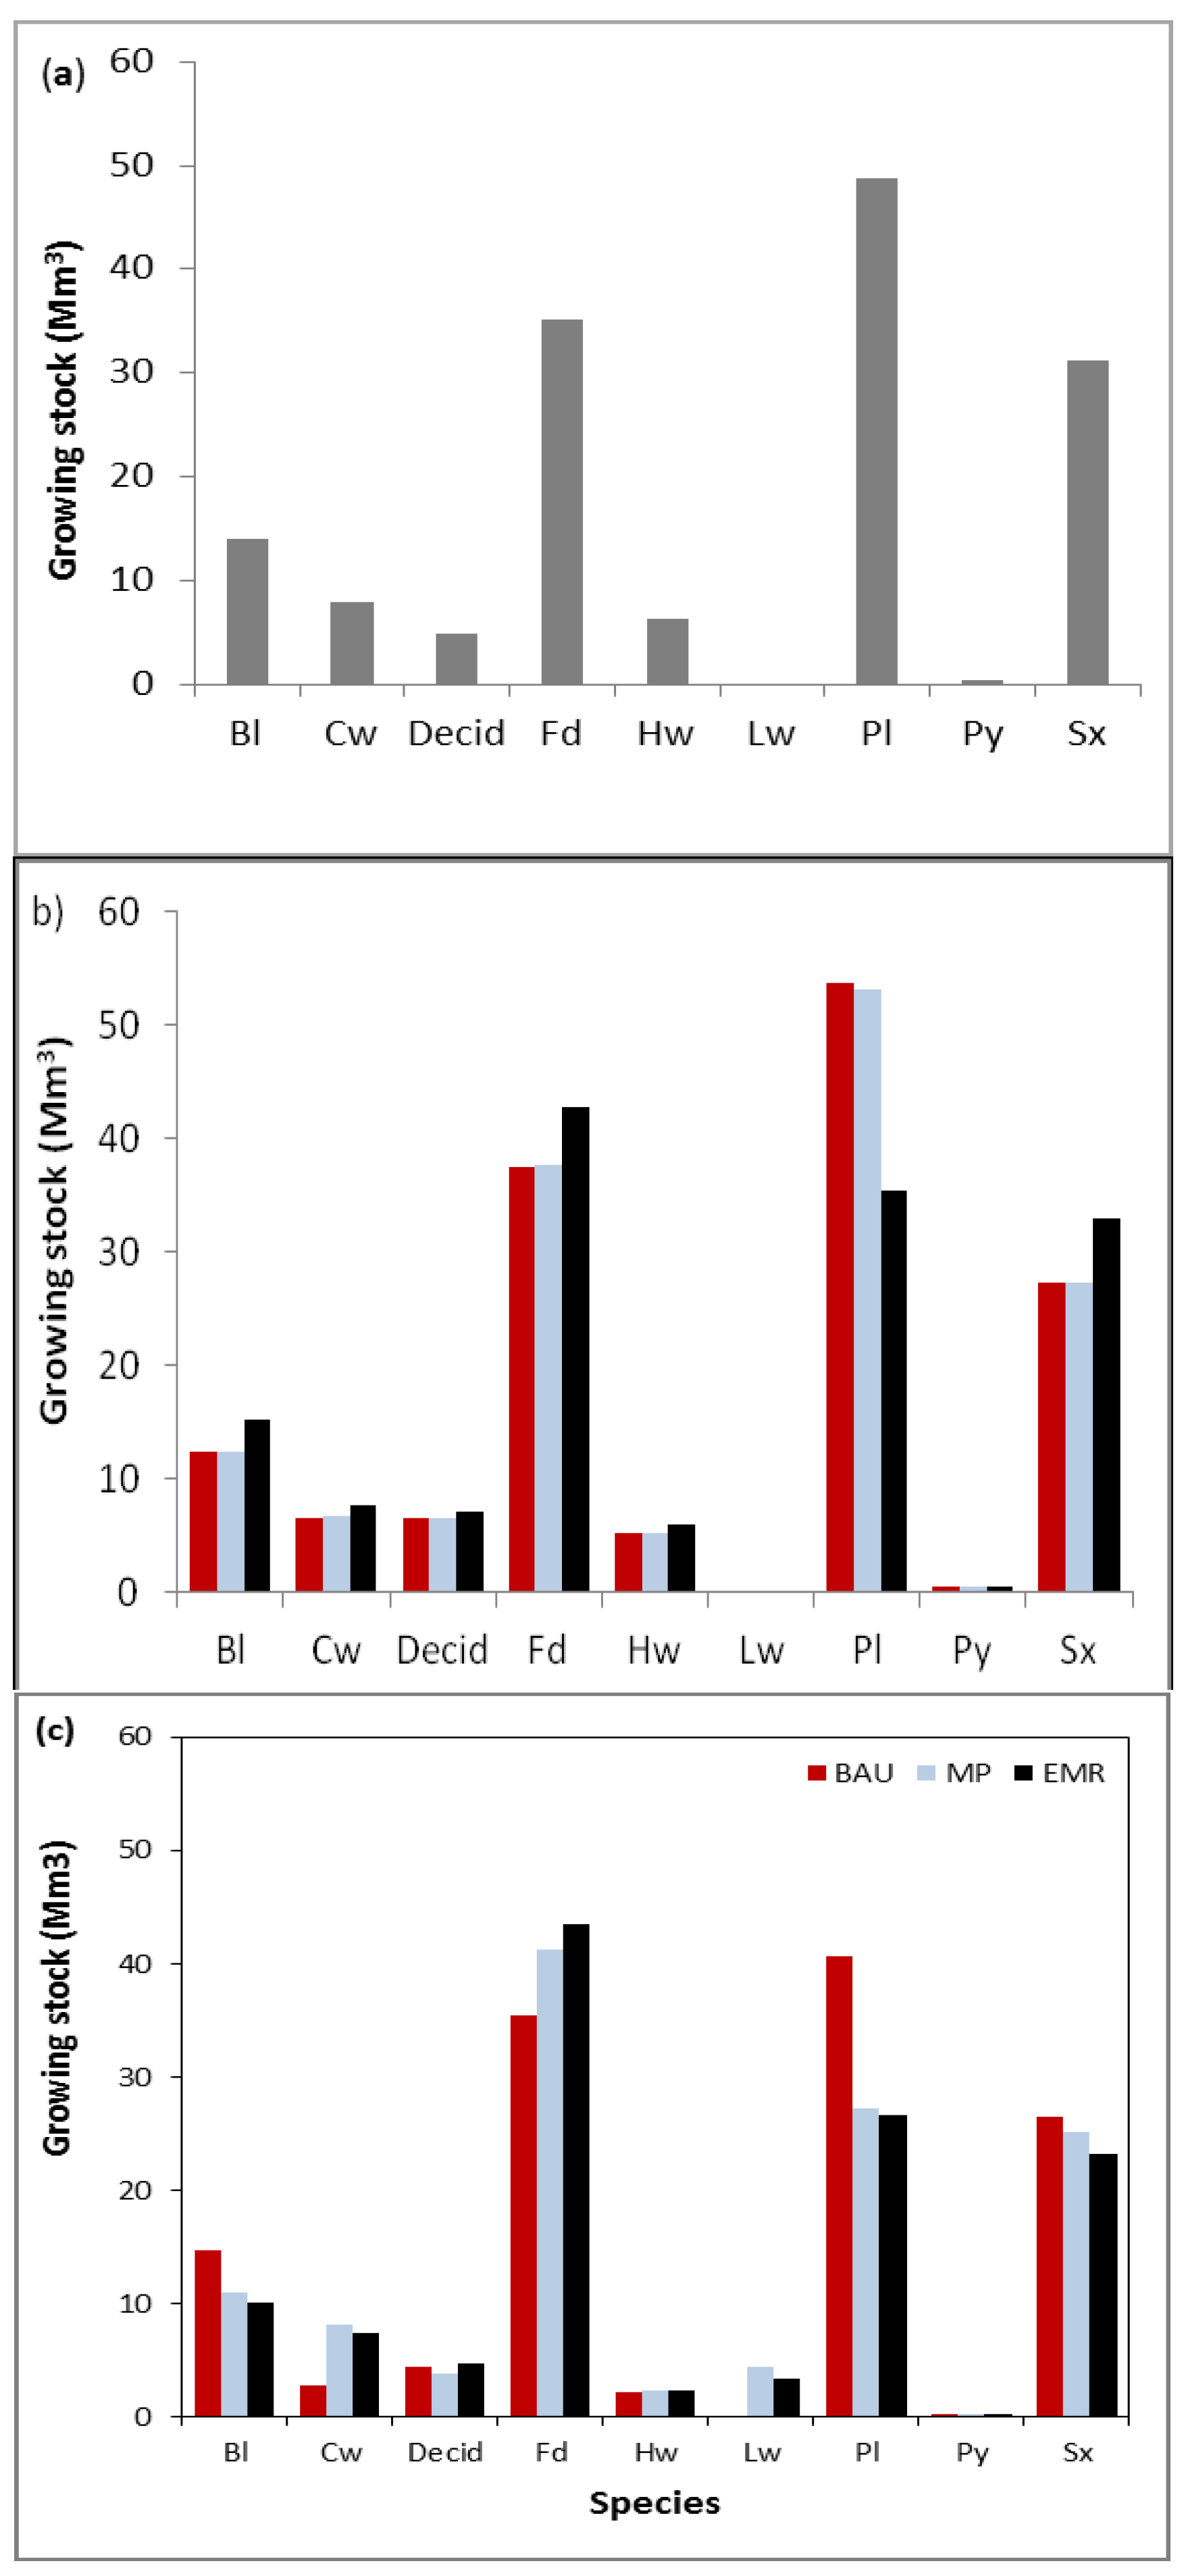
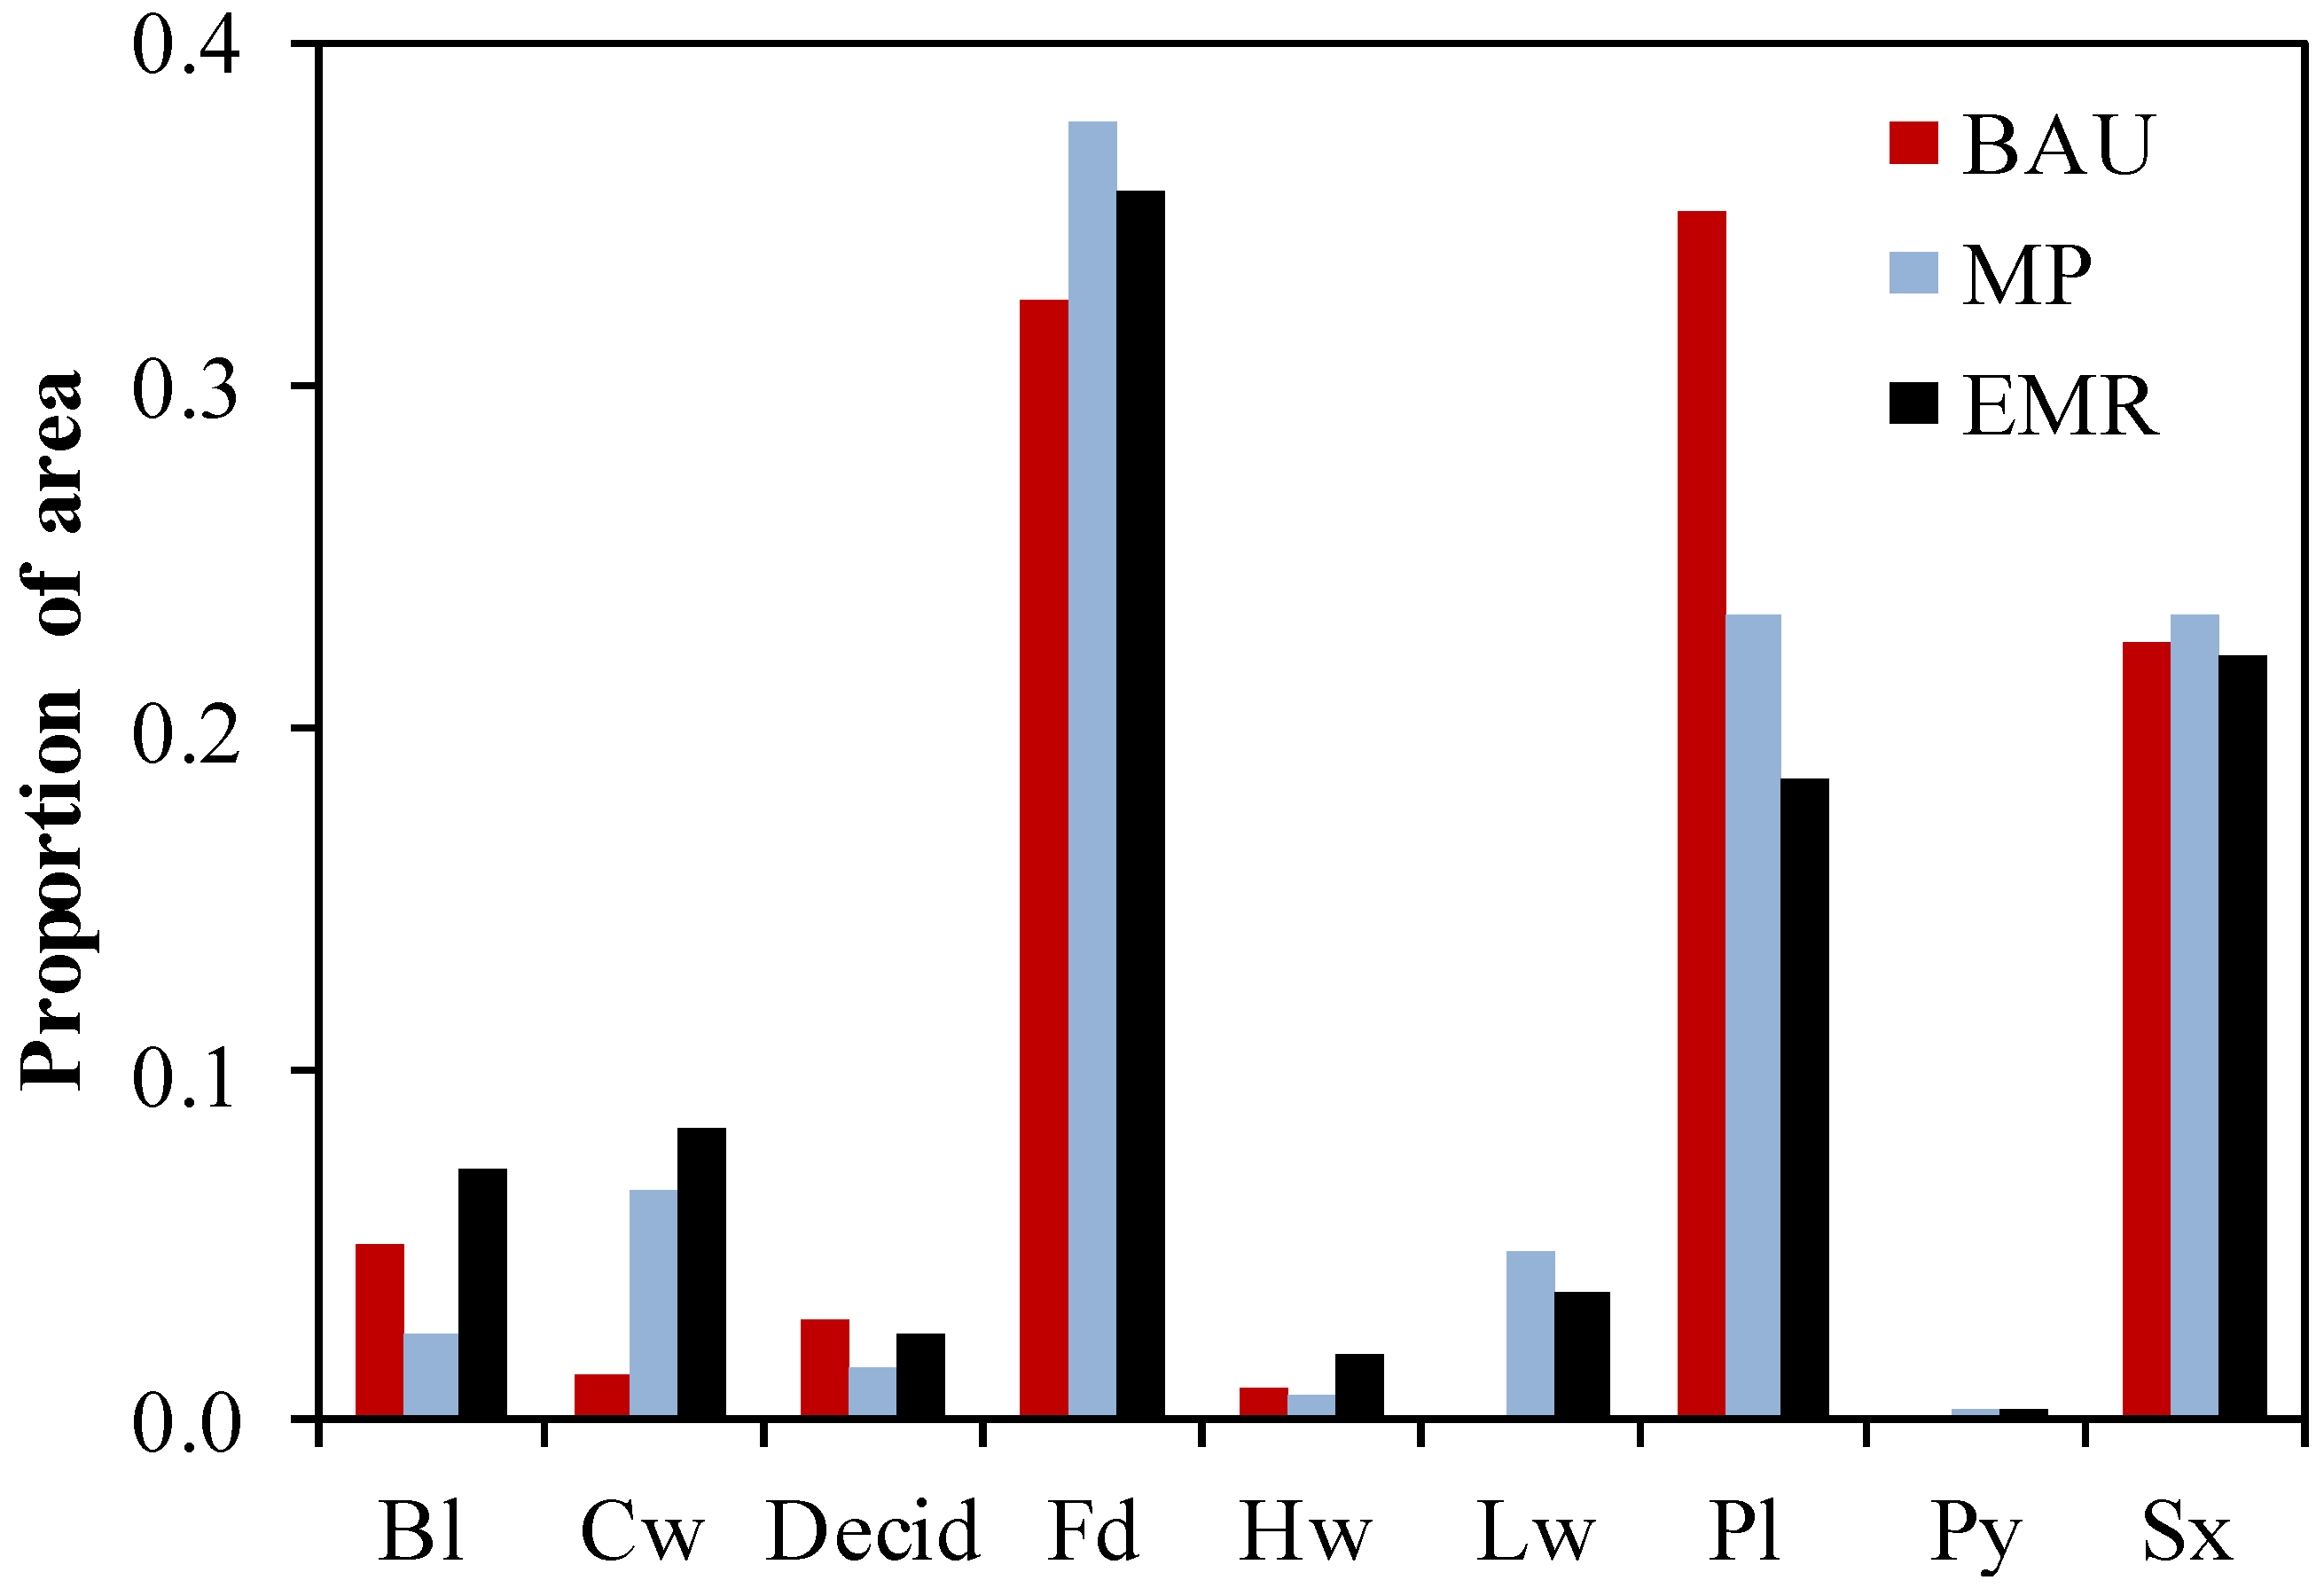
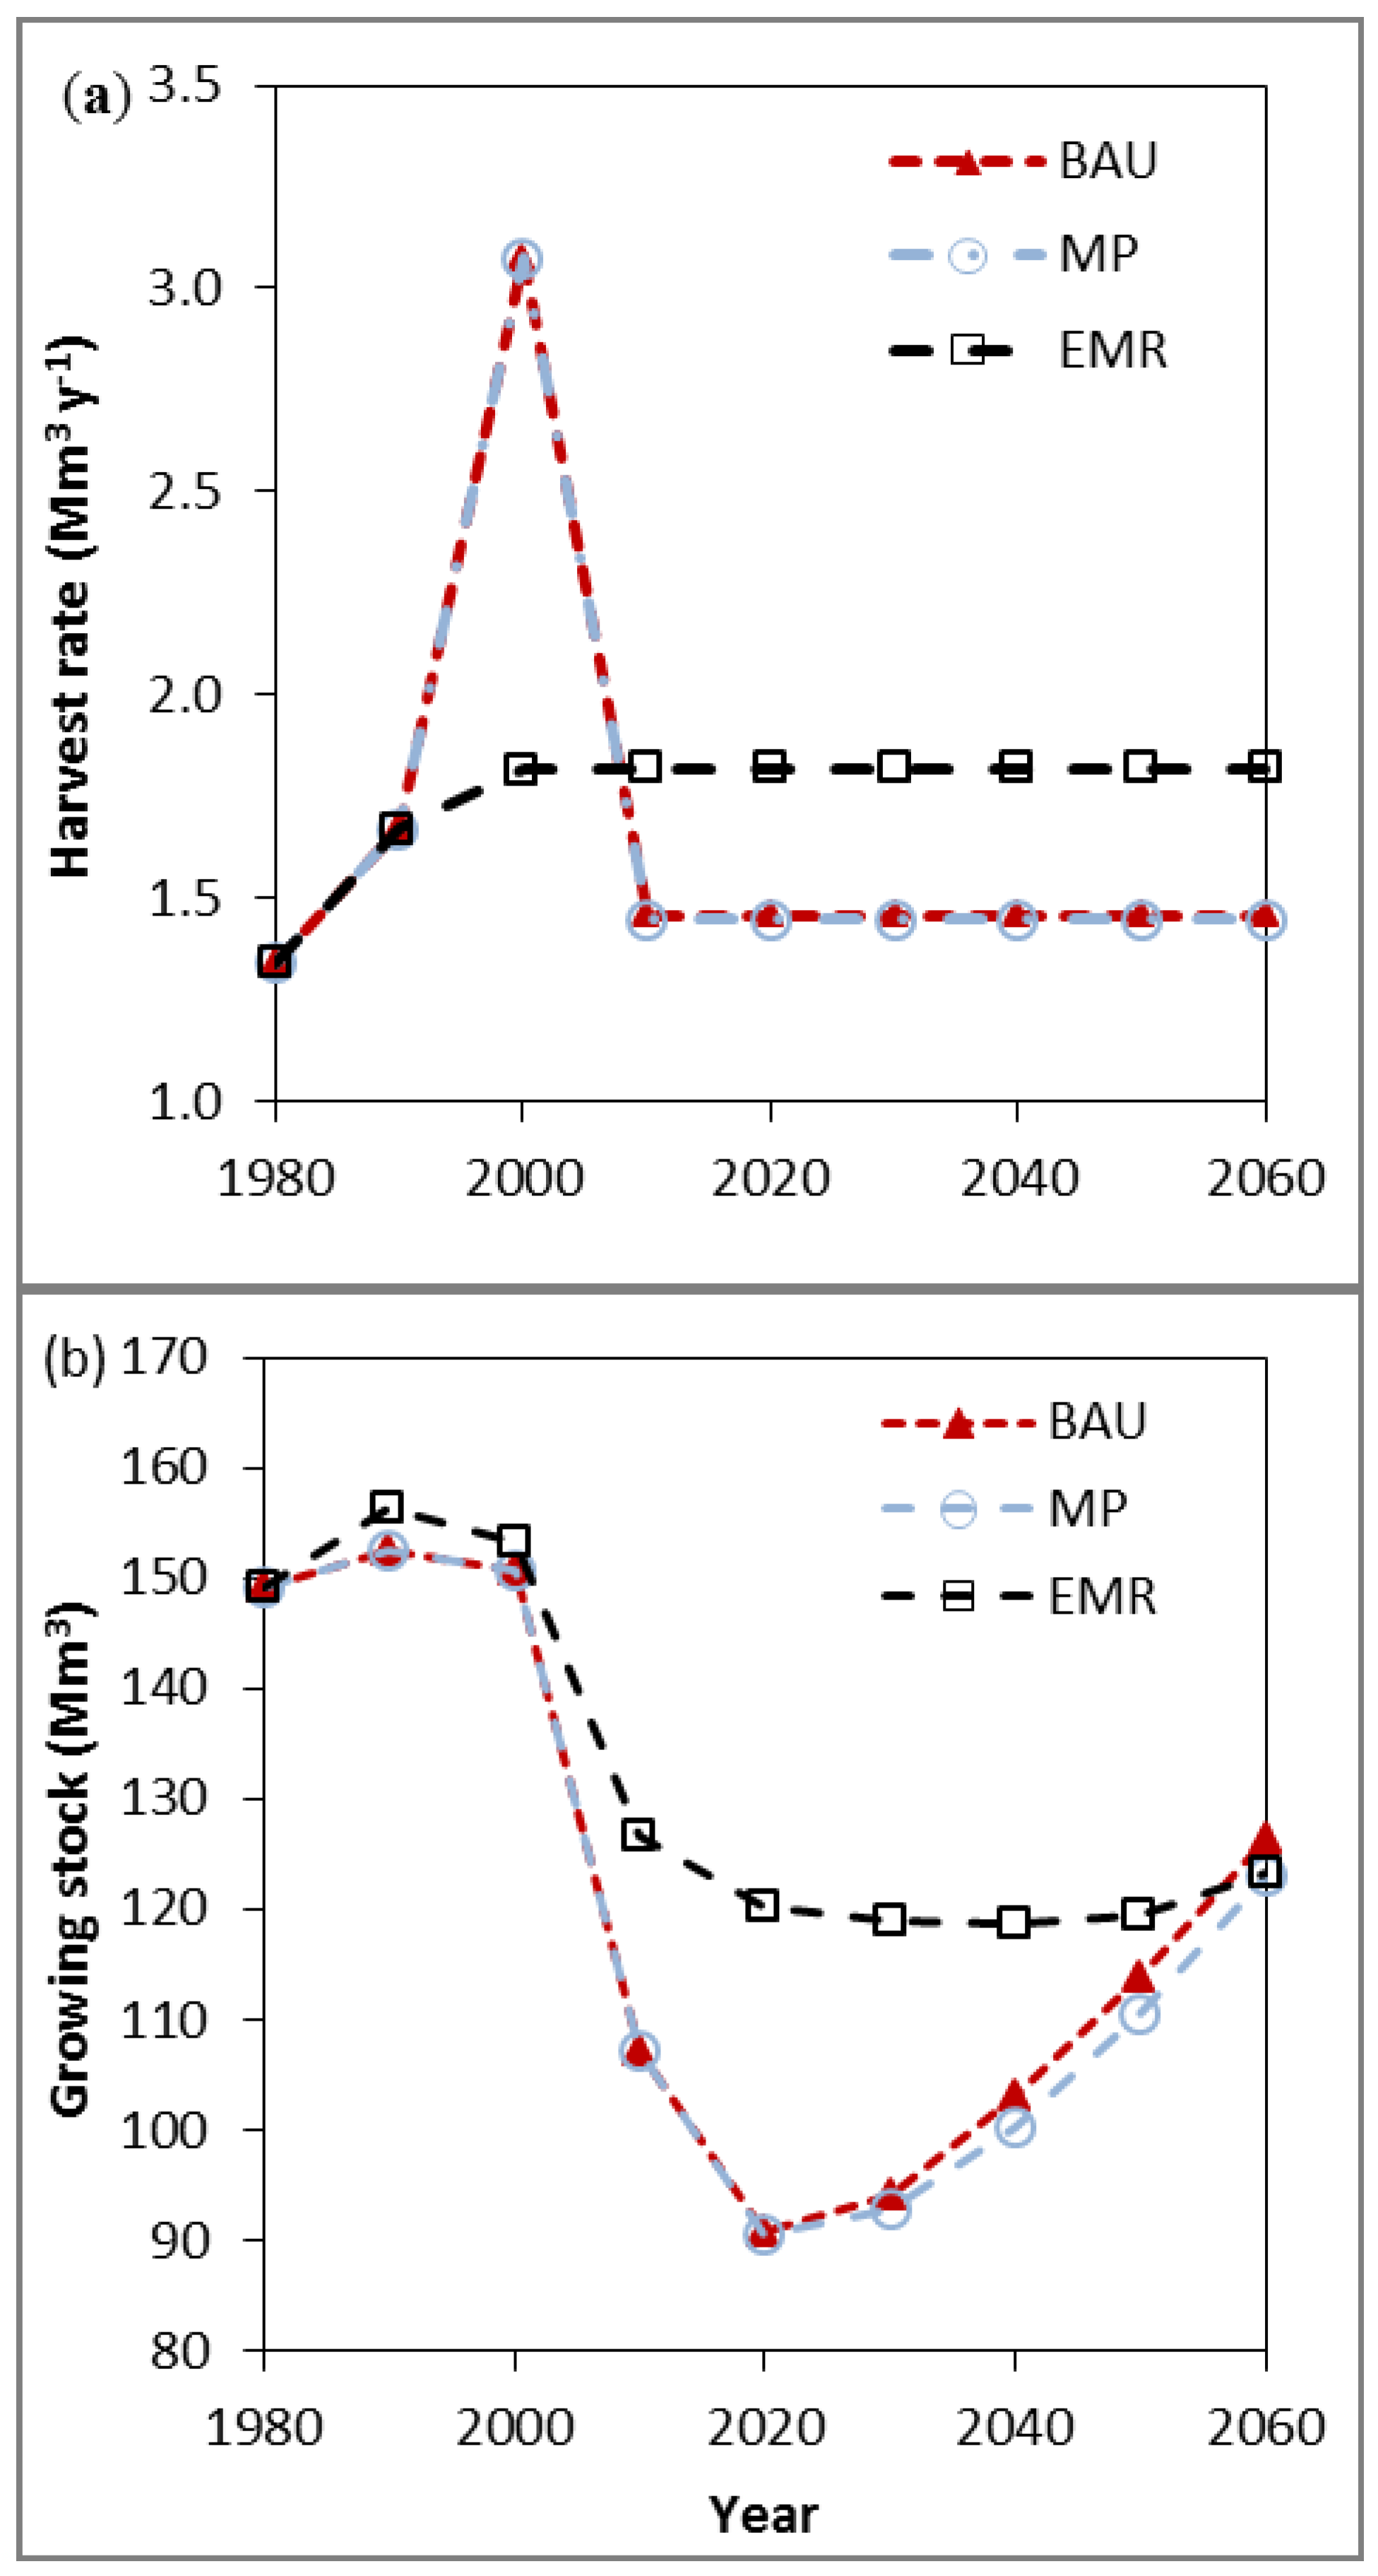
3.1. Species Composition, Growing Stock and Harvest Rates
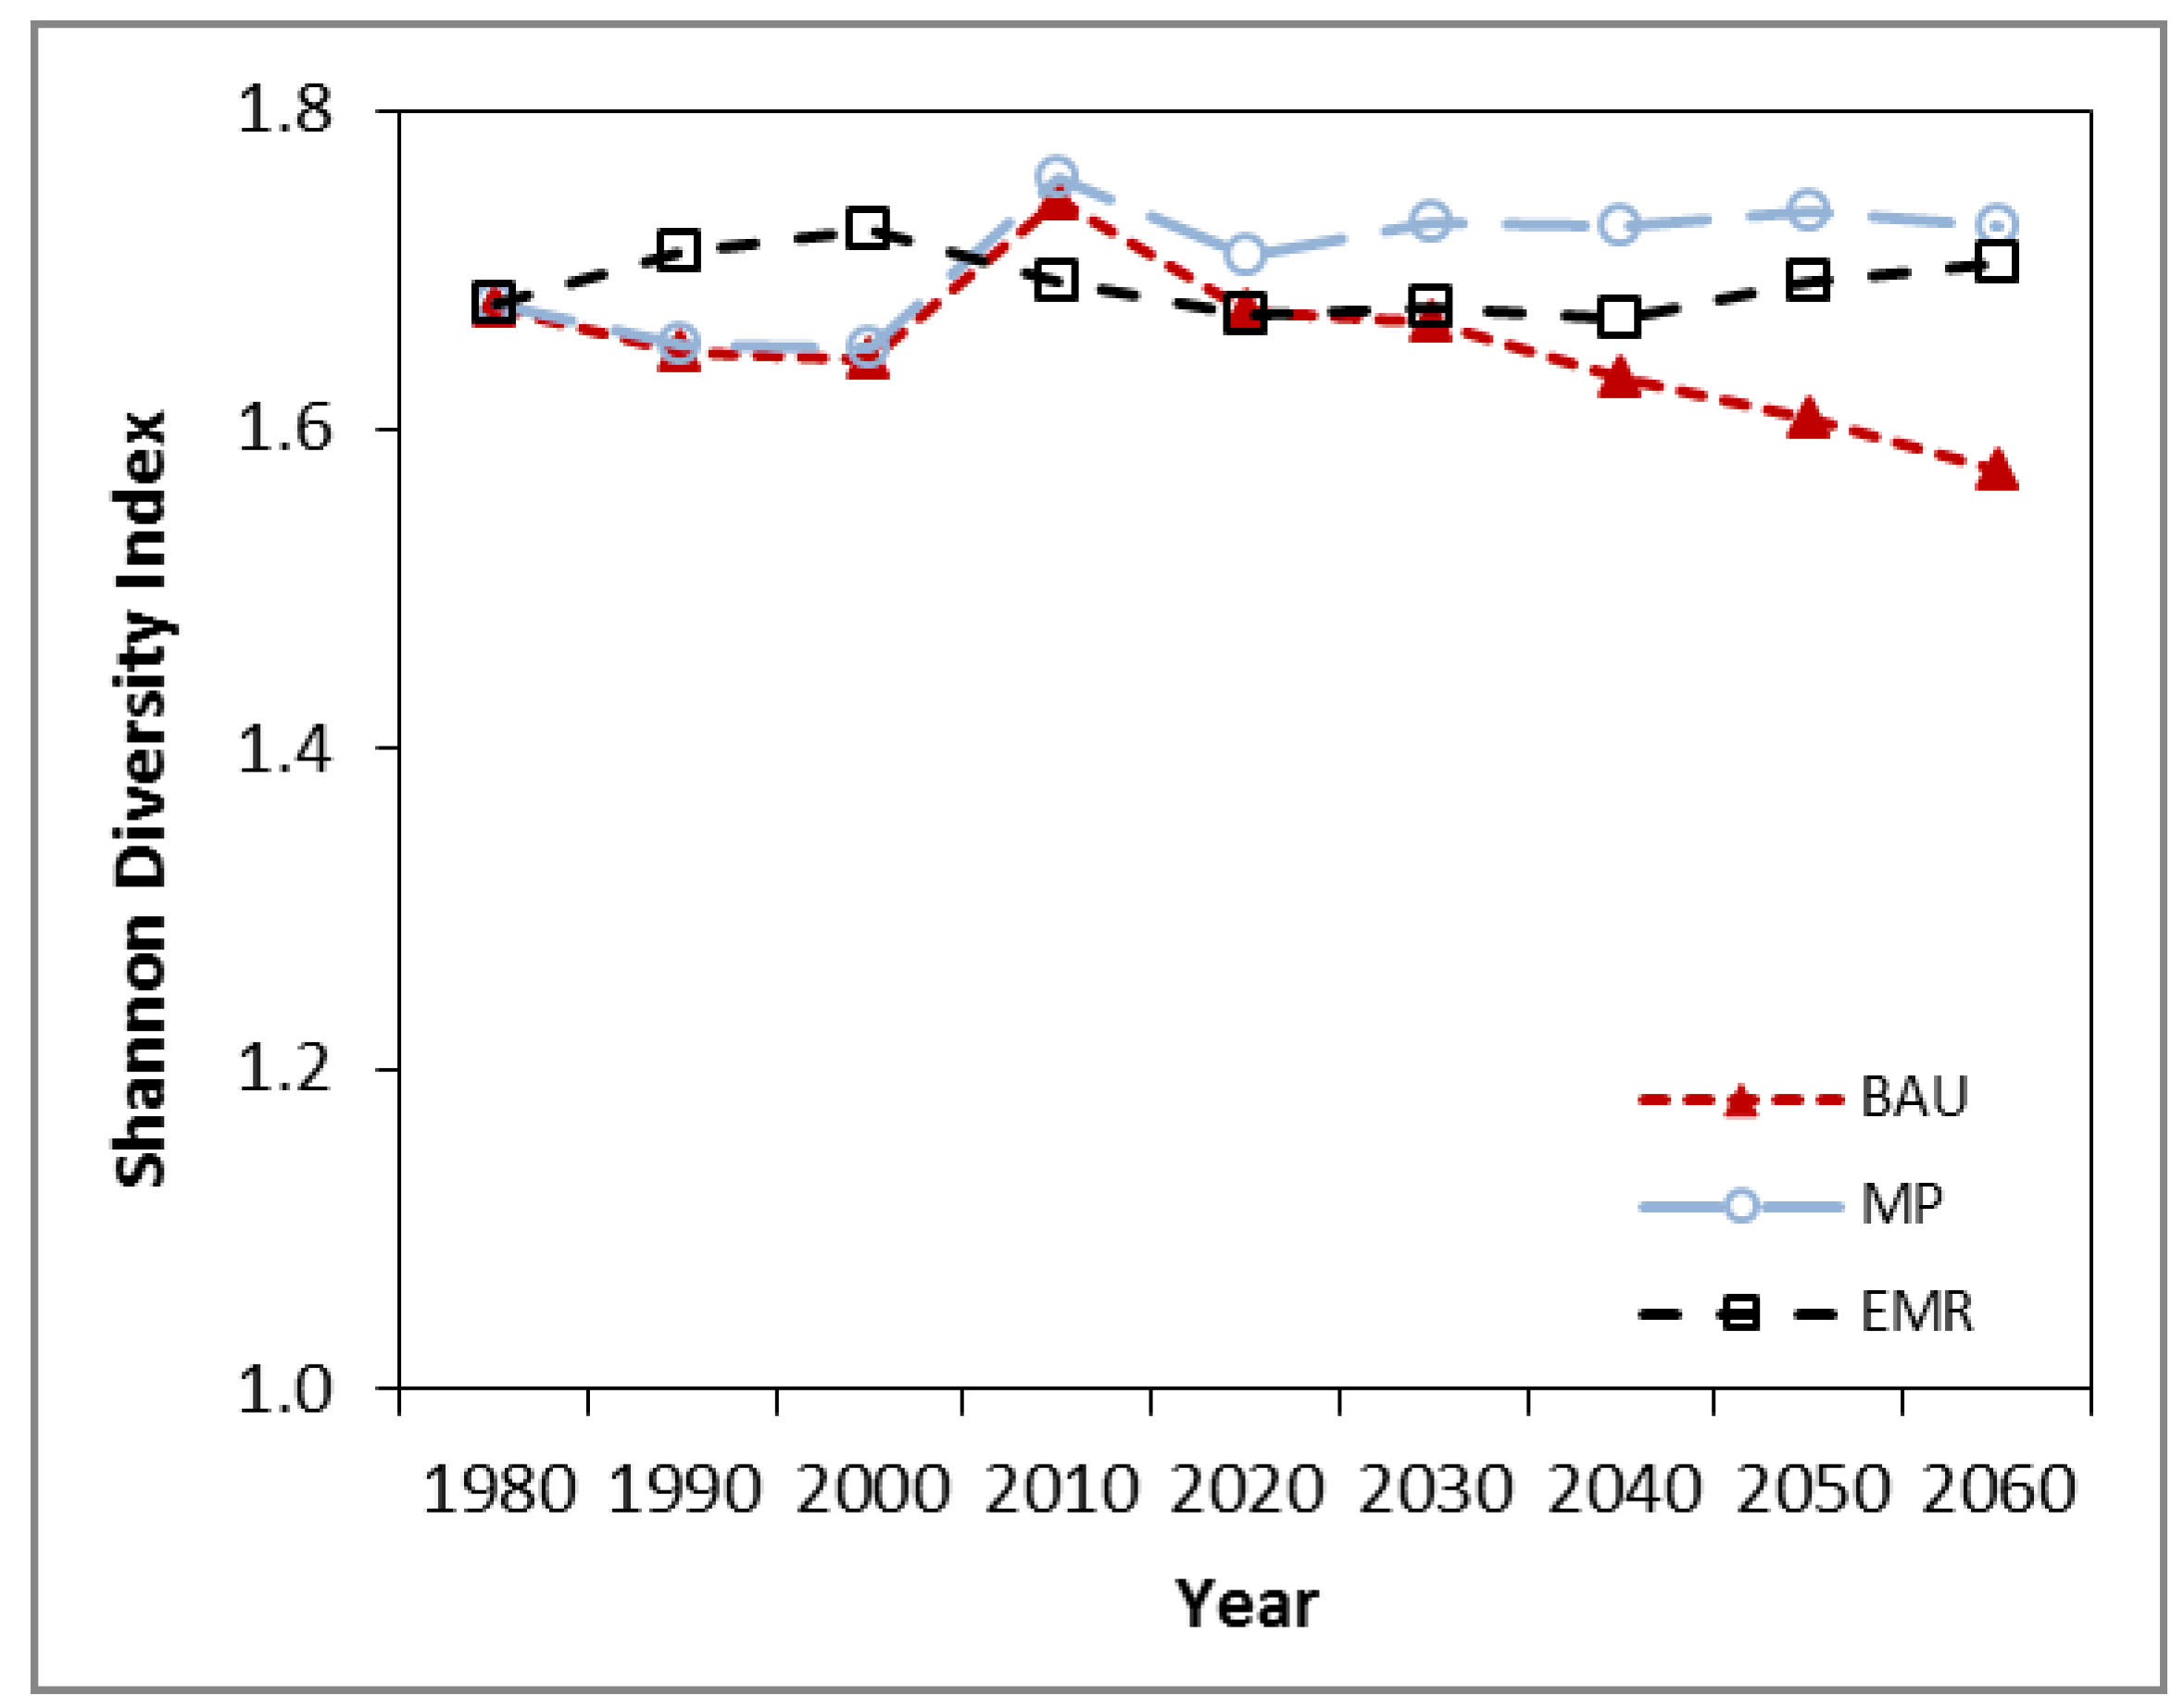
The 1980 growing stock for the study area was 148.6 Mm3 with lodgepole pine as the dominant species (Figure 3a). By 2000, EMR had substantially lowered the amount of high risk lodgepole pine on the landscape and changed the leading species to Douglas-fir (Figure 3b). By 2060 the amount of lodgepole pine in the MP landscape had been lowered to about the same level as in EMR (Figure 3c). In both alternative strategies, Douglas-fir became the leading species, although not reaching the degree of dominance of lodgepole pine had in 1980.
In the 2000–2009 decade of BAU, the harvest rate surged by 84% above the previous decade (Figure 4a). This surge was in response to the beetle threat and salvaging dead trees (see Section 2.1). The harvest in MP followed the same pattern. However, the substantial reduction in pine by 2000 in EMR lowered the risk from the beetle to where a surge in harvest was no longer required. The harvest flow after 2010 was highest (1.82 Mm3·year−1) in EMR, indicating higher resilience for this metric. Under BAU, harvestable western redcedar was depleted by 2060 because it was not being regenerated. On the EMR and MP landscapes western redcedar was available for the 2050–2060 harvest (Figure 3 and Figure S1).
Figure 3. Standing volumes (millions of cubic metres Mm3) by species on the harvestable portion of the study area in 1980 (panel a), simulated in 2000 pre beetle (panel b), and simulated in 2060 (panel c) for the business as usual (BAU), mixed planting (MP) and the early pine cut, mixed planting, and increased natural regeneration (EMR) strategies. At = trembling aspen, Bl = subalpine fir, Cw = western redcedar, Ep = paper birch, Fd = Douglas-fir, Hw = western hemlock, Lw = western larch, Pl = lodgepole pine, Pw = white pine, Py = Ponderosa pine, Se = Engelmann spruce, Sx = Engelmann X white spruce. Decid = deciduous species (At, Ep).
Forests 06 04377 g003
The growing stock varied substantially between strategies with the EMR landscape being about 28 Mm3 higher than BAU and MP by 2010, indicating greater resilience (Figure 4b). From 2020–2060 the growing stock for BAU increased more quickly than EMR in large part because the BAU landscape could only sustain a lower harvest rate. Because of the availability of more second growth stands later in the simulation, the EMR strategy reduced the demand on harvesting primary forests such that by 2060 the EMR landscape had 14%–19% more old-growth than the MP or BAU landscapes (Figure S2).
Figure 4. Annual rate of harvest (millions of cubic metres per year, Mm3 y-1) (panel a) and standing volume (millions of cubic metres Mm3) (panel b) for the business as usual (BAU), mixed planting (MP) and the early pine cut, mixed planting, and increased natural regeneration (EMR) strategies.
Forests 06 04377 g004

3.2. Diversity

Tree species diversity did not vary substantially between strategies, indicating no change due to management in this resilience metric. The species richness increased from nine under BAU to ten in both alternative strategies through the simulated planting of western larch. The Shannon Diversity Index on the THLB started at 1.68 in 1980, and by 2060 it had dropped to 1.57 under BAU, increased to 1.73 for the MP landscape and 1.70 for EMR (Figure 5).The Berger-Parker Dominance index was 0.33 in 1980 and remained fairly consistent between management strategies at 0.32 for BAU and 0.36 for MP and EMR at the end of the simulations in 2060 (data not shown). Management activities affected 0.3% to 1.5% of the THLB area annually (72%–82% over 80 years).
Figure 5. Shannon Diversity Index for commercial tree species on the timber harvesting land base for the business as usual (BAU), mixed planting (MP) and the early pine cut, mixed planting, and increased natural regeneration (EMR) strategies. Note: y-axis starts at 1.0.
Forests 06 04377 g005

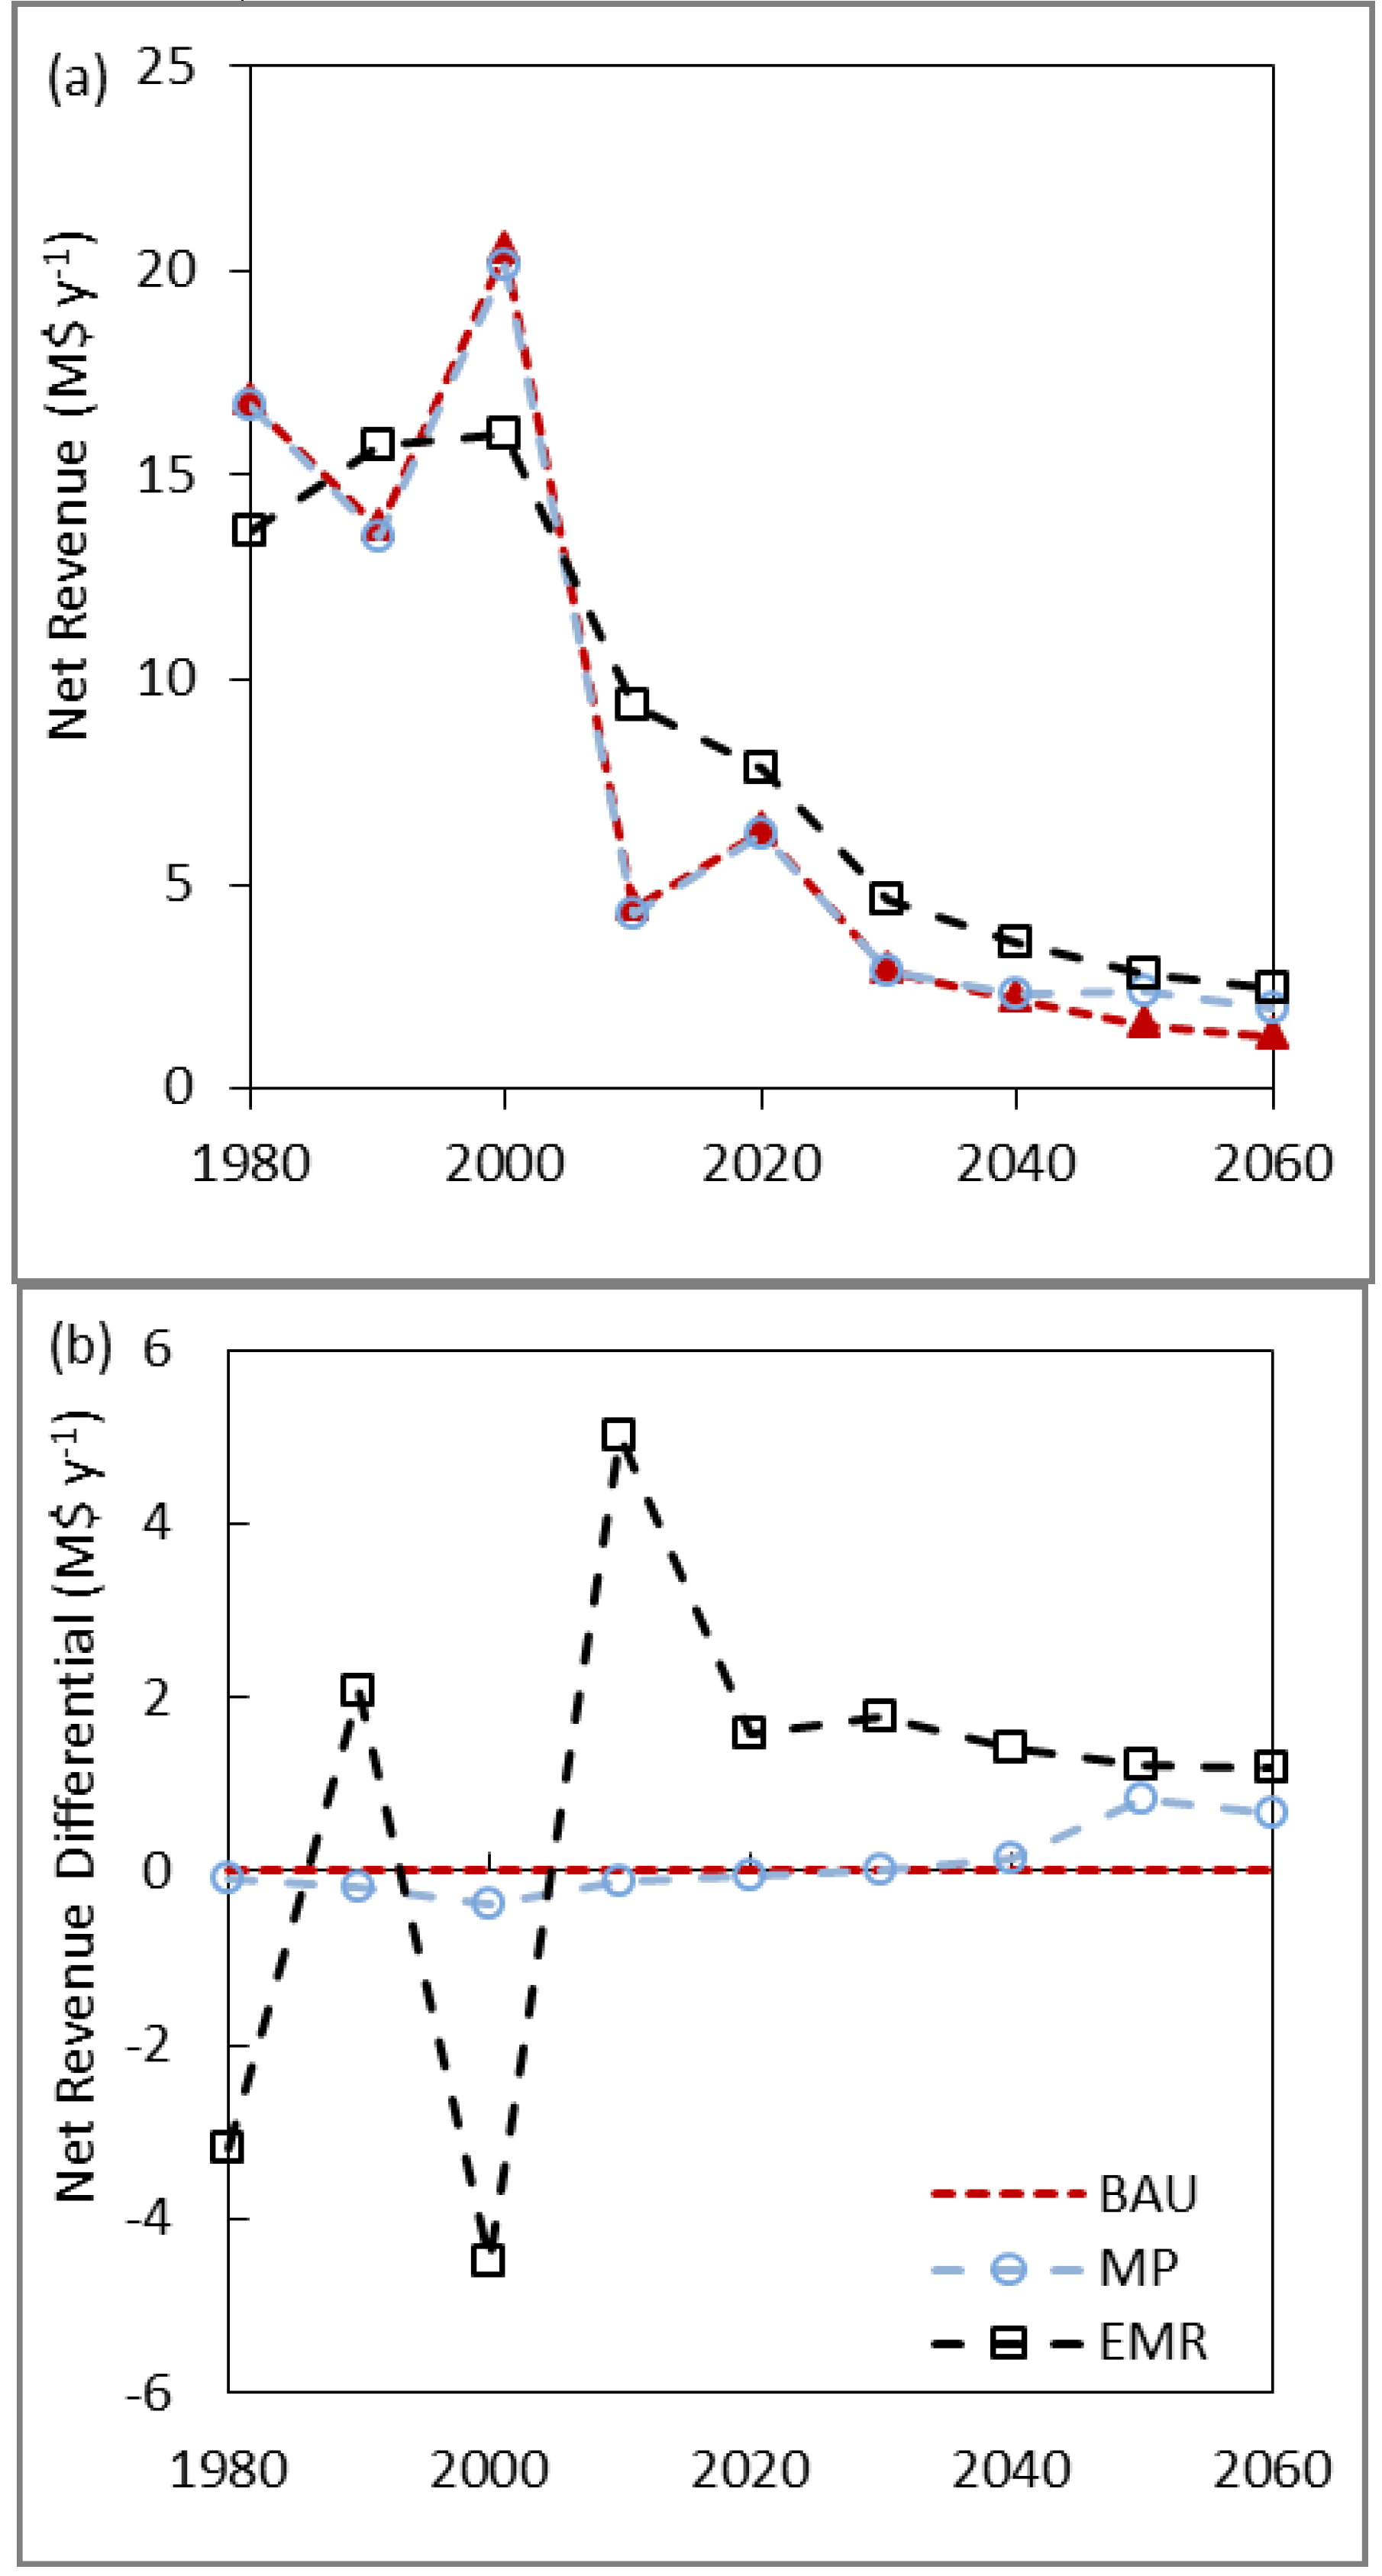
3.3. Net Present Value, Revenues and Costs

The EMR strategy produced the highest harvest rates and total net present values over the simulation period, indicating higher resilience from these metrics (Table 2). Under a 3% discount rate, EMR outperformed the BAU by 9% while MP had a 1% higher NPV than BAU. However, higher discount rates led to far less differentiation among the strategies.
Table 2. Net present value (NPV), by management strategy, 1980-2060, in millions of 2005 dollars (M$). Bold face numbers indicate highest NPV.
Management StrategyDiscount Rate
0%1%3%5%
BAU15431123695498
MP16781182704497
EMR20151372760505
The effect of the discount rate among the strategies indicates some underlying differences in the timing of cost and revenue flows. Most of the higher annual net revenue for EMR began to accrue after 2010 and not until the final two decades under MP (Figure 6). The lower revenue in the first decade under EMR was due to the shift in harvesting towards lower value pine and away from higher value Douglas-fir (Figure S2). In the third decade, the lack of the surge in harvest resulted lower revenues for EMR. Consequently, from 1980–2009, EMR underperformed BAU by 11% under a 3% discount rate (Figure 6). However, EMR led the other strategies by 2010–2019 and outperformed BAU by 18% over the post-disturbance period, indicating a higher resilience. The EMR strategy was able to maintain a more consistent and less variable harvest level, resulting in a more stable revenue stream over the full period, again indicating greater resilience. The MP strategy had similar annual net revenue to BAU except in the last two decades where the availability of higher valued Douglas-fir and western redcedar led to higher revenues.
Figure 6. Total annual net revenue (panel a) and annual net revenue differential from business as usual (BAU); (panel b) for the mixed planting (MP) and the early pine cut, mixed planting, and increased natural regeneration (EMR) strategies. The discount rate was 3%, and constant 2005 dollars.
Forests 06 04377 g006
Because of the dramatic differences in harvest rates between strategies, it is informative to also consider the return per unit of wood. In terms of average revenue per cubic metre, EMR was superior under a 0% to 3% discount rate, but was slightly lower than BAU and MP under a 5% discount rate (Table 3). As with total net revenue, there were temporal trade-offs in terms of the annual flow of net revenues per cubic metre: EMR provided lower per cubic metre returns in the first decade, but higher returns from 1990 onwards (Figure 7). From 1980 to 1989, the net revenue of BAU exceeded EMR by $2.37 per cubic metre, but by the 1990–1999 decade EMR revenue exceeded BAU and MP as harvesting shifted to pine in these strategies. A higher discount rate did not affect the initial decade, but reduced the later term differences among strategies. In each case, it was the shift to lower valued pine that resulted in lower revenues. However, the price of pine could change under a directed shift in supply, which could alter these initial revenue differences.
Table 3. Average annual net present value (NPV) per cubic metre by management strategy and discount rate, 1980–2060, in constant 2005 dollars. Bold face numbers indicate highest NPV.
Management StrategyDiscount Rate
0%1%3%5%
BAU 10.417.574.683.36
MP 11.368.004.763.36
EMR12.818.724.833.21
The near-term differences among strategies were even more pronounced in costs than in net revenue, but in this case favour EMR (Table 4). For the initial two decades, EMR costs were $3.40 to $5.30 per cubic metre lower than BAU, a difference of 8%–12%. The EMR costs remained close to or less than BAU and MP cost for the remainder of the simulation. Lower costs were the result of the access to higher volume pine stands during the first two decades and lower silviculture costs as a result of the fewer number of hectares required to maintain the harvest volume (Figure S3).
Table 4. Average costs per cubic metre by management strategy, by decade, 0% discount rate, and constant 2005 dollars. Bold face numbers indicate lowest cost.
Management StrategyDecade
1980–19891990–19992000–2009>2010
BAU 44.843.842.146.01
MP 44.944.042.345.97
EMR39.540.442.343.99
Figure 7. Annual net revenue per cubic metre differential from business as usual (BAU), for the mixed planting (MP) and the early pine cut, mixed planting, and increased natural regeneration (EMR) strategies. The discount rate was 3%, and constant 2005 dollars.
Forests 06 04377 g007

3.4. Uncertainty Assessment

We tested the sensitivity of the results to potential uncertainty of Douglas-fir productivity. The EMR strategy was more sensitive in both harvest rate and NPV than BAU (Table 5) though it still maintained higher values than BAU. The largest change was an 8.3% decline in harvest rate when Douglas-fir productivity was reduced by 20%.
Table 5. Post-disturbance harvest rate and annual net present value (NPV) sensitivity to Douglas-fir productivity ±20%, 3% discount rate, in constant millions of 2005 dollars for BAU and EMR strategies. Bold face numbers indicate highest NPV.
Douglas-Fir ProductivityBAUEMR
Harvest (Mm3·yr−1)% from Base Net Present Value (M$)% from Base Harvest (Mm3·yr−1)% from BaseNet Present Value (M$)% from Base
−20% 1.39−4.8%667−4.01.67−8.3%713−6.2
Base 1.46n/a695n/a1.8n/a760n/a
+20% 1.55+6.2%7294.91.96+7.7%8035.7
We also tested the sensitivity of the results to the uncertainty of log prices. The original simulations used a static THLB area used in determining the annual allowable cut (Table S2). In the sensitivity analyses, the area of the economically harvestable land varied depending on the cost and value data for each stand. We included any stand that was above zero net-revenue as economic. A 20% decrease in log prices led to a 43% decline in the size of the economic THLB, while a 20% price increase led to a 12% increase in the THLB (Table 6). The harvest rate under the price decline fell by about the same amount for BAU and EMR. These timber supply reductions led to a greater decrease in NPV for EMR. The smaller reduction in BAU NPV is the result of the price decline coming into effect after the higher gains in revenue early in the simulation period and due to the surge in harvesting.
Throughout the sensitivity analyses, EMR ranked higher in harvest rate and NPV than BAU except for NPV under a 20% reduction in log prices. This robustness was mainly because of the higher future harvest rates under EMR. The BAU and EMR strategies lost more under lower log prices than they gained under higher prices, indicating a capacity constraint in the socio-ecological system.
Table 6. Impact of log price uncertainty on THLB area, post-disturbance harvest rate, and net present value (NPV); 3% discount rate, in millions of constant 2005 dollars for BAU and EMR strategies. Bold face numbers indicate highest NPV.
Log Price AssumptionTHLBBAUEMR
Area (‘000 ha)% from BaseHarvest (Mm3·year−1)% from BaseNPV (M$2005)% from BaseHarvest (Mm3·year−1)% from BaseNPV (M$2005)% from Base
−20%596−43%0.67−54%672−3.30.72−56%658−13.4
Base1,051n/a1.46n/a695n/a1.8n/a760n/a
+20%1,175+12%1.64+13%7081.91.76+7%8288.9

4. Discussion

The study results indicated that forest management activities can make a difference to the resilience in the supply of multiple ecological goods and services in the context of natural disturbances. Pro-active management to reduce high risk species while maintaining or increasing diversity reduced the damage of a forest health agent. However, we may be limited in our ability to affect changes on tree species diversity as a mechanism to increase resilience. These limitations may come from the local growing conditions, which may only be able to support a limited number or relative abundance of species, or from policies against introducing non-native species.
Where the effect of climate change on forest pests, diseases or species productivity can be reliably forecast, our study suggests that an adaptive forest management in temperate forests can potentially reduce likelihood of catastrophic ecological and economic instability. The EMR strategy combined the targeted removal of a high risk species with increased partial cutting and increasing the diversity through reforestation (both planted and natural). The combination of these activities was able to reduce the mountain pine beetle impact after only two decades when operating on only 0.5%–0.8% of the forest annually. The strategy also changed landscape-level species mix over the longer term. Greater socio-ecological resilience in the EMR landscape was indicated by having the highest post-disturbance growing stock and highest NPV. The EMR landscape had the highest species diversity for the 1990–2009 decades, but only by a minor amount and was similar to the MP landscape for most of the simulation. Removing the high risk species alone will not necessarily increase resilience. For example, a similar study assessing management options in mitigating the risk of mountain pine beetle found that increasing the harvesting rate and targeting pine did not appreciably change the landscape composition over 20 or 70 years because the stands were replanted with the same species as were harvested [41].
Differences in species composition, climate, site conditions and productivity will require different adaptation strategies. Therefore, it is useful to compare the results of our analysis with those for the neighbouring Merritt TSA [20]. In both studies, the EMR strategies resulted in the greatest ecological resilience (growing stock), highest post-disturbance harvest rates and NPV over the 80 years. Also, the MP and EMR strategies resulted in more old growth by the end of the simulation. The biggest difference between the two studies was that in our study, the EMR landscape did not require a surge in harvest rates in response to the threat from mountain pine beetle. Furthermore, in Merritt TSA management activities substantially reduce the diversity under BAU, and increase it in the MP and EMR strategies, whereas in the current study the diversity indices changed by more modest amounts. Another difference was that the MP strategy in our study was economically viable whereas in the Merritt TSA it was not. These three differences in results are due to differences in the starting conditions of the landscapes, the growing conditions within each landscape, and the BAU approach to silviculture as defined by local forest managers. In the 1980 inventory, the Merritt TSA was overwhelmingly dominated by lodgepole pine and had low tree species diversity compared to our study area. The growing conditions across most of the Merritt TSA landscape are compatible with lodgepole pine and it tends to have higher growth rates than the other tree species. Therefore, BAU forest management has a high proportion of lodgepole pine being planted. The growing conditions in our study area are more variable than in the Merritt TSA, and species other than pine may have similar or higher growth rates. Therefore BAU regeneration in our study area had a better evenness among species being planted than in Merritt TSA. Despite this, both studies show the benefits of strategies designed to increase diversity.
The comparison between Merritt and Kamloops TSA results also provide insight into the more general applicability of these study results to temperate and boreal forest adaptive management. Where diversity is currently low, the management strategies were more successful in increasing that diversity and therefore resilience to disturbance. This result is consistent with modelling in the boreal-temperate forests where there was a positive relationship between resistance and diversity within the low diversity areas [19].
The EMR strategy was clearly the best in terms of NPV over the 80 year simulation and had the lowest per cubic meter costs initially. These results were a surprise since there was no surge in harvesting in 2000–2009, and typically, diversification strategies have poorer economic outcomes [42]. However, there were near term opportunity costs associated with achieving these longer term outcomes. The EMR strategy produced lower net revenues in the first decade, though there were lower per cubic metre costs as well.
While the ability to reduce costs may be an incentive for forestry companies in North America or Europe to initiate or participate in a program of climate change adaptation, there is a need for them to have a reasonable return on investment in the near term. In contrast, the public who value the state-owned forests as natural capital for both current and future generations may wish to take a much longer term view and assume a lower discount rate [36]. Consequently, policy makers and stakeholders need to weigh the potential for lost output within a context of higher risk of future infestations or other natural disaster associated with climate change. The sensitivity analysis indicates that the results of our analysis are robust to changes in productivity and log prices.
The economic analysis assumed that log quality and uses are undifferentiated and any change in species mix would not affect the structure of the manufacturing sector, which had a greater level of veneer and plywood production in the 1980s than today in the Kamloops TSA. Any costs associated with shifting production away from veneer into lumber are not factored into this analysis, nor is the market’s ability to absorb a greater volume of lumber or resulting price changes. This change in the supply characteristics could affect the pricing regime, placing less emphasis, thus value, on the logs most suited for veneer or other higher valued products. A change in the price of pine vis-à-vis other species would affect the outcome of our economic analysis, but would still retain the benefit of lower risk.
Under the EMR and MP strategies, the future amount of high risk pine decreased, and the amount of Douglas-fir increased (Figure 3). Although it never reaches the degree of dominance that pine had in 1980, this and the limited increase in diversity led us to consider the potential risks to Douglas-fir from pests and climate change maladaptation.
The forest health agent that historically causes damage to Douglas-fir in B.C. is the western spruce budworm (WSB) Choristoneura occidentalis [43]. Unlike mountain pine beetle, which kills trees within a single year, WSB is a defoliator and multiple years or chronic defoliation is generally required to cause mortality. That type of repeated defoliation occurs within some of the hottest and driest sites within the study area (see Table S1, Interior Douglas Fir Zone) and can cause 4% to 17% mortality of Douglas-fir over 10 years [44]. Within this climate zone, smaller Douglas-fir trees within multistoried stands are the most susceptible to WSB (7% to 24% mortality over 10 years). These multi-story stands can be created through partial harvesting followed by natural regeneration. In our study, 18% of the area was modelled with natural regeneration of Douglas-fir in the high hazard sites in all three management strategies. Therefore, the alternative management strategies did not increase the amount of multi-story Douglas-fir stands on the landscape. However, the total volume of Douglas-fir on hot, dry sites in 2060 was lower in the BAU landscape (14 Mm3) compared to the MP and EMR landscapes (15 Mm3). Recall that the total growing stock also differed between strategies. As a proportion of total volume in 2060, the amount of Douglas-fir on hot, dry sites varied from 11% under BAU to 12.5% under MP and EMR. That difference is likely well within the uncertainty of this projection. Nonetheless, whether these trade-offs in forest health risks are acceptable will depend on the stakeholders.
Climate change also poses a risk to Douglas-fir productivity. Although growth rates may increase on sites that are not moisture limited, the hot, dry sites most susceptible to WSB are also those where Douglas-fir growth is already moisture limited [33]. Climatic moisture deficits for these areas calculated using the ClimateWNA spatial software [45] are projected to increase by 5% to 30% by the mid-century in response to warming and decrease in summer precipitation. This will increase drought stress, increase susceptibility to disease and reduce productivity for Douglas-fir, and many other species [5]. Adaptive strategies to maintain resilience will require the planting of provenances with greater drought tolerance, particularly where alternate species may not be available [46].
Invasive species and climate change may bring novel pathogens into managed forest ecosystems [47,48]. Our study has focused on known threats, but new agents could negate any potential resilience gain from a shift in management. The theoretical way to reduce the risks from unknown pathogens is to increase diversification as described in the insurance hypothesis [23]. This is one of the reasons why our management strategies were designed to increase diversity, rather than solely removing pine. Future research could incorporate a range of expected and unexpected pathogens in assessing management implications. Furthermore, monitoring of forest health will need to be sensitive to damage from novel pathogens. As our Kamloops TSA results showed, a tailored management strategy can reduce the damage of a forest health agent while increasing ecological goods and services and the stability of timber revenue. However, there are multiple objectives in forest policy in North America including retaining old-growth forests to protect habitat, biodiversity, and aesthetic values. For example, in the Kamloops TSA, old growth forests help support three herds of woodland caribou as well as 51 other species of special concern under the Species at Risk Act [49]. By maintaining a larger growing stock, our results indicate that pro-active policies intended to increase forest resilience and reduce forest health damage could also support species at risk.
In addition to local socio-economic impacts, changes caused from the beetle outbreak and subsequent forest management response may have a global effect. The tree mortality impact of the beetle and surge in harvesting led to increased carbon emissions and decreased sinks resulting in affected forests becoming net emitters of carbon to the atmosphere [50]. Reduction in carbon sinks due to a variety of pathogens have been documented around the world (e.g., [51]). Further impacts of climate change may prolong that condition, delaying the forests returning to being a net sink (e.g., [52]). However, if natural resource managers implement strategies that increase resilience and reduce the impact of future forest health outbreaks we could help maintain forest carbon stocks and mitigate climate change through adaptation.

5. Conclusions

A changing climate with associated changes in tree survival, growth and disturbance is increasing the uncertainty of the future timber supply and other ecological goods and services we obtain from forests. Increasing resilience is one of the potential strategies to deal with these uncertainties. In light of a mountain pine beetle epidemic caused in part by climate change, we have assessed our ability to reduce this uncertainty through strategies that support proactive reductions of high risk species while maintaining or increasing tree species diversity. Our indicators of resilience were tree species diversity, post-disturbance growing stock, harvest rate level and stability, NPV, and net revenues. Our first conclusion was that management actions that impacted 0.5% to 1.5% of the area annually were able to increase the resilience of the landscape in a timely way only if changes to both harvesting and regeneration strategies were employed. Second, that improvements in growing stock and socio-economic resilience indicators were not correlated with diversity indicators. Third, we determined that although ecologically and economically viable, achieving this resilience has some upfront cost and any implementation will depend on the level of risk and discount rate acceptable to all forestry stakeholders. Consequently, policies must be designed to meet the conditions of the particular management unit, i.e., climate, ecosystems and socio-economic environment. Learning and adapting our management to new information will be critical as we proceed through a changing climate.

Supplementary Files

Supplementary File 1

Acknowledgments

We would like to thank Ecora consulting for their capable support for both the forest ecosystem and economic modelling. Brian Raymer provided helpful suggestions and forest management experience on this project. The Ministry of Forests, Lands and Natural Resource Operations funded this project.

Author Contributions

C. Dymond led the overall study, designed and led the ecological modelling and led the writing of the manuscript. D. Spittlehouse contributed extensively to study design and writing. S. Tedder designed and led the economic analyses and contributed to the manuscript. Katherine Hopkins, Katharine McCallion and James Sandland contributed to the study design, review of modelling and economic analyses results, and the manuscript.

Conflicts of Interest

The authors declare no conflict of interest.

References

  1. IPCC. Summary for Policy Makers. In Climate Change 2014: Impacts, Adaptation and Vulnerability, Working Group II, 5th Assessment Report; Intergovernmental Panel on Climate Change: Geneva, Switzerland, 2014; p. 44. [Google Scholar]
  2. Costanza, R.; de Groot, R.; Sutton, P.; van der Ploeg, S.; Anderson, S.J.; Kubiszewski, I.; Farber, S.; Turner, R.K. Changes in the global value of ecosystem services. Glob. Environ. Chang. 2014, 26, 152–158. [Google Scholar] [CrossRef]
  3. Allen, C.D.; Macalady, A.K.; Chenchouni, H.; Bachelet, D.; McDowell, N.; Vennetier, M.; Kitzberger, T.; Rigling, A.; Breshears, D.D.; Hogg, E.H.; et al. A global overview of drought and heat-induced tree mortality reveals emerging climate change risks for forests. For. Ecol. Manag. 2010, 259, 660–684. [Google Scholar] [CrossRef]
  4. Sturrock, R.N.; Frankel, S.J.; Brown, A.V.; Hennon, P.E.; Kliejunas, J.T.; Lewis, K.J.; Worrall, J.J.; Woods, A.J. Climate change and forest diseases. Plant Pathol. 2011, 60, 133–149. [Google Scholar] [CrossRef]
  5. Fettig, C.J.; Reid, M.L.; Bentz, B.J.; Sevanto, S.; Spittlehouse, D.L.; Wang, T. Changing climates, changing forests: A western North American perspective. J. For. 2013, 111, 214–228. [Google Scholar] [CrossRef]
  6. Taylor, S.W.; Carroll, A.L.; Alfaro, R.I.; Safranyik, L.; Wilson, B. Forest, climate and mountain pine beetle outbreak dynamics in Western Canada. In The Mountain Pine Beetle: A Synthesis of Biology, Management and Impacts on Lodgepole Pine; Safranyik, L., Wilson, B., Eds.; Natural Resources Canada: Victoria, BC, Canada, 2006; pp. 67–94. [Google Scholar]
  7. Spittlehouse, D.L. Integrating climate change adaptation into forest management. For. Chron. 2005, 81, 691–695. [Google Scholar] [CrossRef]
  8. Hallegatte, S. Strategies to adapt to an uncertain climate change. Glob. Environ. Chang. 2009, 19, 240–247. [Google Scholar] [CrossRef]
  9. Wohlgemuth, T.; Bürgi, M.; Scheidegger, C.; Schütz, M. Dominance reduction of species through disturbance—A proposed management principle for central European forests. For. Ecol. Manag. 2002, 166, 1–15. [Google Scholar] [CrossRef]
  10. Campbell, E.M.; Saunders, S.C.; Coates, K.D.; Meidinger, D.V.; MacKinnon, A.; O’Neill, G.A.; MacKillop, D.J.; DeLong, S.C.; Morgan, D.G. Ecological Resilience and Complexity: A Theoretical Framework for Understanding and Managing British Columbia’s Forest Ecosystems in a Changing Climate; Technical Report 055; Government of B.C.: Victoria, BC, Canada, 2009. [Google Scholar]
  11. Puettmann, K.J.; Coates, D.; Messier, C. A Critique of Silviculture: Managing for Complexity; Island Press: Washington, DC, USA, 2009. [Google Scholar]
  12. Cameron, A.D. Building resilience into Sitka Spruce (Picea sitchensis (Bong.) Carr.) forests in Scotland in response to the threat of climate change. Forests 2015, 6, 398–414. [Google Scholar] [CrossRef]
  13. Windmuller-Campione, M.A.; Long, J.N. If long-term resistance to a spruce beetle epidemic is futile, can silvicultural treatments increase resilience in spruce-fir forests in the Central Rocky mountains. Forests 2015, 6, 1157–1178. [Google Scholar] [CrossRef]
  14. Walker, B.; Holling, C.S.; Carpenter, S.R.; Kinzig, A. Resilience, adaptability and transformability in social-ecological systems. Ecol. Soc. 2004, 9, 9. [Google Scholar]
  15. Folke, C. Resilience: the emergence of a perspective for social-ecological systems analyses. Glob. Environ. Chang. 2006, 16, 253–267. [Google Scholar] [CrossRef]
  16. Rist, L.; Moen, J. Sustainability in forest management and a new role for resilience thinking. For. Ecol. Manag. 2013, 310, 416–427. [Google Scholar] [CrossRef]
  17. DeRose, R.J.; Long, J.A. Resistance and resilience: A conceptual framework for silviculture. For. Sci. 2014, 60, 1205–1212. [Google Scholar] [CrossRef]
  18. Seidl, R.; Spies, T.A.; Peterson, D.L.; Stephens, S.L.; Hicke, J.A. Searching for resilience: Addressing the impacts of changing disturbance regimes on forest ecosystem services. J. Appl. Ecol. 2015. [Google Scholar] [CrossRef]
  19. Duveneck, M.J.; Scheller, R.M. Measuring and managing resistance and resilience under climate change in northern Great Lake forests (USA). Land. Ecol. 2015, 30, 1–18. [Google Scholar] [CrossRef]
  20. Dymond, C.C.; Tedder, S.; Spittlehouse, D.L.; Raymer, B.; Hopkins, K.; McCallion, K.; Sandland, J. Diversifying managed forests to increase resilience and adapt to climate change. Can. J. For. Res. 2014, 44, 1196–1205. [Google Scholar] [CrossRef]
  21. Folke, C.; Carpenter, S.; Walker, B.; Scheffer, M.; Elmqvist, T.; Gunderson, L.; Holling, C.S. Regime shifts, resilience, and biodiversity in ecosystem management. Ann. Rev. Ecol. Evol. System. 2004, 35, 557–581. [Google Scholar] [CrossRef]
  22. Ives, A.R.; Carpenter, S.R. Stability and diversity of ecosystems. Science 2007, 317, 58–62. [Google Scholar] [CrossRef] [PubMed]
  23. Yachi, S.; Loreau, M. Biodiversity and ecosystem productivity in a fluctuating environment: The insurance hypothesis. Proc. Nat. Acad. Sci. USA 1999, 96, 1463–1468. [Google Scholar] [CrossRef] [PubMed]
  24. Dymond, C.C.; Neilson, E.T.; Stinson, G.; Porter, K.; MacLean, D.A.; Gray, D.R.; Campagna, M.; Kurz, W.A. Future spruce budworm outbreak may create a carbon source in eastern Canadian forests. Ecosystems 2010, 13, 917–931. [Google Scholar] [CrossRef]
  25. Day, J.K.; Perez, D.M. Reducing uncertainty and risk through forest management planning in British Columbia. For. Ecol. Manag. 2013, 300, 117–124. [Google Scholar] [CrossRef]
  26. Temperli, C.; Bugmann, H.; Elkin, C. Adaptive management for competing forest goods and services under climate change. Ecolog. Appl. 2012, 22, 2065–2077. [Google Scholar] [CrossRef]
  27. Steenberg, J.W.N.; Duinker, P.N.; Bush, P.G. Exploring adaptation to climate change in the forests of central Nova Scotia, Canada. For. Ecol. Manag. 2011, 262, 2316–2327. [Google Scholar] [CrossRef]
  28. Schou, E.; Jacobsen, J.B.; Kristensen, K.L. An economic evaluation of strategies for transforming even-aged into near-natural forestry in a conifer-dominated forest in Denmark. For. Policy Econ. 2012, 20, 89–98. [Google Scholar] [CrossRef]
  29. Lloyd, D.A.; Angove, K.; Hope, G.D.; Thompson, C. A guide to site identification and interpretation for the Kamloops forest region. In Land Management Handbook 23nd; Government of British Columbia: Victoria, BC, Canada, 1990. [Google Scholar]
  30. PCIC. Climate Summary of the Thompson-Okanagan Region; Pacific Climate Impacts Consortium: Victoria, BC, Canada, 2014; p. 4. [Google Scholar]
  31. Sillmann, J.; Kharin, V.V.; Zwiers, F.W.; Zhang, X.; Bronaugh, D. Climate extremes indices in the CMIP5 multimodel ensemble: Part 2. Future climate projections. J. Geophys. Res.: Atmospheres 2013, 118, 2473–2493. [Google Scholar] [CrossRef]
  32. Haughian, S.R.; Burton, P.J.; Taylor, S.W.; Curry, C. Expected effects of climate change on forest disturbance regimes in British Columbia. B.C. J. Ecosys. Manag. 2012, 13, 1–24. [Google Scholar]
  33. Griesbauer, H.P.; Green, D.S.; O’Neill, G.A. Using a spatiotemporal climate model to assess population-level Douglas-fir growth sensitivity to climate change across large climatic gradients in British Columbia, Canada. For. Ecol. Manag. 2011, 261, 589–600. [Google Scholar] [CrossRef]
  34. Carson, D.M. Timber supply analysis: An industrial model from British Columbia. For. Chron. 1995, 71, 735–738. [Google Scholar] [CrossRef]
  35. Rehfeldt, G.E.; Jacquish, B.C. Ecological impacts and management strategies for western larch in the face of climate-change. Mitigat. Adapt. Strat. Glob. Chang. 2010, 15, 283–306. [Google Scholar] [CrossRef]
  36. Adger, W.N.; Desai, S.; Goulden, M.; Hulme, M.; Lorenzoni, I.; Nelson, D.R.; Naess, L.O.; Wolf, J.; Wreford, A. Are there social limits to adaptation to climate change? Clim. Chang. 2009, 93, 335–354. [Google Scholar] [CrossRef]
  37. Miller, L.T.; Park, C.S. Decision making under uncertainty—Real options to the rescue? Eng. Econ. 2002, 47, 105–150. [Google Scholar] [CrossRef]
  38. Roumboutsos, A.B. Sustainability, social discount dates and the selection of project procurement method. Int. Adv. Econ. Res. 2010, 16, 165–174. [Google Scholar] [CrossRef]
  39. Magurran, A.E. Ecological Diversity and Its Measurement; Princeton University Press: Princeton, NJ, USA, 1988. [Google Scholar]
  40. E-Flora B.C.: Electronic Atlas of the Flora of British Columbia; Klinkenberg, B. (Ed.) University of British Columbia: Vancouver, BC, Canada, 2013.
  41. Schneider, R.R.; Latham, M.C.; Stelfox, B.; Farr, D.; Boutin, S. Effects of a severe mountain pine beetle epidemic in western Alberta, Canada under two forest management strategies. Int. J. For. Res. 2010. [Google Scholar] [CrossRef]
  42. Hildebrandt, P.; Knoke, T. Investment decisions under uncertainty—A methodological review on forest science studies. For. Policy Econ. 2011, 13, 1–15. [Google Scholar] [CrossRef]
  43. Maclauchlan, L.E.; Brooks, J.E.; Hodge, J.C. Analysis of historic western spruce budworm defoliation in south central British Columbia. For. Ecol. Manag. 2006, 226, 351–356. [Google Scholar] [CrossRef]
  44. Maclauchlan, L.; Brooks, J.E. Influence of past forestry practices on western spruce budworm defoliation and associated impacts in southern British Columbia. B.C. J. Ecosyst. Manag. 2009, 10, 37–49. [Google Scholar]
  45. Wang, T.; Hamman, A.; Spittlehouse, D.L.; Murdock, T.Q. ClimateWNA—High-resolution spatial climate data for western North America. J. Appl. Meteorol. Climatol. 2012, 51, 16–29. [Google Scholar]
  46. Crookston, N.L.; Rehfeldt, G.E.; Dixon, G.E.; Weiskittel, A.R. Addressing climate change in the forest vegetation simulator to assess impacts on landscape forest dynamics. For. Ecol. Manag. 2010, 260, 1198–1211. [Google Scholar] [CrossRef]
  47. Dukes, J.S.; Pontius, J.; Orwig, D.; Garnas, J.R.; Rodgers, V.L.; Brazee, N.; Cooke, B.; Theoharides, K.A.; Stange, E.E.; Harrington, R.; et al. Responses of insect pests, pathogens, and invasive plant species to climate change in the forests of northeastern North America: What can we predict? Can. J. For. Res. 2009, 39, 231–248. [Google Scholar] [CrossRef]
  48. Smith, A.L.; Hewitt, N.; Klenk, N.; Bazely, D.R.; Yan, N.; Wood, S.; Henriques, I.; MacLellan, J.I.; Lipsig-Mummé, C. Effects of climate change on the distribution of invasive alien species in Canada: A knowledge synthesis of range change projections in a warming world. Environ. Rev. 2012, 20, 1–16. [Google Scholar] [CrossRef]
  49. Pearson, M.; Healey, M.C. Species at Risk and Local Government: A Primer for B.C. Stewardship Centre of British Columbia: Courtenay, Canada, 2012. Available online: http://www.speciesatrisk.bc.ca/ (accessed on 1 October 2013).
  50. Kurz, W.A.; Dymond, C.C.; Stinson, G.; Rampley, G.J.; Neilson, E.T.; Carroll, A.L.; Ebata, T.; Safranyik, L. Mountain pine beetle and forest carbon feedback to climate change. Nature 2008, 452, 987–990. [Google Scholar] [CrossRef] [PubMed]
  51. Hicke, J.A.; Allen, C.D.; Desai, A.R.; Dietze, M.C.; Hall, R.J.; Kashian, D.M.; Moore, D.; Raffa, K.F.; Sturrock, R.N.; Vogelmann, J. Effects of biotic disturbances on forest carbon cycling in the United States and Canada. Glob. Chang. Biol. 2012, 18, 7–34. [Google Scholar] [CrossRef]
  52. Metsaranta, J.; Dymond, C.C.; Kurz, W.A.; Spittlehouse, D.L. Uncertainty of 21st century growing stocks and GHG balance of forests in British Columbia, Canada resulting from potential climate change impacts on ecosystem processes. For. Ecol. Manag. 2011, 262, 827–837. [Google Scholar] [CrossRef]

