Abstract
The study of density and growth of pine, birch and oak seedlings and saplings in canopy gaps in the urban boreal forest in Riga, Latvia, indicates that natural regeneration can increase diversity in small gaps caused by tree mortality, and can ensure conversion from even-aged pine forest. Abundant regeneration in small gaps showed that light (gap area) was only one of the factors affecting tree regeneration in the gaps. The depth of the O layer and pH were suggested to be important factors for the establishment and growth of pine and birch. For oak, the main factors for establishment and growth were favorable moisture, higher pH and N concentration. Knowledge of ecological factors affecting the establishment of seedlings and growth of saplings of the most common trees species in the urban boreal forest is needed to predict successional trajectories and to aid management.
1. Introduction
The concept of the urban forest is quite broad, but it can generally be considered woodland ecosystem remnants surviving from times before urban development, or created as natural areas [1]. In large parts of Fennoscandia, past management of the urban forest during the last few decades has often caused simplification of the boreal forest structure and development of even-aged pine stands [2]. However, disturbances and succession are a natural part of the dynamics of those woodlands. Natural tree regeneration in the urban forest can diversify the forest landscape, increasing the resilience of city environments in the time of global change [1,3].
In natural woodland the landscape is usually structurally and compositionally diverse (species composition, mixture, age structure and dead wood) on multiple scales due to natural disturbances (fires, storms, insects, pathogens, floods, animals) and subsequent succession [4,5,6]. Gaps in the forest canopy promote regeneration and growth of some tree species, increase heterogeneity of the forest floor and drive successional replacement in the tree canopy [7]. However, in the urban forest, canopy gaps might be less important in promoting tree regeneration [8,9,10]. The effect of the gap area on the diversity of the forest floor depends on the availability of specific niches for species, stohasticity, habitat type and site quality [11]. The combinations of these factors create small-scale heterogeneity for tree regeneration, natural colonization and succession [12,1].
Homogeneous even-aged Scots pine (Pinus sylvestris L.) forests are being actively converted to multifunctional mixed stands using a wide range of different forest management practices and natural vegetation dynamics [5]. In urban pine forests regeneration is often accomplished by other tree species, such as pedunculate oak (Quercus robur L.) in some parts of the southern boreal and temperate zones [13,14,15,16,17] and silver birch (Betula pendula Roth.) in the northern forest. With global climate change, the natural regeneration of oak and birch is expected to increase even more [18]. This can create new close-to-nature community types with specific composition and structure in the urban forest [1], which might represent self-maintaining ecosystems [4,19]. The integration of natural processes in even-aged pine forest management in urban areas can be an efficient management tool not only for ecological but also economic reasons [9,14].
To efficiently utilize natural succession in urban forest management, studies are needed to determine regeneration patterns in canopy gaps in relation to different factors. We hypothesized that the light (area of gap) is not the main factor for establishment of seedlings and growth of saplings of trees species in the urban forest. The aim of this study was to determine the relationships between the natural regeneration of pine, birch and oak (density and height increment of seedlings and saplings) and the canopy gap area, vegetation composition, and soil factors.
2. Experimental Section
2.1 Site Description
The study area is located in the hemi-boreal forest zone, the transition between the boreal coniferous and temperate broadleaved woodland. Vegetation is dominated by coniferous tree species (P. sylvestris and Picea abies (L.) H. Karst.) mixed with deciduous species (mainly B. pendula, Populus tremula L., Alnus glutinosa (L.) Gaertn. and Alnus incana (L.) Moench), while broad-leaved tree species such as Q. robur and Fraxinus excelsior L. are less abundant [20]. The area has a relatively moderate and rainy climate with an average temperature of 16.5 °C during the warmest month and −6 °C during the coldest month. Annual precipitation is 750–850 mm, about 500 mm of which falls in the warm period [21].
The study was conducted in the Vecdaugava forest tract (570 ha) located in the northeastern part of Riga, the capital city of Latvia (Figure 1). In the inner city there are 4243.7 ha of forest. Riga, with a city area of 304.05 km2, has a population of 641,007 (density of the population 2108.2 per 1 km2) (year 2015) [22,23].
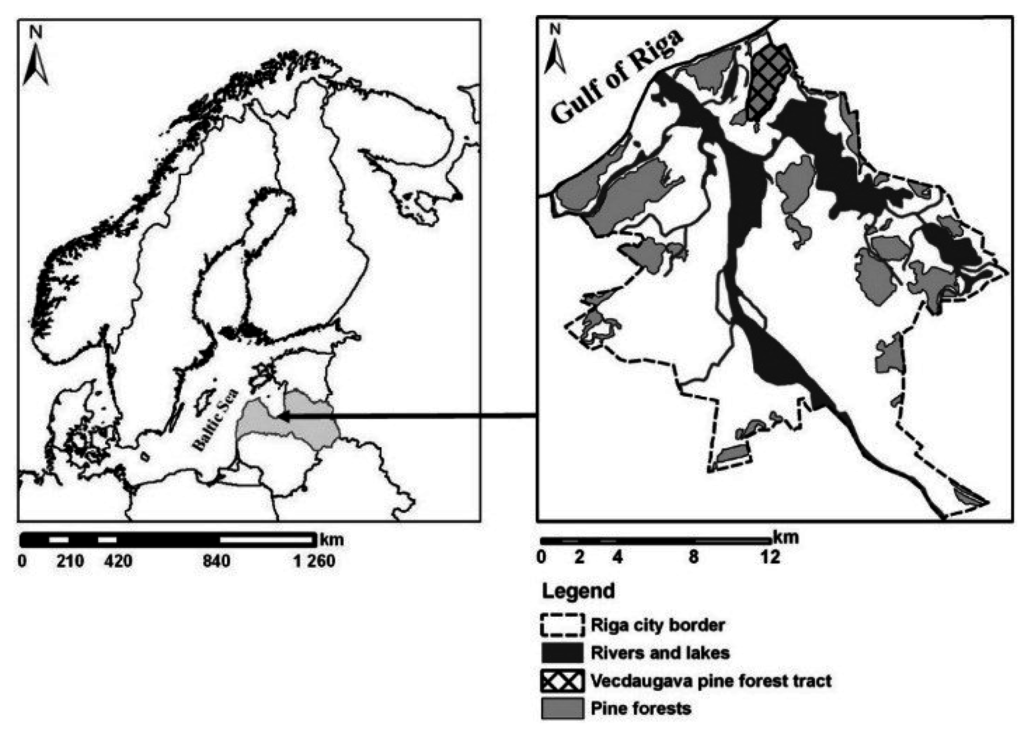
Figure 1.
Location of Latvia and Vecdaugava forest tract in city of Riga.
The dominant tree species in the Vecdaugava forest is Scots pine (P. sylvestris) (88% of the total forest area) and stand age is mostly 80–100 years. The Vecdaugava forest has a well-expressed dune topography, which results in variable moisture conditions. The dominant soil texture is sandy soils.
2.2. Methods
Data on the understorey vegetation and the shrub layer were collected in summer 2013–2014 from mesic (Myrtillus) and sub-xeric (Vaccinium) forest site types in canopy gaps of the Vecdaugava forest tract. In order to reduce temporal variation, particularly in the organic layer [24], the soil sampling was conducted in the drier season, August 2014. Gaps of various area have formed due to natural disturbances and forest management. A gap was defined as a small opening formed in the forest canopy [25]. A total of 23 gaps were selected randomly, which were considered to be representative of the study area. The area of each gap, delineated by vertical projection of the canopy of trees bordering the gap, was measured as an ellipse by the longest line segment within each canopy gap and then the longest line segment orthogonal to the first [26]. The gaps were classified into four area classes: ≤100 m2; 101–150 m2; 151–300 m2 and >1000 m2. Gaps in class >1000 m2 were connected with other gaps and represented very open patches. In addition, as a control, circular plots with a diameter of 20 m were randomly located in three places without gaps.
The Braun-Blanquet method was used to describe the plant communities [27]. Cover in percent of all herbaceous species and mosses was estimated visually in subplots in both gaps and control plots. Subplots (1 × 1 m) were placed in the center of each selected gap and plot, and along the longest transect through the gap and an orthogonal transect at distances of 4 m (Figure 2).
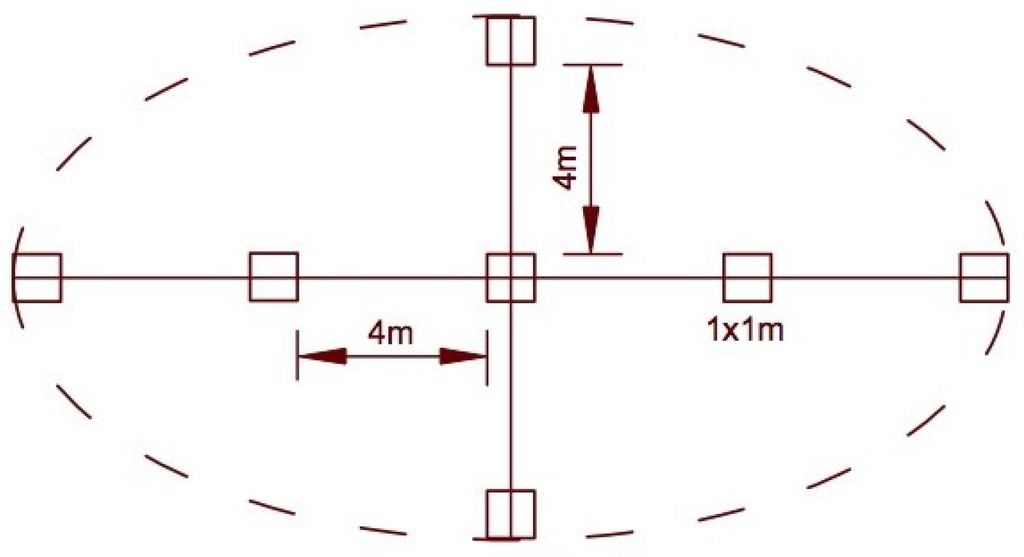
Figure 2.
Location of subplots in sampling gap.
The numbers of pine, birch and oak understorey trees in the 23 selected gaps and three control plots (totally 26) were counted in four height classes: I class (<1.0 m); II class (1.1–2.0 m); III class (2.1–5.0 m); IV class (>5.1 m). For simplicity the trees in height class <1.0 m are further called seedlings and the taller trees are called saplings. Tree discs at the base were removed from at least one individual of each species in each height class. For these individuals tree height was measured precisely. Age was determined by number of tree rings after sanding the discs. Tree cores were removed from larger trees >5 cm diameter with a tree borer, and glued into grooves of boards before sanding and counting. Height of the larger trees was measured using a Suunto clinometer. The mean annual increment in height was calculated by dividing the total tree height by age, as an estimate of growth rate. The main vegetation gradients were derived by detrended correspondence analysis (DCA). The relationships of plot scores with soil factors and tree understorey factors were determined by Pearson correlation analysis.
In each vegetation sampling gap, the soil samples were collected in three replicates from the O horizon and mineral topsoil layer (Ah or E horizon, depth 0–10 cm). Soil texture and soil groups were determined according to the FAO WRB (Food and Agriculture Organization of the United Nations World Reference Base for Soil Resources) soil classification system [28]. Preparation, physical and chemical analyses of soil samples were conducted at the Faculty of Geography and Earth Sciences, University of Latvia.
Air-dried soil samples were sieved through a 2-mm sieve (mineral soil) and 4-mm sieve (O horizon). Physical and chemical analyses of soil samples were done in three replicates. The reliability of obtained results was assessed after chemical analysis. The laboratory results were considered acceptable when the difference between the values obtained was less than ±10%. Soil pHKCl value was measured with a glass electrode in 1 M KCl (1:5 mass-to-volume ratio) [29,24], using a pH-meter WTW inoLab. Exchangeable elements (Ca2+, Mg2+, K+, Na+, Al3+, Mn+, Fe2+, H+) (mg·kg−1) were determined in BaCl2 solution by using an atomic absorption spectrometer Perkin Elmer Analyst 200 [29,24]. Cation exchange capacity (CEC) (mEq 100 g−1) and exchangeable titrable acidity (mEq 100 g−1) were determined according to ICP (The International Co-operative Programme on Assessment and Monitoring of Air Pollution Effects on Forests) forest monitoring methodology [24]. Effective cation exchange capacity (ECEC) (mEq 100 g−1) was calculated from the sum of exchangeable bases and exchangeable acidity [30]. Total N (mg·g−1) was estimated using the standard Kjeldahl method [24], and total organic carbon (%) was measured with a total organic carbon analyzer Shimadzu TOC-Vcsn with Solid Sample Module SSM-5000A with combustion of soil samples at 900 °C [29,24].
In addition, the survey of oak regeneration was conducted throughout the Vecdaugava forest in 2014 to determine regeneration patterns on a larger scale. The study area was divided in polygons using an Orthophoto map of Latvia at a scale of 1:10,000 (2003–2005) and by field observations of the vegetation, its cover, relief, moisture and artificial objects (roads, trenches). Analyses of the collected data were conducted using ESRI ArcGis Desktop ArcMap10.2 software. On a map, the forest area was divided into three polygons based on the occurrence of oak in forest understorey (no oaks, 1–3 oaks/10 m2; >3 oaks/10 m2).
3. Results
The size of the sampled gap area varied between 42 m2 to more than 1000 m2 in connected gaps, with a mean area of 708 m2 (Table 1).

Table 1.
Gap and control plot characteristics.
| Area (m2) | Number | Mean Area (m2) |
|---|---|---|
| Control | 3 | 314 |
| ≤100 | 11 | 63 |
| 101–200 | 5 | 136 |
| 201–300 | 4 | 259 |
| >1000 | 3 | 1000 |
The dominant overstorey and understorey tree species was pine. Other tree and tall shrub species were aspen (P. tremula), rowan (Sorbus aucuparia L.), maple (Acer platanoides L.), silver birch (B. pendula), alder buckthorn (Frangula alnus Mill.) and pedunculate oak (Q. robur), but these did not occur in the canopy layer.
The highest mean and maximum density of pine in the height classes <1 m and 1.1–2.0 m were found in gaps ≤100 m2 (Table 2). Birch in the height class <1 m was not found in gaps ≤100 m2, although the density of the other height classes was highest there. Oak seedlings were found in the control plots and in gaps of all area classes, but density was highest in the gaps with smaller area. However, the variability in seedling and sapling density of all tree species among gaps within an area classe and in control plots was extremely high. The only significant correlation of the gap area with seedling density was found for birch (r = −0.523, p < 0.05), not using control plots in the analysis.
The map produced from the survey of oak saplings showed that regeneration is occurring in approximately one half of the study area (Figure 3). Higher density of saplings was found in relatively moist and shaded patches with dense vegetation within flat and depression topography. Areas without oak saplings occurred in dry areas with eolian dune topography.
Table 2.
Mean number of seedlings (<1.0 m) and saplings (>1.1 m) of P. sylvestris, B. pendula and Q. robur in gaps of different area classes and control plots (per ha).
| Height/Gap Area | Control | ≤100 m2 | 101–200 m2 | 201–300 m2 | >1000 m2 |
|---|---|---|---|---|---|
| P. sylvestris | |||||
| <1.0 m; mean ± SD * | 0 | 4033 ± 8859 | 811 ± 649 | 372 ± 460 | 153 ± 68 |
| max | 0 | 12,893 | 1460 | 833 | 221 |
| min | 0 | 4826 | 163 | 88 | 85 |
| 1.1–2.0 m; mean ± SD | 0 | 2028 ± 4446 | 476 ± 508 | 147 ± 64 | 713 ± 451 |
| max | 0 | 6474 | 984 | 211 | 1164 |
| min | 0 | 2418 | 32 | 78 | 262 |
| 2.1–5.0 m; mean ± SD | 0 | 1232 ± 2557 | 478 ± 387 | 202 ± 134 | 1864 ± 869 |
| max | 0 | 3789 | 865 | 336 | 2733 |
| min | 0 | 1324 | 91 | 68 | 995 |
| >5 m; mean ± SD | 0 | 334 ± 814 | 328 ± 305 | 142 ± 236 | 287 ± 248 |
| max | 0 | 1148 | 634 | 378 | 535 |
| min | 0 | 480 | 23 | 94 | 38 |
| B. pendula | |||||
| <1.0 m; mean ± SD | 127 ± 146 | 0 | 181 ± 257 | 79 ± 157 | 27 ± 23 |
| max | 273 | 0 | 439 | 235 | 50 |
| min | 19 | 0 | 76 | 78 | 4 |
| 1.1–2.0 m; mean ± SD | 32 ± 55 | 1742 ± 4295 | 798 ± 453 | 20 ± 39 | 28 ± 49 |
| max | 87 | 6038 | 851 | 58 | 77 |
| min | 23 | 2553 | 56 | 20 | 21 |
| 2.1–5.0 m; mean ± SD | 0 | 2538 ± 7844 | 190 ± 137 | 49 ± 97 | 41 ± 2 |
| max | 0 | 10,382 | 327 | 146 | 43 |
| min | 0 | 5305 | 54 | 49 | 39 |
| >5 m; mean ± SD | 0 | 1323 ± 4315 | 0 | 39 ± 77 | 21 ± 21 |
| max | 0 | 5638 | 0 | 116 | 43 |
| min | 0 | 2991 | 0 | 39 | 0.5 |
| Q. robur | |||||
| <1.0 m; mean ± SD | 637 ± 223 | 1358 ± 1594 | 409 ± 334 | 278 ± 208 | 10 ± 17 |
| max | 860 | 2952 | 744 | 487 | 27 |
| min | 414 | 235 | 76 | 70 | 7 |
| 1.1–2.0 m; mean ± SD | 0 | 62 ± 146 | 0 | 0 | 0 |
| max | 0 | 208 | 0 | 0 | 0 |
| min | 0 | 84 | 0 | 0 | 0 |
* Standard deviation.
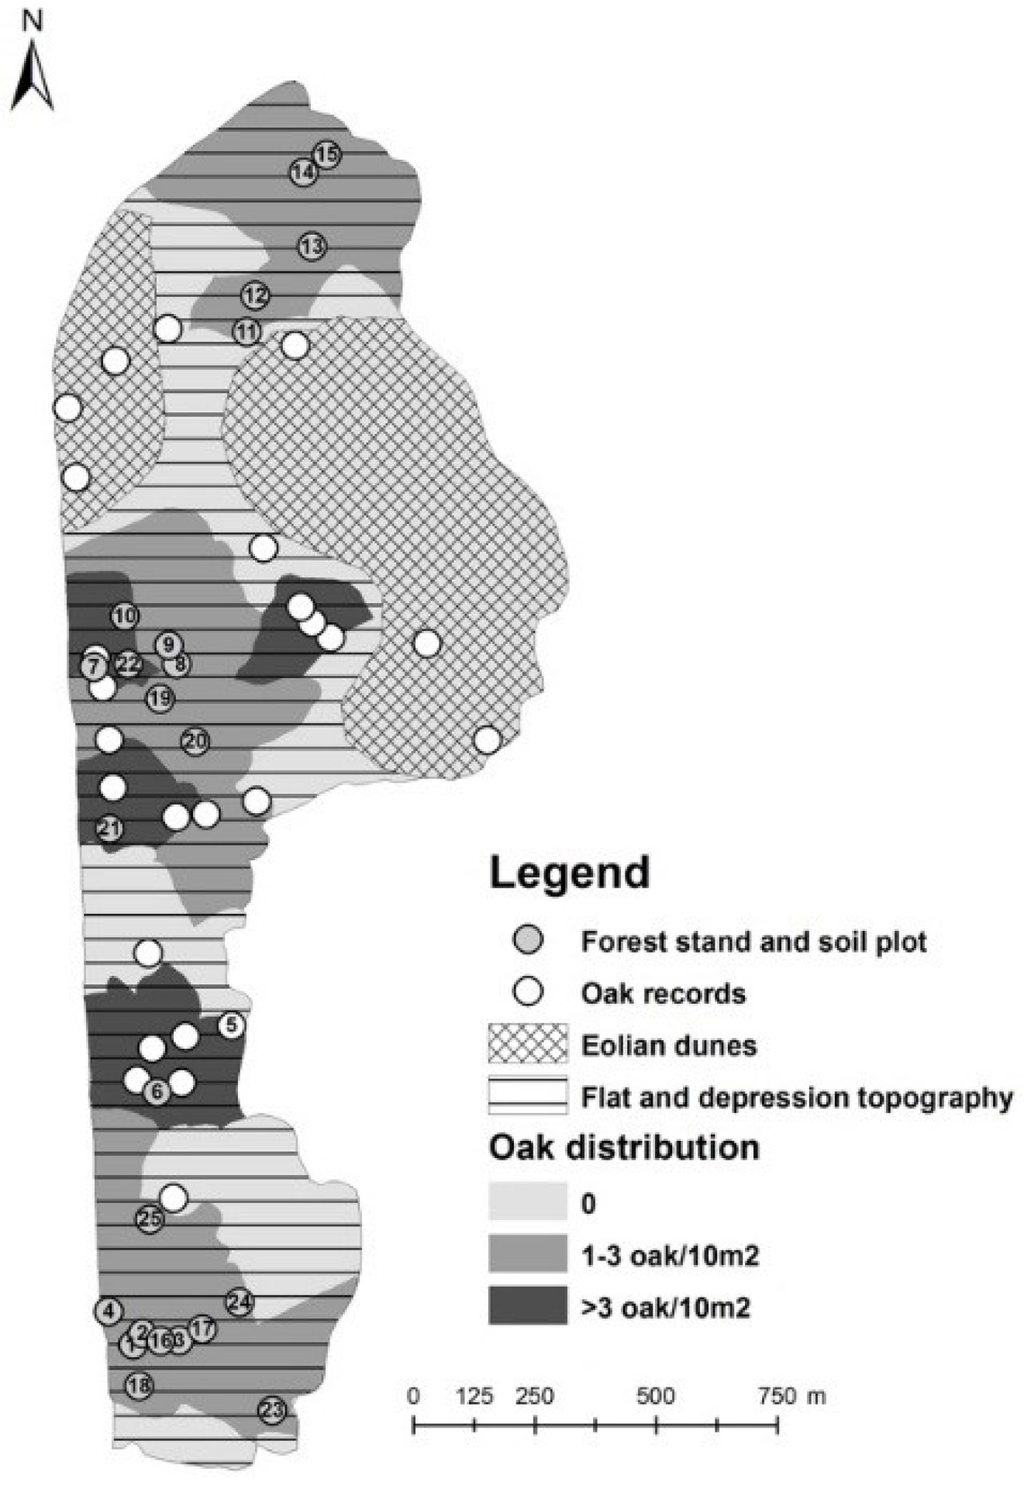
Figure 3.
Distribution of study sampling sites and areas with oak saplings within the Vecdaugava forest.
The forest floor was generally densely covered with vegetation. The plant communities in gaps were dominated by Calluna vulgaris (L.) Hull, Vaccinium myrtillus L. and Vaccinium vitis-idaea L. (mean 24.0%, 8.4% and 6.5% of gap area, respectively). V. myrtillus and V. vitis-idaea dominated in control plots (mean 16.5% and 10.7%, respectively). Hylocomium splendens (Hedw.) Schimp and Pleurozium schreberi (Willd.ex Brid.) Mitt. (mean 24.5% and 42.0% in gaps and 21.0% and 44.3% in control plots, respectively) were the dominant moss species. The most common graminoid species was Deschampsia flexuosa (L.) (mean 8.0% in gaps and 4.5% in control plots), and the most dominant herb species was Melampyrum pratense (L.) (mean 10.0% in gaps and 9.2% in control plots).
Figure 4 shows a DCA ordination of vegetation data, with vectors indicating significant correlations of species with the axes. The DCA ordination indicates that the gradient from top to bottom can be explained by disturbance, with open sand patches colonized by L. glaucum and lichens on the top of the ordination and denser gaps with C. vulgaris on the bottom. Typical dry pine forest species such as V. myrtillus and H. splendens occurred in communities on the left side of the ordination. On the right side of the ordination D. flexuosa and P. shreberi were more abundant. Gaps with areas ≤100 m2 were mostly found on the right side of the ordination.
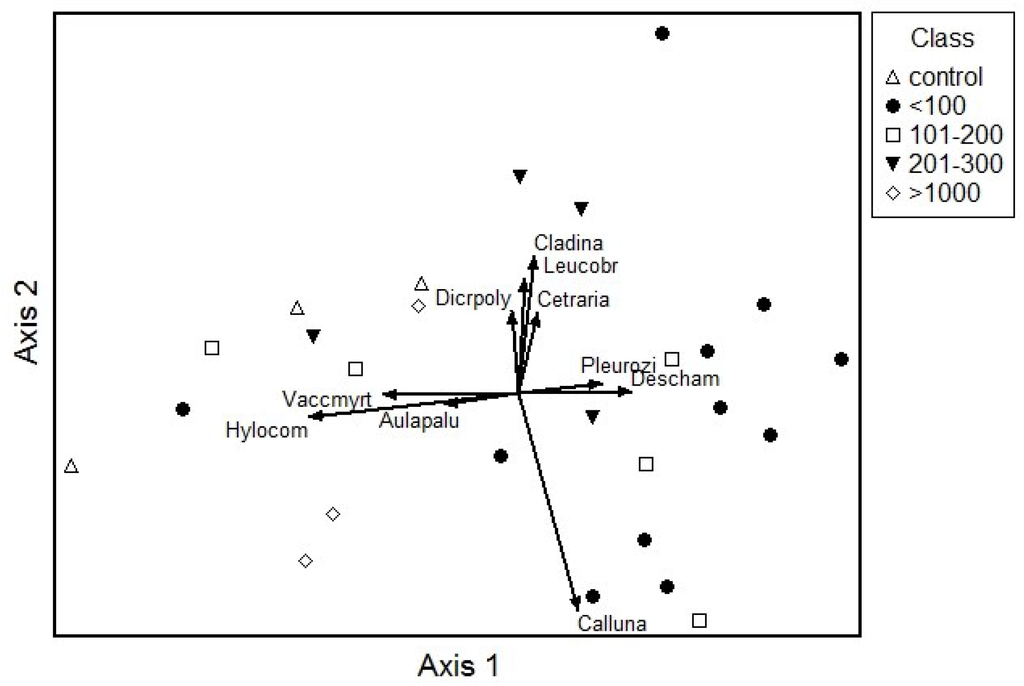
Figure 4.
Species and plot scores on DCA. Gap class of plots is shown. Abbreviations: Hylocom—Hylocomium splendens; Vaccmyrt—Vaccinium myrtillus; Aulapalu—Aulacomnium palustre (Hedw.) Schwägr.; Melamp—Melampyrum pratense; Dicrpoly—Dicranum polysetum Sw.; Dicrscop—Dicranum scoparium Hedw.; Cladina—Cladina rangiferina (L.) Nyl.; Leucobr—Leucobryum glaucum (Hedw.) Angstr.ex.Fr.; Cetraria—Cetraria islandica (L.) Arh.; Pleurozi—Pleurozium shreberi; Deschamp—Deschampsia flexuosa; Empetru—Empetrum nigrum L.; Calluna—Calluna vulgaris.
The density of pine seedlings was positively associated (r = 0.42, p < 0.05) with DCA axis 1 and birch seedlings were negatively associated (r = −0.56, p < 0.05) with this axis. There was no significant relationship between the mean height increment for any tree species with the gap area, but the maximum height increment attained in a gap for pine was significantly correlated with the gap area (r = 0.44, p < 0.05) (Table 3). The mean and maximum height increments of both pine and birch were higher in plots on the left side of the ordination (negative correlation), and of oak in gaps on the right side of the ordination (positive correlation).
The dominant soil type in the studied forest was Arenosols on sandy eolian deposits. Soils had weakly developed horizons, and the O horizon depth ranged from 0 cm–20 cm; a more developed O horizon occurred in topographical depressions, where the moist Moder humus form prevails. The O horizon had a high C/N ratio (over 35) and the mean pH was 3.5 (Table 4). Total N concentration in the upper mineral horizon was low (mean 0.59 mg·g−1). Relatively higher concentrations of both total organic carbon and nitrogen, as well as relatively higher concentrations of Ca2+, Mg2+, K+, caution that exchange capacity and exchangeable titrable acidity occurred in the O horizon compared to those in the mineral topsoil layer.
Table 3.
Pearson’s correlation of mean and maximum sapling height increment to DCA axis 1 scores and gap area. Maximum height increment refers to the highest mean increment of a seedling of sampling in a plot.
| Species | Height Increment | DCA Axis 1 | Gap Area |
|---|---|---|---|
| P. sylvestris | mean | −0.44* | 0.24 |
| max | −0.54* | 0.44* | |
| B. pendula | mean | −0.45* | 0.18 |
| max | −0.42* | 0.05 | |
| Q. robur | mean | 0.21 | 0.08 |
| max | 0.37* | 0.27 |
* Significant relationship (p < 0.05).
Table 4.
Soil properties of the litter layer (O horizon) and mineral topsoil layer in sampled gaps.
| Soil Properties | Litter Layer (O Horizon) | Mineral Topsoil Layer (Ah or E Horizon, 0–10 cm) | ||
|---|---|---|---|---|
| Mean | SD * | Mean | SD * | |
| Total organic carbon (%) | 36.17 | 8.82 | 0.68 | 0.62 |
| Total nitrogen (mg·g−1) | 9.95 | 2.10 | 0.59 | 0.41 |
| Carbon nitrogen ratio | 36.3 | - | 15.14 | - |
| pHKCl | 3.50 | 0.33 | 4.30 | 0.34 |
| Ca2+ (mg·kg−1) | 1444.53 | 626.59 | 121.05 | 50.80 |
| Mg2+ (mg·kg−1) | 129.12 | 55.28 | 13.45 | 4.84 |
| K+ (mg·kg−1) | 94.21 | 56.95 | 4.97 | 2.56 |
| CEC * (mEq 100 g−1) | 8.66 | 3.62 | 0.78 | 0.29 |
| ECEC ** (mEq 100 g−1) | 9.36 | 3.78 | 0.92 | 0.33 |
| ETA *** (mEq 100 g−1) | 0.70 | 0.54 | 0.14 | 0.08 |
* Cation exchange capacity; ** Effective cation exchange capacity; *** Exchangeable titrable acidity.
The study results show, that among all determined soil physical and chemical properties of the O horizon, a significant correlation with DCA axis 1 scores was found for pH (positive correlation) and O horizon depth, and exchangeable titrable acidity (negative correlation). Among upper mineral soil variables, N concentration and exchangeable titrable acidity were negatively correlated with DCA axis 1 scores (Table 5). Soil variables were not significantly correlated with DCA axis 2 scores.
Table 5.
Pearson’s correlation of soil variables with DCA axis 1 scores (only significant correlations are shown).
| Soil Horizon | Soil Variable | Correlations with DCA 1 Axis Scores | p Value |
|---|---|---|---|
| O horizons | pH | 0.430166 | 0.03 |
| depth | −0.56817 | <0.01 | |
| ETA | −0.46241 | 0.02 | |
| Upper mineral horizon | N | −0.48981 | 0.01 |
| ETA | −0.42499 | 0.03 |
4. Discussion
The establishment and growth of pine, birch and oak in the studied Vecdaugava urban forest appeared to be mediated by gap area interacting with soil and vegetation. We found that the maximum height increment of pine saplings was correlated significantly with the gap area (r = 0.44, p < 0.05). The highest mean and maximum densities (height classes <1 m and 1.1–2.0 m) were found in the smaller gaps (≤100 m2 and 101–150 m2) but were lower in bigger gaps for all height classes. This confirms previous findings that the abundance of pine is related to the vicinity of old trees due to high seedfall, slower invasion of competing vegetation, prolonged recruiment and low seed mortality [31,32]. Pine seedlings are very sensitive to drought stress and the dry conditions in large gaps might result in high mortality [33]. In the specific condition of urban woodland, especially bigger sunny gaps can be intensively trampled and thus not favorable for initial survival of pine and birch seedlings [7]. Mirschel et al. [33] found a negative correlation of pine seedling density to cover of the herb and shrub layer, especially of V. myrtillus. The lower establishment occurred due to a thicker litter layer in moist habitats. It is also considered that nitrogen accumulation in urban forest ecosystems hinders the regeneration of Scots pine [3]. We did not find pine seedlings and saplings in control plots, where V. myrtillus cover and shading were highest. Pine density was lower in gaps where soil development had resulted in a thicker O horizon. Establishment of pine requires exposed mineral soil, which occurs after a disturbance (e.g., fire) to the O horizon. However, the pine maximum height increment was significantly related to a greater O horizon depth and lower pH, as is typical in pine woodland.
Birch is one of the least shade-tolerant species in boreal forests and less tolerant to low soil moisture and nutrient contents, and it can cope better with vegetation than pine [32,33]. Birch growth and establishment have been shown to be positively related with gaps [7,10]. In our study, birch seedlings and saplings were not found in gaps ≤100 m2. Higher densities occurred in gaps with larger area with a maximum density in gaps of 101–200 m2. This might be explained by interaction with soil factors, as the gap size ≤100 m2 was associated with a thicker O horizon depth, which might hinder establishment.
In general, oak is ecologically a very plastic tree species and can form stands on very different soils, which differ in soil texture, presence of free carbonates and humification degree of the organic layer [34,35]. In addition, seed dispersal is not a problem for oak establishment, as the European jay (Garrulus glandarius L.) transports acorns [32,33]. Oak can also grow on less fertile soils in Latvia [36], as in other parts of Europe [37,38]. In some cases, oak stands also occur on eolian dunes [39]. However, our study showed that oak seedlings and saplings in the understorey occurred mainly in flat topography and depressions in terrains, in areas with relatively high soil moisture, which were reflected by the moist Moder humus forms.
We observed a high abundance of oak seedlings in the control plots and all gap area classes, and a significant correlation was not found between seedling density and gap area. Oak seedlings and saplings are less sensitive to the competition of forest floor vegetation [33]. Moreover, dense moss and herb vegetation cover might favor the establishment of this species, and also growth, especially for seedlings <50 cm. Oak tolerates much shading within the first two to three years of growth [37,40,41,42,43]. In Sweden, which is the northern boundary of oak distribution [44], it has been shown that 10% of full light is necessary for survival and 18% for development [45]. Oak demand for light increases with age [45] and with dense shading this species does not survive more than one season [46]. Considering that in our study oak abundance was highest in the smaller gaps, and in the control plots, light was not a limiting factor in the studied forest for oak regeneration. In these smaller gaps, soil pH value and N concentration were higher, and the survey showed higher density in moist locations.
The studied forest soils, according to chemical properties, correspond to those characteristic of dry mineral forest soils of pine forests in Latvia [47,48]. In this study and others [48], the total organic carbon content, the concentration of total nitrogen and the C/N ratio were higher in the litter layer horizon than in the mineral topsoil layer. In the litter layer horizon of Cladinoso-callunosa and Vacciniosa forest soils in Latvia, the mean value of the total organic carbon concentration was 37.69% ± 6.56%, the total nitrogen concentration was 12.47 ± 4.72 mg·g−1, and the mean C/N ratio was 33.29 ± 12.32 [48], which are close to the values obtained in the present study. In the mineral topsoil layer of Cladinoso-callunosa and Vacciniosa forest soils in Latvia, the mean total organic carbon concentration was 1.57% ± 0.90%, the total nitrogen concentration was 0.47 ± 0.35 mg·g−1, and the C/N ratio was 35.00 ± 21.70 [48], again in the range of values in our study, indicating the low effect of eutrophication in the urban environment. This suggests that the results obtained on relationships between soil factors and oak and pine regeneration are also applicable to other dry mineral forests (Cladinoso-callunosa and Vacciniosa) in Latvia.
5. Conclusions
The density of pine, birch and oak seedlings and saplings observed in gaps indicates that natural regeneration in gaps caused by tree mortality in the urban boreal forest can ensure conversion from even-aged pine forest to an uneven-aged structure. The effect of the area of gaps, perhaps affecting light availability, was not the main factor for tree regeneration in the gaps. The depth of the O layer and pH were factors affecting the establishment and growth of pine and birch. For oak, the main factors for establishment and increased height increment were favorable moisture, higher pH and N concentration. The variability in seedling and sapling densities among gaps and in control plots within a height class was extremely high. However, the densities of seedlings and saplings observed suggest that management can employ methods to facilitate canopy replacement by species other than pine. Obviously, anthropogenic pressure can give very different effects on microsite conditions and requires more detailed research.
Acknowledgments
The study was financially supported by the ESF project 2013/0020/1DP/1.1.1.2.0./13/APIA/VIAA/066 “Interdisciplinary Team of Young Scientists for Assessment and Restoration of Soil Quality and Usage Potential in Latvia”. We thank Imants Kukuļs for great support in field work.
Author Contributions
Authors contributed equally to this work.
Conflicts of Interest
The authors declare no conflict of interest.
References
- Lehvävirta, S. Non-anthropogenic dynamic factors and regeneration of (hemi)boreal urban woodlands—synthesising urban and rural ecological knowledge. Urban For. Urban Green. 2007, 6, 119–134. [Google Scholar] [CrossRef]
- Gundersen, V.S.; Frivold, L.H. Public preferences for forest structures: A review of quantitative surveys from Finland, Norway and Sweden. Urban For. Urban Green. 2008, 7, 241–258. [Google Scholar] [CrossRef]
- Tarvainen, O.; Strömmer, R.; Markkola, A. Urban forest regeneration: Responses of Scots pine seedlings to partial humus removal in mid-boreal N-enriched forests. Landsc. Urban Plan. 2011, 102, 209–214. [Google Scholar] [CrossRef]
- Kuuluvainen, T. Disturbance Dynamics in Boreal Forests: Defining the Ecological Basis of Restoration and Management of Natural Variability of Forests as a Reference for Restoring and Managing Biological Diversity in Boreal Fennoscandia. Silva Fenn. 2002, 36, 97–125. [Google Scholar]
- Kint, V.; Lasch, P.; Lindner, M.; Muys, B. Multipurpose conversion management of Scots pine towards mixed oak-birch-stands: A long-term simulation approach. For. Ecol. Manag. 2009, 257, 199–214. [Google Scholar] [CrossRef]
- Brūmelis, G.; Jonsson, B.G.; Kouki, J.; Kuuluvainen, T.; Shorohova, E. Forest Naturalness in Northern Europe: Perspectives on Processes, Structures and Species Diversity. Silva Fenn. 2011, 45, 807–821. [Google Scholar] [CrossRef]
- Lehvävirta, S.; Rita, H.; Koivula, M. Barriers against wear affect the spatial distribution of tree saplings in urban woodlands. Urban For. Urban Green. 2004, 3, 3–17. [Google Scholar] [CrossRef]
- Lehvävirta, S. Structural elements as barriers against wear in urban woodlands. Urban Ecosyst. 1999, 3, 45–56. [Google Scholar] [CrossRef]
- Malmivaara, M.; Löfström, I.; Vanha-Majamaa, I. Anthropogenic effects on understory vegetation in Myrtillus type urban forests in southern Finland. Silva Fenn. 2002, 36, 367–381. [Google Scholar] [CrossRef] [Green Version]
- Rouvinen, S.; Kouki, J. Tree regeneration in artificial canopy gaps established for restoring natural structural variability in a Scots pine stand. Silva Fenn. 2011, 45, 1079–1091. [Google Scholar] [CrossRef]
- Brokaw, N.; Busing, R.T. Niche versus chance and tree diversity in forest gaps. Trends Ecol. Evol. 2000, 15, 183–189. [Google Scholar] [CrossRef]
- Kint, V.; Geudens, G.; Mohren, G.M.J.; Lust, N. Silvicultural interpretation of natural vegetation dynamics in ageing Scots pine stands for their conversion into mixed broadleaved stands. For. Ecol. Manag. 2006, 223, 363–370. [Google Scholar] [CrossRef]
- Laiviņš, M. Latvijas Boreālo Priežu Mežu Sinantropizācija un Eitrofikācija; Latvijas Veģetācija, Latvijas Universitāte, Bioģeogrāfijas Laboratorija: Rīga, Latvia, 1998; p. 137. (In Latvian) [Google Scholar]
- Zerbe, S. Restoration of natural broad-leaved woodland in Central Europe on sites with coniferous forest plantations. For. Ecol. Manag. 2002, 167, 27–42. [Google Scholar] [CrossRef]
- Weber, T.A.; Hart, J.L.; Schweitzer, C.J.; Dey, D.C. Influence of gap-scale disturbance on developmental and successional pathways in Quercus-Pinus stands. For. Ecol. Manag. 2014, 331, 60–70. [Google Scholar] [CrossRef]
- Matias, L.; Jump, A.S. Interactions between growth, demography and biotic interactions in determining species range limits in a warming world: The case of Pinus sylvestris. For. Ecol. Manag. 2012, 282, 10–22. [Google Scholar] [CrossRef]
- Olsson, C.; Bolmgren, K.; Lindström, J.; Jönsson, A.M. Performance of tree phenology models along a bioclimatic gradient in Sweden. Ecol. Model. 2013, 266, 103–117. [Google Scholar] [CrossRef]
- Lindbladh, M.; Foster, D.R. Dynamics of long-lived foundation species: The history of Quercus in southern Scandinavia. J. Ecol. 2010, 98, 1330–1345. [Google Scholar] [CrossRef]
- Laarmann, D.; Korjus, H.; Sims, A.; Kangur, A.; Stanturt, J.A. Initial effect of restoring natural forest structures in Estonia. For. Ecol. Manag. 2013, 304, 303–311. [Google Scholar] [CrossRef]
- Hytteborn, H.; Maslov, A.A.; Nazimova, O.J.; Rysin, L.P. Boreal forests of Eurasia. In Ecosystems of the World: Coniferous Forests; Andersson, F., Ed.; Elsevier: Amsterdam, The Netherlands, 2005; pp. 23–99. [Google Scholar]
- Krauklis, A. Living with diversity in Latvia: People, nature and cultural landscapes. Folia Geogr. 2000, 8, 1–14. [Google Scholar]
- Resident Population in Cities (2015). Available online: http://data.csb.gov.lv/pxweb/en/Sociala/Sociala__ikgad__iedz__iedzskaits/IS0042.px/table/tableViewLayout1/?rxid=cd (accessed on 21 August 2015).
- Riga in Numbers (2015). Available online: http://www.riga.lv/LV/Channels/About_Riga/Riga_in_numbers/default.htm (accessed on 21 August 2015).
- FSCC (Forest Soil Co-Ordinating Centre). Manual IIIa: Sampling and Analysis of Soil. In ICP Forests, 2006: Manual on Methods and Criteria for Harmonized Sampling, Assessment, Monitoring and Analysis of the Effects of Air Pollution on Forests; UNECE ICP Forests Programme Co-ordinating Centre: Hamburg, Germany, 2006; p. 26. Available online: http://icp-forests.net/page/icp-forests-manual (accessed on 1 August 2015).
- Runkle, J.R. Gap regeneration in some old-growth forests of the eastern United States. Ecology 1981, 62, 1041–1051. [Google Scholar] [CrossRef]
- Runkle, J.R. Guidelines and Sample Protocol for Forest Gaps; General Technical Report PNW GTR 283; U.S. Department of Agriculture, Forest Service, Pacific Northwest Research Station: Portland, OR, USA, 1992. [Google Scholar]
- Braun-Blanquet, J. Pflanzensoziologie. In Grundzüge der Vegetationskunde; Springer Verlag: Wien, Austria; New York, NY, USA, 1964. [Google Scholar]
- IUSS Working Group WRB. World Reference Base for Soil Resources 2014. International Soil Classification System for Naming Soils and Creating Legends for Soil Maps; World Soil Resources Reports No. 106; FAO: Rome, Italy, 2014. [Google Scholar]
- Tan, K.H. Soil Sampling, Preparation, and Analysis, 2nd ed.; Taylor & Francis Group: Boca Raton, FL, USA, 2005; p. 623. [Google Scholar]
- Kārkliņš, A. Augsnes Diagnostika un Apraksts; Latvijas Lauksaimniecības Universitāte: Jelgava, Latvia, 2008; p. 336. (In Latvian) [Google Scholar]
- Beland, M.; Agestam, E.; Eko, P.M.; Gemmel, P.; Nilsson, U. Scarification and seedfall affects natural regeneration of Scots pine under two shelterwood densities and a clear-cut in southern Sweden. Scand. J. For. Res. 2000, 15, 247–255. [Google Scholar] [CrossRef]
- Paluch, J.G.; Bartkowicz, L.E. Spatial interactions between Scots pine (Pinus sylvestris L.), common oak (Quercus robur L.) and silver birch (Betula pendula Roth.) as investigated in stratified stands in mesotrophic site conditions. For. Ecol. Manag. 2004, 192, 229–240. [Google Scholar] [CrossRef]
- Mirschel, F.; Zerbe, S.; Jansen, F. Driving factors for natural tree rejuvenation in anthropogenic pine (Pinus sylvestris L.) forests of NE Germany. For. Ecol. Manag. 2011, 261, 683–694. [Google Scholar] [CrossRef]
- Bobiec, A.; Kuijper, D.P.J.; Niklasson, M.; Romankiewicz, A.; Solecka, K. Oak (Quercus robur L.) regeneration in early successional woodlands grazed by wild ungulates in the absence of livestock. For. Ecol. Manag. 2011, 262, 780–790. [Google Scholar] [CrossRef]
- Ikauniece, S.; Brūmelis, G.; Kasparinskis, R.; Nikodemus, O.; Amatniece, V. Augsnes faktora nozīme kokaudzes sastāva formēšanā ozolu audzēs. Mežzinātne 2012, 26, 41–60. (In Latvian) [Google Scholar]
- Krauklis, Ā.; Zariņa, A. Parastais skābardis sava areāla ziemeļu robežas ainavā Latvijā. In Ģeogrāfiskie Raksti; Latvijas Ģeogrāfijas Biedrība: Rīga, Latvia, 2002; p. 108. (In Latvian) [Google Scholar]
- Diaz-Maroto, I.J.; Vila-Lameiro, P. Pedunculate oak (Quercus robur L.) silviculture in natural stands of NW Spain: Environmental conditioners. For. Ecol. Manag. 2008, 256, 702–711. [Google Scholar] [CrossRef]
- Gonzalez-Munoz, N.; Costa-Tenorio, M.; Espigares, T. Invasion of alien Acacia sealbata on Spanish Quercus robur forests: Impact on soils and vegetation. For. Ecol. Manag. 2012, 269, 214–221. [Google Scholar] [CrossRef]
- Lawesson, J.E.; Wind, P. Oak dune forests in Denmark and their ecology. For. Ecol. Manag. 2002, 164, 1–14. [Google Scholar] [CrossRef]
- Van Hees, A.F.M.; Clerkx, A.P.P.M. Shading and root-shoot relations in saplings of silver birch, pedunculate oak and beech. For. Ecol. Manag. 2003, 176, 439–448. [Google Scholar] [CrossRef]
- Mauriņš, A.; Zvirgzds, A. Dendroloģija; LU Akadēmiskais Apgāds: Rīga, Latvia, 2006. (In Latvian) [Google Scholar]
- Götmark, F. Careful partial harvesting in conservation stands and retention of large oaks favour oak regeneration. Biol. Conserv. 2007, 140, 349–358. [Google Scholar] [CrossRef]
- Tantau, I.; Feurdean, A.; de Beaulieu, J.; Reille, M.; Farcas, S. Holocene vegetation history in the upper forest belt of the Eastern Romanian Carpathians. Palaeogeogr. Palaeoclimatol. Palaeoecol. 2011, 309, 281–290. [Google Scholar] [CrossRef]
- Drobyshev, I.; Niklasson, M.; Eggertsson, O.; Linderson, H.; Sonesson, K. Influence of annual weather on growth of pedunculate oak in southern Sweden. Ann. For. Sci. 2008, 65, 512. [Google Scholar] [CrossRef]
- Čater, M.; Batič, F. Groundwater and light conditions as factors in the survival of pedunculate oak (Quercus robur L.) seedlings. Eur. J. For. Res. 2006, 125, 419–426. [Google Scholar] [CrossRef]
- Küssner, R. Mortality patterns of Quercus, Tilia and Fraxinus germinants in a floodplain forest on the river Elbe, Germany. For. Ecol. Manag. 2003, 173, 37–48. [Google Scholar] [CrossRef]
- Kasparinskis, R.; Nikodemus, O. Influence of environmental factors on the spatial distribution and diversity of forest soil in Latvia. Est. J. Earth Sci. 2012, 61, 48–64. [Google Scholar] [CrossRef]
- Kasparinskis, R. Diversity of Forest Soils and Its Influencing Factors in Latvia. Ph.D. Thesis, University of Latvia, Riga, Latvia, 2012. [Google Scholar]
© 2015 by the authors; licensee MDPI, Basel, Switzerland. This article is an open access article distributed under the terms and conditions of the Creative Commons by Attribution (CC-BY) license (http://creativecommons.org/licenses/by/4.0/).