1. Introduction
Northern white-cedar (
Thuja occidentalis) is a species of high commercial and ecological value that is native to North America. The current annual harvest for white-cedar in Ontario, Quebec and New England ranges between 275,000 and 350,000 m
3 of wood [
1]. White-cedar is also an important winter browse and protective species for white-tailed deer (
Odocoileus virginianus) [
2]. Since the middle of the 19th century, a decline in white-cedar populations has been noted over most of its natural range [
3,
4,
5,
6]. This decline has been linked to an increase in white-tailed deer populations [
2,
3,
4], but could also be related to management practices.
White-cedar is one of the least studied commercial species in eastern North America [
7,
8]. It is a species that generally grows slowly and that can remain stagnant in the understory until released by natural disturbance or cutting [
1]. Many studies dealing with white-cedar growth have been conducted in pure white-cedar stands or in coniferous stands growing on wet sites; much less information is available for mesic sites [
4,
8]. However, a substantial portion of white-cedar harvest comes from mixedwood stands that are growing on mesic sites where stand dynamics are likely to be more complex. This is especially true for yellow birch—balsam fir (
Betula alleghaniensis Britt. and
Abies balsamea (L.) Mill., respectively) stands, in which much of the resource is found in Quebec.
Recommendations for white-cedar management include many forms of partial cutting [
1]. In Quebec, selection cutting is generally recommended for stands including a significant component of white-cedar [
9]. Although there is a general agreement regarding the implementation of partial cutting in white-cedar management, few studies have quantified their effects on growth response in mixedwoods [
1]. In such stands where white-cedar is not the dominant species, silvicultural prescriptions merely reflect the silvics of other species. To ensure that white-cedar decline is not amplified by management practices, white-cedar silvics must be better known and integrated into current management decisions.
The current study aims to provide a better understanding of white-cedar growth in natural mixedwood stands and its response to partial cutting. To do so, a retrospective growth analysis was conducted in stands treated by diameter-limit cutting in western Quebec.
2. Methods
The study included two sites that were located in western Quebec, Canada. The first one (hereafter called “OR”; 46°34′ N, 77°27′ W) was located in the Outaouais Region of western Quebec, in the balsam fir—yellow birch bioclimatic domain. The second site (hereafter called “PL”; 46°10′ N, 75°20′ W) was in the Papineau-Labelle Wildlife Reserve of western Quebec, in the sugar maple—yellow birch bioclimatic domain. The climate of the OR site is slightly cooler and with less precipitation than that of PL (
Table 1). Soil texture varied from loam to sandy loam and drainage was good.
Table 1.
Ecological description of the study sites; OR site, Outaouais Region; PL site, Papineau-Labelle Wildlife Reserve.
Table 1.
Ecological description of the study sites; OR site, Outaouais Region; PL site, Papineau-Labelle Wildlife Reserve.
| | | OR Site | PL Site |
|---|
| Climate a | Elevation (m) | 400 | 320 |
| Mean annual temperature (°C) | 2.55 ± 0.42 | 2.83 ± 0.45 |
| Total annual precipitation (mm) | 1037 ± 115 | 1138 ± 115 |
| Growing season (days) | 147 ± 16 | 157 ± 17 |
| Composition of the overstory b | Total basal area (m2/ha) | 28.7 | 34.8 |
| Years of partial harvesting | 1971 or 1974 | 1979, 1981 or 1983 |
| Main softwood species | White-cedar (36%) Balsam fir (13%) White spruce (4%)
| White-cedar (29%) White spruce (18%) Balsam fir (14%) Eastern hemlock (9%)
|
| Main hardwood species | Yellow birch (30%) Red maple (7%) Sugar maple (5%)
| Yellow birch (20%) Red maple (8%)
|
| Soil characteristics | Texture of B-horizon | Loamy sand/sandy loam | Loam-loamy sand |
| pH of B-horizon | 3.95 | 3.95 |
| Soil depth | 50–100 cm | 50–100 cm |
| Drainage | Moderately well drained | Moderately well drained |
On each site, during the summer of 2005, four mixedwood stands that had a significant white-cedar component and that had been partially harvested using diameter-limit cutting were selected. Stand selection guidelines were: (i) partially cut before 1985; (ii) stand composition typical of stands growing on mesic sites; and (iii) basal area of white-cedar between 10% and 66% of merchantable basal area (diameter at breast height ≥9.1 cm). The last known cuts in these sites occurred between 1971 and 1974 in the OR site, and between 1975 and 1983 in the PL site. In the OR site, dominant canopy species included white-cedar, balsam fir, yellow birch, and red maple (
Acer rubrum L.). In the PL site, the canopy was mainly composed of white-cedar, balsam fir, white spruce (
Picea glauca (Moench) Voss), eastern hemlock (
Tsuga canadensis (L.) Carr.), yellow birch, and red maple (
Table 1). Small amounts of white spruce were also found at the OR site. Stand structure was heterogeneous with an intimate mix of species and local aggregations of white-cedar. No major natural disturbance had been reported, although the fir component had likely been affected by the two most recent spruce budworm (
Choristoneura fumiferana) outbreaks [
11].
Within each selected stand (
n = 8), nine circular plots of 400 m
2 were established (total
n = 72). Inside each plot, all merchantable living trees with a diameter at breast height (DBH) ≥9.1 cm were tallied by species and DBH. Stumps were counted, species were identified, and measurements of their diameter, height and degree of decomposition were taken. Data for harvested trees were estimated from stumps, using measures taken on 288 randomly selected study trees. Of these, total height and diameters at 15-, 50- and 130-cm height were measured. A regression was then constructed to predict DBH based on species, stump diameter and height, and applied to predict the DBH of cut trees at the year of harvest. Dead stems were also counted and a disk was cut at breast height. Disks were sanded and annual radial growth was measured using an electronic caliper and the Measure J2X software [
12]. Cross-dating was done using either existing master chronologies or, when none were available for the region, chronologies that were constructed from living trees. When trees were determined alive at time of cutting, their DBH was derived from the measurements and the estimated time of death. Data for live trees, stumps, and dead trees were used to obtain local stand characteristics before harvesting, as well as local harvesting intensity.
Short increment cores, including at least 20 years before cutting, were taken at breast height on 18 merchantable white-cedar trees and 18 trees of companion species in each stand. Complete cores (with pith) were also extracted from two white-cedar stems and two associated species per plot. Increment cores were glued on wood supports and sanded. The same methods used for disks were then applied.
Growth of white-cedar and its main associates was first compiled by site on a calendar year basis to capture overall patterns related to insect infestations and cutting. Growth releases of white-cedar were established using the absolute growth increase method suggested by Fraver and White [
13] for the species. With this approach, growth from the prior ten years is compared with growth from the subsequent ten years. A difference of at least 0.41 mm is judged to indicate a release event for white-cedar. Then, growth of white-cedar was analyzed in detail relative to the time of cutting. The response variable was annual diameter growth. Predictors included variables that were related to the tree (DBH
0, BAL), the stand (LnBA, S/H) or to the applied treatment (1/HARV). Descriptions of the variables, together with their ranges, are presented in
Table 2. A binary variable (Period) was introduced to separate growth that occurred before and after cutting.
The statistical analysis was conducted in two steps using R statistical package [
14]. The first step used the all-subset regression approach that was suggested by Calcagno and de Mazancourt [
15]. This approach involves building all possible models with the selected variables, including their pairwise interactions. Models are then ranked based on the Akaike Information Criterion corrected for small samples (AICc), considering only the fixed effects. Instead of calibrating and comparing all of the possible models (over 4 million possible models), the method proposed by Calcagno and de Mazancourt uses a genetic optimization algorithm to reduce computation time. In the second step, the best model identified was further refined by including stands, plots and trees as random effects. Following this step, parameters that were not significantly different from zero were removed from the model and new parameters were recalculated. To correct for heteroskedasticity, a natural logarithmic transformation was applied to the dependent variable. According to Winter [
16], random effects should be applied not only to the intercept, but also to slopes that are associated with fixed effects [
17] (for further formal discussion). This approach helped to eliminate marginal fixed effects that can increase Type I errors [
18]. We thus compared a null model, with only random effects, to one with random effects on the intercept, and one with random effects on both intercepts and slope parameters. To enable the program to converge on a solution, random slope effects only considered the most influential effects,
i.e., tree (random), period (fixed), S/H* LnBA (fixed), and period* LnBA (fixed).
Table 2.
List of fixed effects tested.
Table 2.
List of fixed effects tested.
| Symbol | Description | Range |
|---|
| Period | period of growth | before cutting = 0, after cutting = 1 |
| DBH0 | diameter at the beginning of the period (mm) | 0–752 |
| LnBA | natural logarithm of residual basal area (m2/ha) | 2.05–3.84 |
| 1/HARV | 1/percent of basal area removed | 0.028–2.396 |
| BAL | residual basal area of trees with DBH >subject tree (m2/ha) | 0–18.5 |
| S/H | coniferous residual basal area/hardwood residual basal area | 0.0016–1.628 |
3. Results
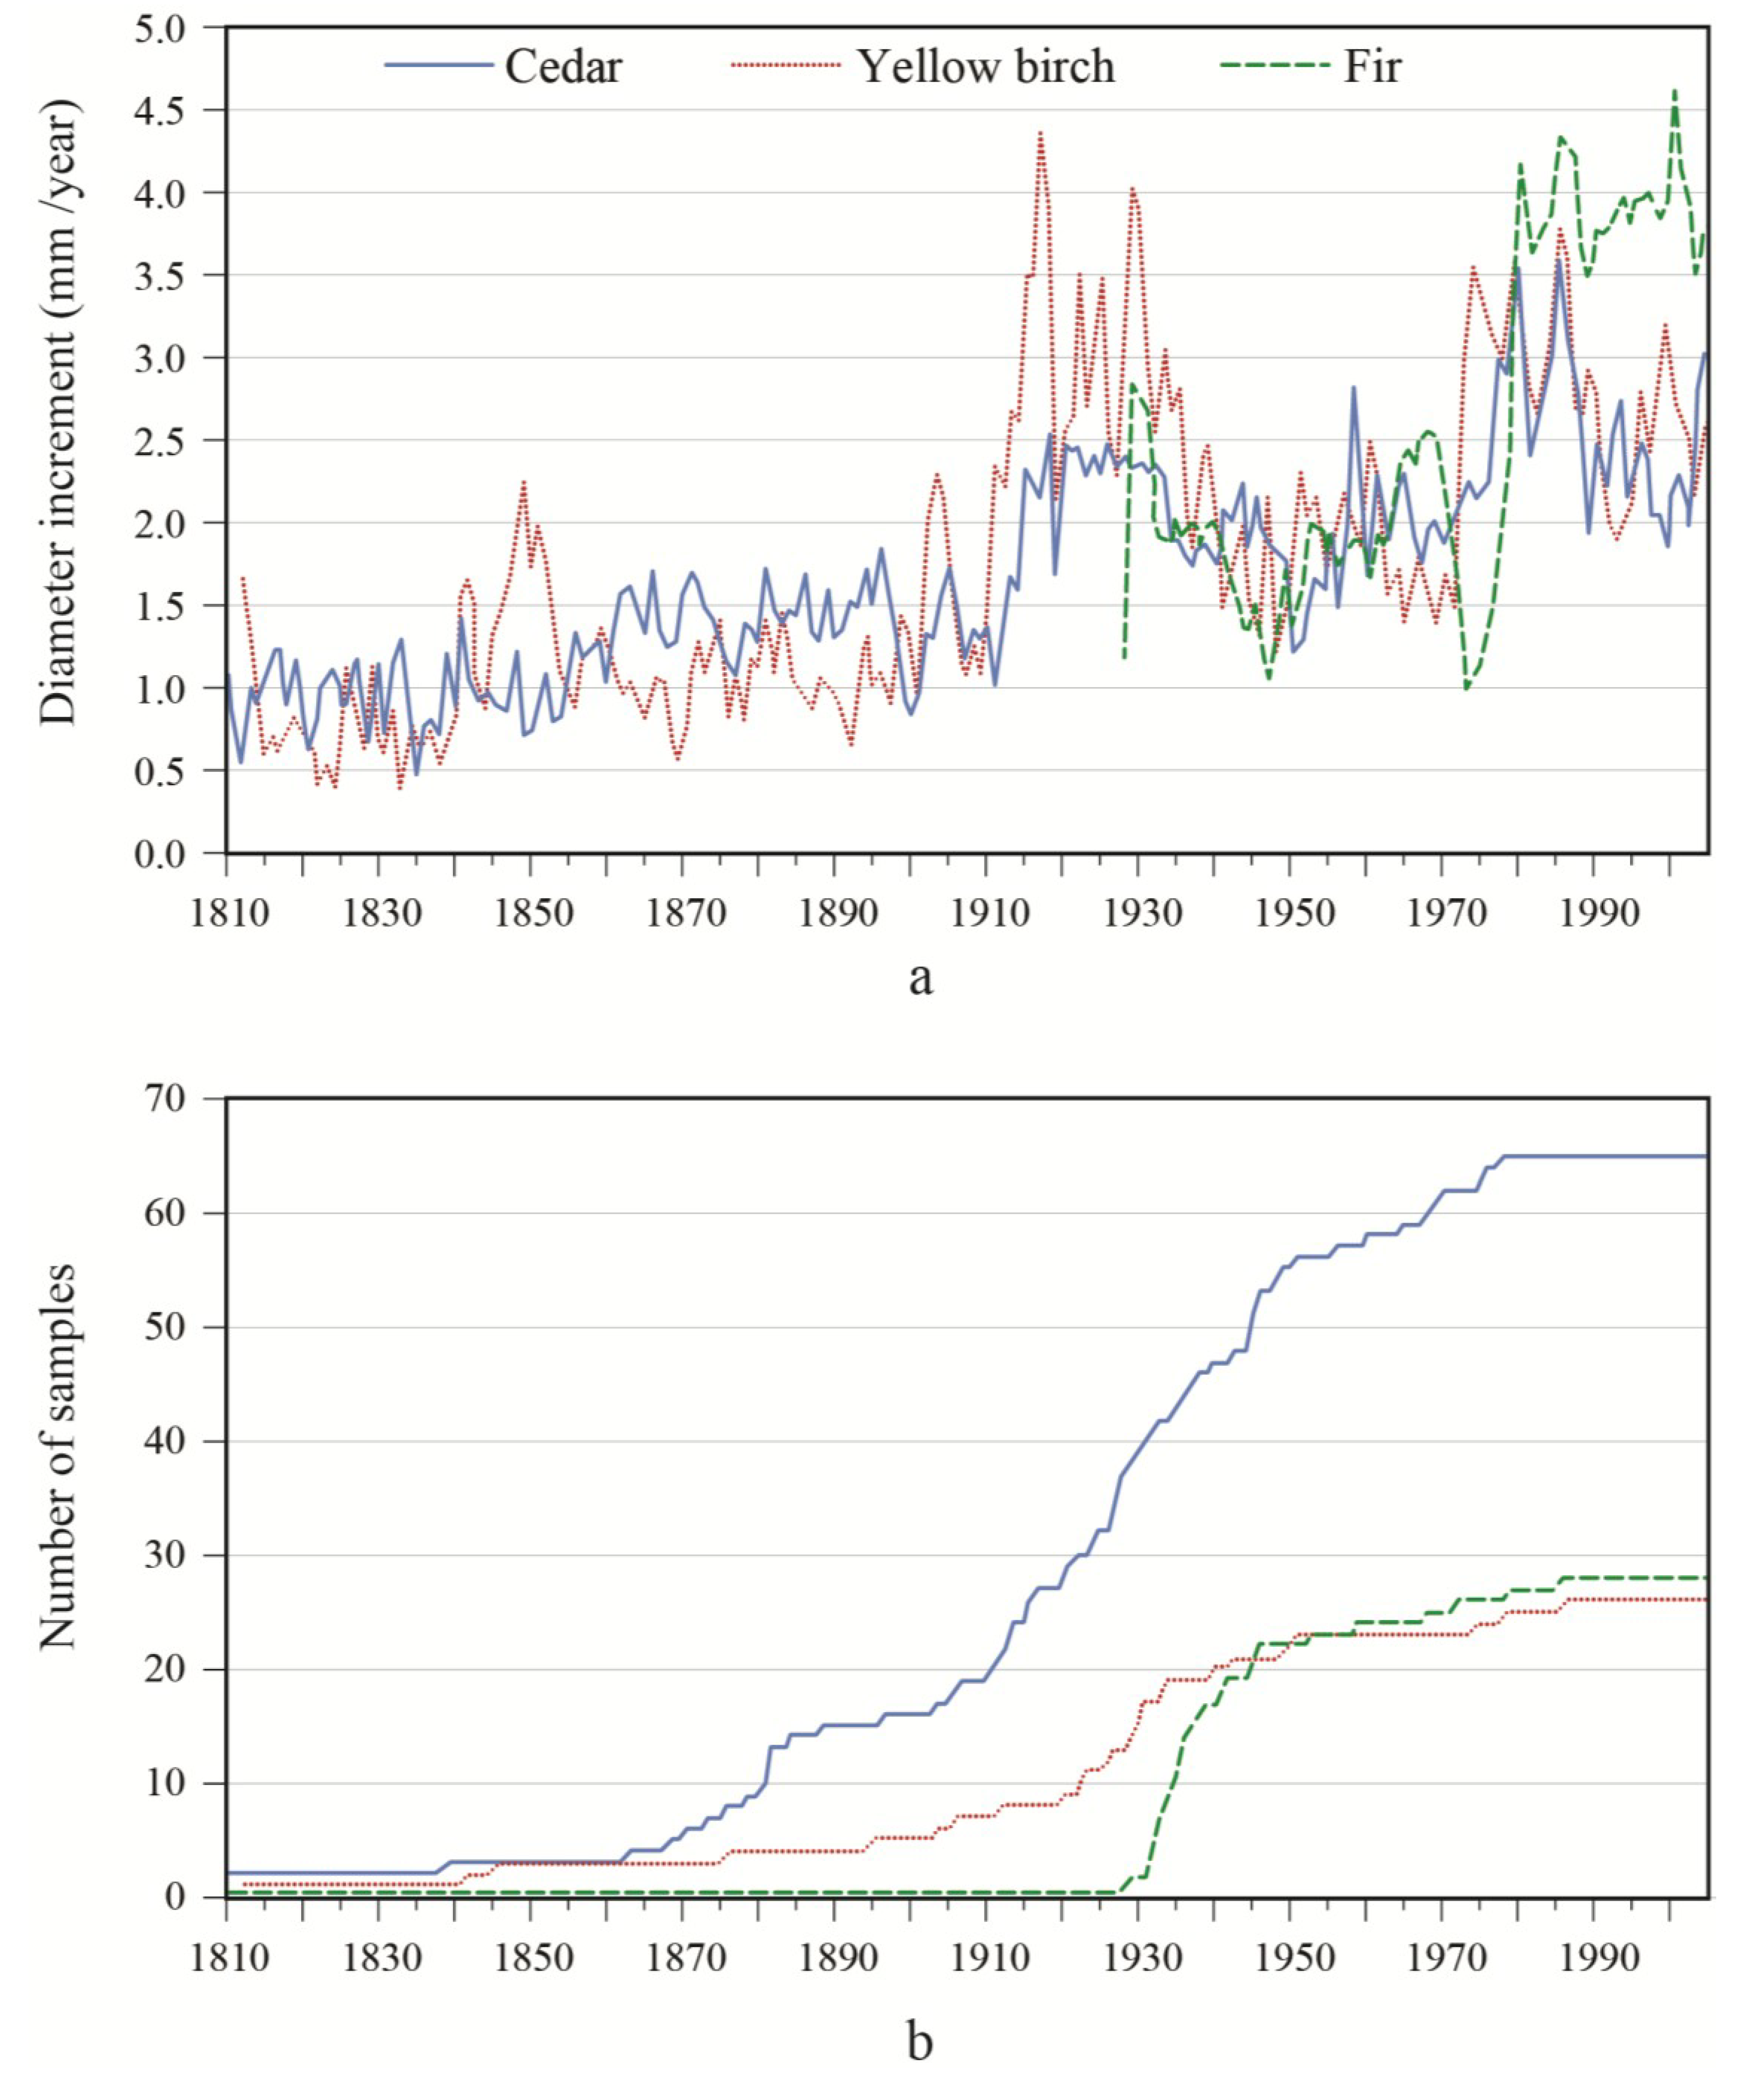
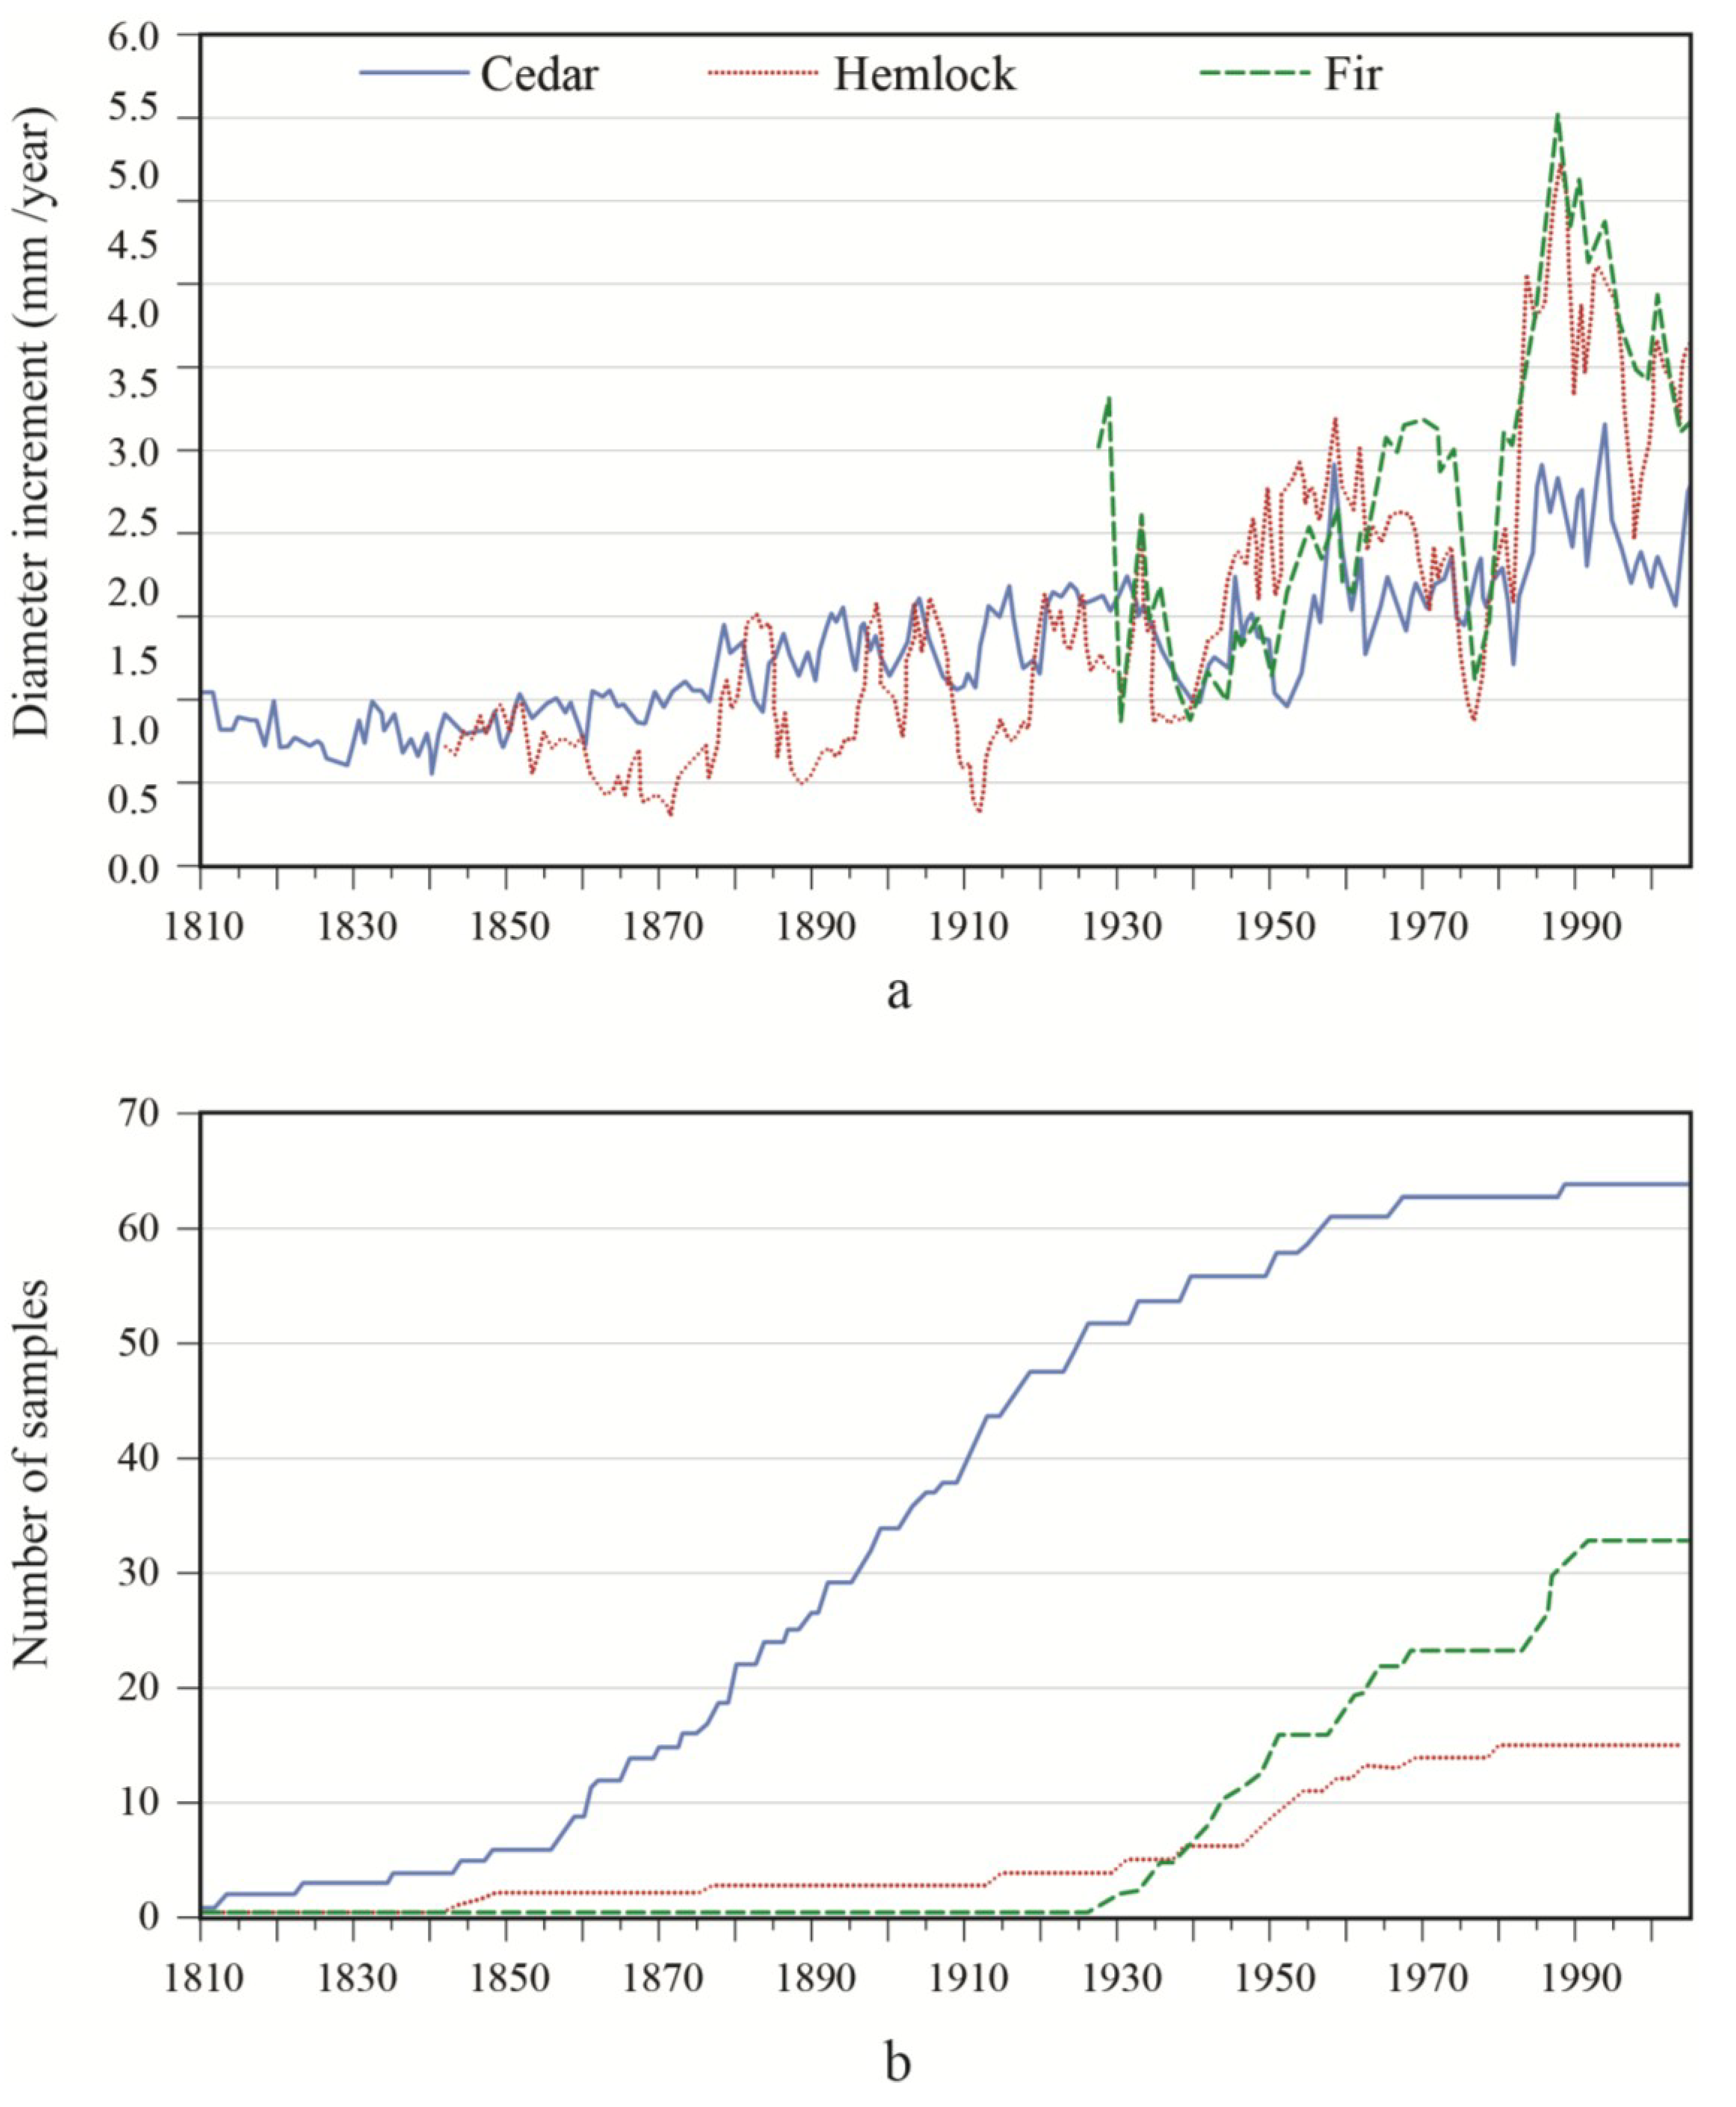
In both sites, there was a general tendency towards an increased growth over time (
Figure 1 and
Figure 2). However, diameter growth variations were generally smaller for white-cedar in comparison with other species. In the OR site, a decrease in balsam fir growth occurred in 1946 and 1973, followed by a marked increase in increment relative to values before the growth reduction. A marked growth increase occurred for both yellow birch and white-cedar around 1910 and this growth spurt lasted for about 15 years. This event constituted a release event, according to the criteria used. Growth progressively returned to lower values until a second release was detected for white-cedar in 1956–1957. A third strong release event for white-cedar was detected for the period 1971–1979. However, in contrast to balsam fir, the observed accelerations were not preceded by sharp growth reductions. In the PL site, balsam fir growth sharply decreased around 1939 and 1976, and remained slow during the 1938–1945 period. Similar growth reductions were noted in hemlock. Between these two growth reductions, hemlock showed a rapid acceleration in growth, while the response was not as marked in fir. After the last growth decrease in the 1970s, a strong response was seen in hemlock and balsam fir. Overall, white-cedar showed a steady increase in growth over time, with release events being detected between 1952–1957 and between 1981–1986. In synchrony with fir and hemlock, a sharp reduction in white-cedar growth was noted around 1940. Contrary to what was observed in the other species, there was no clear white-cedar growth reduction in 1973.
Figure 1.
(a) Diameter increment patterns; and (b) associated sample size of white-cedar and the two main associated species for the OR site.
Figure 1.
(a) Diameter increment patterns; and (b) associated sample size of white-cedar and the two main associated species for the OR site.
Figure 2.
(a) Diameter increment patterns; and (b) associated sample size of white-cedar and the two main associated species for the PL site.
Figure 2.
(a) Diameter increment patterns; and (b) associated sample size of white-cedar and the two main associated species for the PL site.
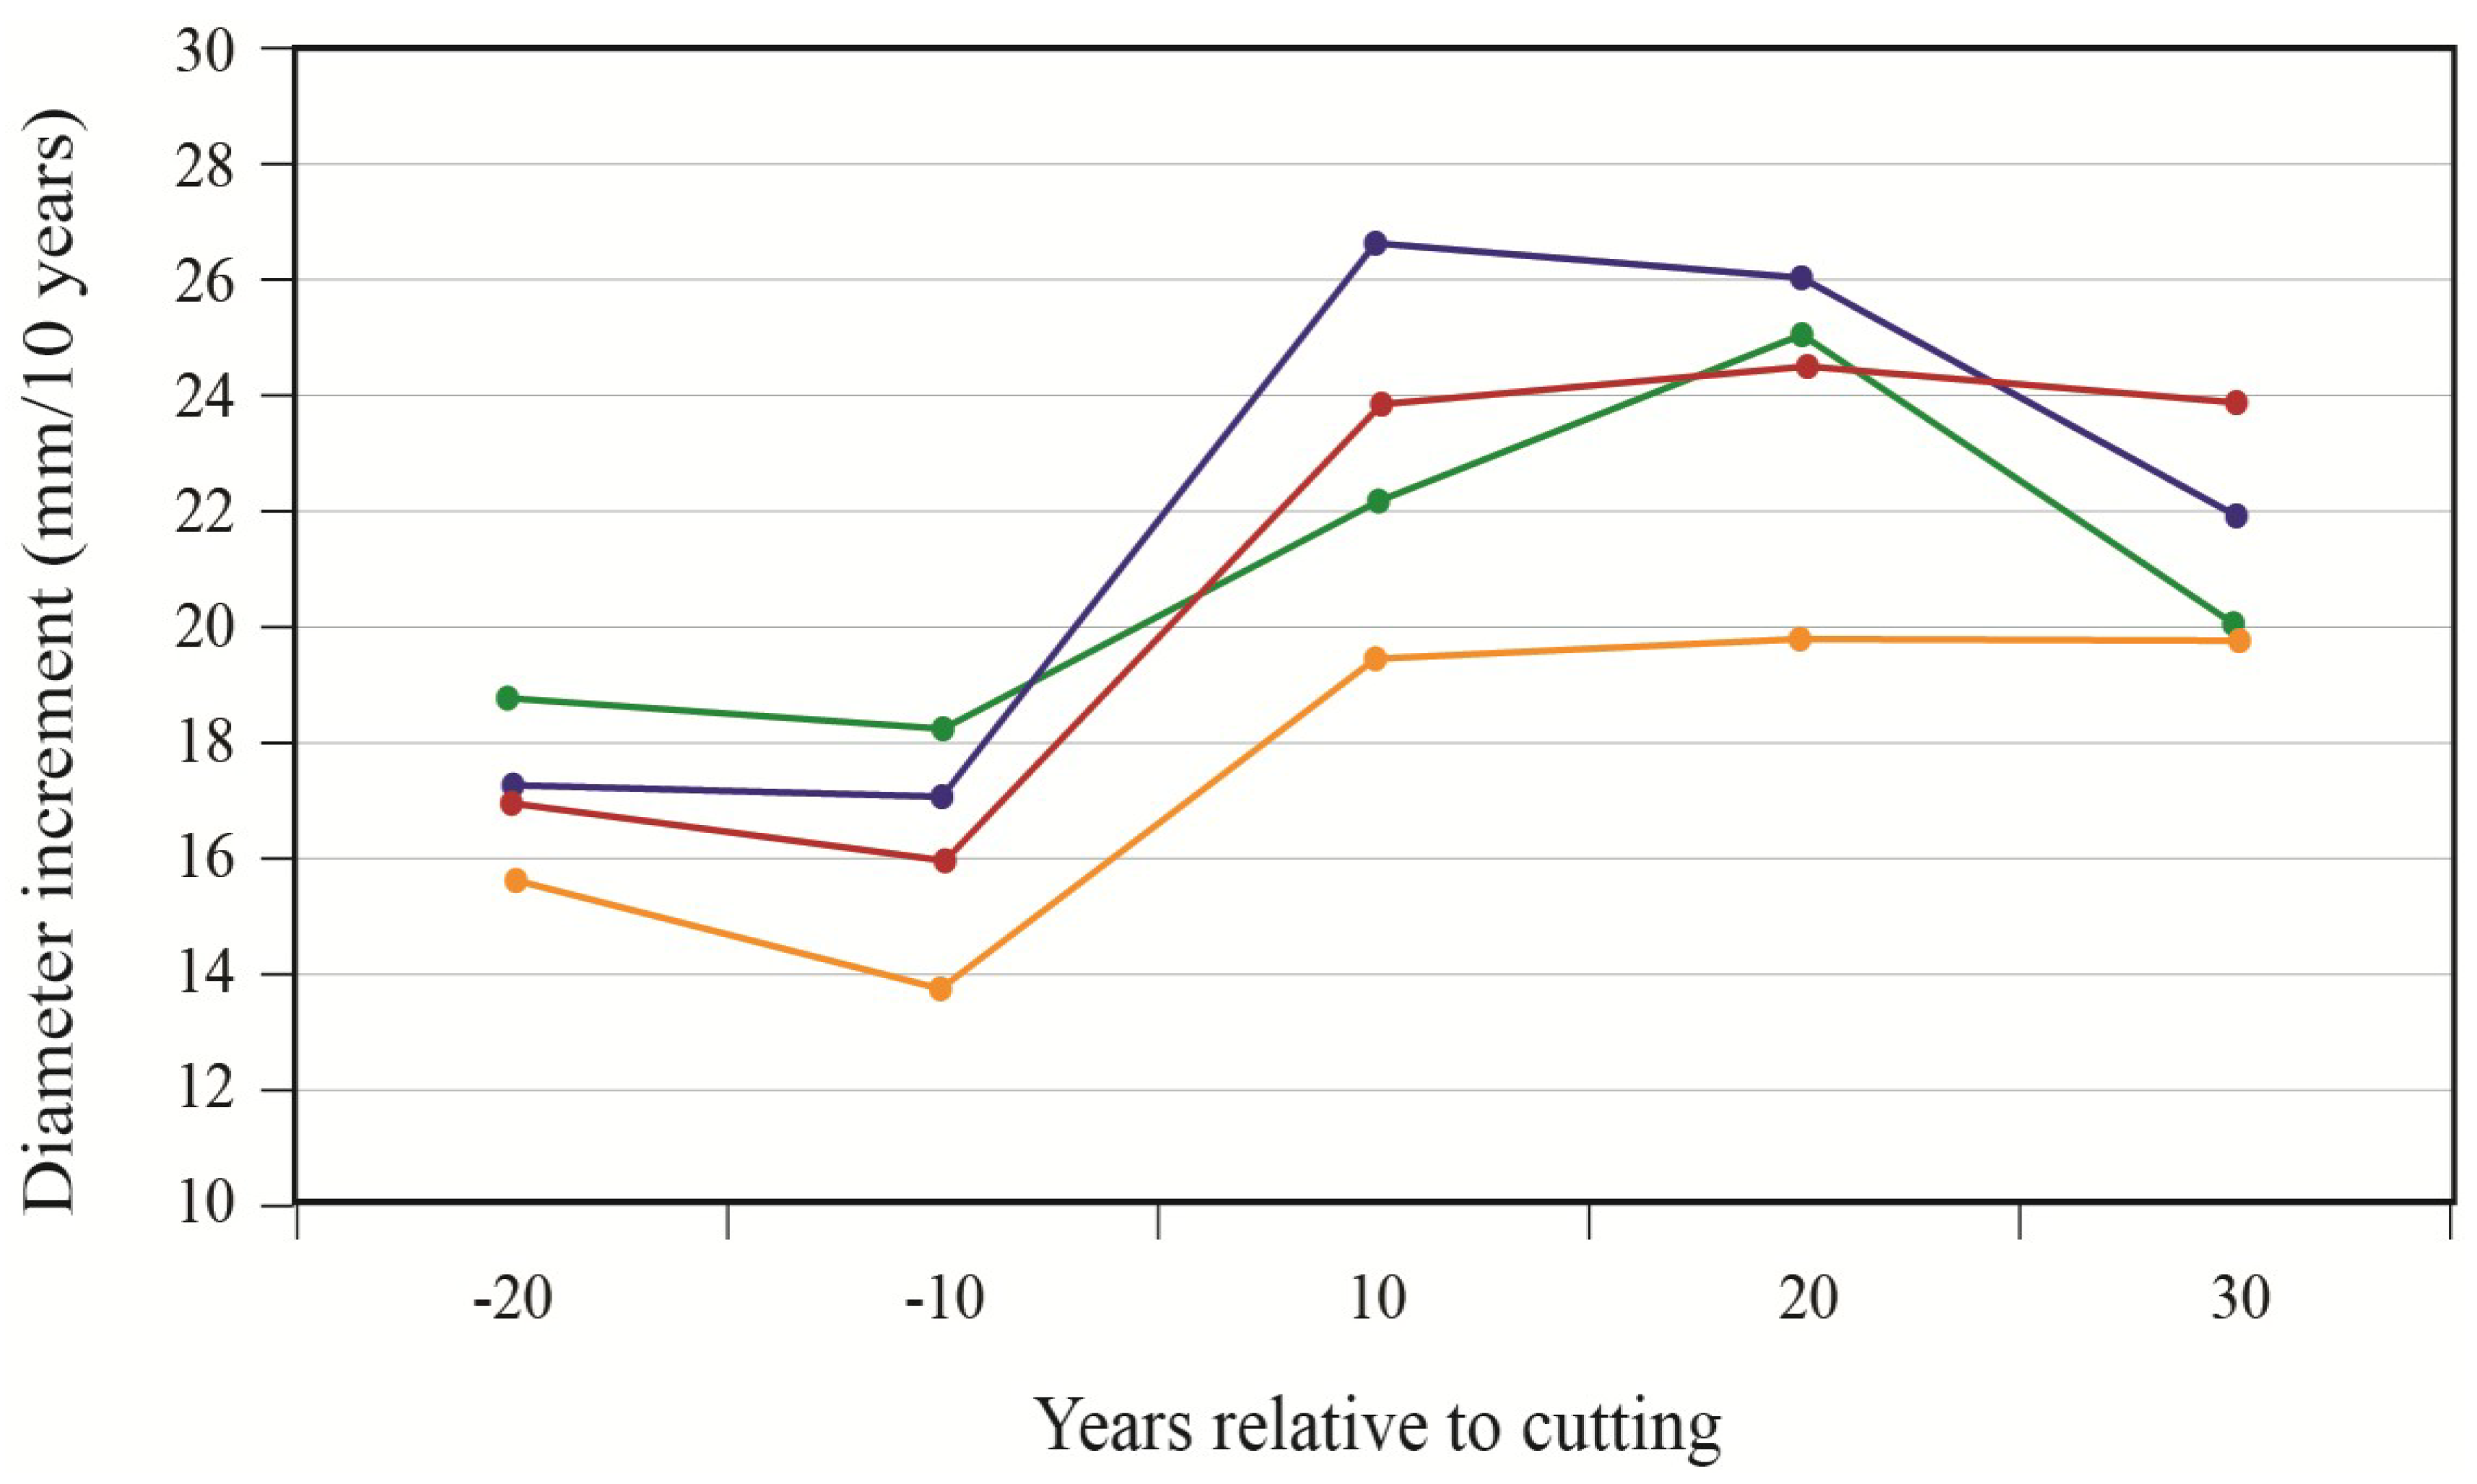
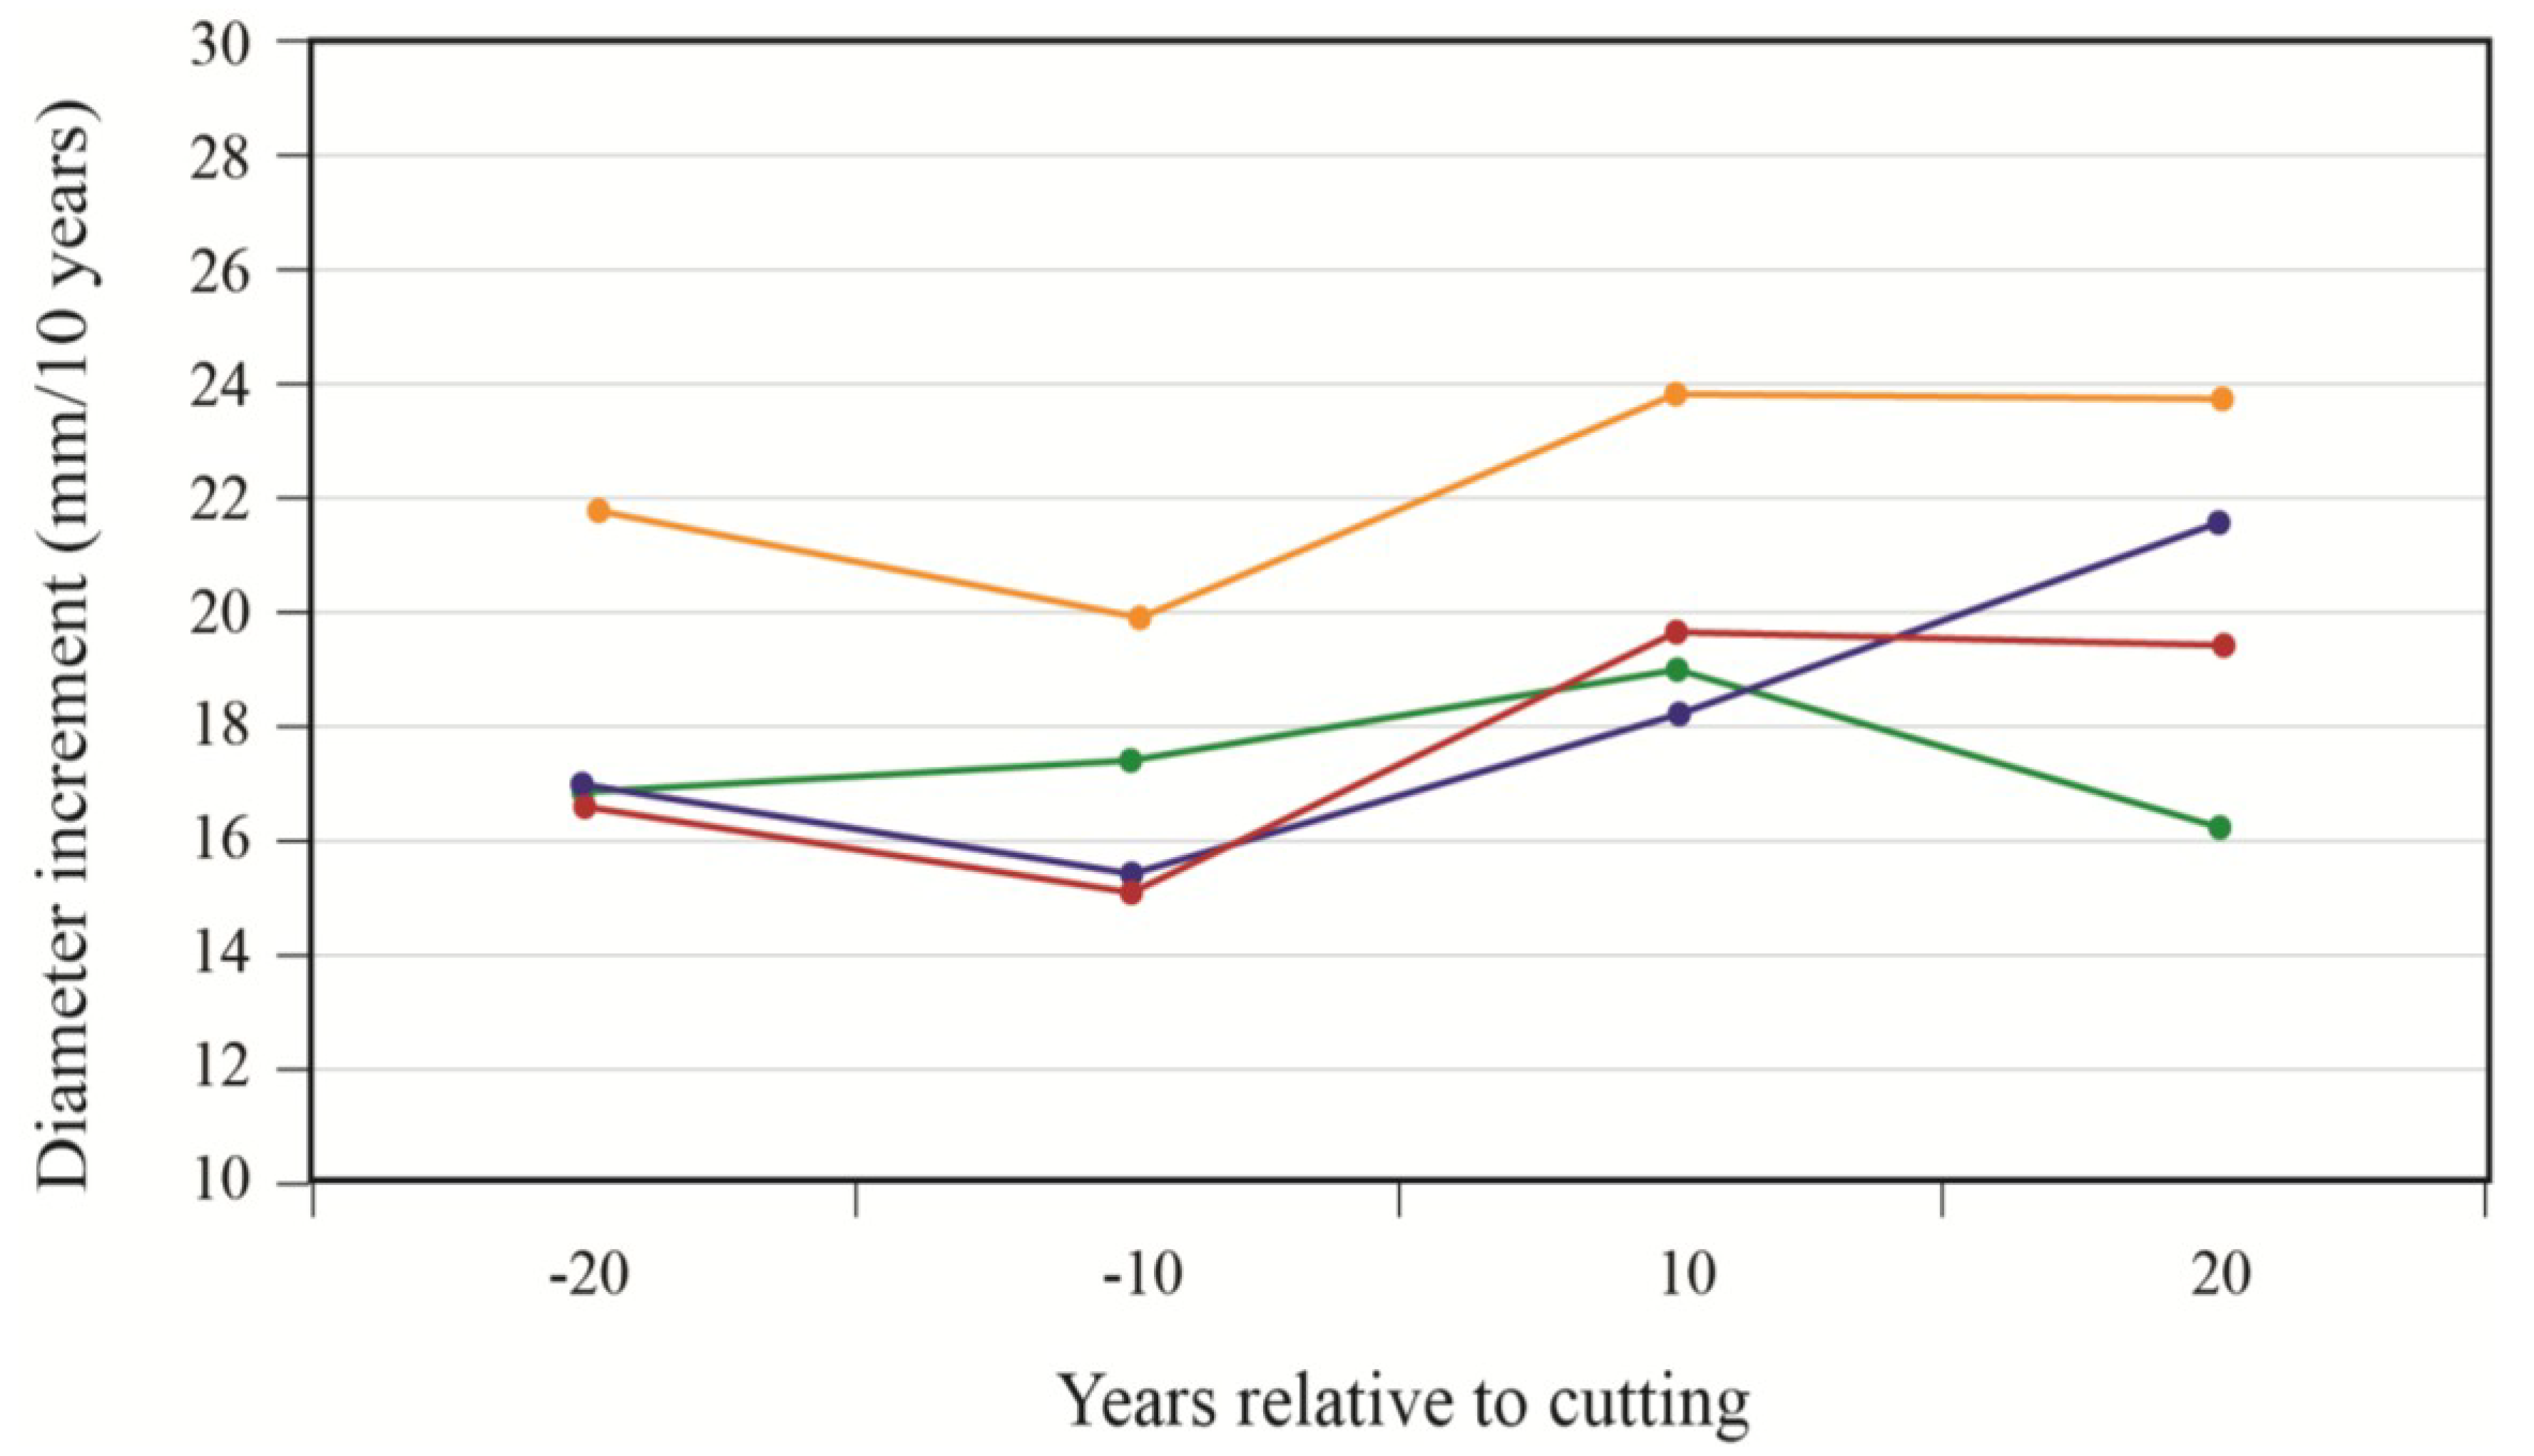
To better portray white-cedar’s response to partial cutting, white-cedar mean diameter growth was calculated for 10-year periods that were centered on the time of cutting.
Figure 3 and
Figure 4 show clear increases in growth that occurred after cutting and generally lasted for the whole period after cutting. During the first 10 years after cutting, average diameter growth increased by 29% for the OR site and by 16% for the PL site. In the OR site, we noticed some growth reductions in the last period, but diameter growth still remained above pre-harvest levels. In the PL site, growth responses were not as pronounced and varied more between plots.
Figure 3.
White-cedar diameter growth response to cutting in the OR site; each line represents one individual stand.
Figure 3.
White-cedar diameter growth response to cutting in the OR site; each line represents one individual stand.
Figure 4.
White-cedar diameter growth response to cutting in the PL site; each line represents one individual stand.
Figure 4.
White-cedar diameter growth response to cutting in the PL site; each line represents one individual stand.
The final model for predicting white-cedar growth included Period, S/H, DBH0, and LnBA, either as simple effects or as components of interactions (Equation 1). Based on AICc, the model that included random effects on the intercept and slopes proved superior to the null model and to the model with random effects only on the intercept.
Effects of initial diameter and residual basal area on tree growth varied with stand composition. Diameter growth responded significantly to harvesting and this response varied with tree size and residual basal area (
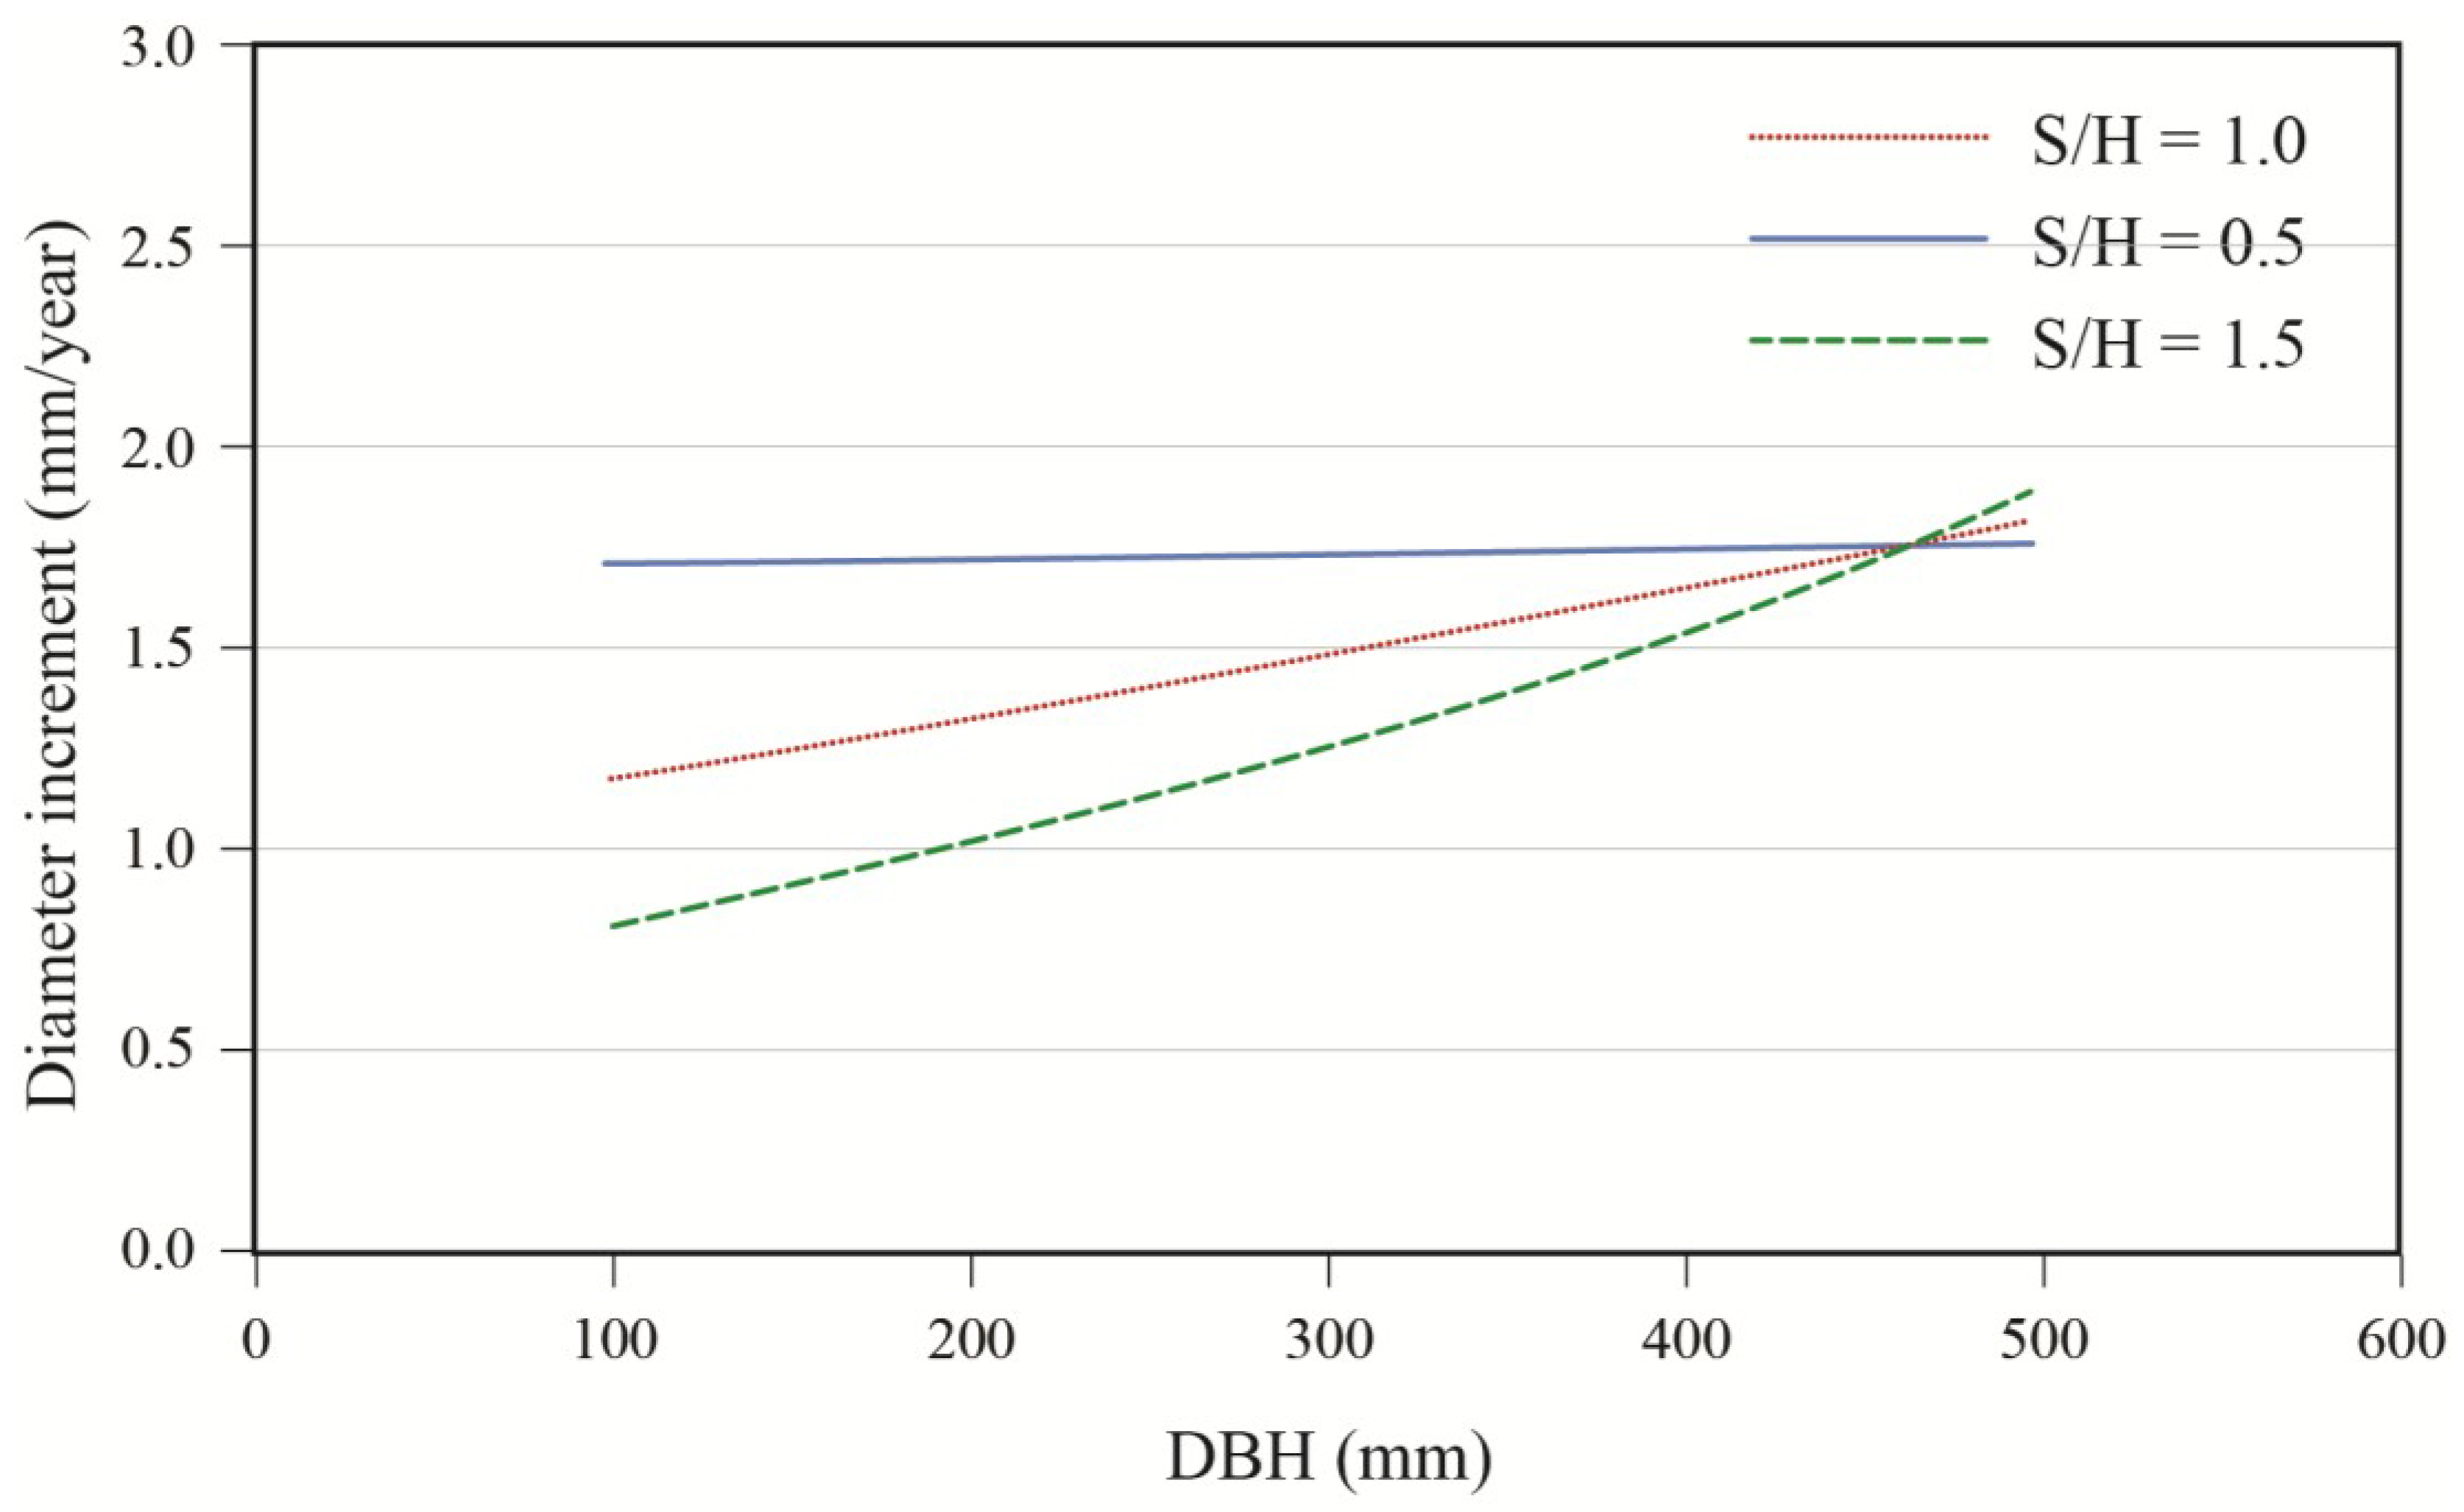
Table 3). Diameter growth after cutting decreased with increasing softwood content (S/H) up to a DBH of approximately 45 cm (
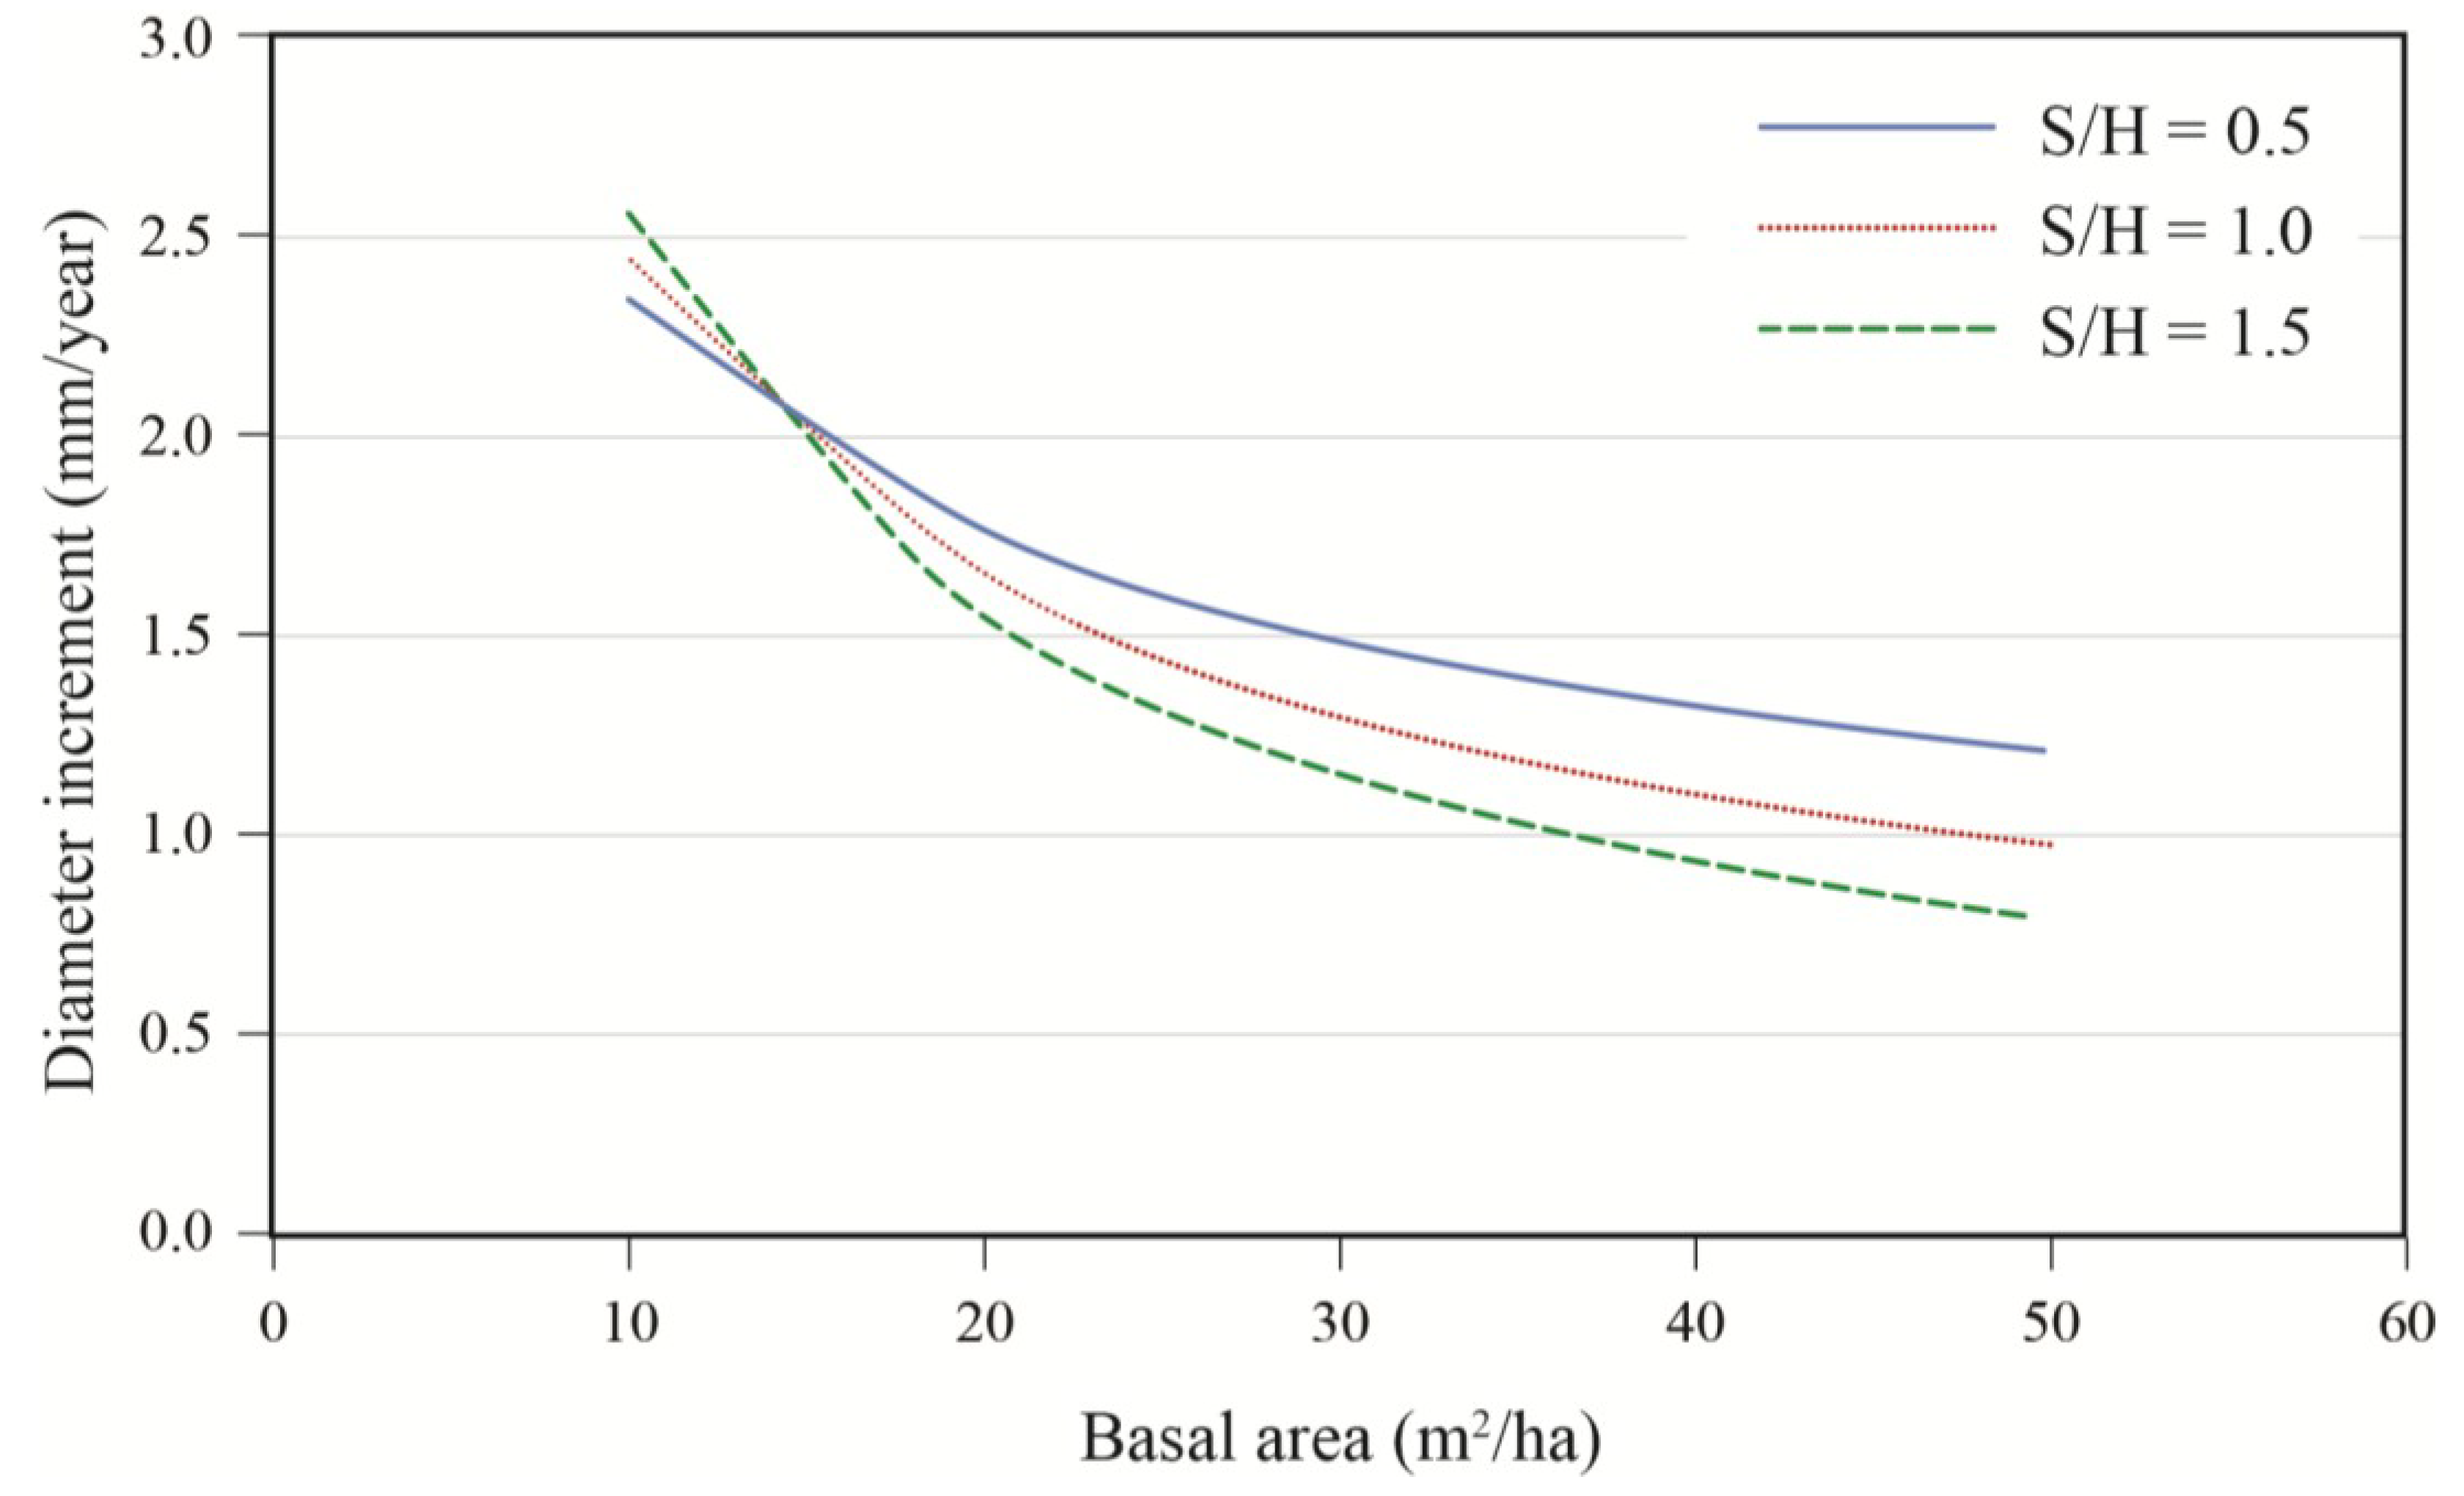
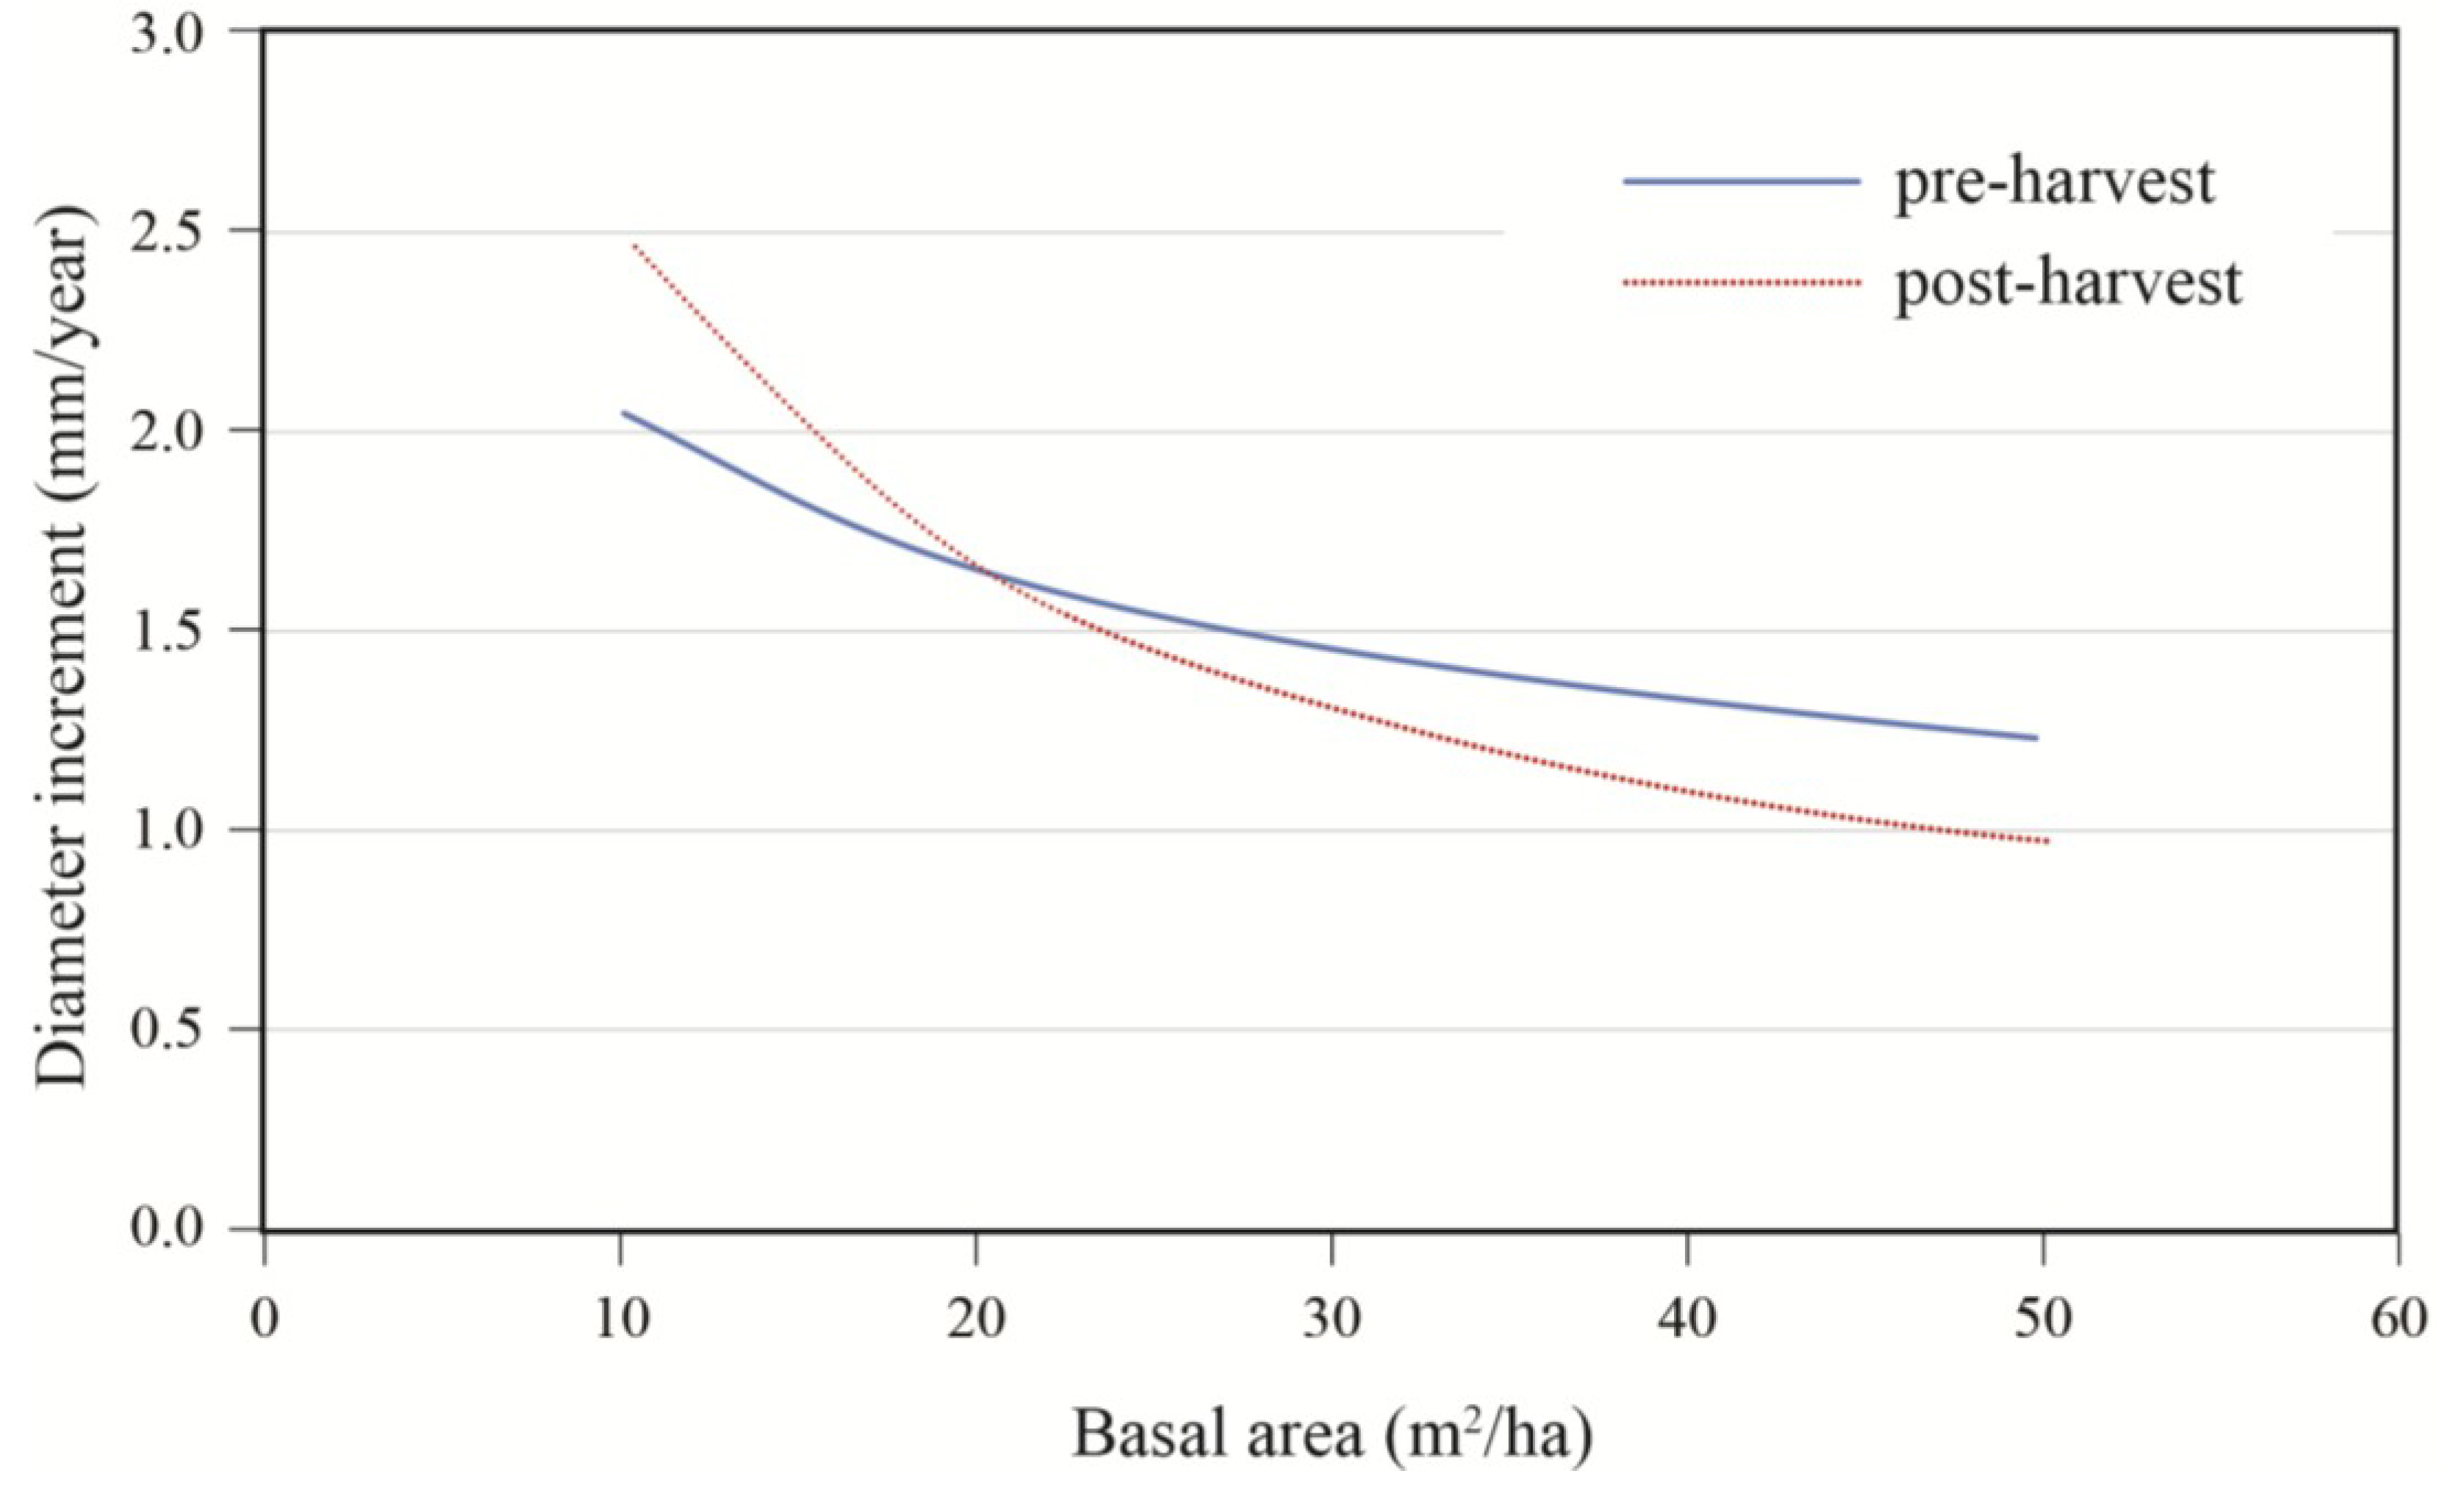
Figure 5). For an average tree (DBH = 40 cm), the effect of stand composition was especially evident at high densities where the best growth was observed in stands with a substantial hardwood content. Growth decreased rapidly with stand density up to 20 m
2/ha, after which the effect of basal area became less pronounced (
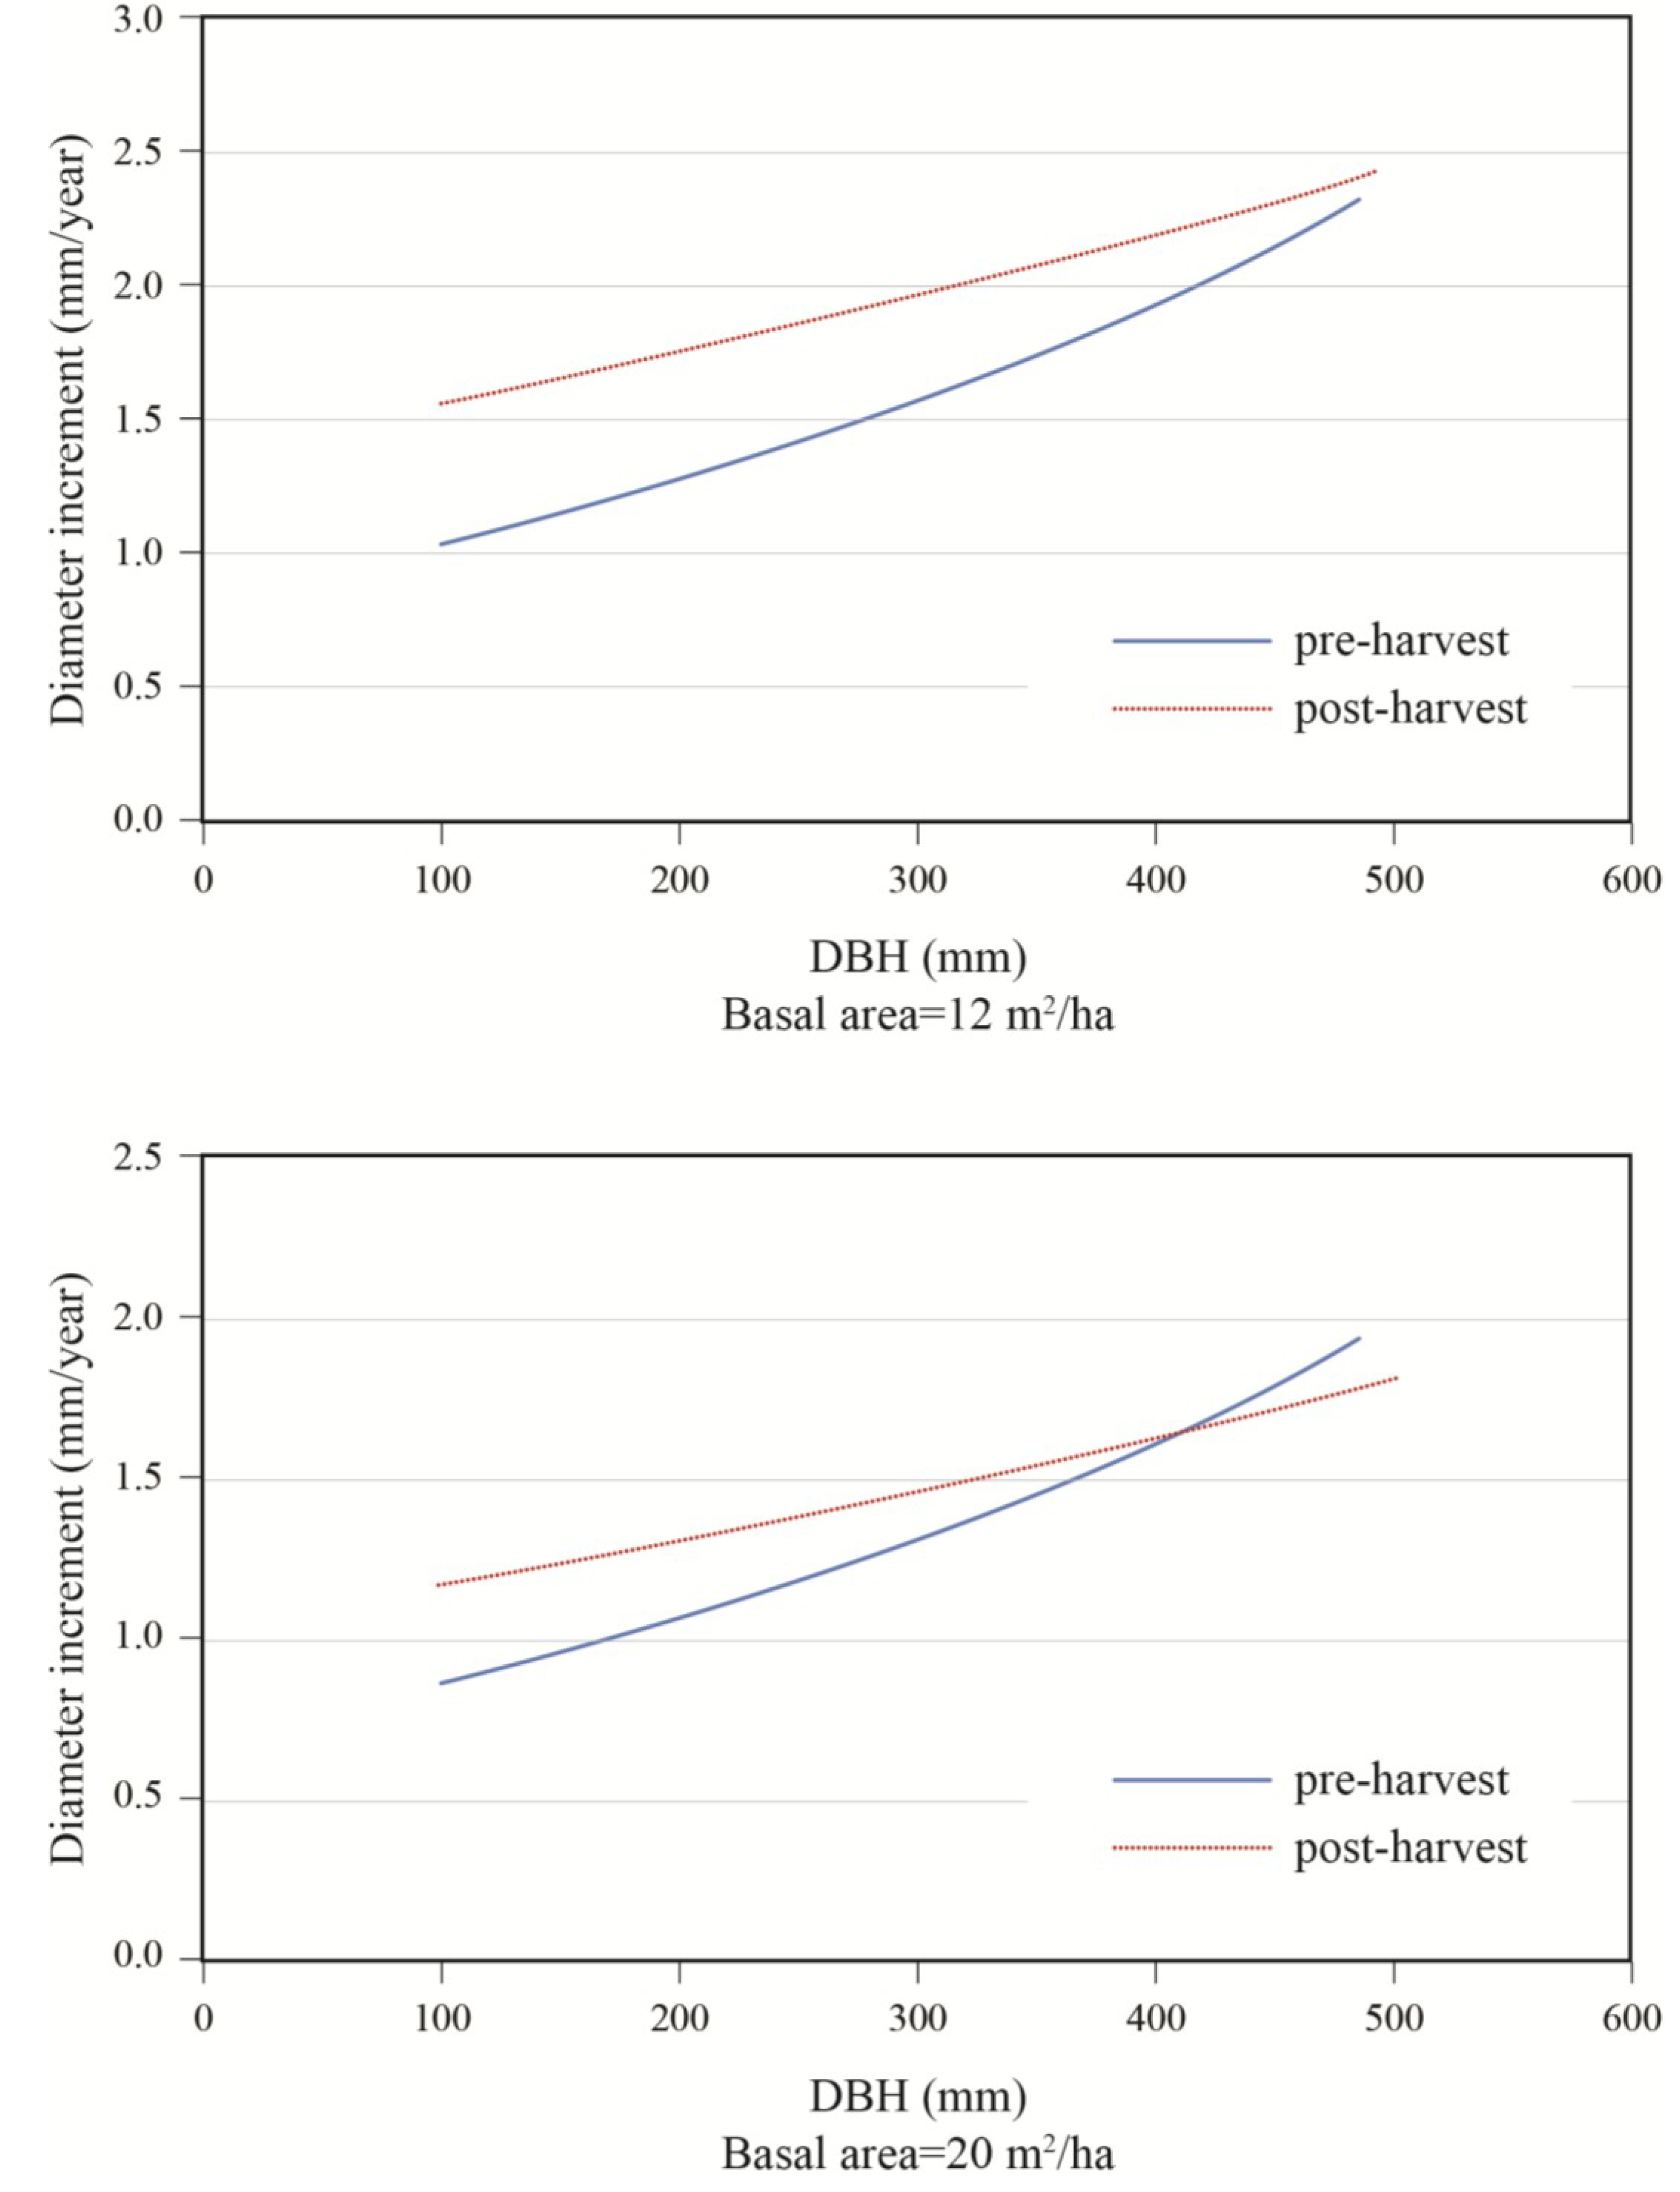
Figure 6). Prior to harvest, growth increased with diameter (
Figure 7). In a 50:50 mixture of hardwoods and softwoods, growth response was greater in small stems. At a low residual density (12 m
2/ha), a positive response to cutting was observed up to diameters of about 50 cm (
Figure 7). At higher residual basal area (20 m
2/ha), the same response pattern was seen, except that a positive response was only seen for trees with a DBH smaller than 40 cm. In the same stand composition, a mid-sized tree of 40 cm in DBH responded positively to harvesting up to a residual basal area of 20 m
2/ha, after which a negative response was predicted (
Figure 8).
Table 3.
Estimates of parameters for fixed effect variables retained in the final model.
Table 3.
Estimates of parameters for fixed effect variables retained in the final model.
| Variable | Parameter value (standard error) | p value |
|---|
| intercept | 0.619 (0.057) | 0.013 |
| period | 1.166 (0.157) | <0.001 |
| S/H* DBH0 | 0.0021 (0.0009) | 0.023 |
| S/H* LnBA | −0.318 (0.086) | <0.001 |
| period* DBH0 | −0.000957 (0.000179) | <0.001 |
| period* LnBA | −0.260 (0.054) | <0.001 |
Figure 5.
Effect of diameter and stand composition on annual diameter growth; S/H: softwood/hardwood basal area ratio; post-harvest values for a stand with a residual basal area of 20 m2/ha.
Figure 5.
Effect of diameter and stand composition on annual diameter growth; S/H: softwood/hardwood basal area ratio; post-harvest values for a stand with a residual basal area of 20 m2/ha.
Figure 6.
Effect of residual stand basal area and stand composition (S/H: softwood/hardwood basal area ratio) on annual diameter increment; data are for a 40 cm tree, post-treatment.
Figure 6.
Effect of residual stand basal area and stand composition (S/H: softwood/hardwood basal area ratio) on annual diameter increment; data are for a 40 cm tree, post-treatment.
Figure 7.
Effect of initial diameter on diameter increment response to treatment; stand with S/H = 1.0, for residual basal areas of 12 and 20 m2/ha.
Figure 7.
Effect of initial diameter on diameter increment response to treatment; stand with S/H = 1.0, for residual basal areas of 12 and 20 m2/ha.
Figure 8.
Growth response to treatment according to residual basal area; data are for a 40 cm diameter tree growing in a stand with an S/H = 1.0.
Figure 8.
Growth response to treatment according to residual basal area; data are for a 40 cm diameter tree growing in a stand with an S/H = 1.0.
Response to cutting was not related to tree position within the canopy after cutting (BAL) nor to the amount of basal area removed (1/HARV) since these two variables were not retained in the variable selection process.
4. Discussion
Natural disturbance dynamics in yellow birch—balsam fir stands are known to be strongly influenced by spruce budworm outbreaks [
19,
20]. Synchronous growth decreases were noted for hemlock and balsam fir. Balsam fir is a preferred host of the budworm whereas hemlock can be affected once the fir resource has been exhausted [
21]. In addition, many growth decreases observed for balsam fir were not observed for non-host species, providing additional support for a major role of the spruce budworm. In our study, all growth decreases that were noted for balsam fir in the 20th century correspond quite well to spruce budworm outbreaks that affected the region. In southwestern Quebec, where the study was located, three outbreaks have been documented. The first occurred between 1910 and 1915 [
11,
22,
23]. Although this outbreak cannot be captured by our balsam fir growth series because the sampled trees were too young at that time, important growth responses were noted for both yellow birch and white-cedar in the OR site. The growth increase for birch and white-cedar at the OR site suggests that the outbreak at this location caused sufficient tree mortality and openings to favor the subsequent development of non-host species. This outbreak has been reported as a severe one [
24], which could explain the persistence of the increased growth. Growth patterns for the PL site were more difficult to interpret for this period and did not show the same pattern. Others have also noted that this outbreak affected a smaller proportion of trees in the western sugar maple – yellow birch ecological domain where the PL site is located, in comparison with the western balsam fir—yellow birch ecological domain, where the OR site is located [
23]. For both sites, our data did not allow us to quantify directly the density of host trees prior to the outbreak and the percentage of trees that were killed or damaged by the budworm.
A second budworm outbreak was reported around 1939–1949 [
22,
24,
25], with the minimum growth of the host species occurring in 1949. The exact importance of this outbreak for the region is more difficult to define. According to Bouchard
et al. [
22,
25], who studied the region immediately north of our own, this outbreak was of a shorter duration and probably caused little mortality since stands remaining from the previous infestation were young and less vulnerable at that time. However, Blais [
24], although providing no quantitative evidence, states that this outbreak may well have been quite severe within the study region. According to Morin [
11], the growth decrease was not as marked compared with the other two outbreaks that occurred in the same century. For our two sites, we observed poor growth of balsam fir during this period, while positive but small growth responses were seen for yellow birch and white-cedar (1956–1957) in the OR site and for white-cedar in the PL site after 1951. This would concur with other studies that reported significant damage in the early 1950s for both sites [
23].
The last outbreak occurred from 1974 to 1984 [
26]. Peak of mortality in mixedwood stands was observed around 1977 [
24] with minimum growth of host species occurring in 1978. According to Jardon
et al. [
23], the outbreak was already well developed in this region around 1971. This outbreak was very severe and generated a marked growth reduction in host species (fir and hemlock), followed by a clear growth increase for white-cedar, yellow birch and fir in the OR site, and for hemlock and fir in the PL site, while a small but significant increase occurred for cedar in the PL site. In the OR site, partial harvesting occurred during the outbreak so that both effects cannot be separated. In the PL site, growth responses were marked around 1981–1986, which would be consistent with an effect of the partial harvesting that took place between 1979 and 1981. It is likely that harvesting included some form of salvage of damaged balsam fir stems.
An episode of birch dieback that occurred in the 1940s and the 1950s is another natural disturbance that may have played a role in the region [
27]. Many causes have been suspected but there are indications that an abnormal thaw in winter 1936 may have weakened the trees [
28,
29]. However, since growth started to decrease around 1930, this birch dieback episode was probably not involved. In our study, clear responses of white-cedar to release were observed, which were separated by periods of stable or reduced growth. This suggests that many disturbance episodes may be required for white-cedar to reach maturity. The capacity of white-cedar to sustain suppression periods and reach better position within the canopy after multiple suppression–release events appears to be a dominant trait of the species’ dynamics [
2,
19]. This response potential would be maintained even at old ages and after long periods of suppression. According to Hofmeyer
et al. [
19], spruce budworm outbreaks would play a major role in stand dynamics when balsam fir and white-cedar grow together.
Growth responses to natural disturbances for white-cedar were smaller in the PL site, although site conditions were quite similar and climate was slightly warmer and wetter than in the OR site. Wide variations in white-cedar growth have previously been observed across many sites [
30,
31]. In terms of species composition, the main differences with the OR site were a lower hardwood content and a greater abundance of hemlock. In fact, while white-cedar and yellow birch responded quite similarly to disturbances in the OR site, hemlock outperformed white-cedar after disturbance at the PL site. Thus, hemlock may be a strong competitor for white-cedar when they both grow together. Hemlock shares many traits with white-cedar. Hemlock is a long-lived species and is also able to withstand long periods of suppression and still respond to canopy openings [
32]. Hemlock is known to respond better in hardwood than in softwood stands because it can maintain a longer live crown in the former [
27]. The potential effects of species composition were further substantiated by the significant interaction of S/H with DBH and LnBA. This interaction indicated that the impact of a given stand basal area was greater when softwoods were abundant. It also showed a stronger effect of softwood content for small stems, which were more likely to be in sub-dominant positions. The negative effect of softwood abundance on white-cedar growth has not been documented before. A study comparing three softwood and three hardwood species in Alberta, Canada, reported higher average light transmission through individual crowns of hardwoods (36%–52% for hardwoods
vs. 12%–27% for softwoods) [
33]. Species effects within each of these groups could also be present, so that detailed studies of competitive interactions would be required.
Our results also showed that white-cedar growth can be maintained over long periods. Hence, the growth series showed a tendency towards increased growth over time. In the first portion of the growth series, the number of samples remained quite low. Yet, for the last century, at least 20 to 40 sample stems were included. Adding new recruits in the growth series could inflate general growth if these occurred in open conditions. However, this situation could hardly occur here given the fact that they developed in the subcanopy and need a number of growth-release events to reach their full growth potential. Instead, we could interpret this overall tendency as progressive access better canopy positions through time. This capacity to maintain consistent growth at large sizes is consistent with the high longevity of the species [
1].
Our statistical analysis provided similar indications since growth increased with diameter. Even though some of these observations could be related to white-cedar progressively gaining access to better canopy positions, it still remains that old and large diameter trees can maintain good growth. In fact, our model predicted that diameter growth could respond over a range of sizes. A similar growth increase with DBH up to 50 cm has also been reported from a large data set of permanent plots distributed across eastern Canada and northeastern USA [
1]. In their study, Hofmeyer
et al. [
19] also found that even the oldest trees had relatively constant radial increment, which meant increased basal area increment.
After harvest, for trees with a DBH of less than 40 cm before treatment, our model predicted a positive response for all trees, which was inversely proportional to their initial diameter. The model suggested a possible growth reduction for large trees (DBH > 40 cm) at medium densities (G = 20 m
2/ha). This remains unexplained, but is consistent with the reduced growth that we observed in
Figure 1 and
Figure 2 over the last 10 to 20 years. Since there was only a small proportion of the sampled trees over 40 cm, this trend would require additional sampling of large trees for validation.
Our study confirmed the response potential for white-cedar after natural disturbance or partial harvesting. Even though delayed responses have previously been reported [
2], we found no indications of such delays. Growth responses were generally synchronous with decreases in balsam fir growth that were associated with known spruce budworm outbreaks. In addition, mean growth during the first 10-year period after harvesting also showed a quick response to canopy openings.
Even though BAL was not retained in the final model, we have indications that tree position within the stand plays an important role in tree response. Hence, growth was lower for small trees and growth response was greater for trees that were likely subjected to greater competition before treatment.
The type and intensity of cutting also had an effect on diameter increment response. Stands must be reduced below 20 m
2/ha (LnBA = 3) for a response to become evident. Residual stand composition would also have an effect on diameter growth. At low densities that would be associated with partial harvesting, competition remains low so that growth is not strongly influenced by species composition. As higher residual basal areas are reached, an increasing proportion of conifers contribute to stronger reductions in diameter growth. At medium densities, diameter growth would remain relatively constant across tree sizes in hardwood-dominated mixedwood stands, whereas strong reductions would be noted in small tree sizes for softwood-dominated mixedwood stands. This response is consistent with observations made by Stadt and Lieffers [
33] that birch (in their case, paper birch:
Betula papyrifera Marsh.) would transmit more light than either white spruce or balsam fir. The impact of stand composition would then be more important for smaller, lower canopy positioned trees. The strong growth response of hemlock that was seen in one of our sites could also be involved. In well-designed partial cuts, the effect of stand composition should not be critical since basal area would be reduced to levels at which the effects of stand composition would be low. Without harvesting, we should expect stand composition to be a major driver for diameter growth.


