Estimation of the Relationship between Urban Park Characteristics and Park Cool Island Intensity by Remote Sensing Data and Field Measurement

Abstract
:1. Introduction
2. Methods
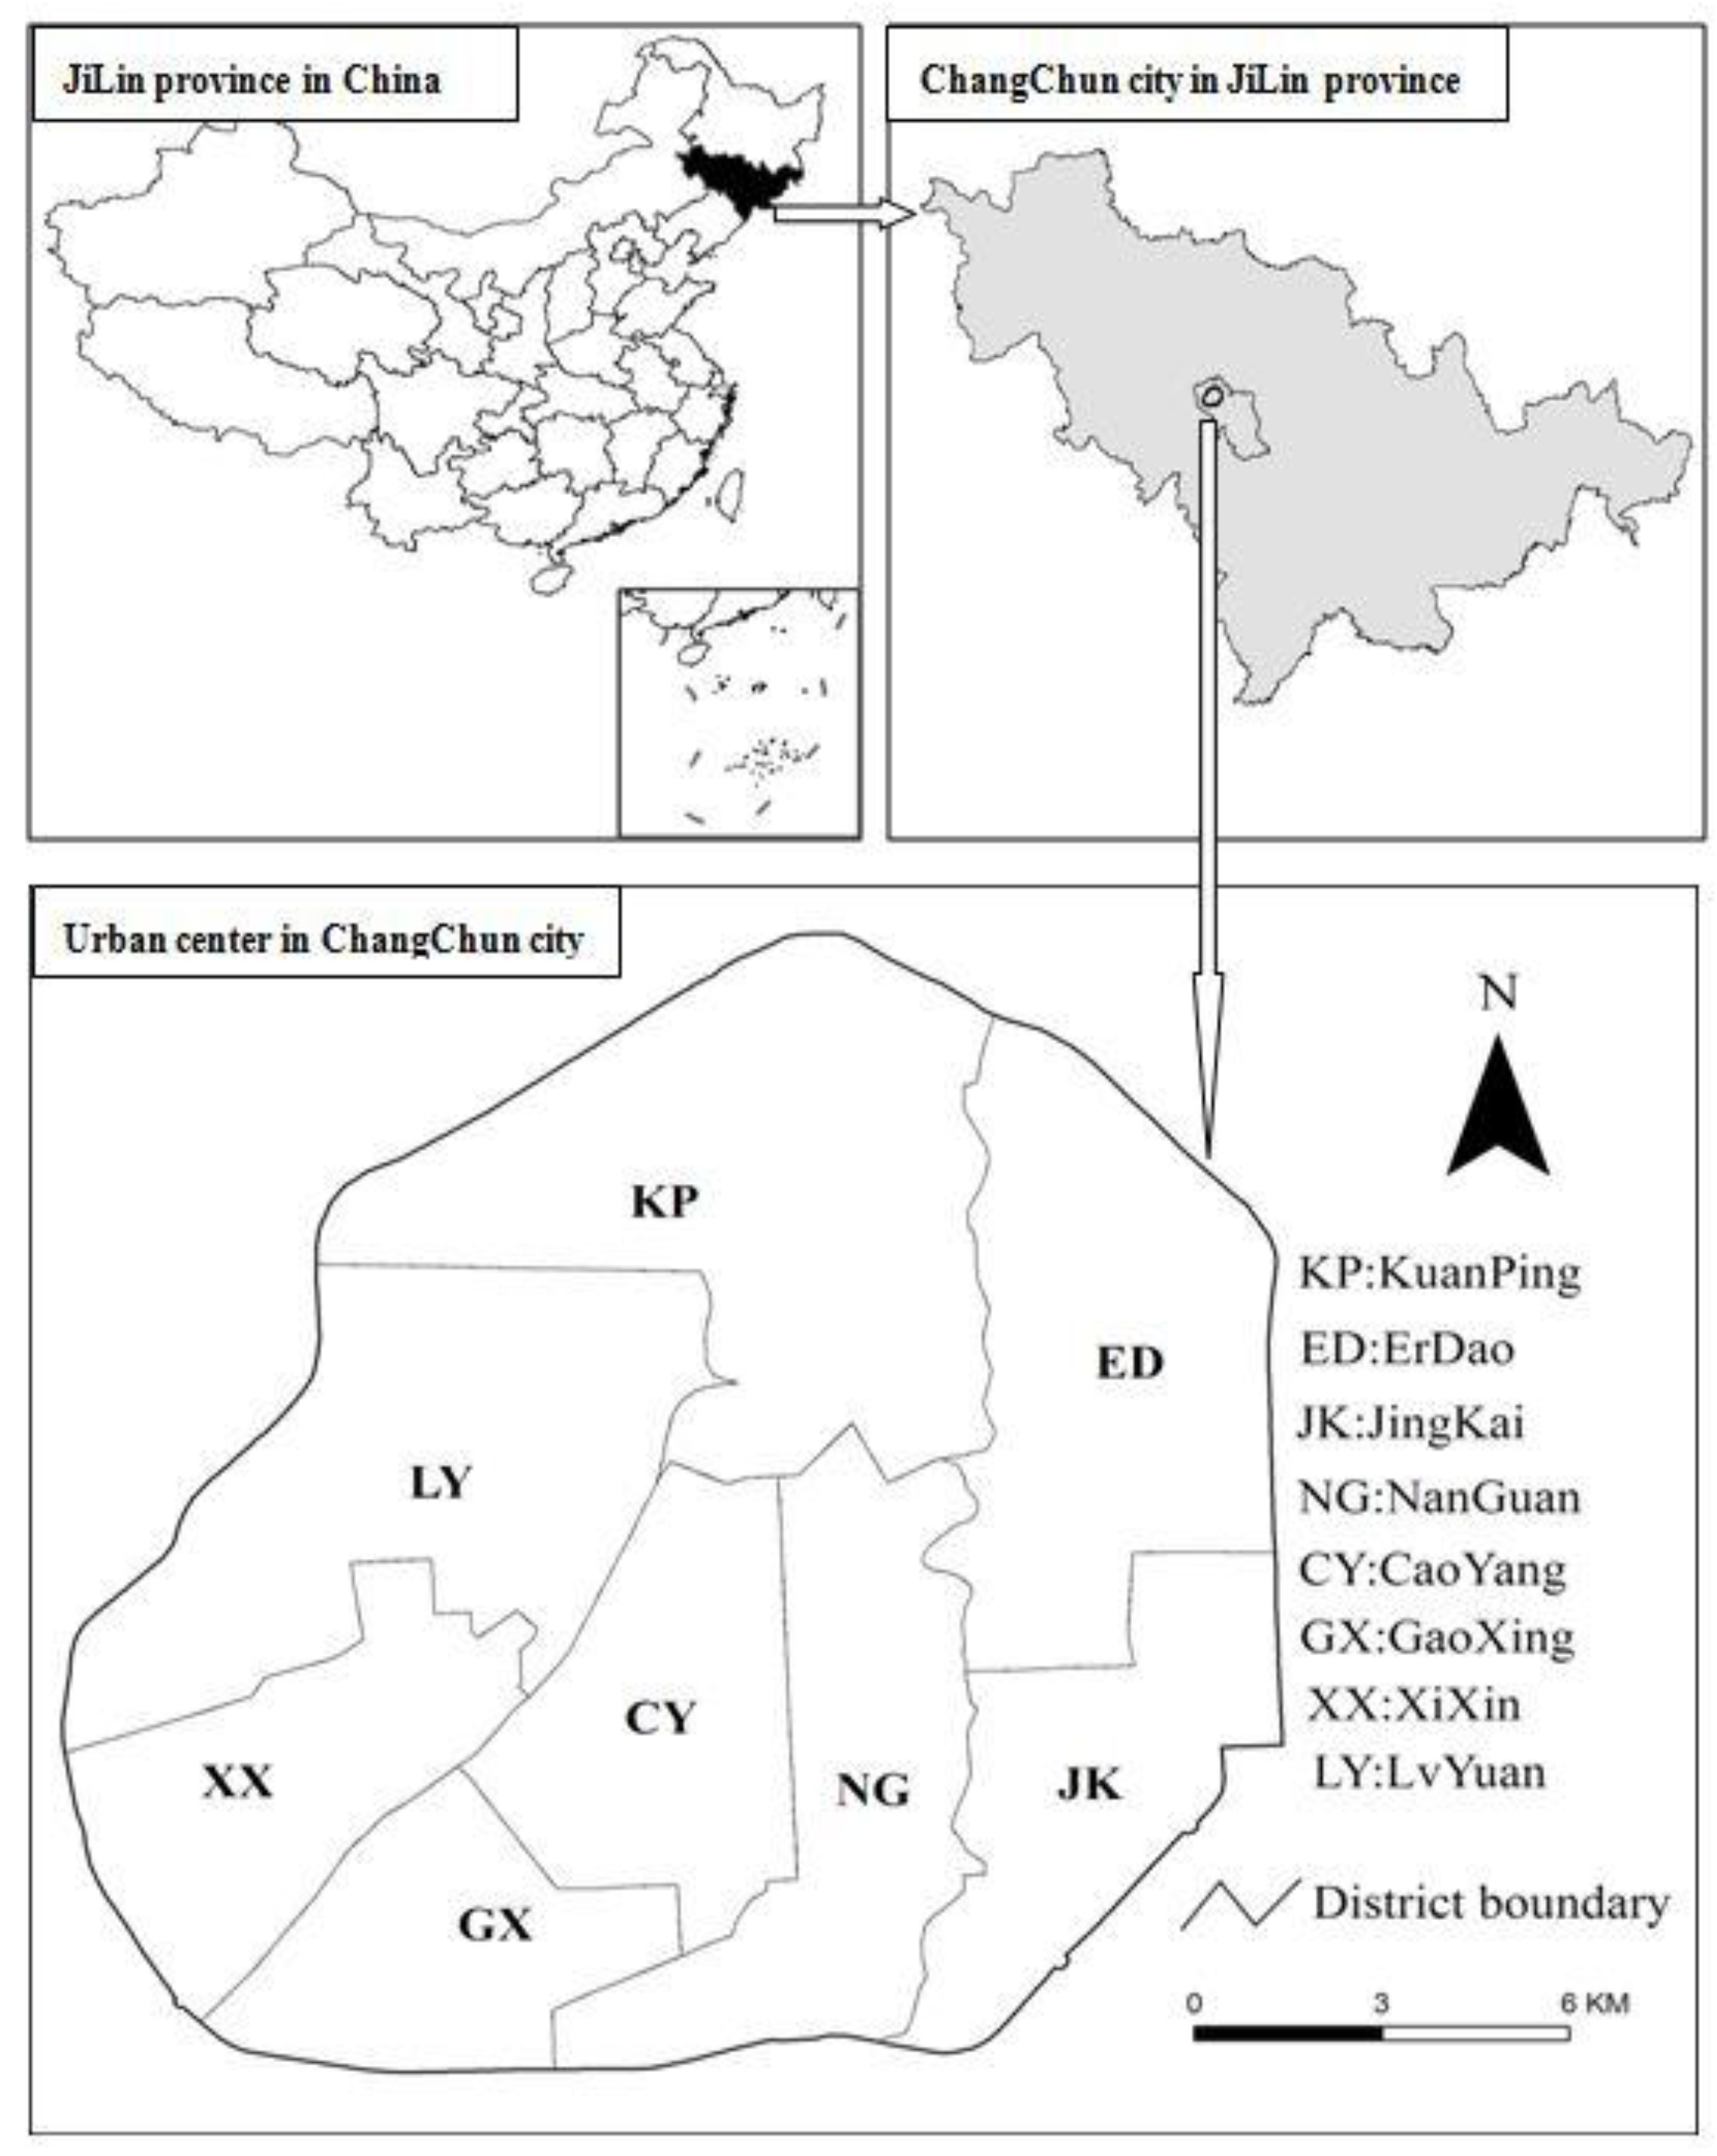
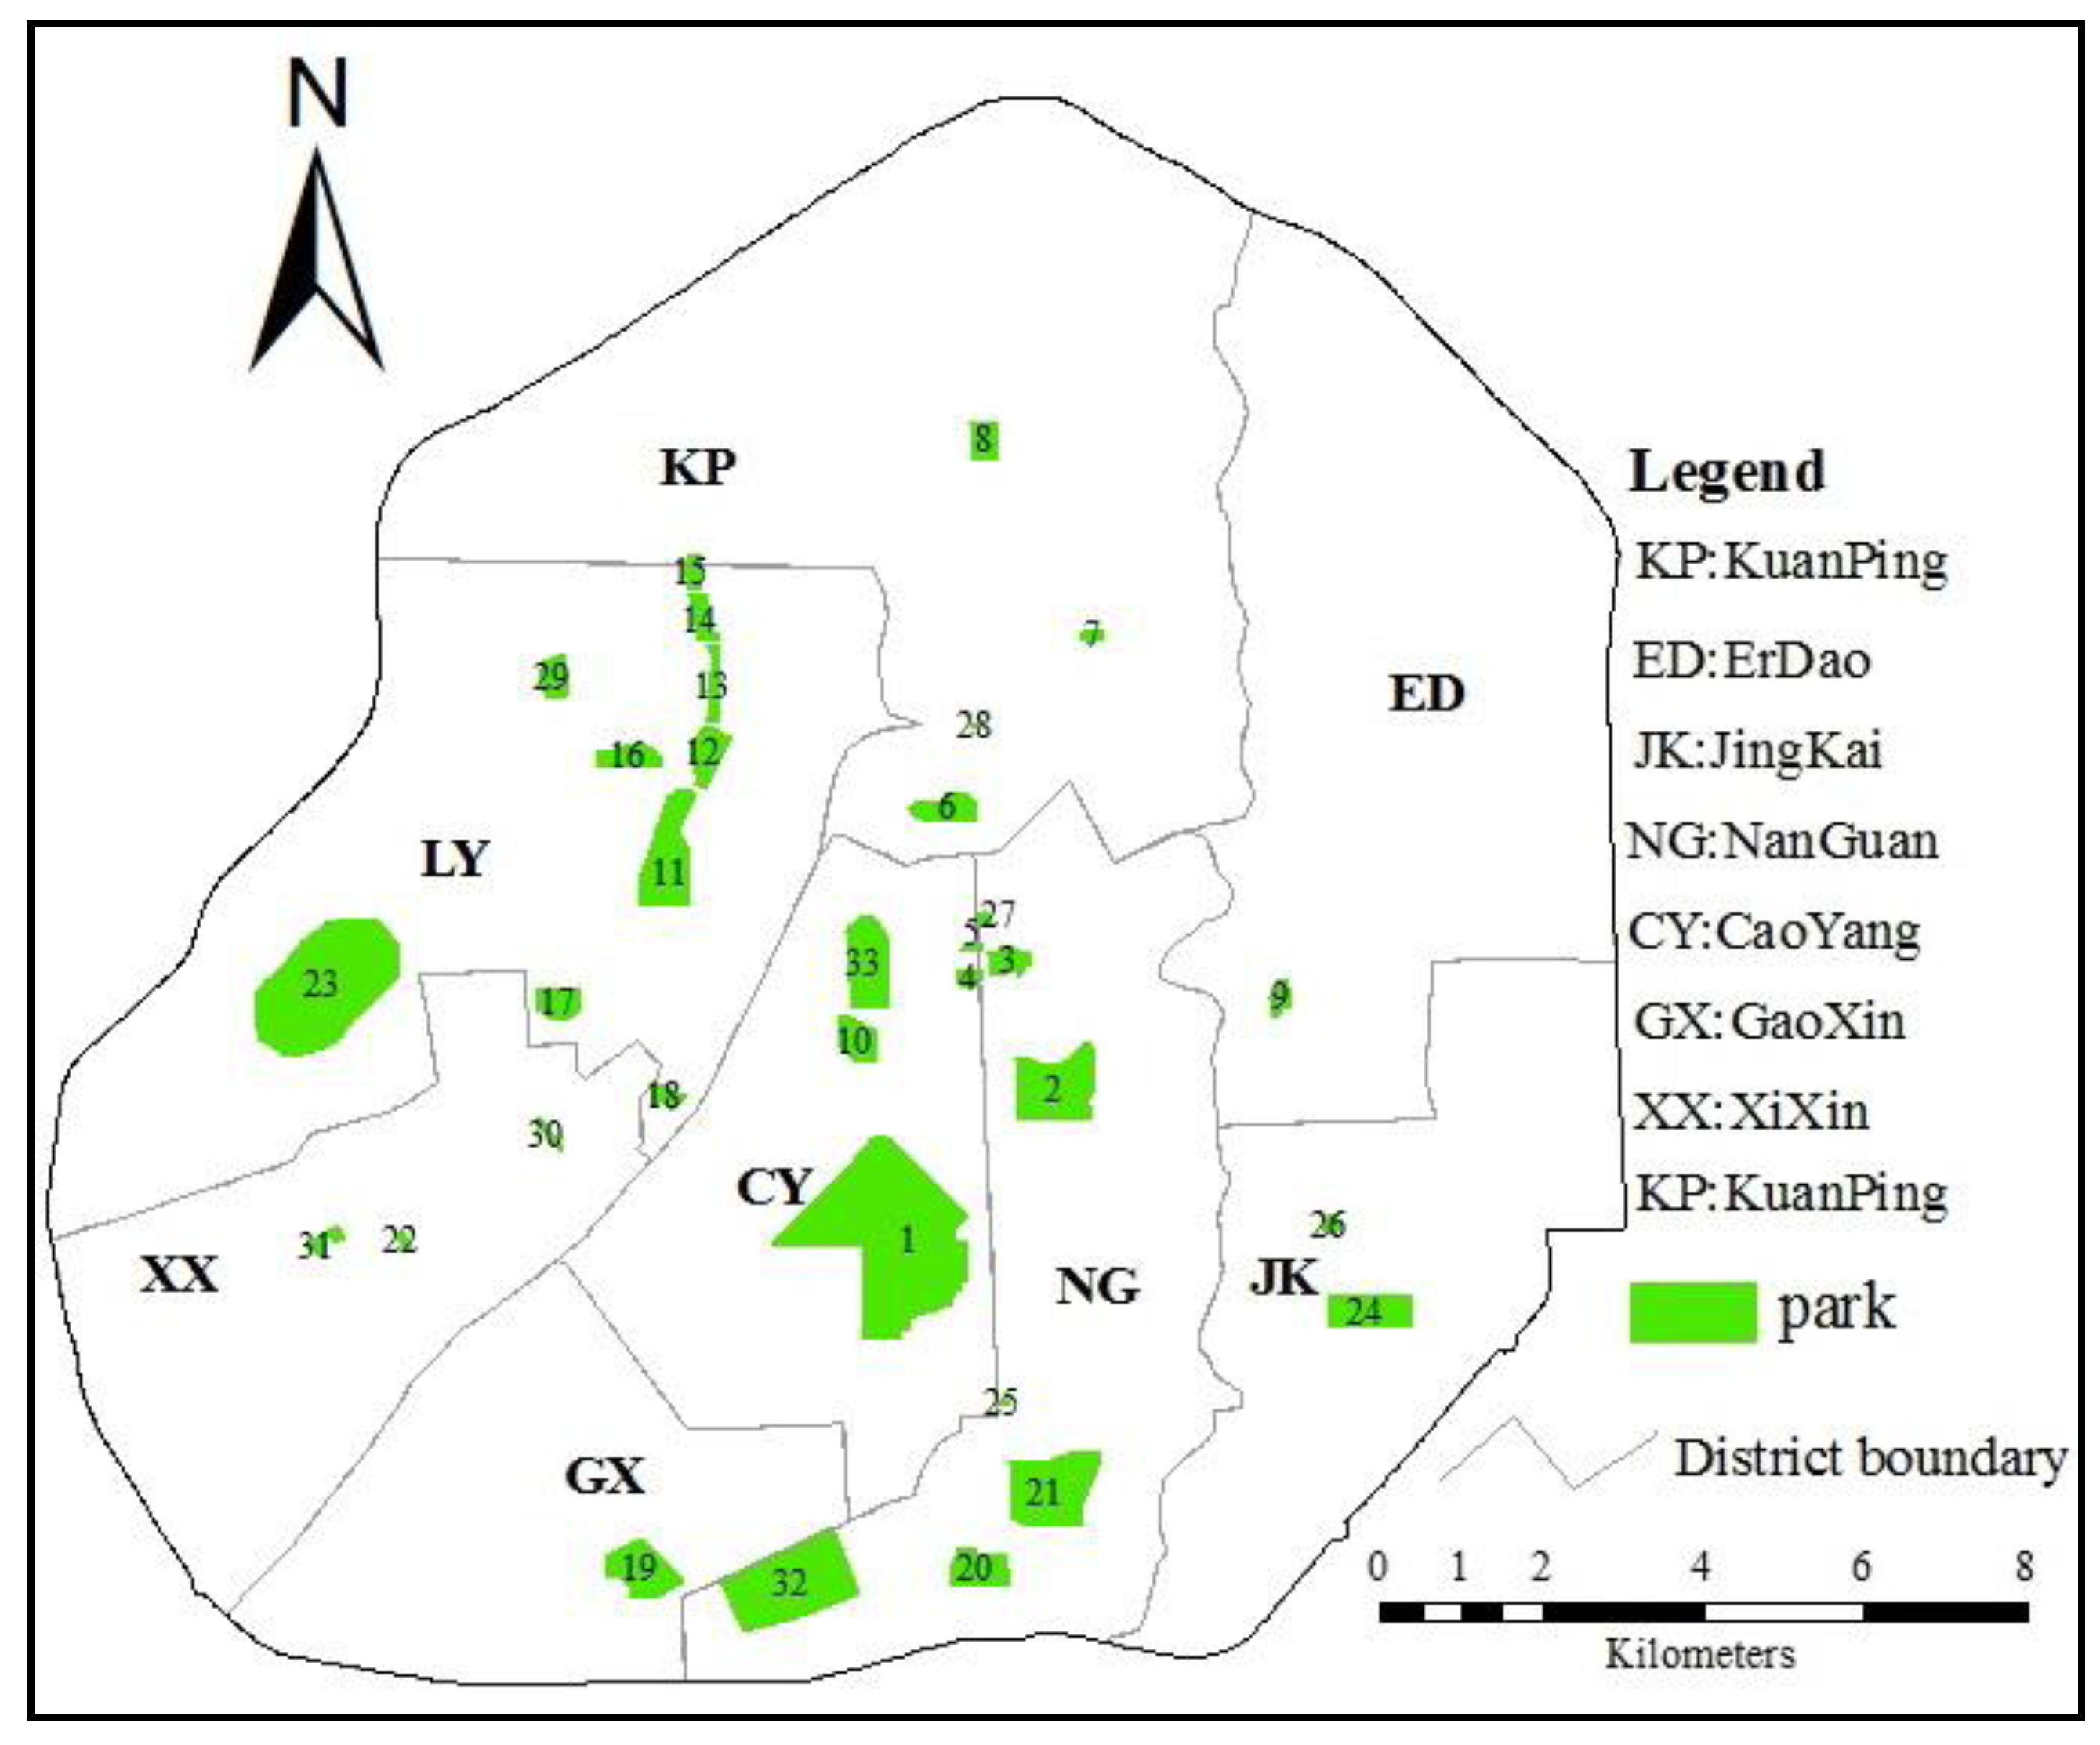
2.1. Study Sites

2.2. Data Preparation
2.2.1. Urban Park Characteristics
2.2.1.1. Urban Park Size and Shape

2.2.1.2. Urban Forest Structures in Parks
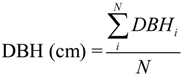
- Stem density (SD): It is defined as the number of trees (N) per unit area (Equation 1).
- Diameter at breast height (DBH): The DBH was measured directly by optical instruments. Their value in a sampling quadrat is the average of DBH values for all sampled trees (Equation.2).
- Tree height (H): The H was also measured directly by optical instruments. Their value in a sampling quadrat is the average of H values for all sampled trees (Equation 3).
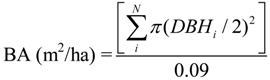
- Base area (BA): Basal area is defined as the ratio of the cross-sectional area of all trees in a sampling quadrat to the ground area they occupy. It was calculated from DBH and the value of base area is the total BA values of all sampled trees per unit area in a sampling quadrat (Equation 4).
- Canopy density (CD): CD was measured directly with a fish-eye camera, which is defined as the ratio of the fractional area (projected vertically) of urban forest canopy in a sampling quadrat to the ground area it occupies.
- Leaf area index (LAI): LAI was also measured directly with a fish-eye camera and TRAC, which is defined as the ratio of the leaf areas in a sampling quadrat to the ground area they occupy.

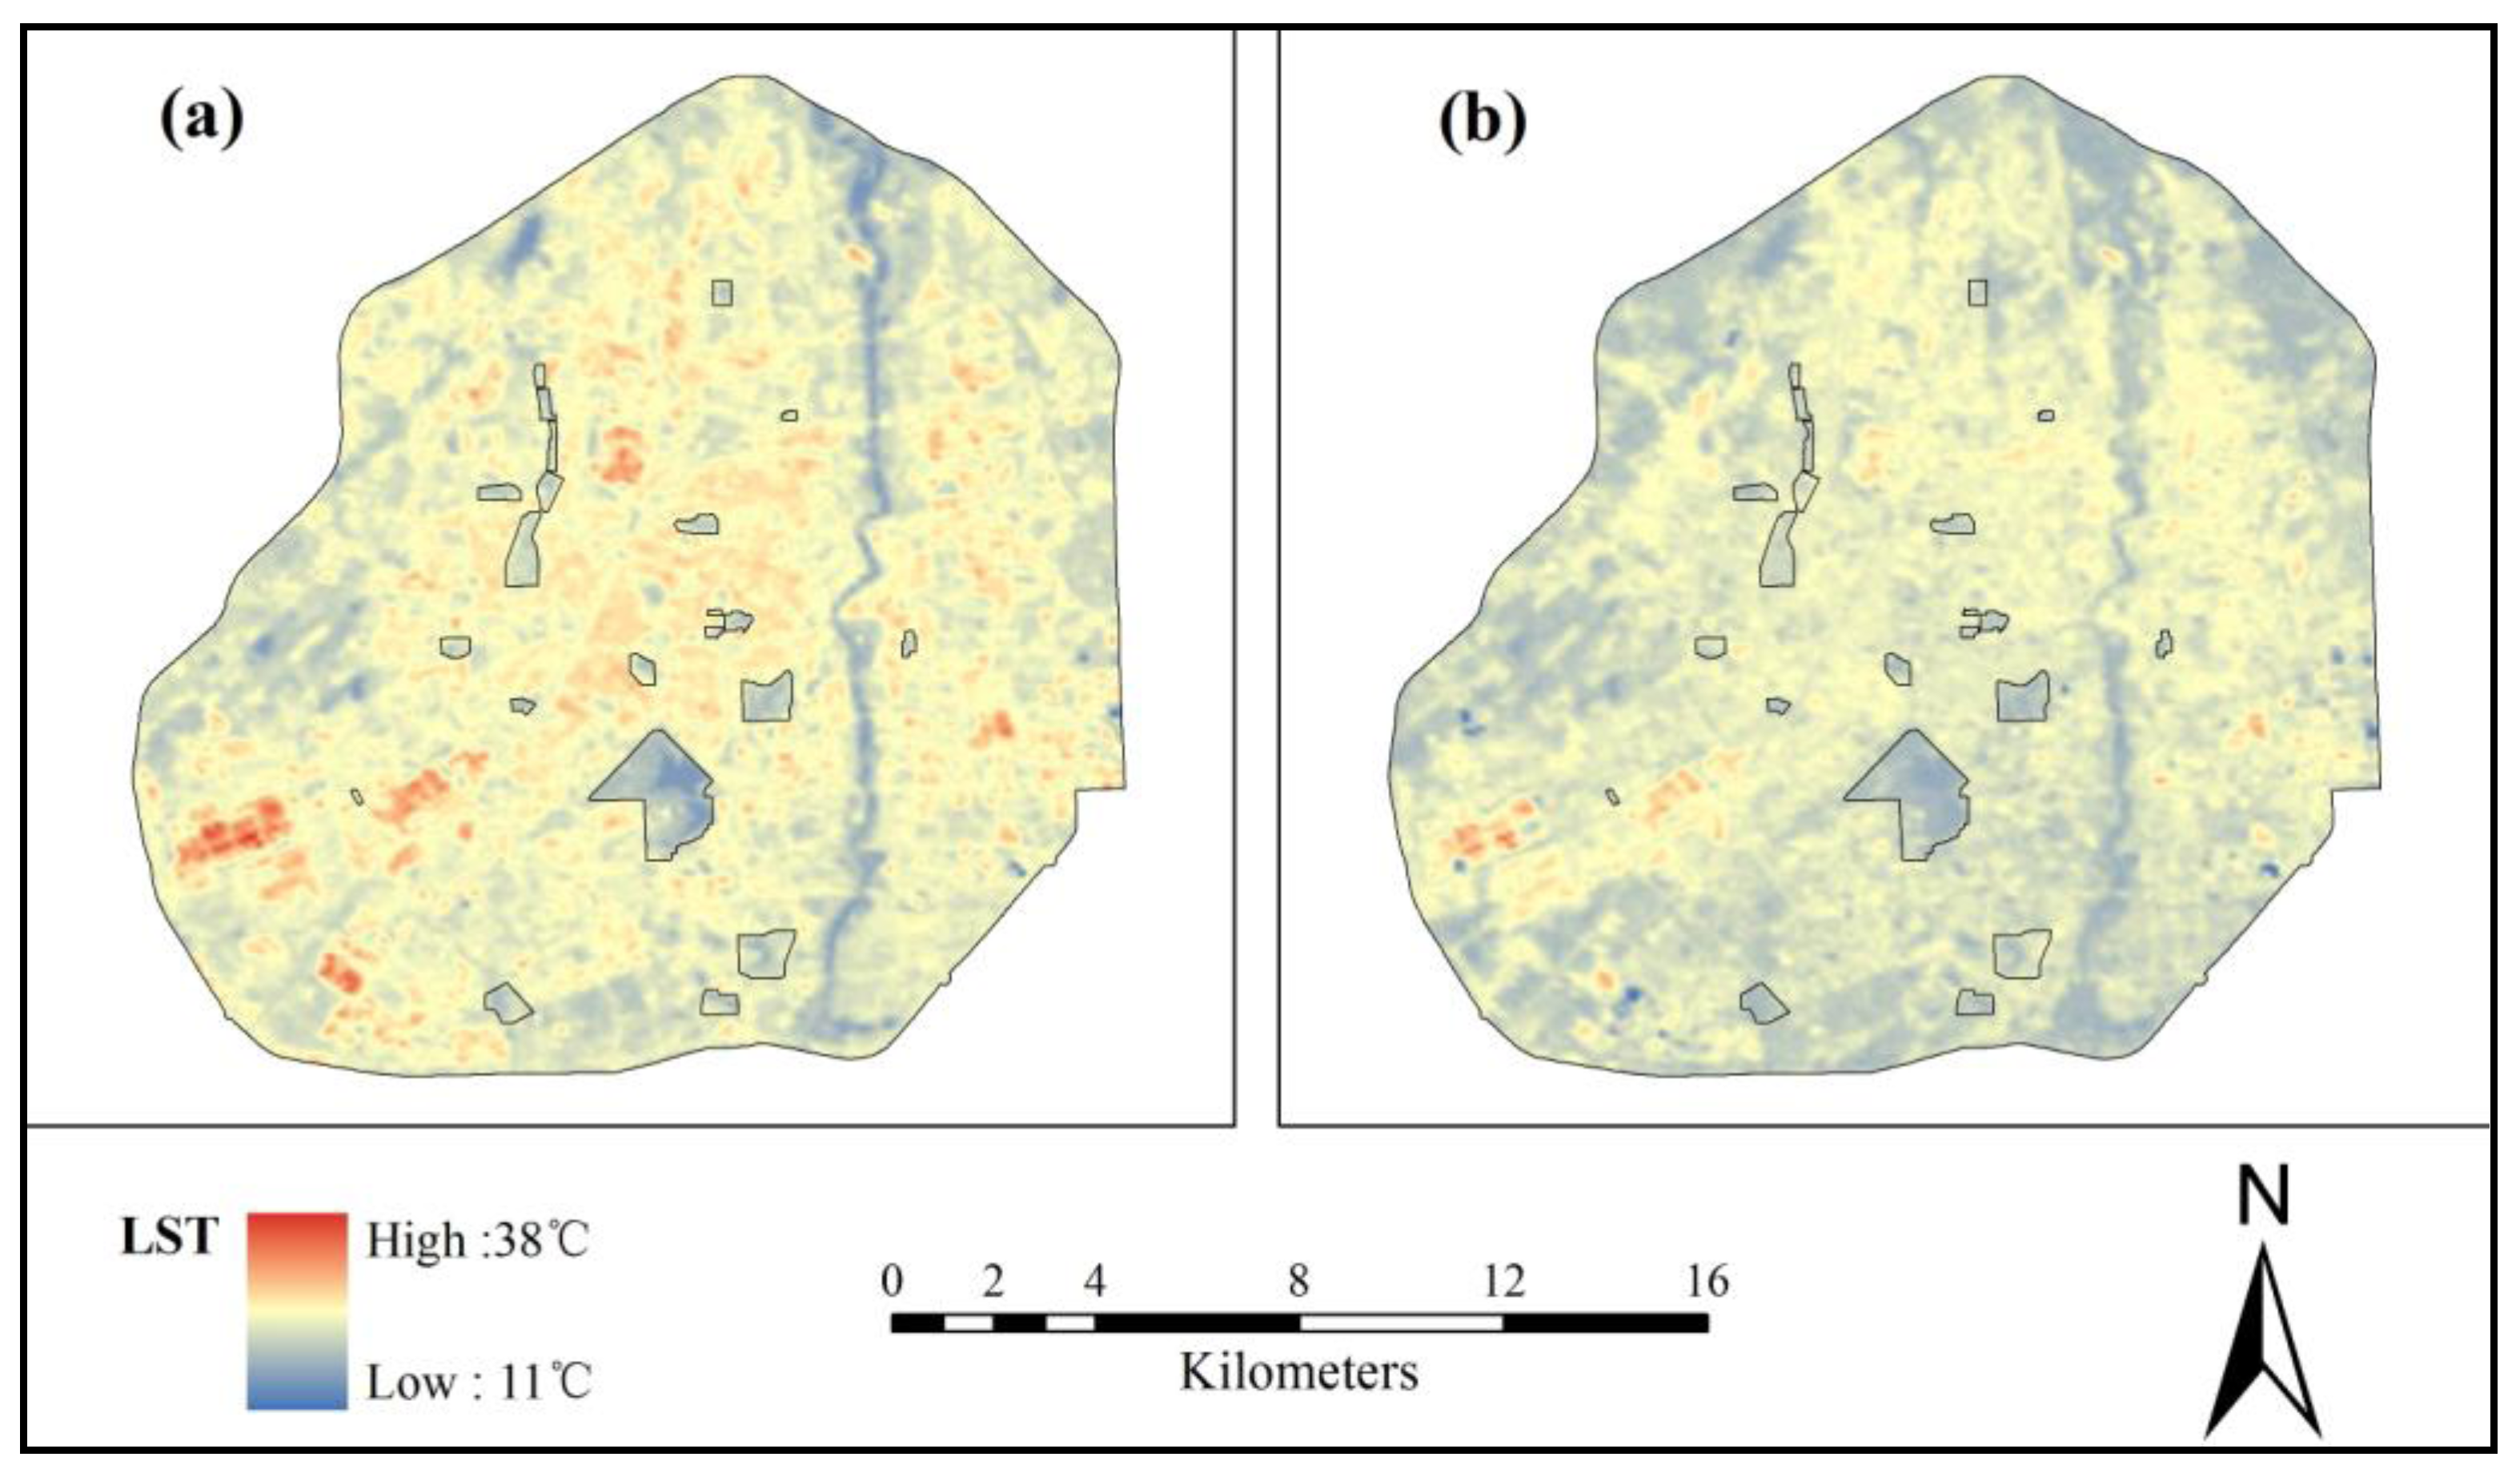
2.2.2. Park Cool Island (PCI) Intensity

| Season | Summer | Autumn |
|---|---|---|
| Data of TM acquisition | June 5, 2011 | September 22, 2010 |
| Time of TM acquisition | 10:12 a.m. | 10:11 a.m. |
| Min air temperature(°C) | 21.6 | 4.6 |
| Max air temperature(°C) | 31.2 | 21.6 |
| Mean air temperature(°C) | 26.4 | 14.3 |

2.3. Statistical Analyses
3. Results
3.1. Descriptive Statistics of PCI and Urban Park Size
| Park | Area(ha) | Perimeter(m) | PCI(°C) | Plot | |
|---|---|---|---|---|---|
| Summer | Autumn | ||||
| 1 | 324.64 | 8737.28 | 8.96 | 7.17 | 13 |
| 2 | 75.86 | 3852.54 | 6.39 | 5.85 | 9 |
| 3 | 15.98 | 1806.08 | 5.73 | 4.80 | 4 |
| 4 | 7.02 | 1115.03 | 3.92 | 3.76 | 3 |
| 5 | 3.08 | 781.84 | 2.59 | 2.67 | 2 |
| 6 | 23.90 | 2259.43 | 5.43 | 4.30 | 6 |
| 7 | 4.37 | 871.87 | 4.48 | 4.94 | 4 |
| 8 | 14.92 | 1549.77 | 5.00 | 3.70 | 5 |
| 9 | 11.74 | 1625.92 | 4.81 | 4.63 | 3 |
| 10 | 23.57 | 1980.82 | 4.43 | 4.67 | 6 |
| 11 | 69.06 | 3928.14 | 4.81 | 3.48 | 9 |
| 12 | 25.09 | 2086.32 | 4.94 | 2.28 | 3 |
| 13 | 13.20 | 2396.81 | 4.68 | 3.99 | 3 |
| 14 | 13.45 | 1873.13 | 5.37 | 3.98 | 4 |
| 15 | 9.07 | 1261.56 | 4.43 | 4.02 | 6 |
| 16 | 23.17 | 2194.94 | 6.01 | 5.09 | 8 |
| 17 | 18.50 | 1739.95 | 4.55 | 2.91 | 4 |
| 18 | 8.88 | 1334.59 | 6.71 | 4.95 | 6 |
| 19 | 44.32 | 2821.94 | 6.10 | 6.26 | 7 |
| 20 | 29.87 | 2302.04 | 5.82 | 5.31 | 5 |
| 21 | 87.23 | 3783.27 | 5.80 | 3.64 | 7 |
| 22 | 3.38 | 811.09 | 3.60 | 1.40 | 2 |
| 23 | 210.00 | 6001.00 | 7.90 | 6.84 | 8 |
| 24 | 43.97 | 2921.70 | 3.29 | 3.41 | 4 |
| 25 | 4.34 | 743.88 | 2.24 | 3.15 | 1 |
| 26 | 1.90 | 494.45 | 1.24 | 1.02 | 1 |
| 27 | 3.89 | 704.25 | 2.37 | 1.64 | 2 |
| 28 | 1.47 | 432.73 | 0.51 | 1.36 | 1 |
| 29 | 15.30 | 1607.08 | 3.68 | 2.76 | 5 |
| 30 | 4.52 | 1229.70 | 1.65 | 1.58 | 3 |
| 31 | 10.70 | 1345.53 | 4.27 | 3.63 | 4 |
| 32 | 159.93 | 5924.30 | 5.56 | 4.86 | 7 |
| 33 | 57.60 | 3212.77 | 1.93 | 0.34 | 3 |
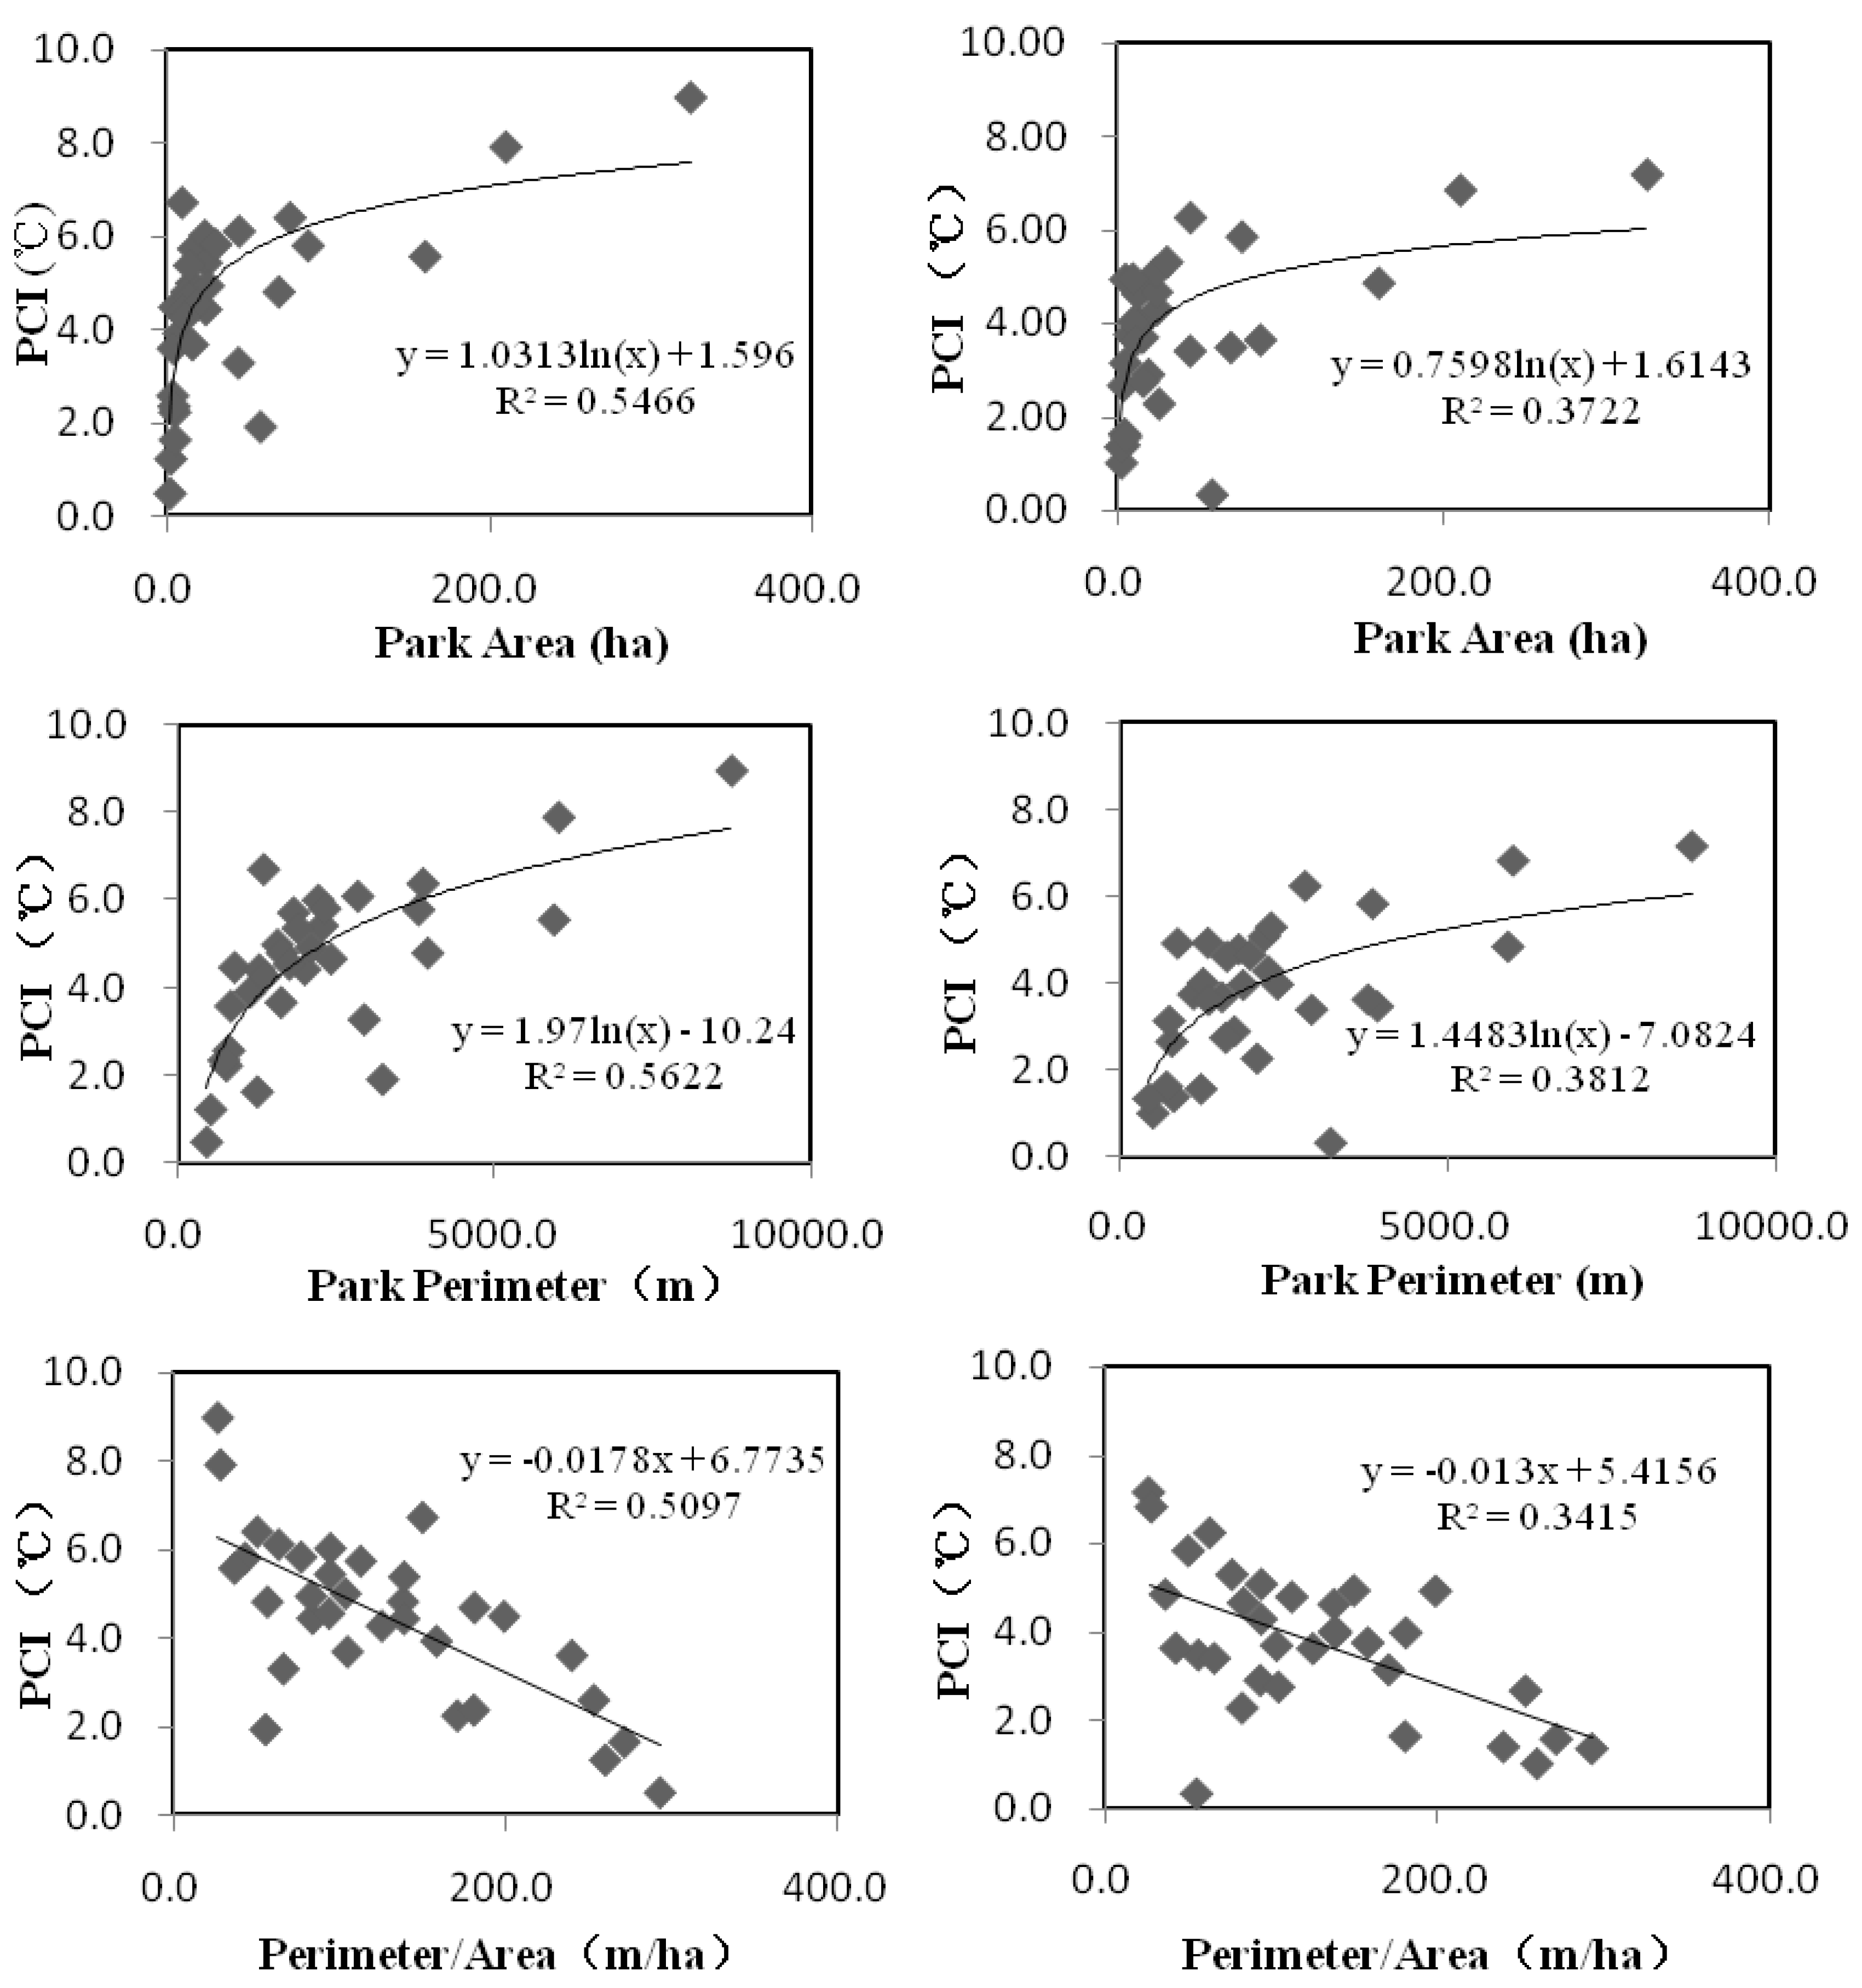
3.2. Effects of Urban Park Size on PCI Intensity
3.3. Effects of Urban Park Shape and Forest Structures in Parks on PCI Intensity
| Park | Summer | Autumn |
|---|---|---|
| Area (ha) | 0.626** | 0.549** |
| Perimeter (m) | 0.685** | 0.587** |
| Perimeter/Area (m/ha) | −0.715** | −0.584** |

| Forest structure | Summer | Autumn |
|---|---|---|
| Stem density (n/ha) | 0.563** | 0.201 |
| Diameter (cm) | 0.584** | 0.532* |
| Tree Height (m) | 0.666** | 0.440 |
| Basal Area (m2/ha) | 0.707** | 0.574** |
| Leaf area index | 0.722** | 0.658** |
| Canopy density (%) | 0.806** | 0.747** |
| Forest structure | Summer | Autumn | ||
|---|---|---|---|---|
| Regression Model | R2 | Regression Model | R2 | |
| Stem density (n/ha) | y = 0.1012x + 2.7347 | 0.3163 | y = 0.0375x + 3.3474 | 0.0408 |
| Diameter (cm) | y = 0.1332x + 3.1482 | 0.3419 | y = 0.1250x + 2.331 | 0.2826 |
| Tree height (m) | y = 0.3554x + 2.5021 | 0.4432 | y = 0.0023x + 2.4892 | 0.1717 |
| Basal area (m2/ha) | y = 0.1028x + 3.4094 | 0.5011 | y = 0.0871x + 2.7413 | 0.3371 |
| Leaf area index | y = 0.2397x + 3.1915 | 0.5225 | y = 0.2254x + 2.369 | 0.4330 |
| Canopy density (%) | y = 5.1905x + 1.9268 | 0.6507 | y = 4.7961x + 1.3199 | 0.5578 |
4. Discussion
4.1. Theoretical Implications
4.2. Management Implications
5. Conclusions
- (1)
- Urban parks can create PCI effects. However, the PCI intensity varied across seasons and the cooling effect of parks in summer was higher than that in autumn.
- (2)
- Urban park size was the most important factor for mitigating UHI, and increases in urban park size were still an effective measure to mitigate UHI.
- (3)
- Not only does urban park size but also urban park shape significantly affects PCI intensity. Given a fixed size of urban park, LST can be significantly increased or decreased by the different shapes of an urban park. Our results showed that the rounder the urban park shape is, the better the cooling effect achieved. Besides, urban forest structures also had significant impacts on the cooling effects of urban parks, among which the canopy density and LAI were the most effective in cooling. So, the trees, shrubs and grass should be designed in optimal ways to increase canopy density and LAI to maximize the cooling effect of urban parks. Therefore, UHI can be mitigated by optimizing urban park shape and forest structures when undertaking urban park planning, especially in cities where land resources are too limited to increase urban park size.
- (4)
- The relationship in summer between PCI intensity and urban park characteristics was stronger than that in autumn. Urban park characteristics may play a more important role in mitigating urban heat islands in summer than in autumn.
Acknowledgments
References
- Taha, H. Urban climates and heat islands: Albedo, evapotranspiration, and anthropogenic heat. Energ. Buildings 1997, 25, 99–103. [Google Scholar] [CrossRef]
- Oke, T.R. City size and the urban heat island. Atmos. Environ. 1973, 7, 769–779. [Google Scholar] [CrossRef]
- Kolokotroni, M.; Zhang, Y.; Watkins, R. The London heat island and building cooling design. Sol. Energy 2007, 81, 102–110. [Google Scholar] [CrossRef]
- Sarrat, C.; Lemonsu, A.; Masson, V.; Guedalia, D. Impact of urban heat island on regional atmospheric pollution. Atmos. Environ. 2006, 40, 1743–1758. [Google Scholar] [CrossRef]
- Weng, Q.; Yang, S. Urban air pollution patterns, land use, and thermal landscape: An examination of the linkage using GIS. Environ. Monit. Assess. 2006, 117, 463–489. [Google Scholar] [CrossRef]
- Basu, R.; Samet, J.M. Relation between elevated ambient temperature and mortality: A review of the epidemiologic evidence. Epidemiol. Rev. 2002, 24, 190–202. [Google Scholar] [CrossRef]
- Ellis, F.P.; Nelson, F.; Pincus, L. Mortality during heat waves in New York City July, 1972 and August and September 1973. Environ. Res. 1975, 10, 1–13. [Google Scholar] [CrossRef]
- Klenk, J.; Clemens, B.; Kilian, R. Heat-related mortality in resident of nursing homes. Age. Ageing 2010, 3, 245–252. [Google Scholar] [CrossRef]
- Bernatzky, A. The contribution of trees and green spaces to a town climate. Energ. Buildings 1982, 5, 1–10. [Google Scholar] [CrossRef]
- Dimoudi, A.; Nikolopoulou, M. Vegetation in the urban environment: Micro-climate analysis and benefits. Energ. Buildings 2003, 35, 69–76. [Google Scholar] [CrossRef]
- Georgi, N.J.; Dimitriou, D. The contribution of urban green spaces to the improvement of environment in cities: Case study of Chania, Greece. Build. Environ. 2010, 45, 1401–1414. [Google Scholar] [CrossRef] [Green Version]
- Jauregui, E. Influence of a large urban park on temperature and convective precipitation in a tropical city. Energ. Buildings 1990, 15, 457–463. [Google Scholar] [CrossRef]
- Upmanis, H.; Eliasson, I.; Lindqvist, S. The influence of green areas on nocturnal temperatures in a high latitude city. Int. J. Climatol. 1998, 18, 681–700. [Google Scholar] [CrossRef]
- Chen, Y.; Wong, N.H. Thermal benefits of city parks. Energ. Buildings 2006, 38, 105–120. [Google Scholar] [CrossRef]
- Jusuf, S.K.; Wong, N.H.; Hagen, E.; Anggoro, R.; Hong, Y. The influence of land use on the urban heat island in Singapore. Habitat. Int. 2007, 31, 232–242. [Google Scholar] [CrossRef]
- Spronken-Smith, R.A.; Oke, T.R. The thermal regime of urban parks in two cities with different summer climates. Int. J. Remote Sens. 1998, 19, 2085–2104. [Google Scholar] [CrossRef]
- Chang, C.R.; Li, M.H.; Chang, S.D. A preliminary study on the local cool-island intensity of Taipei city parks. Landsc. Urban. Plan 2007, 80, 386–395. [Google Scholar] [CrossRef]
- Zhang, X.; Zhong, T.; Feng, X.; Wang, K. Estimation of the relationship between forest patches and urban land surface temperature with remote sensing. Int. J. Remote. Sens. 2009, 30, 2105–2118. [Google Scholar] [CrossRef]
- Cao, X.; Onishib, A.; Chena, J.; Imurabet, H. Quantifying the cool island intensity of urban parks using ASTER and IKONOS data. Landsc. Urban. Plan 2010, 96, 224–231. [Google Scholar] [CrossRef]
- Mcpherson, E.G.; Nowak, D.; Heisler, G. Quantifying urban forest structure, function, and value: The Chicago Urban Forest Climate Project. Urban. Ecos. 1997, 1, 49–61. [Google Scholar] [CrossRef]
- Nowak, D.J. Understanding the structure of urban forests. J. For. 1994, 92, 36–41. [Google Scholar]
- Declet-Barreto, J.; Brazel, A.J.; Martin, C.A.; Chow, W.T.L.; Harlan, S.L. Creating the park cool island in an inner-city neighborhood: Heat mitigation strategy for Phoenix, AZ. Urban Ecosyst. 2013, 16, 617–635. [Google Scholar]
- Jenerette, G.D.; Harlan, S.L.; Stefanov, W.L.; Martin, C.A. Ecosystem services and urban heat riskscape moderation: Water, green spaces, and social inequality in Phoenix, USA. Ecol. Appl. 2011, 21, 2637–2651. [Google Scholar] [CrossRef]
- Potchter, D.; Cohen, P.; Bitan, A. Climatic behavior of various urban parks during hot and humid summer in the Mediterranean city of Tel Aviv, Israel. Int. J. Climatol 2006, 26, 1695–1711. [Google Scholar] [CrossRef]
- Shashua-Bar, L.; Pearlmutter, D.; Erell, E. The cooling efficiency of urban landscape strategies in a hot dry climate. Landsc. Urban. Plan 2009, 92, 179. [Google Scholar] [CrossRef]
- Yuan, F.; Bauer, M.E. Comparison of impervious surface area and normalized difference forest index as indicators of surface urban heat island effects in Landsat imagery. Remote. Sens. Environ. 2007, 106, 375–386. [Google Scholar] [CrossRef]
- Hamada, S.; Ohta, T. Seasonal variations in the cooling effect of urban green areas on surrounding urban areas. Urban. For. Urban. Gree. 2010, 9, 15–24. [Google Scholar] [CrossRef]
- Zhang, X.L.; Zhang, S.W. Study on the relationship between urban thermal environment effect and land use type and pattern in Changchun city. Resour. Sci. 2008, 30, 1007–7588. (in Chinese). [Google Scholar]
- Nowak, D.J.; Crane, D.E.; Stevens, J.C.; Hoehn, R.E. The Urban Forest Effects (UFORE) Model: Field Data Collection Manual; US Department of Agriculture Forest Service, Northeastern Research Station: Syracuse, NY, USA, 2003; pp. 4–11. [Google Scholar]
- Qin, Z.H.; Karnieli, A.; Berliner, P. A mono-window algrithm for retrieving land surface temperature from Landsat TM data and its application to the Israel-Egypt border region. Int. J. Remote. Sens. 2001, 18, 3719–3746. [Google Scholar]
- Xu, L.; Yue, W. A study on thermal environment effect of urban park landscape. Acta Ecol. Sinica 2008, 4, 1702–1710. (in Chinese). [Google Scholar]
- Bowler, D.E.; Buyung-Ali, L.; Knight, T.M.; Pullin, A.S. Urban greening to cool towns and cities: A systematic review of the empirical evidence. Landsc. Urban. Plan 2010, 97, 147–155. [Google Scholar] [CrossRef]
- Shashua-Bar, L.; Hoffman, M.E. The Green CTTC model for predicting the air temperature in small urban wooded sites. Build. Environ. 2002, 37, 1279–1288. [Google Scholar] [CrossRef]
- Lin, B.-S.; Lin, Y.-J. Cooling effect of shade trees with different characteristics in a subtropical urban park. Hortscience 2010, 45, 83–86. [Google Scholar]
- Oliveira, S.; Andrade, H.; Vaz, T. The cooling effect of green spaces as a contribution to the mitigation of urban heat: A case study in Lisbon. Build. Environ. 2011, 46, 2186–2194. [Google Scholar] [CrossRef]
- Xu, L.; Yue, W. A study on thermal environment effect of urban park landscape. Acta Ecol. Sinica 2008, 28, 1702–1710. [Google Scholar]
- Shashua-Bar, L.; Hoffman, M.E. Forest as climatic component in the design of an urban street-An empirical model for predicting the cooling effect of urban green areas with trees. Energ. Buildings 2000, 31, 221–235. [Google Scholar] [CrossRef]
- Shashua-Bar, L.; Potchter, O.; Bitan, A.; Boltansky, D.; Yaakov, Y. Microclimate modelling of street tree species effects within the varied urban morphology in the Mediterranean city of Tel Aviv, Israel. Int. J. Climatol. 2010, 30, 44–57. [Google Scholar]
- Buyantuyev, A.; Wu, J. Urban heat islands and landscape heterogeneity: Linking spatiotemporal variations in surface temperatures to land-cover and socioeconomic patterns. Landscape. Ecol. 2010, 25, 17–33. [Google Scholar] [CrossRef]
- Spronken-Smith, R.A.; Oke, T.R. Scale modeling of nocturnal cooling in urban parks. Bound-Layer Meteorol. 1999, 93, 287–312. [Google Scholar] [CrossRef]
- Cohen, P.; Potchter, O.; Matzarakis, A. Daily and seasonal climatic conditions of green urban open spaces in the Mediterranean climate and their impact on human comfort. Build. Environ. 2012, 51, 285–295. [Google Scholar] [CrossRef]
- Shashua-Bar, L.; Pearlmutter, D.; Erell, E. The influence of trees and grass on outdoor thermal comfort in a hot-arid environment. Int. J. Climatol. 2011, 31, 1498–1506. [Google Scholar] [CrossRef]
- Lee, S.-H.; Lee, K.-S.; Jin, W.-C.; Song, H.-K. Effect of an urban park on air temperature differences in a central business district area. Landscape. Ecol. Eng. 2009, 5, 183–191. [Google Scholar] [CrossRef]
- Linden, J. Nocturnal cool island in the Sahelian city of Ouagadougou, Burkina Faso. Int. J. Climatol. 2010, 31, 605–620. [Google Scholar] [CrossRef]
- Imhoff, M.L.; Zhang, P.; Wolfe, R.E.; Bounoua, L. Remote sensing of the urban heat island effect across biomes in the continental USA. Remote. Sens. Environ. 2010, 114, 504–513. [Google Scholar] [CrossRef]
- Hart, M.A.; Sailor, D.J. Quantifying the influence of land-use and surface characteristics on spatial variability in the urban heat island. Theor. Appl. Climatol. 2008, 95, 397–406. [Google Scholar] [CrossRef]
- Givoni, B. Climate Considerations in Building and Urban Design; John Wiley & Sons, Inc.: New York, NY, USA, 1998; pp. 275–286. [Google Scholar]
© 2013 by the authors; licensee MDPI, Basel, Switzerland. This article is an open access article distributed under the terms and conditions of the Creative Commons Attribution license (http://creativecommons.org/licenses/by/3.0/).
Share and Cite
Ren, Z.; He, X.; Zheng, H.; Zhang, D.; Yu, X.; Shen, G.; Guo, R. Estimation of the Relationship between Urban Park Characteristics and Park Cool Island Intensity by Remote Sensing Data and Field Measurement. Forests 2013, 4, 868-886. https://doi.org/10.3390/f4040868
Ren Z, He X, Zheng H, Zhang D, Yu X, Shen G, Guo R. Estimation of the Relationship between Urban Park Characteristics and Park Cool Island Intensity by Remote Sensing Data and Field Measurement. Forests. 2013; 4(4):868-886. https://doi.org/10.3390/f4040868
Chicago/Turabian StyleRen, Zhibin, Xingyuan He, Haifeng Zheng, Dan Zhang, Xingyang Yu, Guoqiang Shen, and Ruichao Guo. 2013. "Estimation of the Relationship between Urban Park Characteristics and Park Cool Island Intensity by Remote Sensing Data and Field Measurement" Forests 4, no. 4: 868-886. https://doi.org/10.3390/f4040868