1. Introduction
European and national policies promote the production and use of renewable energies to support climate change mitigation. Energy from woody biomass is considered a crucial component within the set of possible renewable energies [
1]. Expansion of short rotation coppice plantations (SRC) on agricultural land was proposed as one approach to increase biomass production [
1,
2], but for a number of reasons, this production system is currently not attractive to farmers in central Europe [
3], and the competition with food production is in many situations not desirable [
4,
5]. Therefore, it has been suggested to intensify the provision of woody biomass from forests [
5]. This may take place in conventional forest stands through increased removals or on areas specifically dedicated to increased biomass production.
Fast growing tree species suitable for rapid biomass production require large open areas, which are typically avoided in close-to-nature oriented forest management of central Europe [
6]. However, storms, droughts, or pest insect outbreaks increasingly often result in large scale forest disturbance [
7,
8]. Large open areas created by these disturbances require restoration with site adapted tree species [
9] and at the same time might be used to cultivate a crop of fast growing tree species to produce additional biomass [
10,
11].
Nurse crop (NC) systems can be one way to combine these restoration and production goals. They comprise a temporal nurse crop overstorey of fast growing, early successional tree species, as well as an understory of shade-tolerant target tree species, which is typically established after the sheltering canopy of the nurse crop has developed [
11,
12,
13]. Nurse crops are particularly useful in places, where large forest gaps are prone to extreme temperature and moisture regimes [
14] to moderate micro-climatic conditions and thus facilitate the establishment and growth of more sensitive target tree species [
15,
16,
17]. Once the nurse crop understorey trees have successfully established the biomass of the overstorey nurse crop trees may be harvested to release the target tree species from the competition of the overstorey.
Nurse crop management, biomass utilisation, and especially carbon sequestration estimates and nutrient sustainability considerations in forests require reliable information on the biomass storage and its distribution across various biomass compartments in trees [
18,
19,
20]. For this purpose numerous yield tables and allometric biomass equations have been developed for commercially important tree species [
21,
22,
23,
24,
25,
26].
However, yield tables and biomass allometries of early successional tree species such as
Populus ssp. or
Betula ssp., typical overstorey species in nurse crop stands, are few for Central Europe. Most of the studies dealing with
Populus ssp. or
Betula ssp. have been conducted in Canada, Finland, Sweden, or the USA owing to their commercial importance in these countries. The use and extrapolation of such allometric biomass equations from these situations to nurse crop systems in central Europe was questionable owing to differences in silvicultural treatments, genetics, or site conditions [
27,
28,
29]. In addition, these studies from other regions focussed mostly on young forest stands aged between 3 to 10 years, with diameters at breast height between 1 to 10 cm, and stand densities around 10,000 stems per hectare. In contrast, the nurse crops assessed in this study were 19 years old, their diameters at breast height ranged between 10 and 30 cm, and the stand density was about 500 to 600 trees per hectare.
Trees in dense forests are exposed to intensive competition for light and other resources and thus typically allocate a high proportion of carbon to height growth to reach the top of the canopy [
30]. In contrast and regardless of their height, trees in widely spaced forests have nearly unrestricted access to solar radiation, and thus allocate a larger proportion of carbon to the lateral development of branches and to radial stem growth [
31,
32]. Thus, allometric relationships reflect the adaptation of tree individuals to their environment [
19]. As a consequence, one might expect the single tree stem biomass to be overestimated but branch biomass to be underestimated in widely spaced trees when applying allometric biomass equations developed for forests of higher stand density. Because branch biomass is usually rich in nutrients, its underestimation directly results in the underestimation of nutrient losses per unit exported biomass [
33]. Hence, it is unclear how accurate existing allometric biomass equations from high density forests can estimate tree biomass in low density forests such as nurse crops.
Therefore, the objective of this study was to assess whether prediction of biomass for widely spaced trees typically found in nurse crops requires different allometric biomass equations from those provided in the literature.
We used a wide range of data from the literature to study this density effect in particular on the height-to-diameter ratio (h/d ratio) [
27,
34] and the proportion of branch biomass [
32] of
Betula ssp. (birch) and
Populus ssp. (aspen) trees, which often dominate young forests following disturbance [
35] or abandoning of agricultural land management [
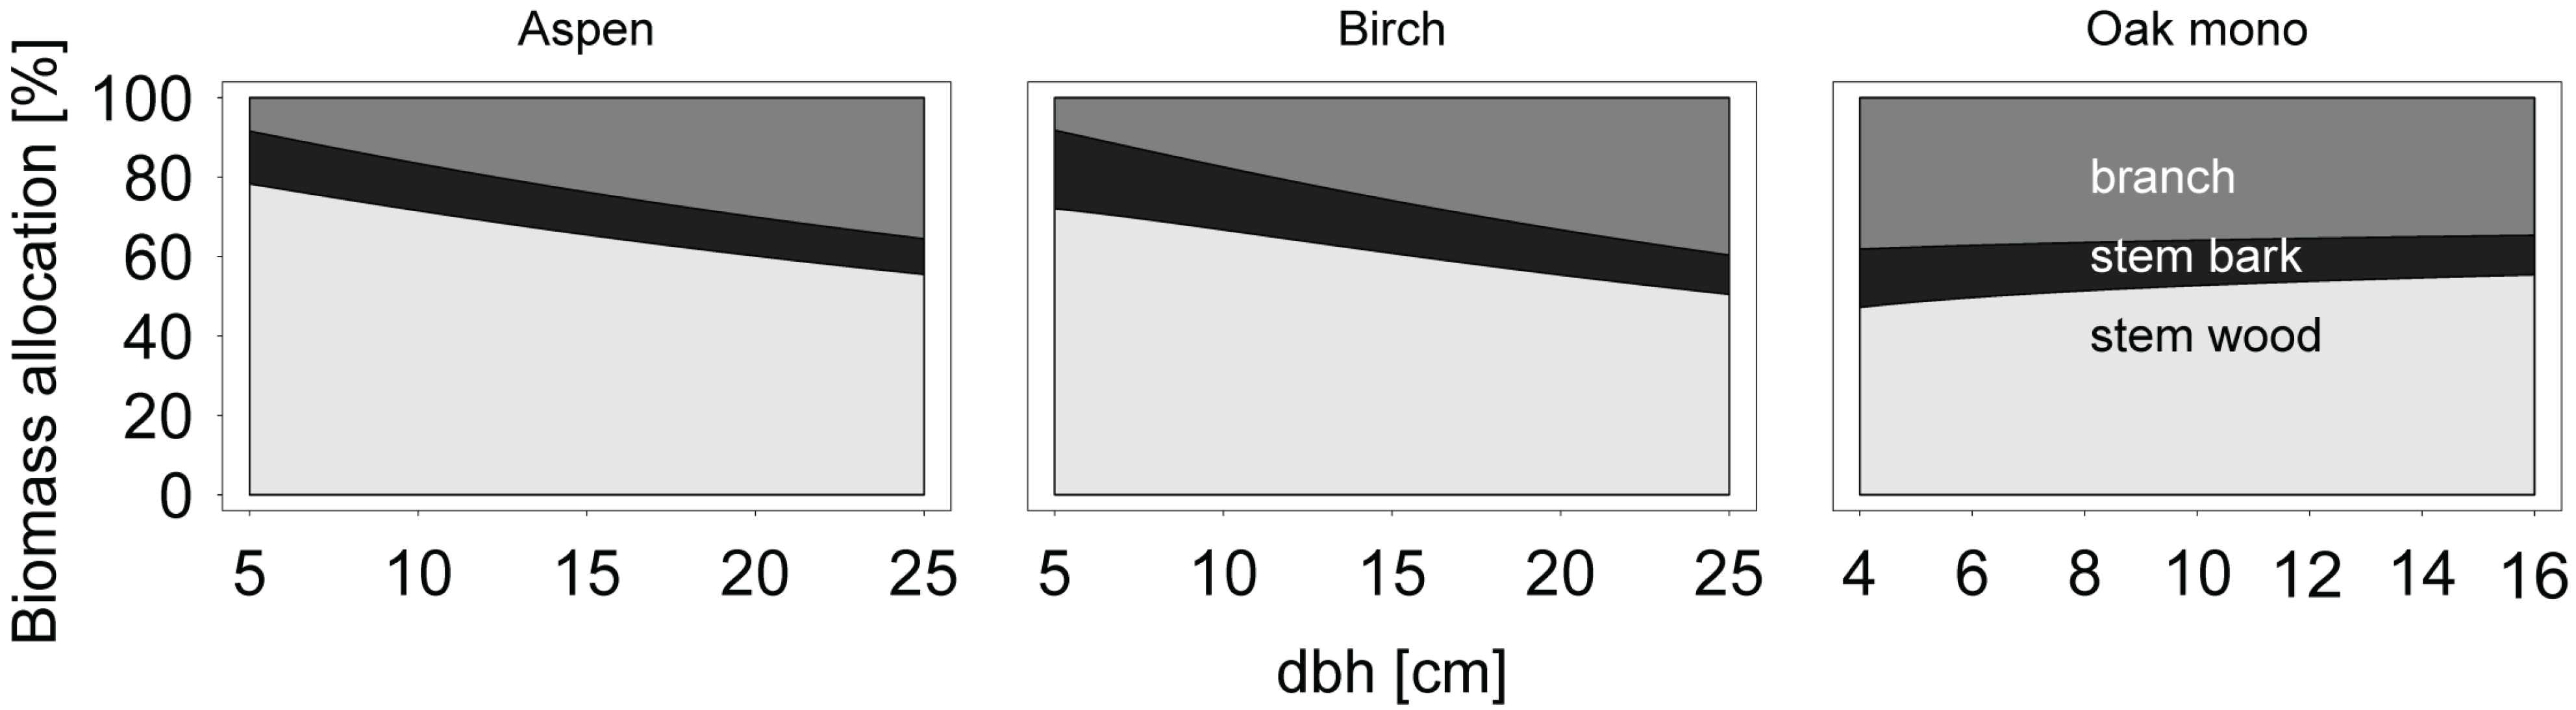
36]. We then developed allometric biomass equations for aspen and birch trees growing in widely spaced nurse crops. We fitted different equations to the four biomass compartments total aboveground woody biomass, stem wood, stem bark, and branches. We also developed allometric biomass equations for young
Quercus ssp. trees growing in the understory of nurse crops. Eventually, we tested the precision of allometric biomass equations from the literature when applied to our sample trees from widely spaced nurse crops. Hence, this paper is the first of its kind to provide the required information for future biomass production and sustainability assessment in low density nurse crops.
2. Materials and Methods
2.1. Study Area and Forests
The nurse crop systems analysed in this study were established in 1991 following large scale wind-throw of pure stands of Norway spruce (
Picea abies (L.) Karst.) [
13]. Originally, the trial intended to examine the effects of nurse crops on the establishment, survival, and quality of target tree species at frost-prone sites. To allow for the comparison between nurse crop systems and traditional restoration methods, control plots were established and directly replanted with pure stands of the target tree species, in this case
Quercus ssp.
The present study focussed on the two sites Kirchberg (K) and Sobernheim (S). The sites were located approximately 50 kilometres apart from each other at 450 and 420m a.s.l., respectively, within the Hunsrück mountain region in the German federal state of Rhineland-Palatinate.
Mean annual air temperatures (1988 until 2011) were 8.1 °C in Kirchberg and 9.0 °C in Sobernheim with a mean air temperature during the vegetation season (daily average temperature >5 °C) of 12.4 and 13.0 °C in Kirchberg and Sobernheim, respectively. Mean annual precipitation (2002 until 2011) was 836.5mm in Kirchberg and 613.8mm in Sobernheim, with 66% and 69% of the annual precipitation occurring during the vegetation season, respectively [
37] (data unpublished).
Both sites were characterised by periodically water logged soils identified as Pseudogley in Kirchberg and Cambisol-Pseudogley in Sobernheim. Mean soil acidity (pH) was 3.8 and 3.6, mean cation exchange capacity (CEC) was 71.4 and 68.2 μmol-c/g, and mean base cation saturation was 14.3% and 17.0% in Kirchberg and Sobernheim, respectively.
The nurse crop experiments comprised in the overstorey pure plots of hybrid aspen (
Populus tremula L. ×
Populus tremuloides Michx. “Astria”) and hybrid birch (
Betula pendula Roth ×
Betula pubescens Ehrh.) in Kirchberg and pure plots of hybrid aspen and common birch (
Betula pendula Roth) in Sobernheim. These treatments will be referred to in the following simply as aspen and birch regardless of the specific species or hybrid. The understoreys of nurse crop plots as well as the control plots were established with
Quercus robur L. in Kirchberg and
Quercus petraea (Mattuschka) Liebl. on better drained soils in Sobernheim [
38]. If necessary, possible effects that hybridization may have on tree height or diameter at breast height were analysed and accounted for within the modelling process. Any trees from the
Quercus ssp. sections were called “oak”; if necessary, we differentiated between “oak mono” representing the control plots and ‘oak under nurse crops’ representing oak planted under a nurse crop shelter.
At each of the two study sites, two plots of aspen and two sample plots of birch nurse crop system, as well as four plots of oak monoculture were installed; a total of 16 plots. Aspen and birch nurse crops were underplanted with oak in 1996. Plots were of quadratic shape with a side length of 25m for aspen and 50m for birch nurse crop systems and 25 or 50m for oak monocultures.
At establishment, seedlings of aspen and birch were 2 years old and planted at a spacing of 4 × 4m. Understorey oak seedlings were 5 and 3 years old and planted at 4 × 1.5m and 4 × 1m spacing in Sobernheim and Kirchberg, respectively; planting rows were parallel to nurse crop rows and offset by 2m. Monoculture oak stands were planted in two ways: five out of eight stands were established using 2 year old standard seedlings with a plant spacing of 1.5 × 0.7 m, and three stands were established using larger seedlings with a 2 × 1m spacing (Kirchberg 3 years; Sobernheim 5 years). However, we found (results not shown) that these two different spacings had no significant effect on yield and allocation of biomass at the time of sampling.
Hence, we compared only oak monocultures with 10,000 seedlings per hectare with plantings of oak (2500 seedlings per ha) beneath a nurse crop of 650 trees per hectare.
2.2. Biomass Sampling
Diameter at breast height (dbh) was measured for all aspen and birch trees as well as for all oak trees growing on a diagonal plot transect of 2m width. At each plot, five aspen, birch, or oak trees were destructively sampled. In addition to recording diameter at breast height and height of those trees, stem discs were extracted at 2m intervals for aspen and birch. The length of oak stems with a diameter larger than 4 cm was divided by six and stem discs were extract at these relative intervals. Three branches were sampled from the lower, middle, and upper crown sections, respectively.
For each sample tree, the fresh weight was recorded for all branches, stem sections, and discs. For stem discs, fresh weight was recorded separately for wood and bark. Stem bark and sample branches were then chipped for further treatment. Finally, all samples were oven dried at 40 °C until weight constancy.
We used the mean stem wood-to-stem bark ratio, which was calculated from our fresh sample discs, to calculate the wood and bark biomass of the respective tree section. We then used a mean dry-to-fresh weight ratio to calculate the dry weight of all tree components.
For oaks growing in the understorey of nurse crops, only the total aboveground woody biomass was measured.
2.3. Supportive Information from the Literature
To test for the effect of stand density on allometric relationships in aspen and birch, we studied the effect of stand density on the tree height-to-diameter ratio and the allocation of branch biomass. Additionally, we studied the performance of published allometric biomass equations developed for stands of higher density (>650 N/ha) when applied to our sample trees.
For that purpose we compiled stand level data and allometric biomass equations from the literature. We searched the internet for publications using the key words “Populus ssp.”, “Betula ssp.”, “Quercus ssp.”, “aspen”, “birch”, “oak”, “tree height”, “dbh”, “stand density”, “tree allometry”, “dry weight”, “biomass equation”, “biomass”, “aboveground”, “biomass compartments”, “biomass production”, and various combinations of several words, respectively.
From each publication we collected information on stand age, mean tree height, mean diameter at breast height, stand density, study location, allometric biomass equations, respective parameters, and correction factors.
Some publications report detailed information for each replicate stand analysed, whereas only summary results can be found in others. In total, 58 allometric biomass equations developed for trees in Canada, China, Estonia, Finland, Germany, USA, and Sweden were consulted (
Table 1). This literature review may not be complete, but we obtained a sufficient number of studies to analyse general trends related to our research question in a global context.
Table 1.
Allometric biomass equations and parameters (a, b, c) compiled from the literature as used in this study.
Table 1.
Allometric biomass equations and parameters (a, b, c) compiled from the literature as used in this study.
| Publication | Compartment | Species | Allometric equation | a | b | c |
|---|
| André (2010) et al. [39] | TotalAboveground | Q. petraea | | 0.009 | 2.428 | n.a. |
| Fatemi (2011) et al. [40] | TotalAboveground | B. papyrifera | | 1.99 | 2.538 | n.a. |
| Fatemi (2011) et al. [40] | StemWood | B. papyrifera | | 1.739 | 2.638 | n.a. |
| Fatemi (2011) et al. [40] | StemBark | B. papyrifera | | 0.823 | 2.711 | n.a. |
| Fatemi (2011) et al. [40] | Branch | B. papyrifera | | 1.476 | 2.195 | n.a. |
| Fatemi (2011) et al. [40] | Leaves | B. papyrifera | | 0.622 | 2.485 | n.a. |
| Grote (2003) et al. [22] | TotalAboveground | Q. petraea | | 0.131 | 1.316 | n.a. |
| Johansson (1999) [41] | TotalAboveground | P. tremula | | 0.000146 | 2.604 | n.a. |
| Johansson (1999) [41] | Stem | P. tremula | | 0.000065 | 2.74 | n.a. |
| Johansson (1999) [41] | Branch | P. tremula | | 0.000515 | 1.873 | n.a. |
| Johansson (1999) [41] | Leaves | P. tremula | | 0.000847 | 1.416 | n.a. |
| Johansson & Karačić (2011) [42] | TotalAboveground | P. nigra × P. doltoides | | 0.00028 | 2.459 | n.a. |
| Johansson & Karačić (2011) [42] | Stem | P. nigra × P. doltoides | | 0.00021 | 2.462 | n.a. |
| Johansson & Karačić (2011) [42] | Branch | P. nigra × P. doltoides | | 0.00001 | 2.709 | n.a. |
| Johansson & Karačić (2011) [42] | Leaves | P. nigra × P. doltoides | | 0.00042 | 1.926 | n.a. |
| Johansson (1999) [43] | TotalAboveground | B. pendula | | 0.00087 | 2.286 | n.a. |
| Johansson (1999) [43] | Stem | B. pendula | | 0.0008 | 2.282 | n.a. |
| Johansson (1999) [43] | Branch | B. pendula | | 0.00002 | 2.63 | n.a. |
| Johansson (1999) [43] | Leaves | B. pendula | | 0.004 | 1.12 | n.a. |
| Johansson (1999) [43] | TotalAboveground | B. pubescens | | 0.00004 | 2.5 | n.a. |
| Johansson (1999) [43] | Branch | B. pubescens | | 0.00029 | 2.53 | n.a. |
| Johansson (1999) [43] | Leaves | B. pubescens | | 0.0009 | 1.477 | n.a. |
| Johansson (1999) [43] | Stem | B. pubescens | | 0.0002 | 2.543 | n.a. |
| Muukkonen (2007) [44] | TotalAboveground | Q. spp. | | −0.604 | 10.677 | 15.9 |
| Pastor et al. (1984) [45] | TotalAboveground | P. tremuloides | | 0.086 | 2.449 | n.a. |
| Pastor et al. (1984) [45] | Stem | P. tremuloides | | 0.07 | 2.423 | n.a. |
| Pastor et al. (1984) [45] | Branch | P. tremuloides | | 0.012 | 2.349 | n.a. |
| Rock (2007) [34] | Stem | P. tremula × P. tremuloides | | 0.0197 | 2.764 | n.a. |
| Rock (2007) [34] | Branch | P. tremula × P. tremuloides | | 0.064 | 2.001 | n.a. |
| Rock (2007) [34] | TotalAboveground | P. tremula × P. tremuloides | | 0.052 | 2.545 | n.a. |
| Ruark & Bockheim (1988) [46] | StemWood | P. tremoloides | | −3.202 | 2.606 | n.a. |
| Ruark & Bockheim (1988) [46] | StemBark | P. tremoloides | | −4.532 | 2.552 | n.a. |
| Ruark & Bockheim (1988) [46] | Branch | P. tremoloides | | −5.04 | 2.695 | n.a. |
| Ruark & Bockheim (1988) [46] | Twig | P. tremoloides | | −5.701 | 1.73 | n.a. |
| this study | TotalAboveground | P. tremula × P. tremuloides | | 0.021 | 2.084 | 0.936 |
| this study | StemWood | P. tremula × P. tremuloides | | 0.006 | 1.557 | 1.743 |
| this study | StemBark | P. tremula × P. tremuloides | | 0.007 | 1.763 | 0.818 |
| this study | Branch | P. tremula × P. tremuloides | | 0.015 | 3.301 | −0.684 |
| this study | TotalAboveground | B. pendula × B. pubscenes | | 0.019 | 1.944 | 1.154 |
| this study | StemWood | B. pendula × B. pubscenes | | 0.012 | 1.432 | 1.708 |
| this study | StemBark | B. pendula × B. pubscenes | | 0.098 | 2.088 | −0.486 |
| this study | Branch | B. pendula × B. pubscenes | | 0.001 | 2.862 | 0.779 |
| this study | TotalAboveground | Q. spp. | | 0.161 | 2.122 | 0.21 |
| Suchomel et al. (2012) [28] | TotalAboveground | Q. petraea | | 0.093 | 2.51 | n.a. |
| Telenius (1999) [47] | TotalAboveground | P. tremula × P. tremoloides | | −718.281 | 3.565 | 1.738 |
| Telenius (1999) [47] | TotalAboveground | B. pendula | | 32.317 | 0.329 | 2.328 |
| Tullus et al. (2009) [48] | TotalAboveground | P. tremula × P. tremuloides | | 107.719 | 2.237 | n.a. |
| Tullus et al. (2009) [48] | Stem | P. tremula × P. tremuloides | | 61.208 | 2.386 | n.a. |
| Tullus et al. (2009) [48] | Branch | P. tremula × P. tremuloides | | 23.374 | 2.161 | n.a. |
| Tullus et al. (2009) [48] | BranchNew | P. tremula × P. tremuloides | | 18.819 | 1.651 | n.a. |
| Uri et al. (2007) [36] | TotalAboveground | B. pendula | | 142.19 | 2.25 | n.a. |
| Uri et al. (2007) [36] | Stem | B. pendula | | 118.74 | 2.19 | n.a. |
| Uri et al. (2007) [36] | BranchOld | B. pendula | | 12.68 | 2.33 | n.a. |
| Uri et al. (2007) [36] | BranchNew | B. pendula | | 0.93 | 3.25 | n.a. |
| Uri et al. (2007) [36] | Leaves | B. pendula | | 7.54 | 2.58 | n.a. |
| Wang et al. (2002) [29] | StemWood | P. tremoloides | | 0.042 | 2.64 | n.a. |
| Wang et al. (2002) [29] | StemBark | P. tremoloides | | 0.003 | 3.033 | n.a. |
| Wang et al. (2002) [29] | Branch | P. tremoloides | | 0.001 | 3.161 | n.a. |
| Wang (2006) [49] | Stem | P. davidiana | | 1.836 | 2.471 | n.a. |
| Wang (2006) [49] | Branch | P. davidiana | | 0.129 | 3.224 | n.a. |
| Wang et al. (1996) [50] | StemWood | B. papyrifera | | 0.028 | 2.64 | n.a. |
| Wang et al. (1996) [50] | StemBark | B. papyrifera | | 0.037 | 2.164 | n.a. |
| Wang et al. (1996) [50] | Branch | B. papyrifera | | 0.002 | 2.913 | n.a. |
| Wang (2006) [49] | Stem | B. platyphylla | | 2.141 | 2.278 | n.a. |
| Wang (2006) [49] | Branch | B. platyphylla | | 0.952 | 2.783 | n.a. |
| Zabek & Prescott (2006) [51] | Stem | P. trichocarpa × P. deltoides | | 0.008 | 1.247 | 1.827 |
| Zabek & Prescott (2006) [51] | Branch | P. trichocarpa × P. deltoides | | 0.01 | 1.492 | 1.023 |
| Zell (2008) [52] | TotalAboveground | Q. spp. | | 0.121 | 2.435 | n.a. |
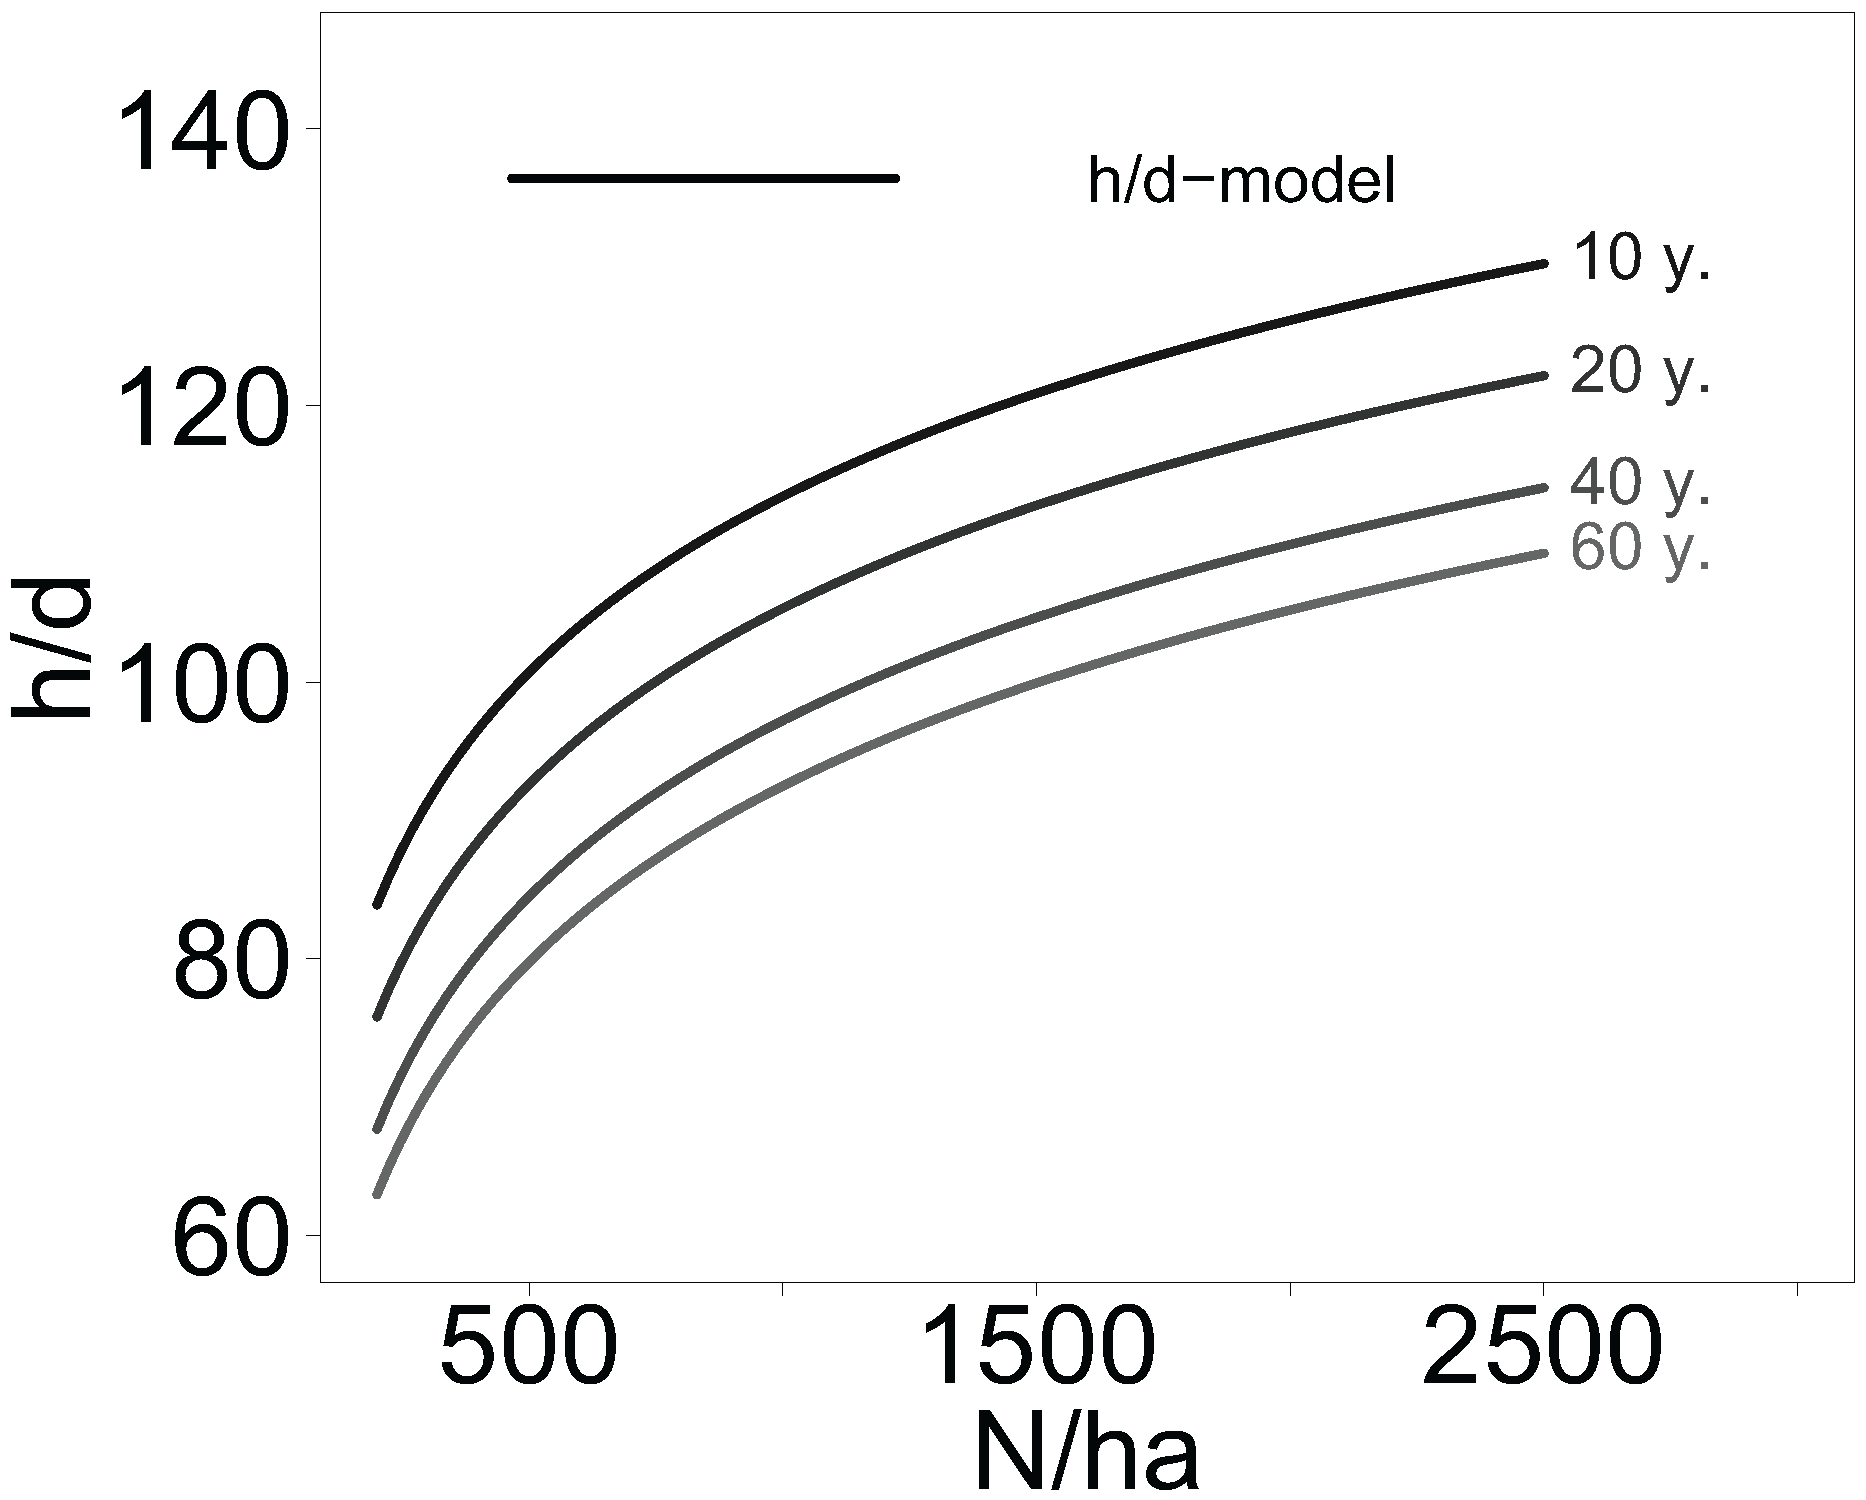
2.4. Stand Density Effects on Tree Height-to-Diameter Ratio in Aspen and Birch Stands
All information on mean tree height, diameter at breast height, age, and stand density of aspen and birch forests collected from the literature were compiled using a linear mixed-effects model to study the general effect of stand density on the height-to-diameter (h/d) ratio. Since data on stand density and age were skewed to the right, a log-transformation was applied. The defined two-level mixed-effects model was:
with
,
, and
.
was the mean tree height-to-diameter ratio for trees from sample stand
k from species
j from study
i at given
and
.
denoted the intercept,
was the parameter for density, and
the parameter for tree age.
was a random effect for tree species
i,
represented a random effect for study
j nested within species
, and
denoted the residual error.
During the model fitting process no significant fixed effect of the tree genus (aspen, birch) on the height-to-diameter ratio was found and thus it was not included in the model. The tree species effect could not be analysed, because there were too many different species or hybrids of Betula ssp. and Populus ssp. with only few replicates included in the literature based data set.
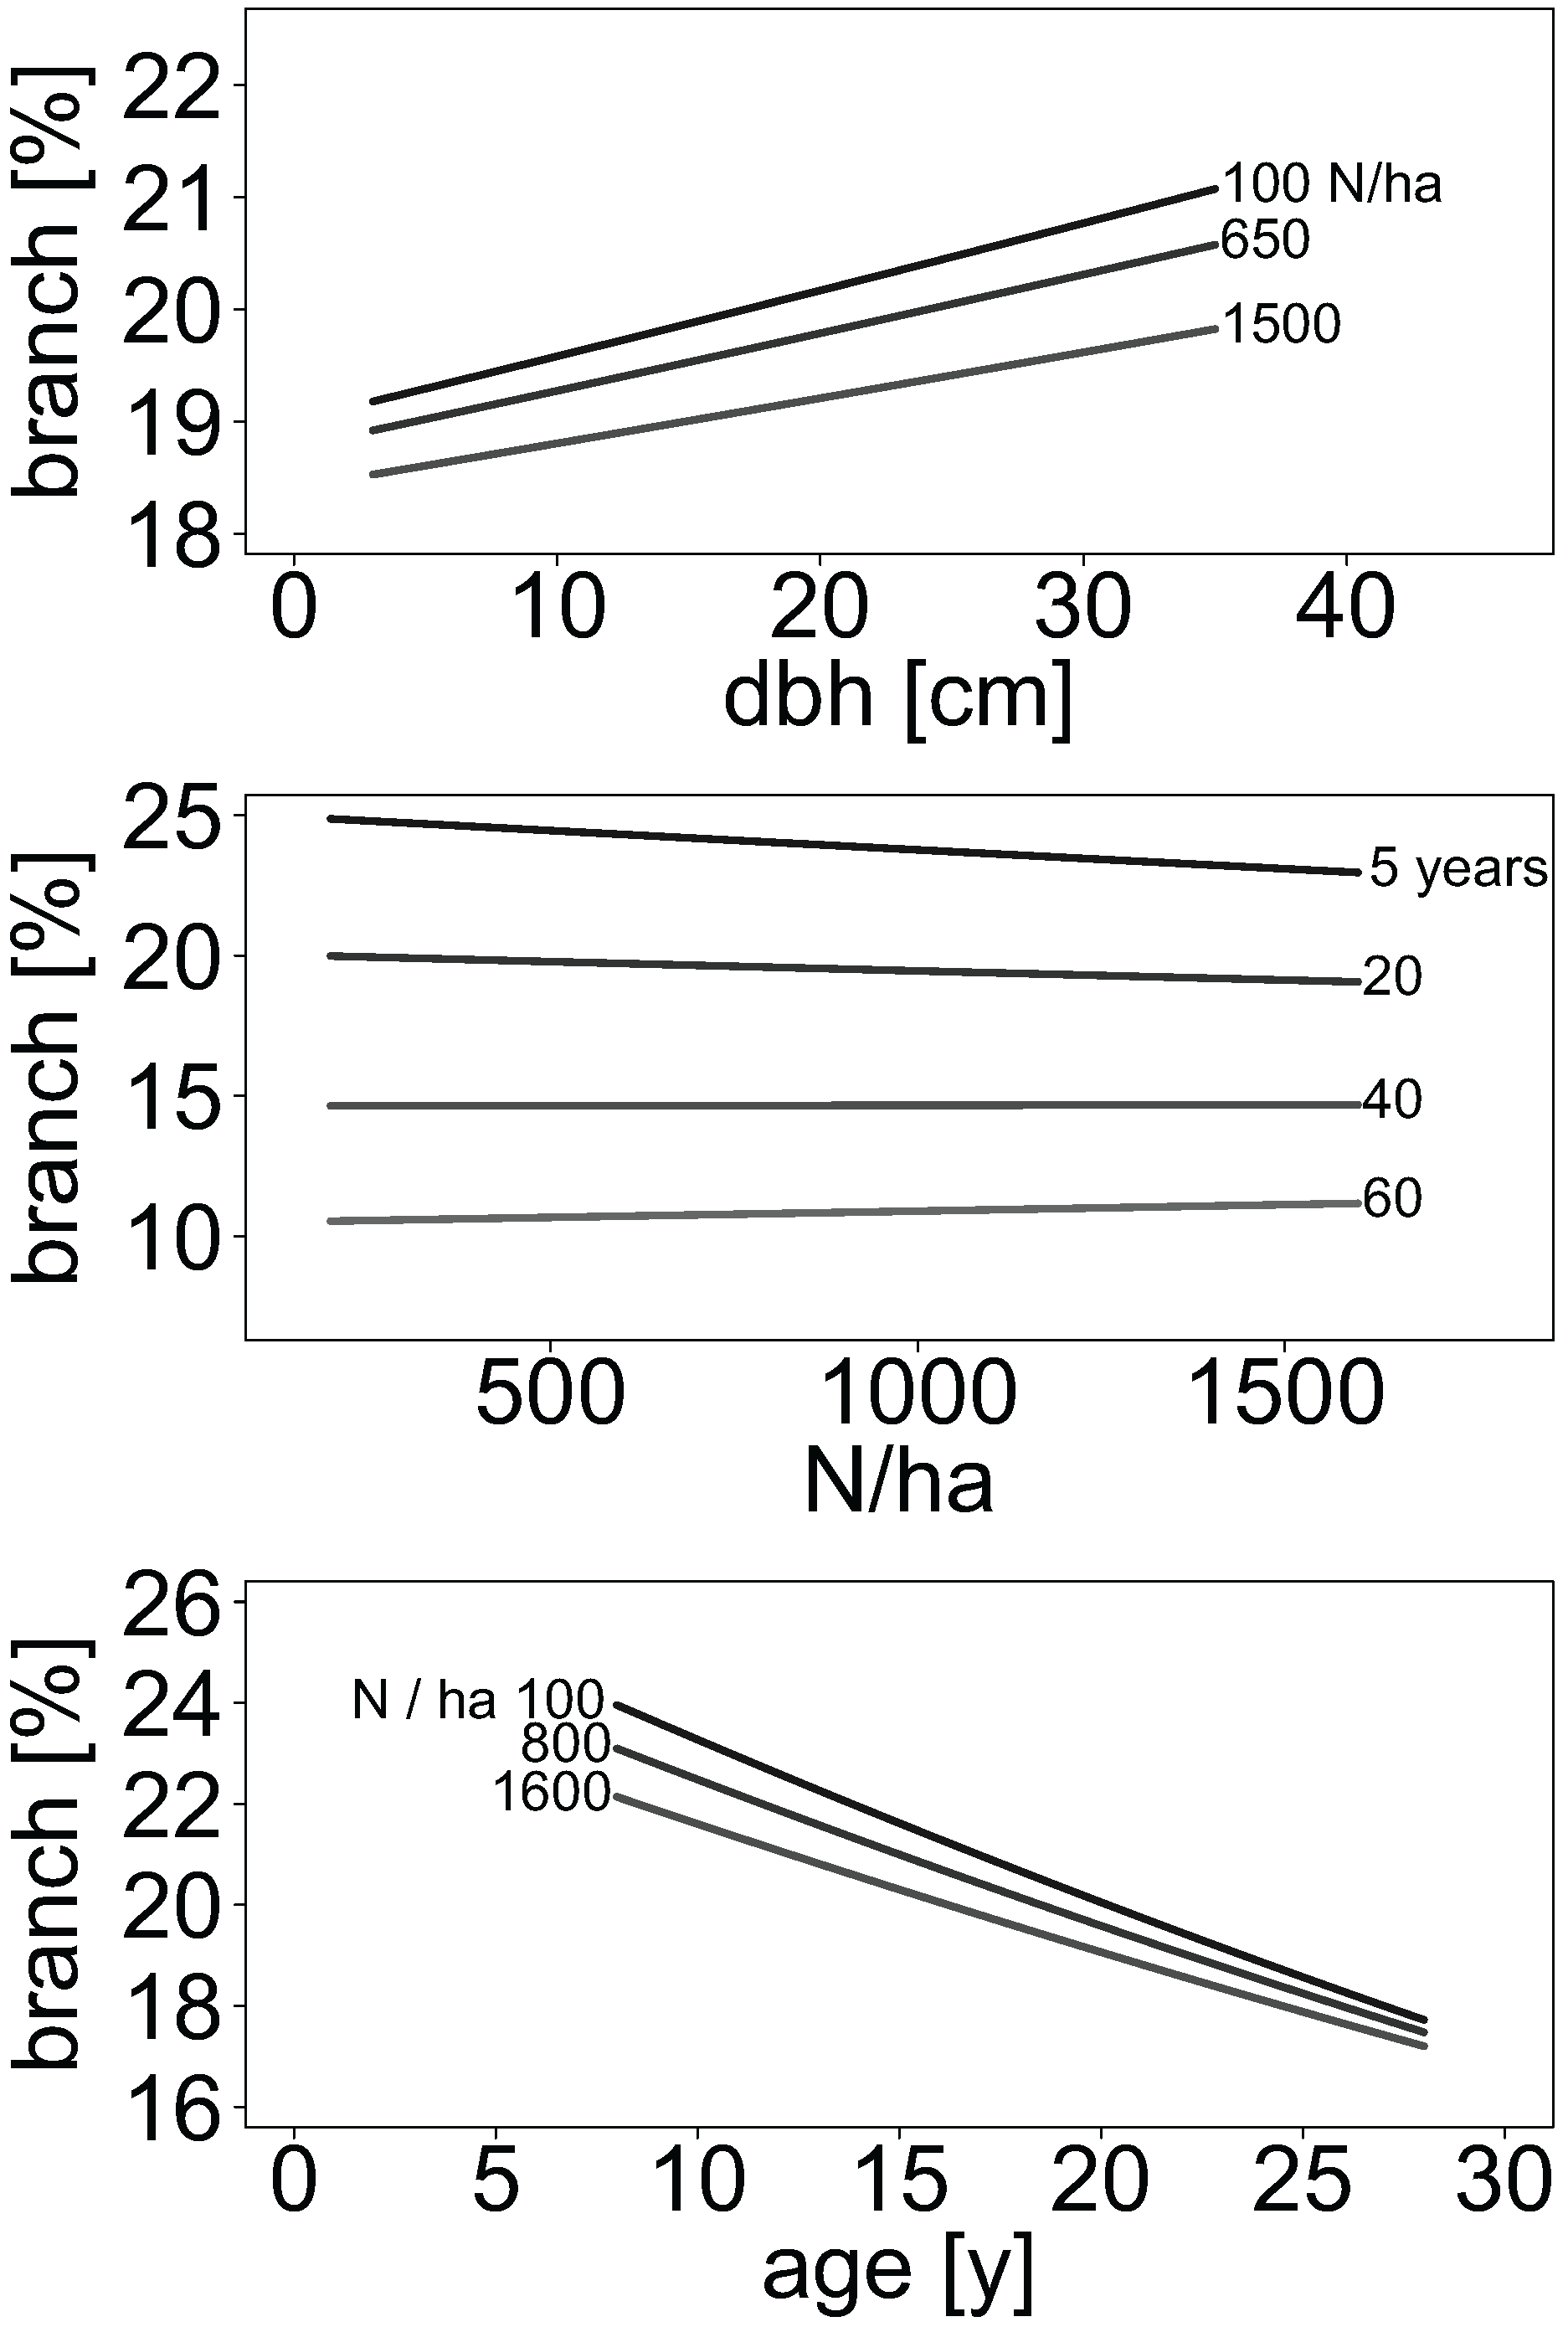
2.5. Stand Density Effects on Allocation of Branch Biomass in Aspen and Birch Stands
The proportion of branch biomass in relation to aboveground woody biomass was provided in some publications. For all other publications, we estimated branch biomass using the provided allometric biomass equations, respectively. For this, 100 values of diameter at breast height were randomly simulated from uniform distributions for each of 16 publications within their range of diameters, respectively.
For each simulated diameter at breast height, biomass of branches and of all other compartments were predicted. Compartment-wise biomass predictions were used to calculate the corresponding aboveground woody biomass for each simulated diameter at breast height. The biomass of leaves was not considered. One allometric biomass equation from the literature used tree height as an additional explanatory variable. In this case, height was predicted according to the mean height-to-diameter ratio ratio given in the publications.
For each prediction, we added a residuum simulated from variance estimates provided. The variance indication was first related to the mean biomass predicted for all trees in a study. The produced relative variance was then used to simulate one residuum from a uniform distribution for each tree of each study. For publications that did not specify any variance, we assumed a compartment-specific global relative variance generalised from all other publications that indicated variance. Hence, the assumed relative variance was 30%, 19%, 18%, and 25% of dry mass for branches, stems, stem wood, and stem bark, respectively. The proportion of branch biomass was calculated as the ratio between branch and total aboveground woody biomass.
We then fitted the mixed-effects logistic regression model:
where
was the proportion of branch biomass presented for the stand
,...,
in publication
,...,
n. The linear predictor was
and contained fixed effects parameters (
β), a random parameter
for the study, and
as residual error.
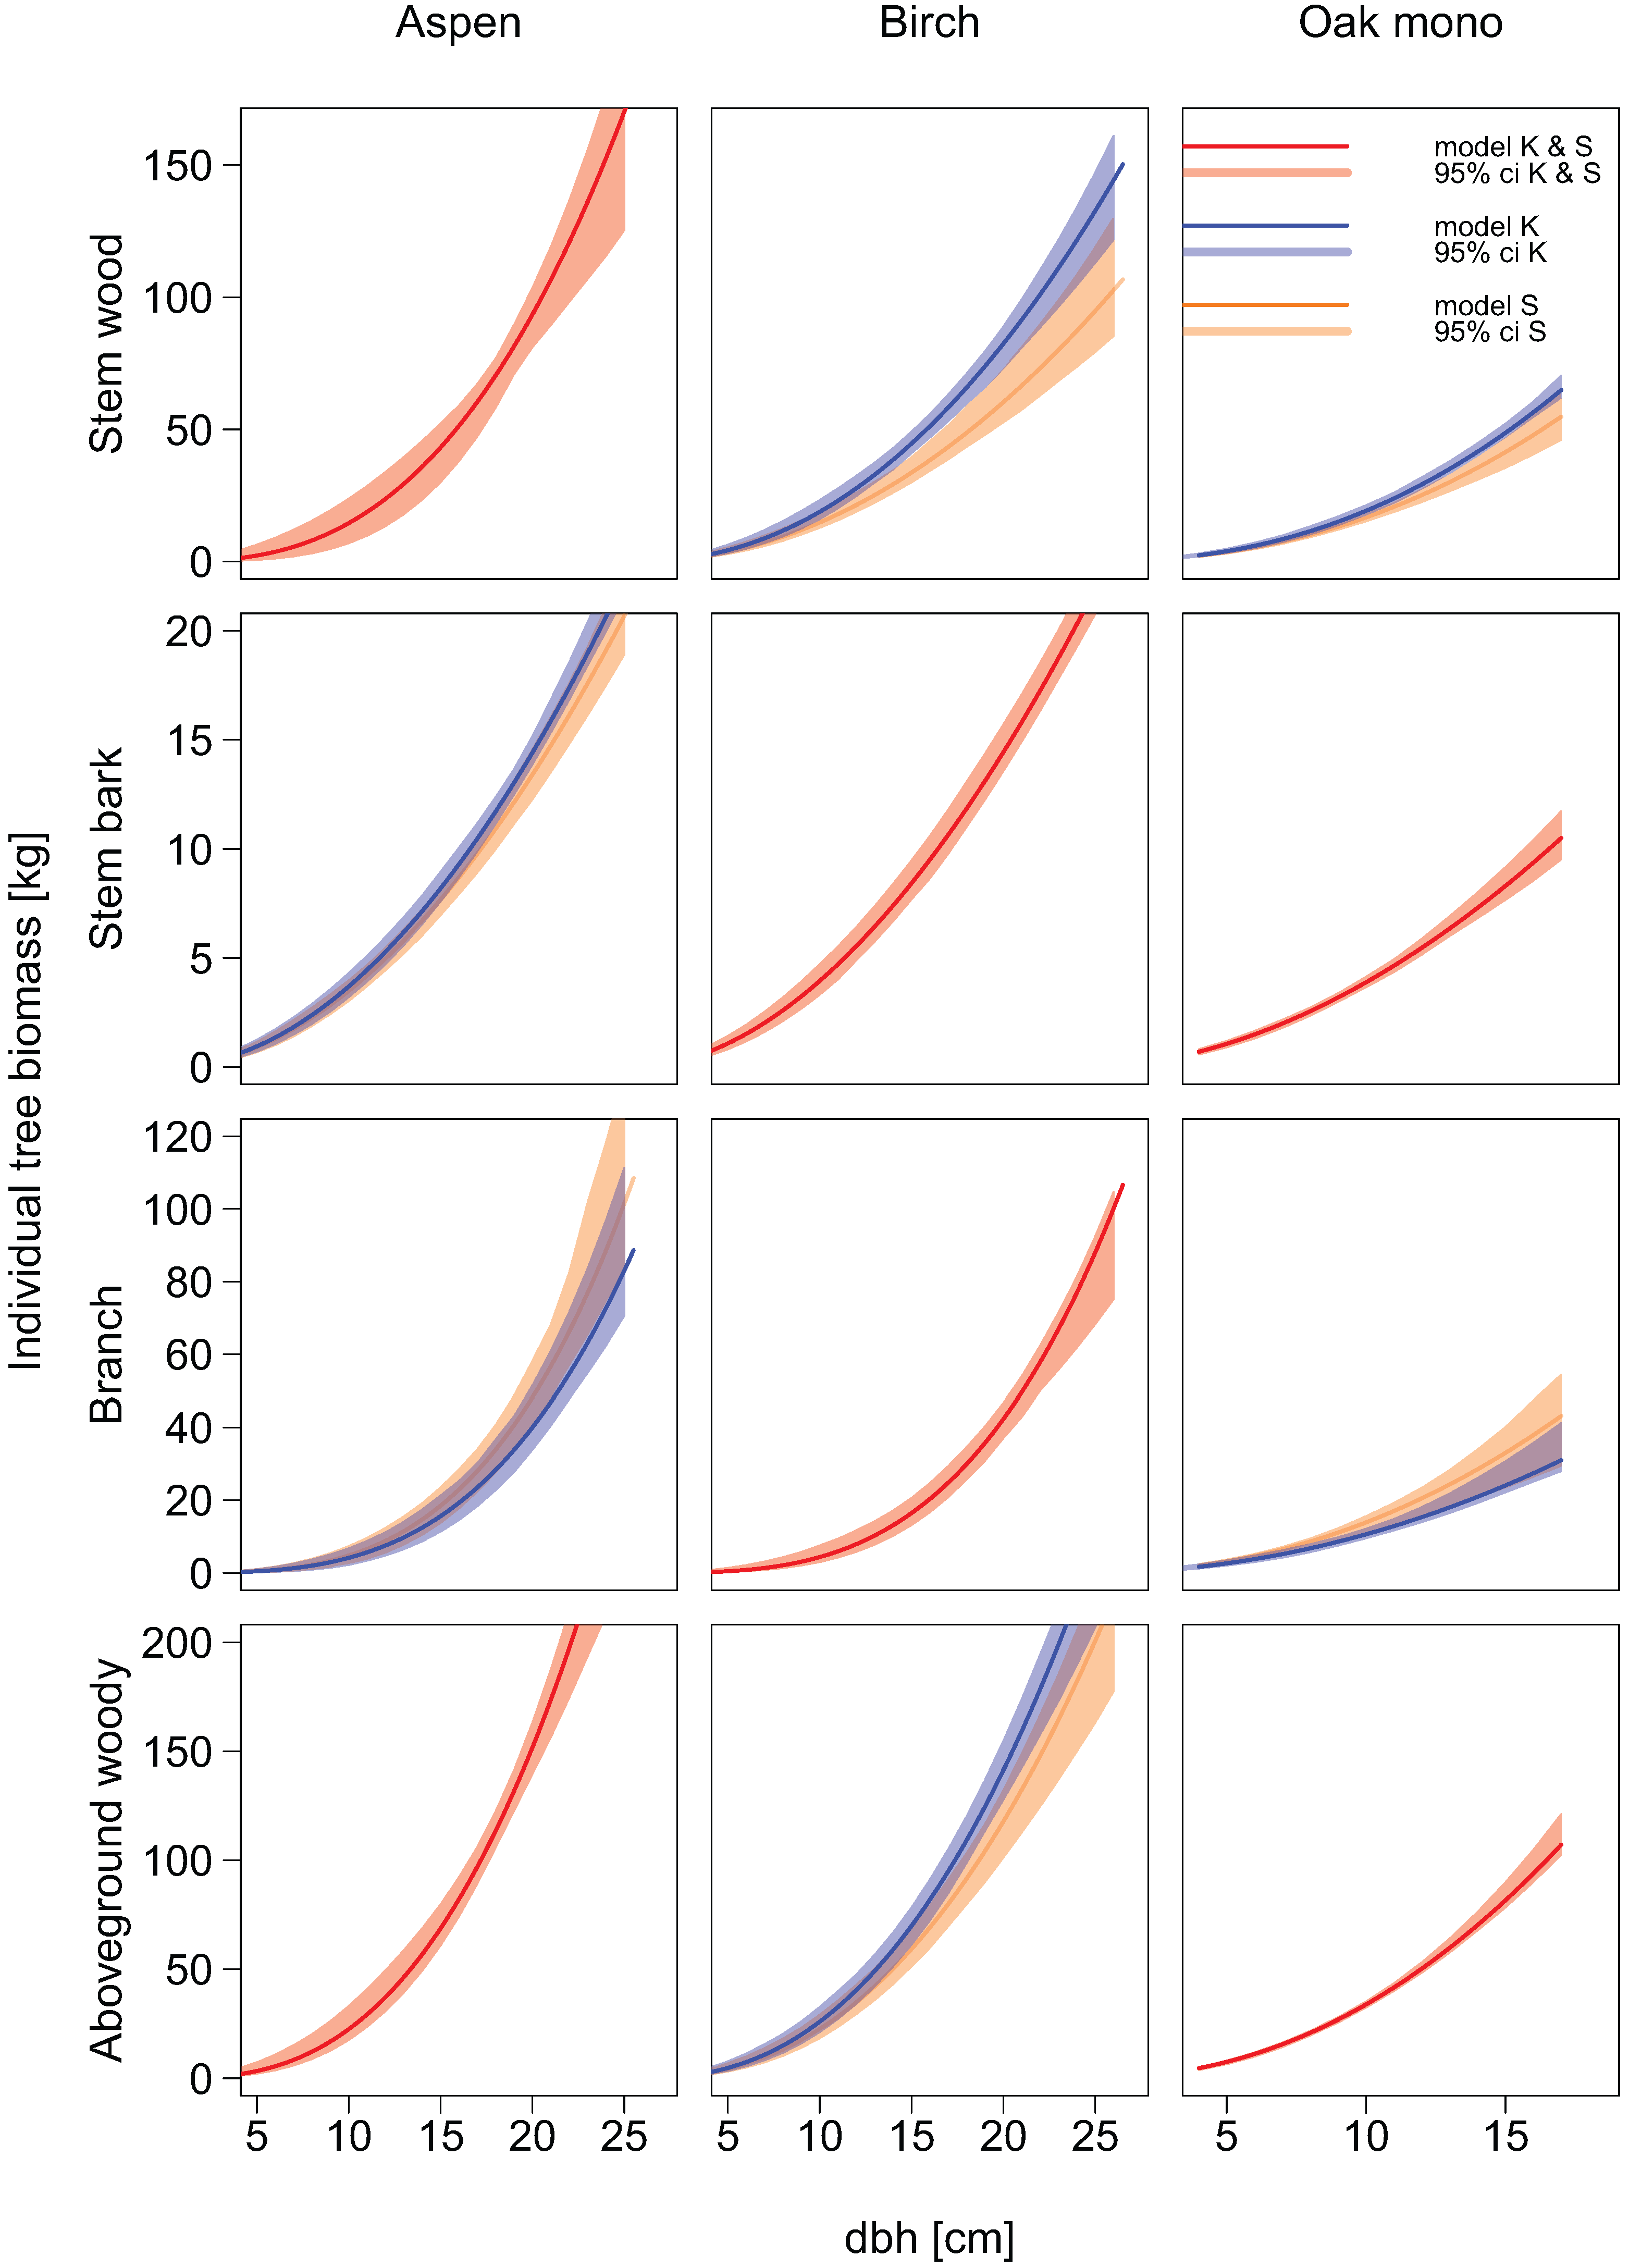
2.6. Allometric Biomass Equations
Compartment-specific dry mass data were used to fit new allometric biomass equations. Separate models were built for each tree species, individual biomass compartment, and total aboveground woody biomass. The allometric biomass equations were fitted using a non-linear regression least squares approach.
Two types of equations were fitted. In the first type, we used the diameter at breast height as sole explanatory variable (power function):
with
being the compartment specific single tree biomass in kilogram dependent on diameter at breast height (
) in centimetres.
was an offset parameter for the study site Kirchberg and was only included when significant at the 5% level. We used residual standard errors (ResSE) as well as the coefficient of determination (
, calculated as one minus residual sum of squares divided by total sum of squares) as a measure of fit.
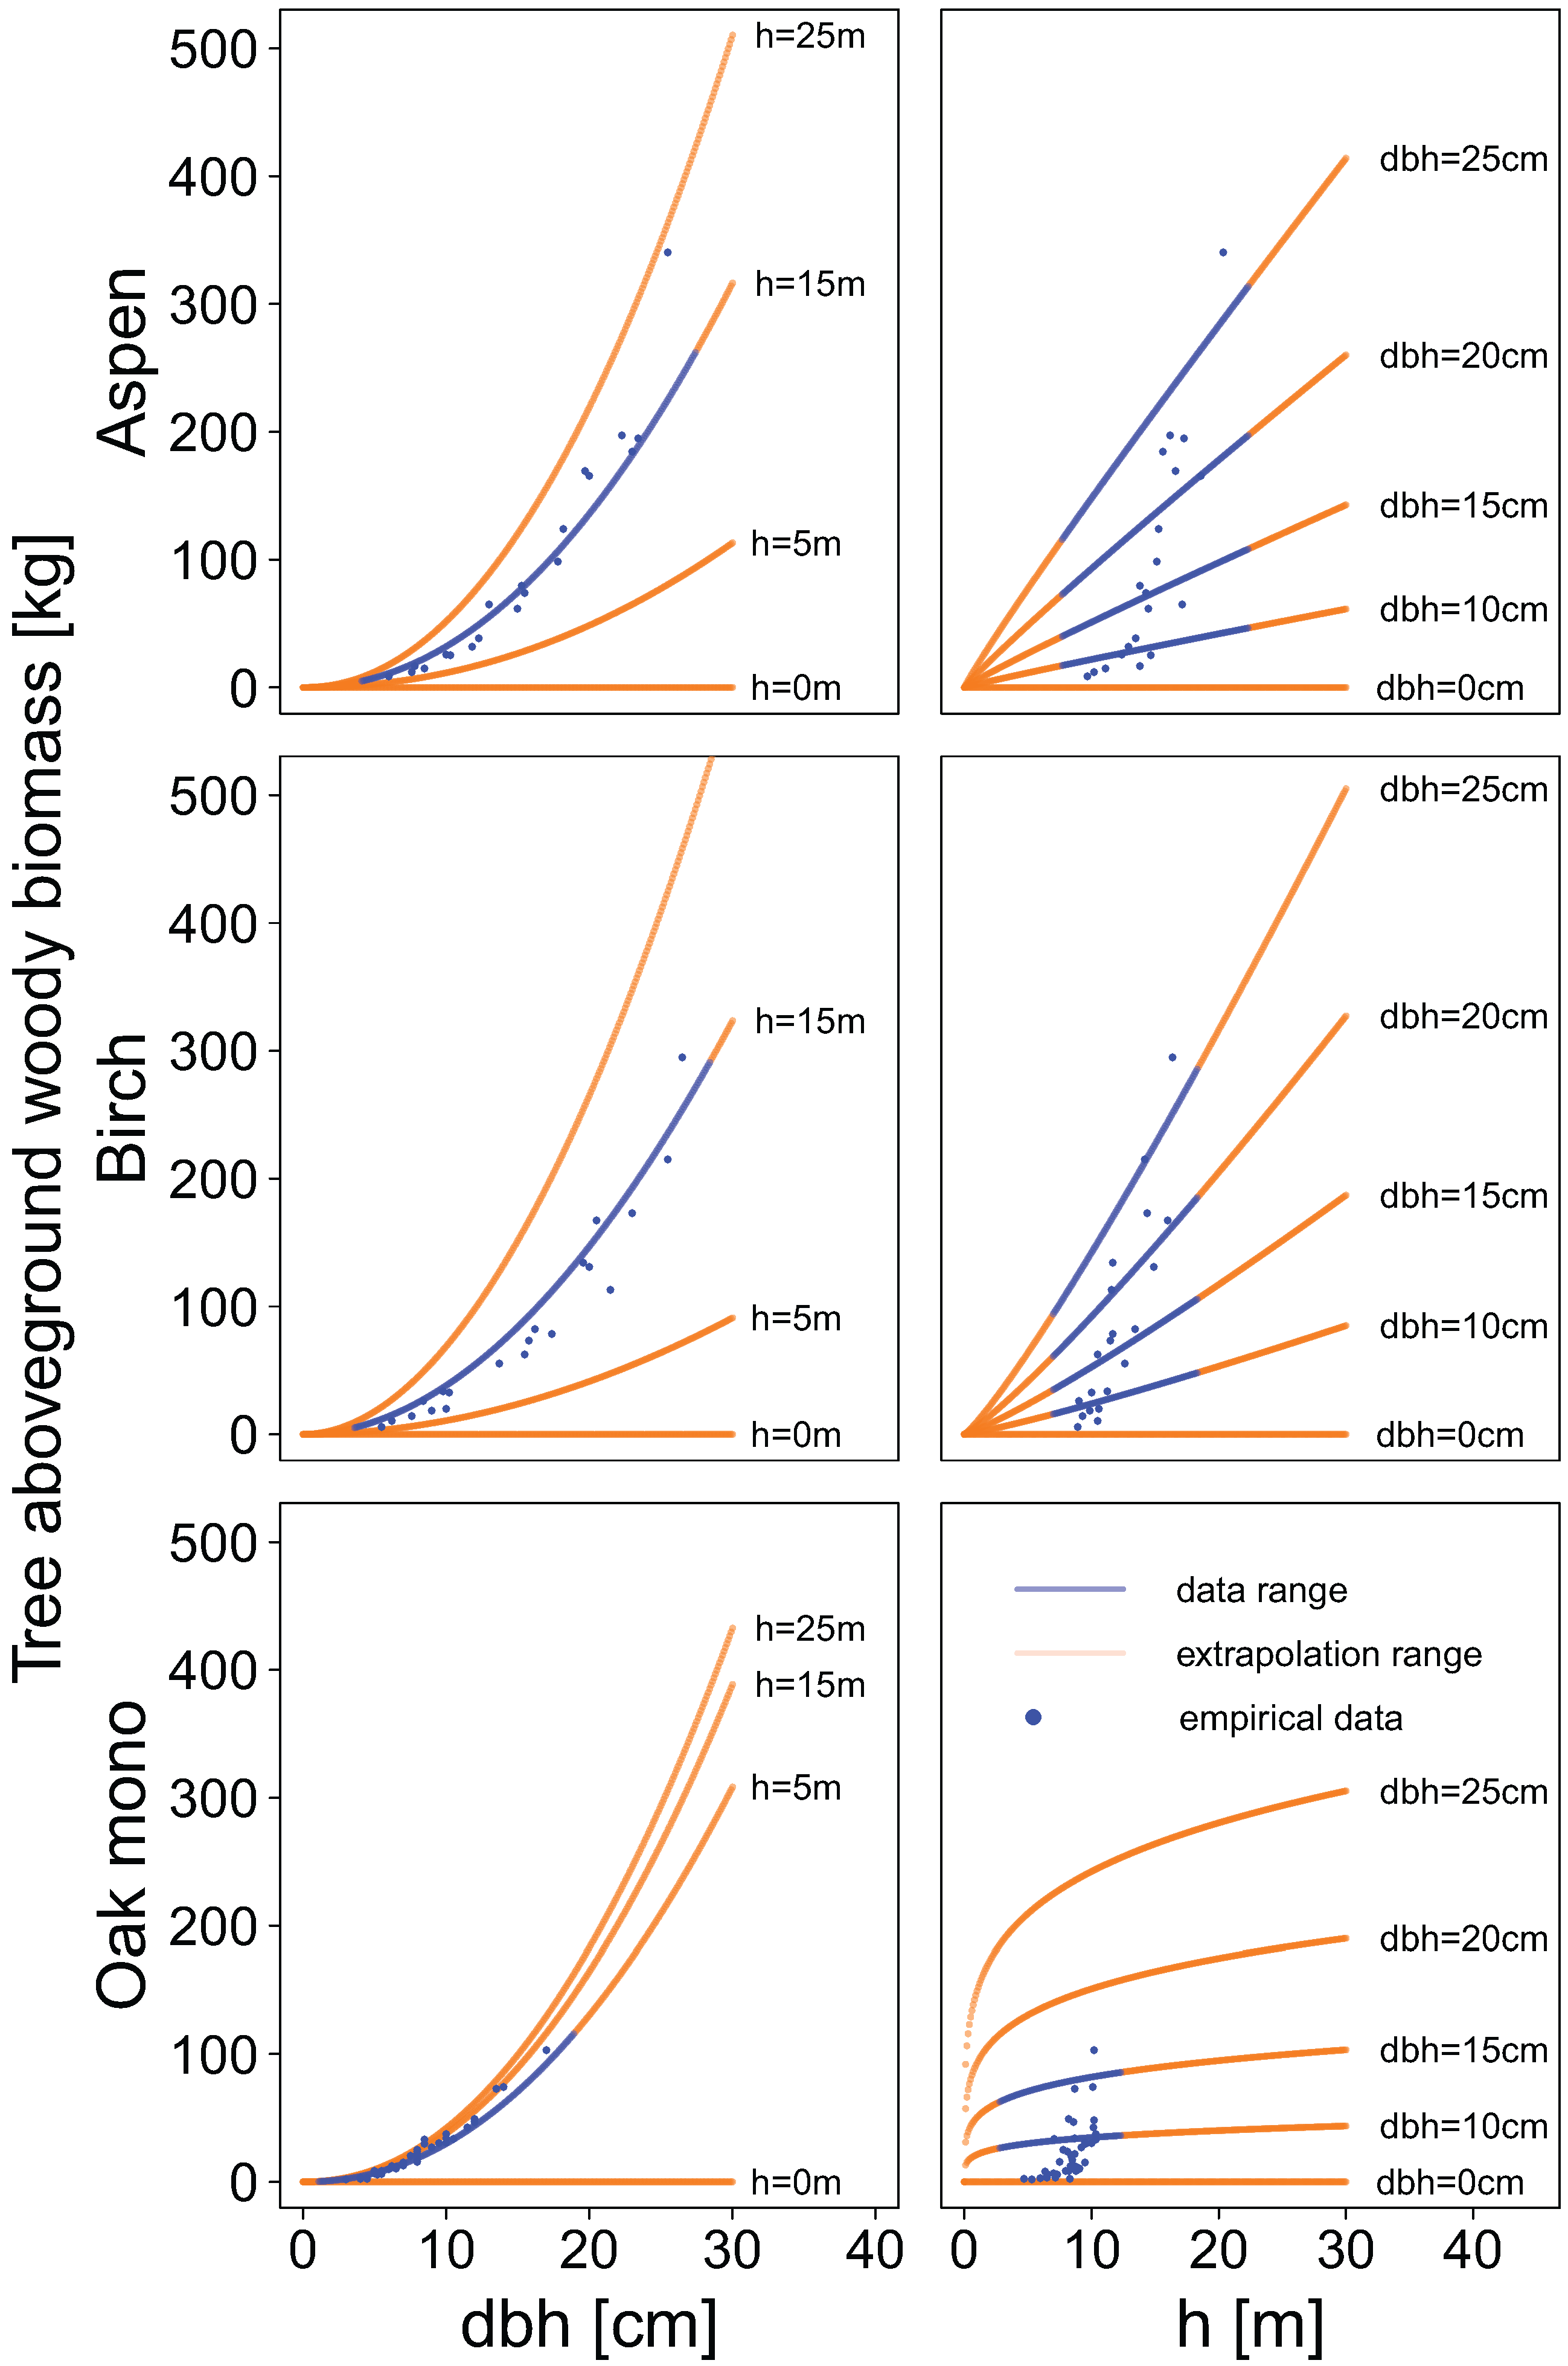
In the second type of allometric biomass equations tree height was used as an additional explanatory variable:
Allometric biomass equations were also used to examine patterns of biomass allocation in relation to diameter at breast height. Compartment-specific biomass predictions were made for several classes of diameter at breast height, and the proportion of biomass of each compartment relative to the total aboveground woody biomass was calculated cumulatively.
2.7. Performance of Allometric Models and Comparison with Literature Allometries
To show how much the biomass estimates of the allometric biomass equation would change if the set of sample trees was a different one, the performance of the fitted allometric models was assessed by means of jackknife resampling in the form of leave-one-out [
53,
54]. Thus, the model was fitted as many times as observations were available and in each model run a different tree was removed from the sample population. The prediction error was then recorded for each specific model run and all errors from all runs were finally used to calculate the root mean squared error. The root mean squared error divided by the mean sample tree biomass yielded the relative root mean squared error.
Additionally, bootstrap resampling was applied in form of 199 random samplings with replacement [
53]. Pointwise 95% credibility intervals were constructed from the empirical distributions resulting from predictions with the 199 curves for a closely spaced grid of diameters at breast height.
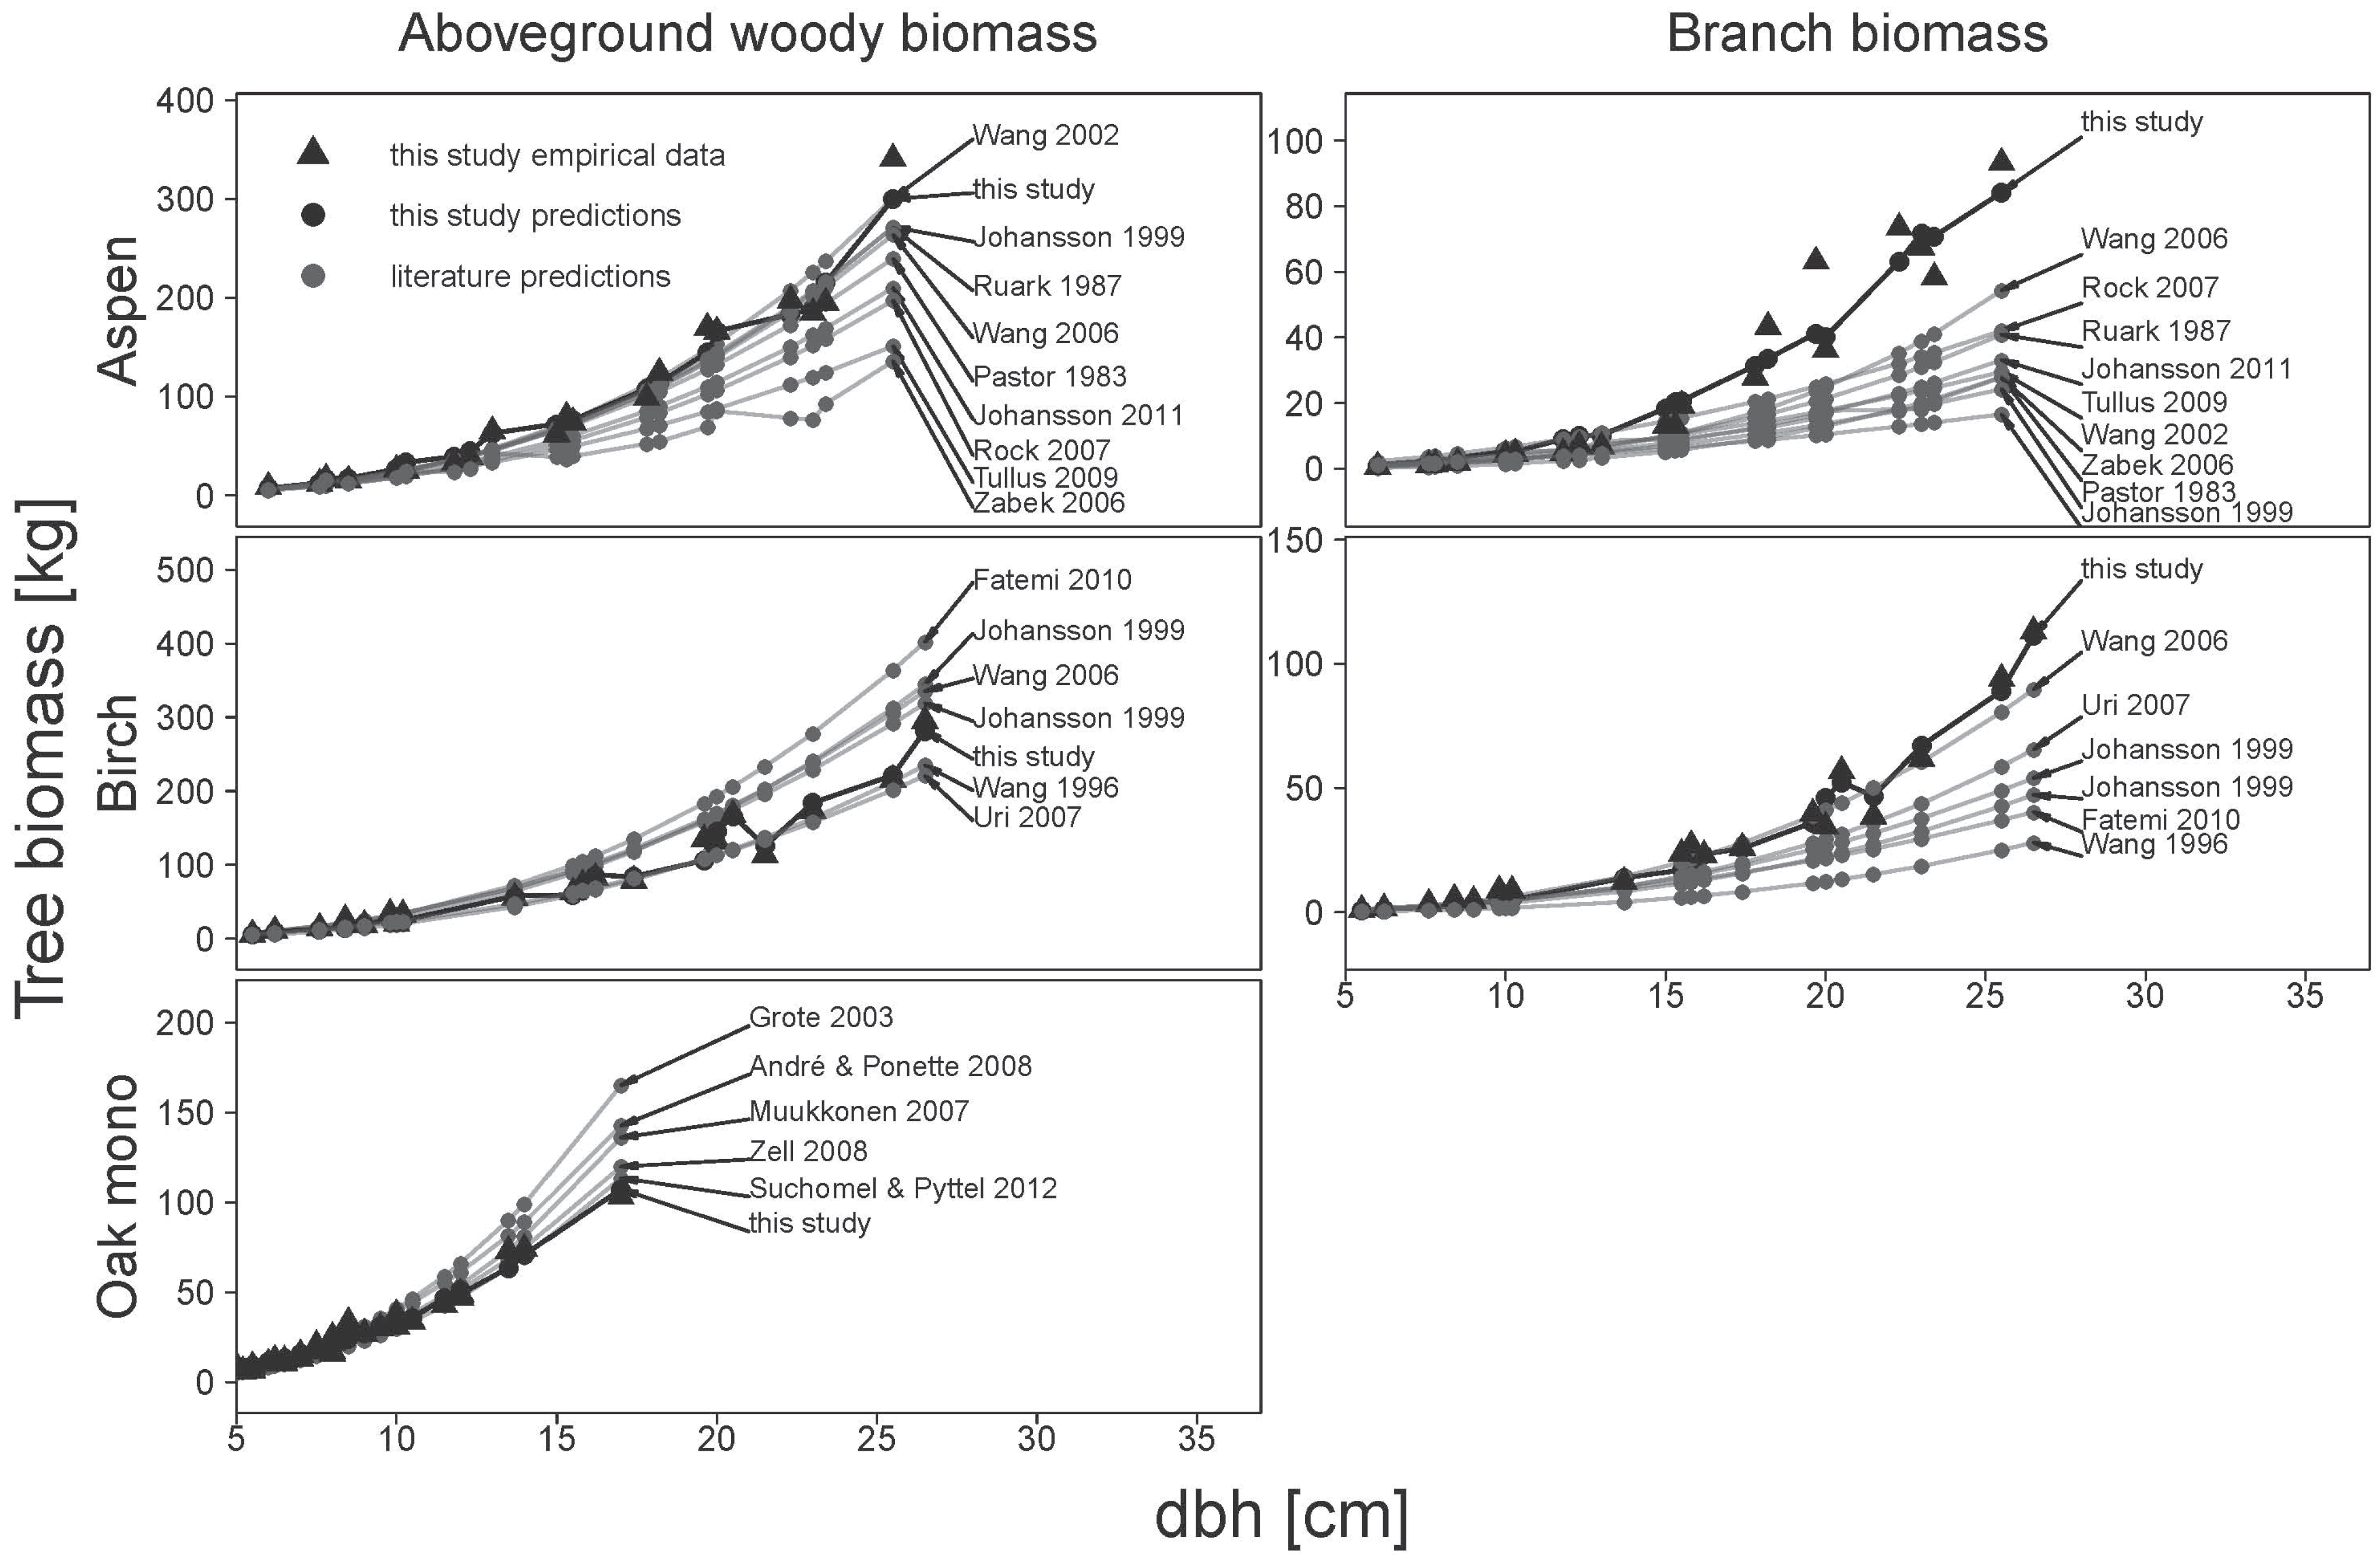
Equations obtained from the literature were used to estimate the aboveground woody biomass and the biomass of branches for our sample tree data. If no allometric biomass equations existed for the prediction of aboveground woody biomass, it was calculated as the sum of compartment specific predictions.
Additionally, stand level aboveground woody biomass and branch biomass were estimated. For this, 650 trees were randomly sub-sampled with replacement from our original sample tree data set, and the probability of each tree to be selected into the sub-sample was weighted by the density probability of stand level tree diameters. The biomass of each tree in the sub-sample was then estimated and the total of all trees was regarded stand level biomass. This process was repeated 199 times for each biomass equation from this study and from the literature, respectively.
Eventually, the performance of the allometric biomass equations from the literature was assessed in terms of bias and root mean squared error and was compared with the performance of our new allometric equations for both single tree and stand level estimates.
2.8. Statistical Analysis
All data handling, calculations, and statistics were performed using the programming language and statistics package R, version 2.12.0 [
55], MASS package [
56], nlme package [
57] and RODBC package for communication with Microsoft Access database [
58].


