Article

Tree Species Richness and Stand Productivity in Low-Density Cluster Plantings with Oaks (Quercus robur L. and Q. petraea (Mattuschka) Liebl.)

Institute of Forest Sciences, Faculty of Environment and Natural Resources, Albert-Ludwigs University of Freiburg, Tennenbacherstr. 4, Freiburg, D-79085, Germany
*
Author to whom correspondence should be addressed.
Forests 2013, 4(3), 650-665; https://doi.org/10.3390/f4030650
Submission received: 1 July 2013 / Revised: 8 August 2013 / Accepted: 9 August 2013 / Published: 16 August 2013
(This article belongs to the Special Issue Feature papers (2013))

Abstract

:
Low density plantings complemented by natural regeneration is an increasingly common reforestation technique to ensure growth of a sufficient number of trees from desired species while maintaining natural processes such as succession. One such form of low density planting that aims at lowering establishment costs—oak clusters—has been developed as an alternative to row planting since the 1980s in central Europe. However, whether cluster planting provides higher species richness and productivity than high density row planting has not previously been analyzed. Here, we compare tree species richness and productivity (measured as stand basal area) between oak cluster plantings and conventional row planting in young (10–26 years old) forest stands at seven study sites in Germany. Tree species richness was significantly higher in cluster plantings than in row plantings, whereas total basal areas were comparable. Naturally regenerated trees contributed on average to 43% of total stand basal area in cluster plantings, which was significantly higher than in row plantings. Total stand basal area in cluster planting was significantly related to the density of naturally regenerated trees. In turn, tree species diversity, density and basal area of naturally regenerated trees were increased with the size of unplanted area between clusters. Our results demonstrate that the admixture of naturally regenerated, early and mid-successional tree species compensates for a possible loss in productivity from planting fewer oaks. Low density cluster plantings can offer significant environmental benefits, at least for the first few decades of stand development, without compromising productivity.

Graphical Abstract

1. Introduction

Traditional reforestation methods following disturbances or clear felling have aimed to assert fast control of forest sites through planting of desired tree species [1]. However, this approach comprises a number of disadvantages such as high costs for site preparation, planting stock and planting [2,3]. In addition, the resulting stands often lack typical post disturbance characteristics such as high diversity of early-successional species which lead to complex food webs and other important ecosystem attributes and processes of early stand development phases [4]. In contrast, the use of natural regeneration processes alone may be relatively inexpensive, but offers reduced control over the future stand composition [5], which should typically conform to long-term goals that may be described in forest development types [6]. Whereas the species composition of natural regeneration may not conform to such long-term goals for a specific site, the natural regeneration that establishes through self-organizational processes of disturbed ecosystems may increase forest resistance and adaptability through new combinations of species and greater species diversity than is typically found in artificially regenerated stands [7,8,9]. A third way for the reforestation of disturbed or harvested sites consists of a combination of the two approaches; low-density planting with natural regeneration in the remaining area [1]. This approach ensures a certain proportion of desired species in the future stand while maintaining natural processes and new species combinations at reduced costs, compared to conventional planting. In addition, the potentially higher tree species diversity consisting of artificial and natural regeneration may result in higher productivity as has been observed in many other situations [10]. Given the increasingly important production of biomass from forests for energy and solid-wood products, silvicultural systems must use the available net production area most efficiently. Hence, low-density plantings, which lead to reduced production of forest biomass, may not be desirable or acceptable.
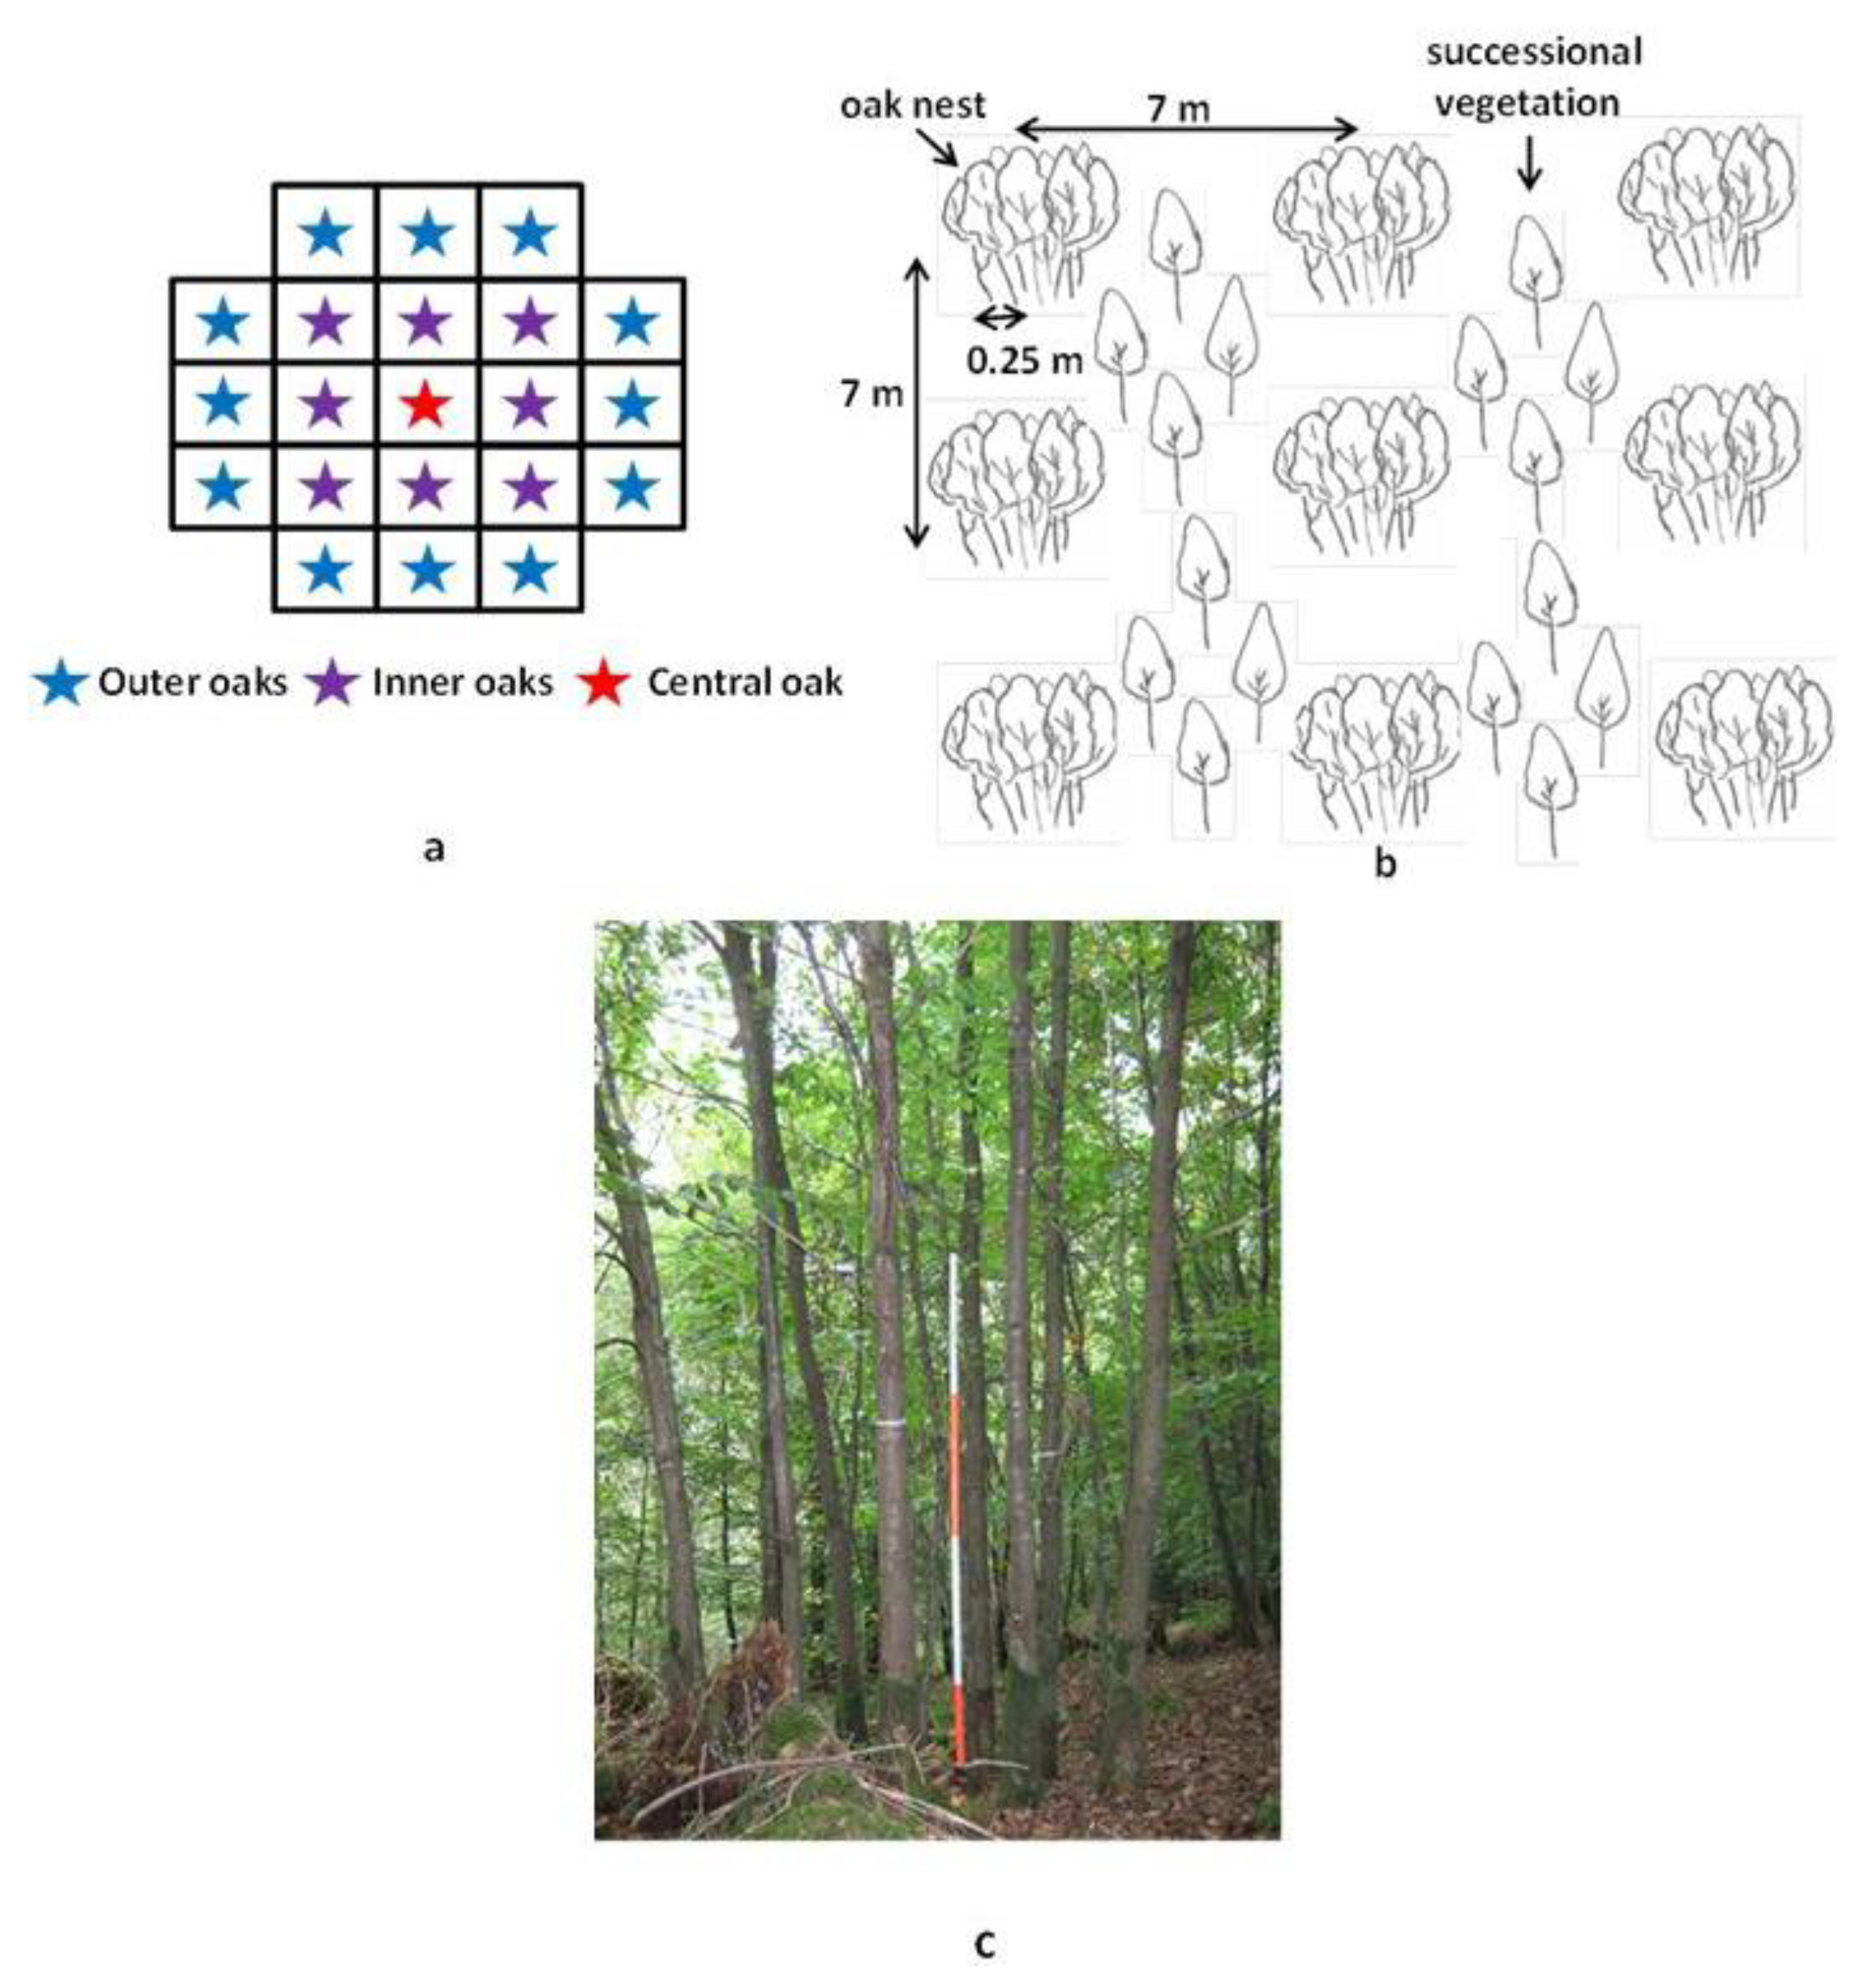
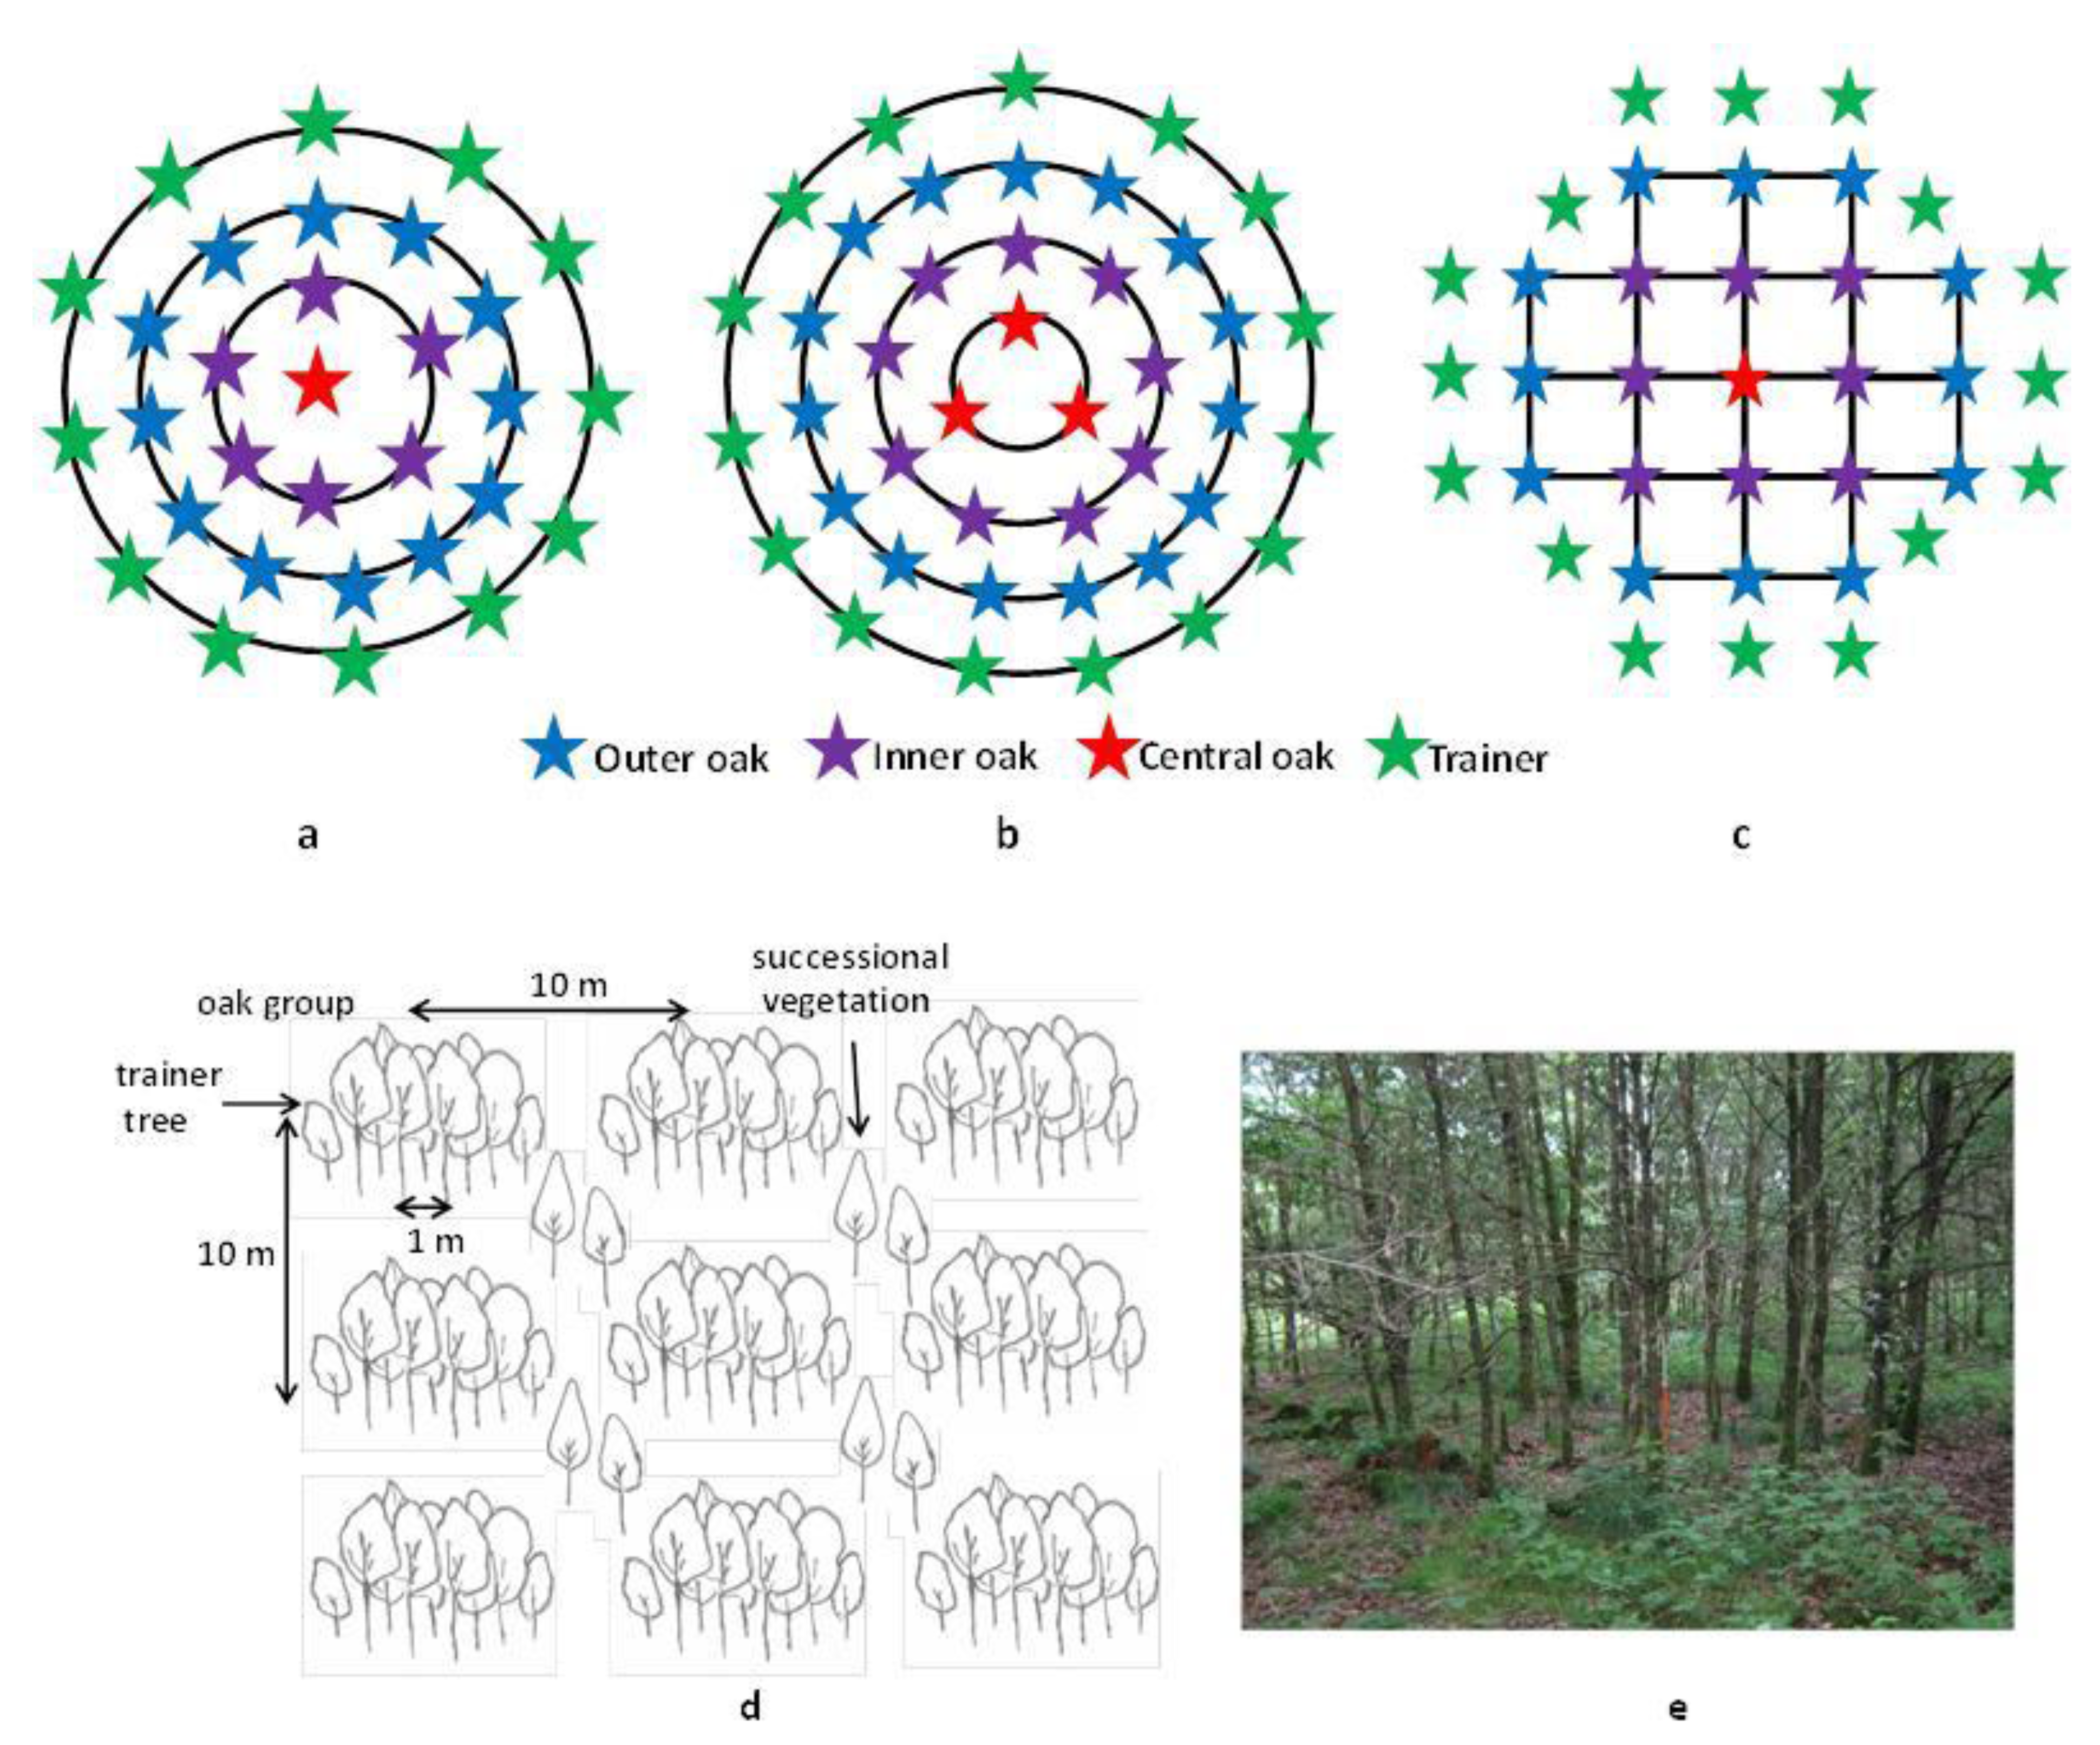
Oak cluster planting is a prominent example of low-density tree plantings. The system originated in early afforestation trials conducted in the United Kingdom and Russia and was rediscovered in central Europe in the last three decades of the twentieth century as an alternative to traditional oak row planting [11,12]. Clusters are uniformly distributed “nests” (nest planting, Figure 1) or “groups” (group planting, Figure 2) that consist of 20–30 seedlings planted in an aggregated manner with 0.25 or 1 m initial spacing and approximately 200 or 100 such clusters ha−1, respectively, [13,14,15,16] but see [17,18]. Aiming at lowering the establishment costs while offering the opportunity to produce high quality timber, oak cluster plantings also provide vacant space, typically more than 60% of the area, for natural regeneration between clusters [2]. However, recruitment and accumulation of naturally established trees in these unplanted interspaces, which depends on external factors such as fencing, seed dispersal from neighboring stands and competition from ground vegetation, may be highly variable [19,20]. While growth and quality development of oak cluster stands have been assessed and compared to row plantings [21], the potential benefits of cluster plantings in terms of tree species diversity and stand productivity have not been quantified beyond individual case studies across a number of sites [22].
Figure 1. (a) Szymanski’s (1986) nest design; (b) 7 × 7 m spacing between the centres of nests were generally followed in German nest plantings; (c) 23-year-old nest planting in Leonberg, Baden-Württemberg, Germany.
Forests 04 00650 g001
In this study, we quantified tree species diversity and productivity over a range of sites in pairs of treatments with low density plantings using oak clusters (group or nest) and oak row plantings. In addition, we examined whether productivity of cluster planting stands depended on the density or species diversity of naturally regenerated trees. We hypothesized that (1) cluster planting would provide higher tree species diversity and stand productivity than traditional row planting, and (2) that overall stand productivity in cluster planting will be related to density and species richness of naturally regenerated and planted trees among clusters.
Figure 2. (ac) Gockel’s (1994) group planting design with 3 variants; (d) 10 × 10 m spacing was commonly followed between the centres of groups; (e) 20-year-old group planting in Lerchenfeld, Hessen, Germany.
Forests 04 00650 g002

2. Materials and Methods

2.1. Study Sites

Seven locations with pairs of cluster and row plantings of oak (Quercus robur L. and Q. petraea (Mattuschka) Liebl.) were sampled in hilly terrain and montane sites in the German federal states of Baden-Wuerttemberg and Hessen (Table 1). Mean annual temperature and rainfall at these sites vary between 6.5–10.2 °C and 670–832 mm, respectively, with the majority of precipitation occurring in the growing season between May and September. Soil types at the sites range from gleyic cambisols originating from alluvial deposits covered by loess to stagnosols originating from basalt loam, silt stone or sandstone [23]. The resulting site conditions provide for moderate growth rates with oak exhibiting a mean annual increment of 7.5–8.5 m3 ha−1 year−1 over the first 100 years of a rotation. Oak reforestation took place between 1986 and 2000 after the previous stands of mainly coniferous species (Picea abies (L.) H.Karst., Pseudotsuga menziesii (Mirb.) Franco) were uprooted by storm or clear-felled. Prior to planting, extensive site preparation including removal of slash and broken tree trunks was conducted at the row planting sites, however, such site preparation does not usually precede cluster planting. All row plantings were established with an initial seedling density of approximately 5000 seedlings ha−1. As part of the basic planting design, a varying number of trainer trees were planted in all oak group and row plantings (Table 2). However, trainer trees were also added to the interspaces between nests in Gerlingen and Leonberg. In contrast, cherry trees (Prunus avium L.) were planted between the groups of the Altenheim site. Each cluster and row planting was fenced during the initial years after establishment. All reforestation sites were adjacent to forests, usually mature mixed oak as well as mixed and pure conifer stands. On average, the area of each inventoried cluster and row planting stand was about 1 ha in size, except the control row planting used for the cluster planting sites in Gerlingen and Leonberg (0.2 ha). We used one row planting stand as control for the group planting sites Kaiserseiche and Lerchenfeld because another row planting stand of similar age with similar site conditions was not available.

2.2. Sampling Design and Data Collection

Systematic strips were established along the lines of nests or groups and rows. On average, four strips were inventoried per cluster planting and three strips at every row planting site. Because of the varying spacing between the lines of clusters and rows, strip width amounted to 2, 8 and 10 m for row, nest and group planting, respectively. The strips covered at least one third of the area of each studied stand. Strips were located in the interior of the stands to avoid influences from the surrounding forest, skidding trails and forest roads. Diameter at 1.3 m stem height (DBH) of all planted oaks and trainers within each strip was measured. Species and DBH of naturally regenerated woody plants (height > 1.3 m) were recorded in circular plots of varying diameters. In cluster plantings, plots with a radius of 2 m were placed between diagonally opposite nests or groups. In addition, 1 m radius plots were installed at the center of the groups to capture natural regeneration within the groups. No such plots were set up within the oak nests because they did not contain other woody plants besides the densely planted oaks. Assuming that other woody species may voluntarily regenerate underneath the oak crowns, we installed also circular vegetation plots with a radius of 1 m between the rows. Those plots were spaced at a regular distance of 5 m within each strip.

2.3. Stand Productivity Assessment

Strips within cluster plantings were divided into: (1) area occupied by clusters; and (2) area left for natural regeneration. The area occupied by individual clusters was derived from allometric equations predicting crown width based on DBH and tree age for young oaks, Carpinus betulus L. and Fagus sylvatica L. [24,25,26,27]. Total crown projection area of clusters was then subtracted from the strip area to calculate the area potentially available to be occupied by natural regeneration. The accuracy of this field sampling design was validated at one nest and one group planting site. Additional full inventories in which all individuals within strips were recorded, did not differ significantly from the plot based sampling within strips described above.
Table 1. Descriptions and location of investigated cluster planting sites.
SiteGeographical areaElevation m a.s.l.Mean annual temperature (°C)Mean annual rainfall (mm)Soil typeMean annual oak volume increment (m3 ha−1 year−1)
AltenheimUpper Rhine valley14310.2832Gleyic cambisol8.0
GerlingenNeckar river basin4408.1780Stagnogleyic cambisol7.5
GerchsheimFranconian plateau3108.5670Stagnogleyic cambisol8.0
KaisereicheNorthwest Hessian mountain5506.5800Stagnogleyic cambisol8.0
KönigheimNeckar river basin3808.1750Cambisol8.5
LerchenfeldNorthwest Hessian mountain5506.5800Stagnogleyic cambisol8.0
LeonbergNeckar river basin4208.5780Stagnogleyic cambisol7.5
Table 2. Characteristics of studied cluster plantings.
SiteAltenheimGerlingenGerchsheimKaisereicheKoenigheimLerchenfeldLeonberg
Cluster typeGroupNestNestGroupNestGroupNest
Oak species plantedQuercus roburQuercus roburQuercus roburQuercus petraeaQuercus petraeaQuercus petraeaQuercus robur
Stand age (yr)10262220222023
Spacing between oaks in cluster (m)1.00.30.31.00.31.0 0.3
Clusters ha−170180200100200100150
Oaks per cluster19212127212721
Trainers per cluster121515
Trainer tree species Tilia cordata, Carpinus betulusFagus sylvaticaFagus sylvatica
Given the lack of repeated inventory data of cluster and row plantings, we could not determine the rate of biomass accumulation. However, stand basal area is strongly correlated with stand biomass and has often been recognized as a proxy for stand productivity [28]. Therefore, we used stand basal area as a measure of stand productivity in this study. Strip data were pooled at the stand level to calculate total stand basal area (planted and naturally regenerated trees) in cluster and row plantings. In addition, total stand basal area was divided into five different groups: (1) naturally regenerated, early-successional species (Betula pendula Roth, Salix caprea L., Poplus tremula L., Pinus sylvestris L., Sorbus aucuparia L.); (2) naturally regenerated, mid-successional species (Fraxinus excelsior L., Acer pseudoplatanus L., Acer platanoides L., Picea abies, Pseudotsuga menziesii, Prunus avium); (3) planted shade-intolerant hardwoods (Quercus spp. Prunus avium); (4) planted shade-tolerant trainer trees (Carpinus betulus, Tilia cordata Mill., Fagus sylvatica); (5) and naturally regenerated woody shrubs (Frangula alnus L., Sambucus nigra L., Corylus avellana L.).

2.4. Assessment of Species Richness and Statistical Analysis

To account for the varying size of vegetation plots between the planting types, we used rarefaction to compare species richness between cluster and row planting. Rarefaction represents the means of repeated re-sampling of all pooled samples, i.e., the statistical expectation for the corresponding accumulation curves [29]. Rarefaction curves were produced by repeatedly re-sampling the pool of N samples (in our case, vegetation plots which represent a collection of individuals), at random and plotting the average number of species represented by 1, 2, …….., N samples [30]. Rarefaction generates the mean expected number of species and confidence interval in a small collection of samples drawn at random from the large pool of N samples. The difference between rarefaction curves representing different treatments (e.g., nest vs. row, group vs. row) is statistically significant, when confidence intervals of means from two curves do not overlap.
Paired sample t-tests were used to examine differences in total stand basal area, basal area of planted trees and natural regeneration between cluster and row planting stand pairs across all sites combining strips for every cluster and row planting stand. The relationship between area available for natural regeneration between clusters and species richness and stand basal area was quantified by linear regression and correlation analysis. One-way analysis of covariance using density and species richness as covariates was executed to examine whether stand basal area was influenced by density of planted and naturally regenerated trees or species diversity. All statistical analyses were performed in SPSS, Version 20 and R 2.14.0, package “vegan” [31,32].

3. Results

3.1. Tree Species Richness and Stand Basal Area in Cluster and Row Planting

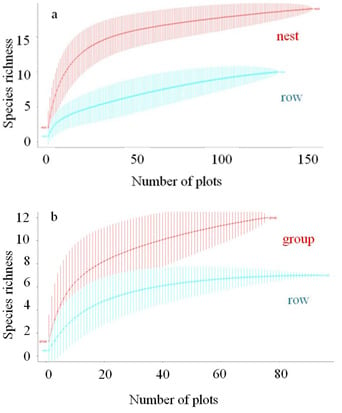
With an increasing number of sample plots, rarefaction curves showed that species richness became significantly higher in cluster plantings than in row plantings. This higher species richness in cluster plantings compared to row plantings was more prominent in nest than in group plantings (Figure 3). Maximum species richness amounted to 15, 12 and 5 in nest, group and row planting stands, respectively. The gentle slope of rarefaction curves at high numbers of plots implies that the chance for encountering additional species was small and that a sufficient number of plots had been sampled to ascertain the differences between planting types.
Figure 3. Rarefaction curves for nest vs. row planting (a) and group vs. row planting (b), the number of species is standardized by number of vegetation plots (x axis) and accumulated with total number of species (y axis). Confidence intervals are shown as vertical lines.
Forests 04 00650 g003
Basal area contributed by naturally regenerated trees was two and three times higher in group (t = 4.33, d.f. = 2, p < 0.05) and nest (t = 8.36, d.f. = 2, p < 0.01) than in row planting, respectively. As may have been expected, basal area of planted oak and trainer trees was significantly lower in nest (t = −4.68, d.f. = 3, p < 0.05) and in group planting (t = −5.80, d.f. = 2, p < 0.05) than in row planting. However, total stand basal area consisting of naturally regenerated and planted trees did not differ between nest and row or between group and row plantings (Figure 4). These mean comparisons were done between pairs of clusters and row plantings stands combining the strips.
Figure 4. Comparison of stand basal area among nest, group and row planting. * p < 0.05 level, ** p < 0.01 level. Lines denote standard error at 95% confidence interval.
Forests 04 00650 g004
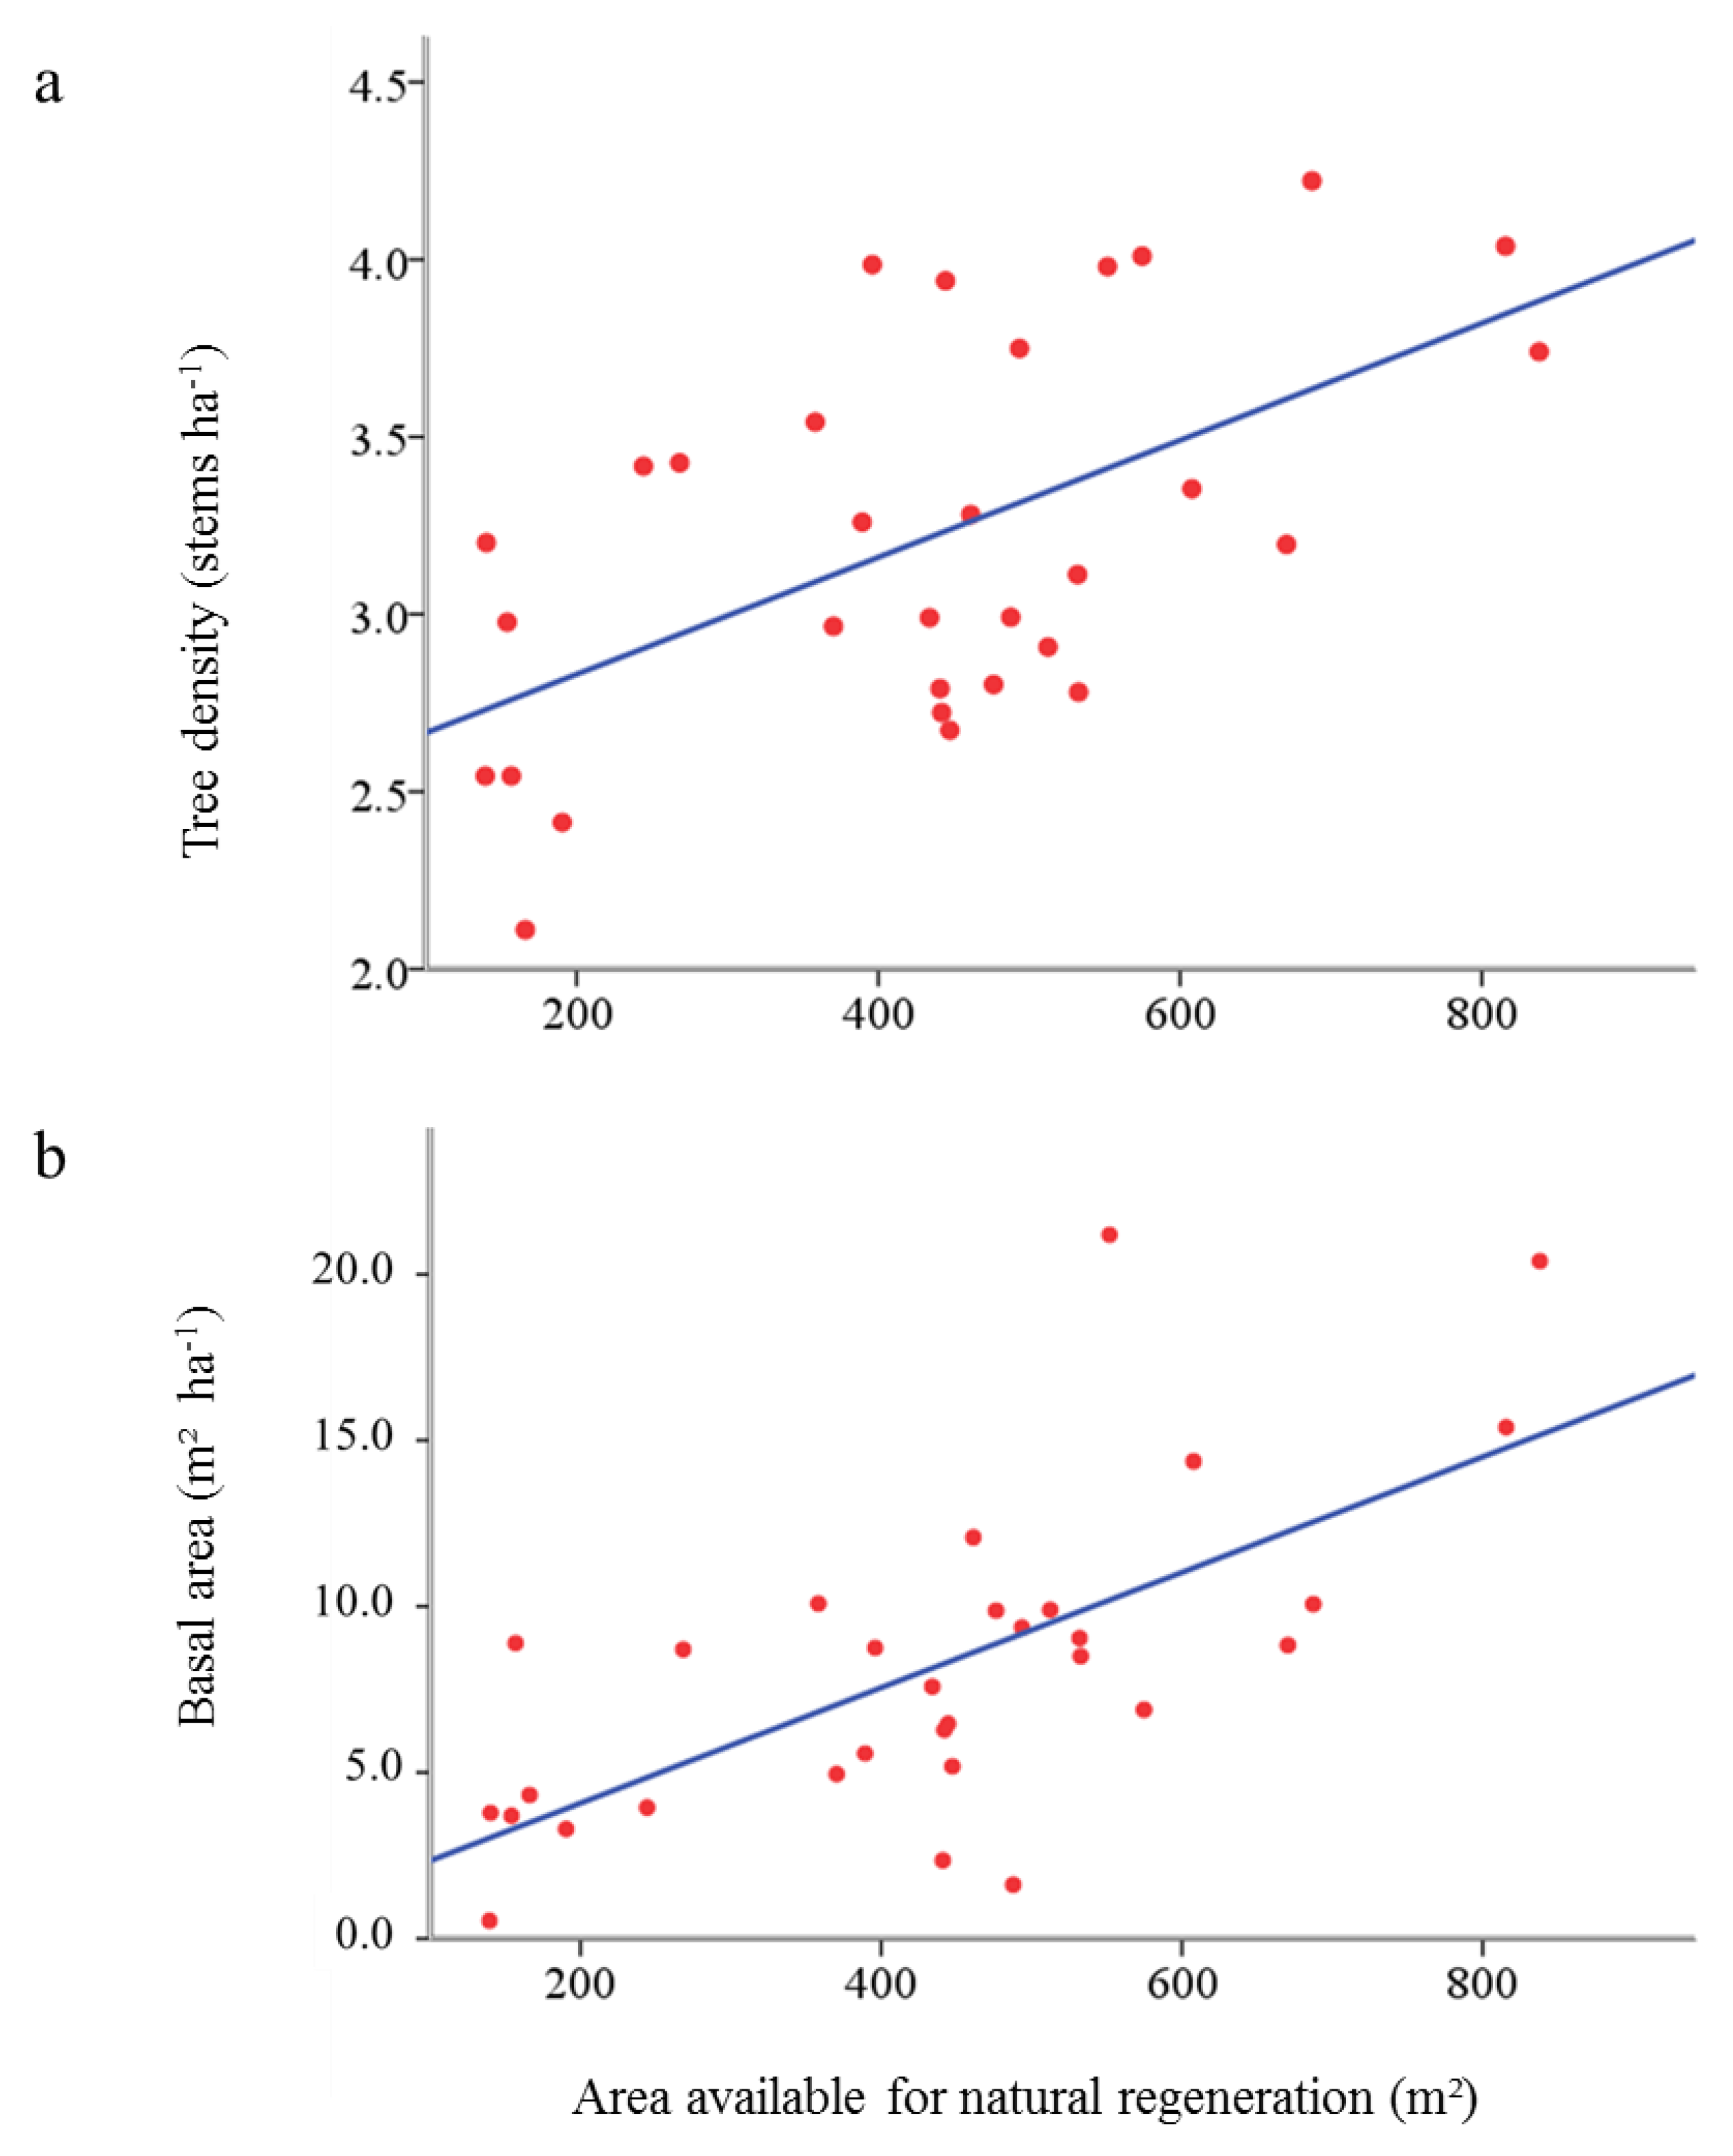
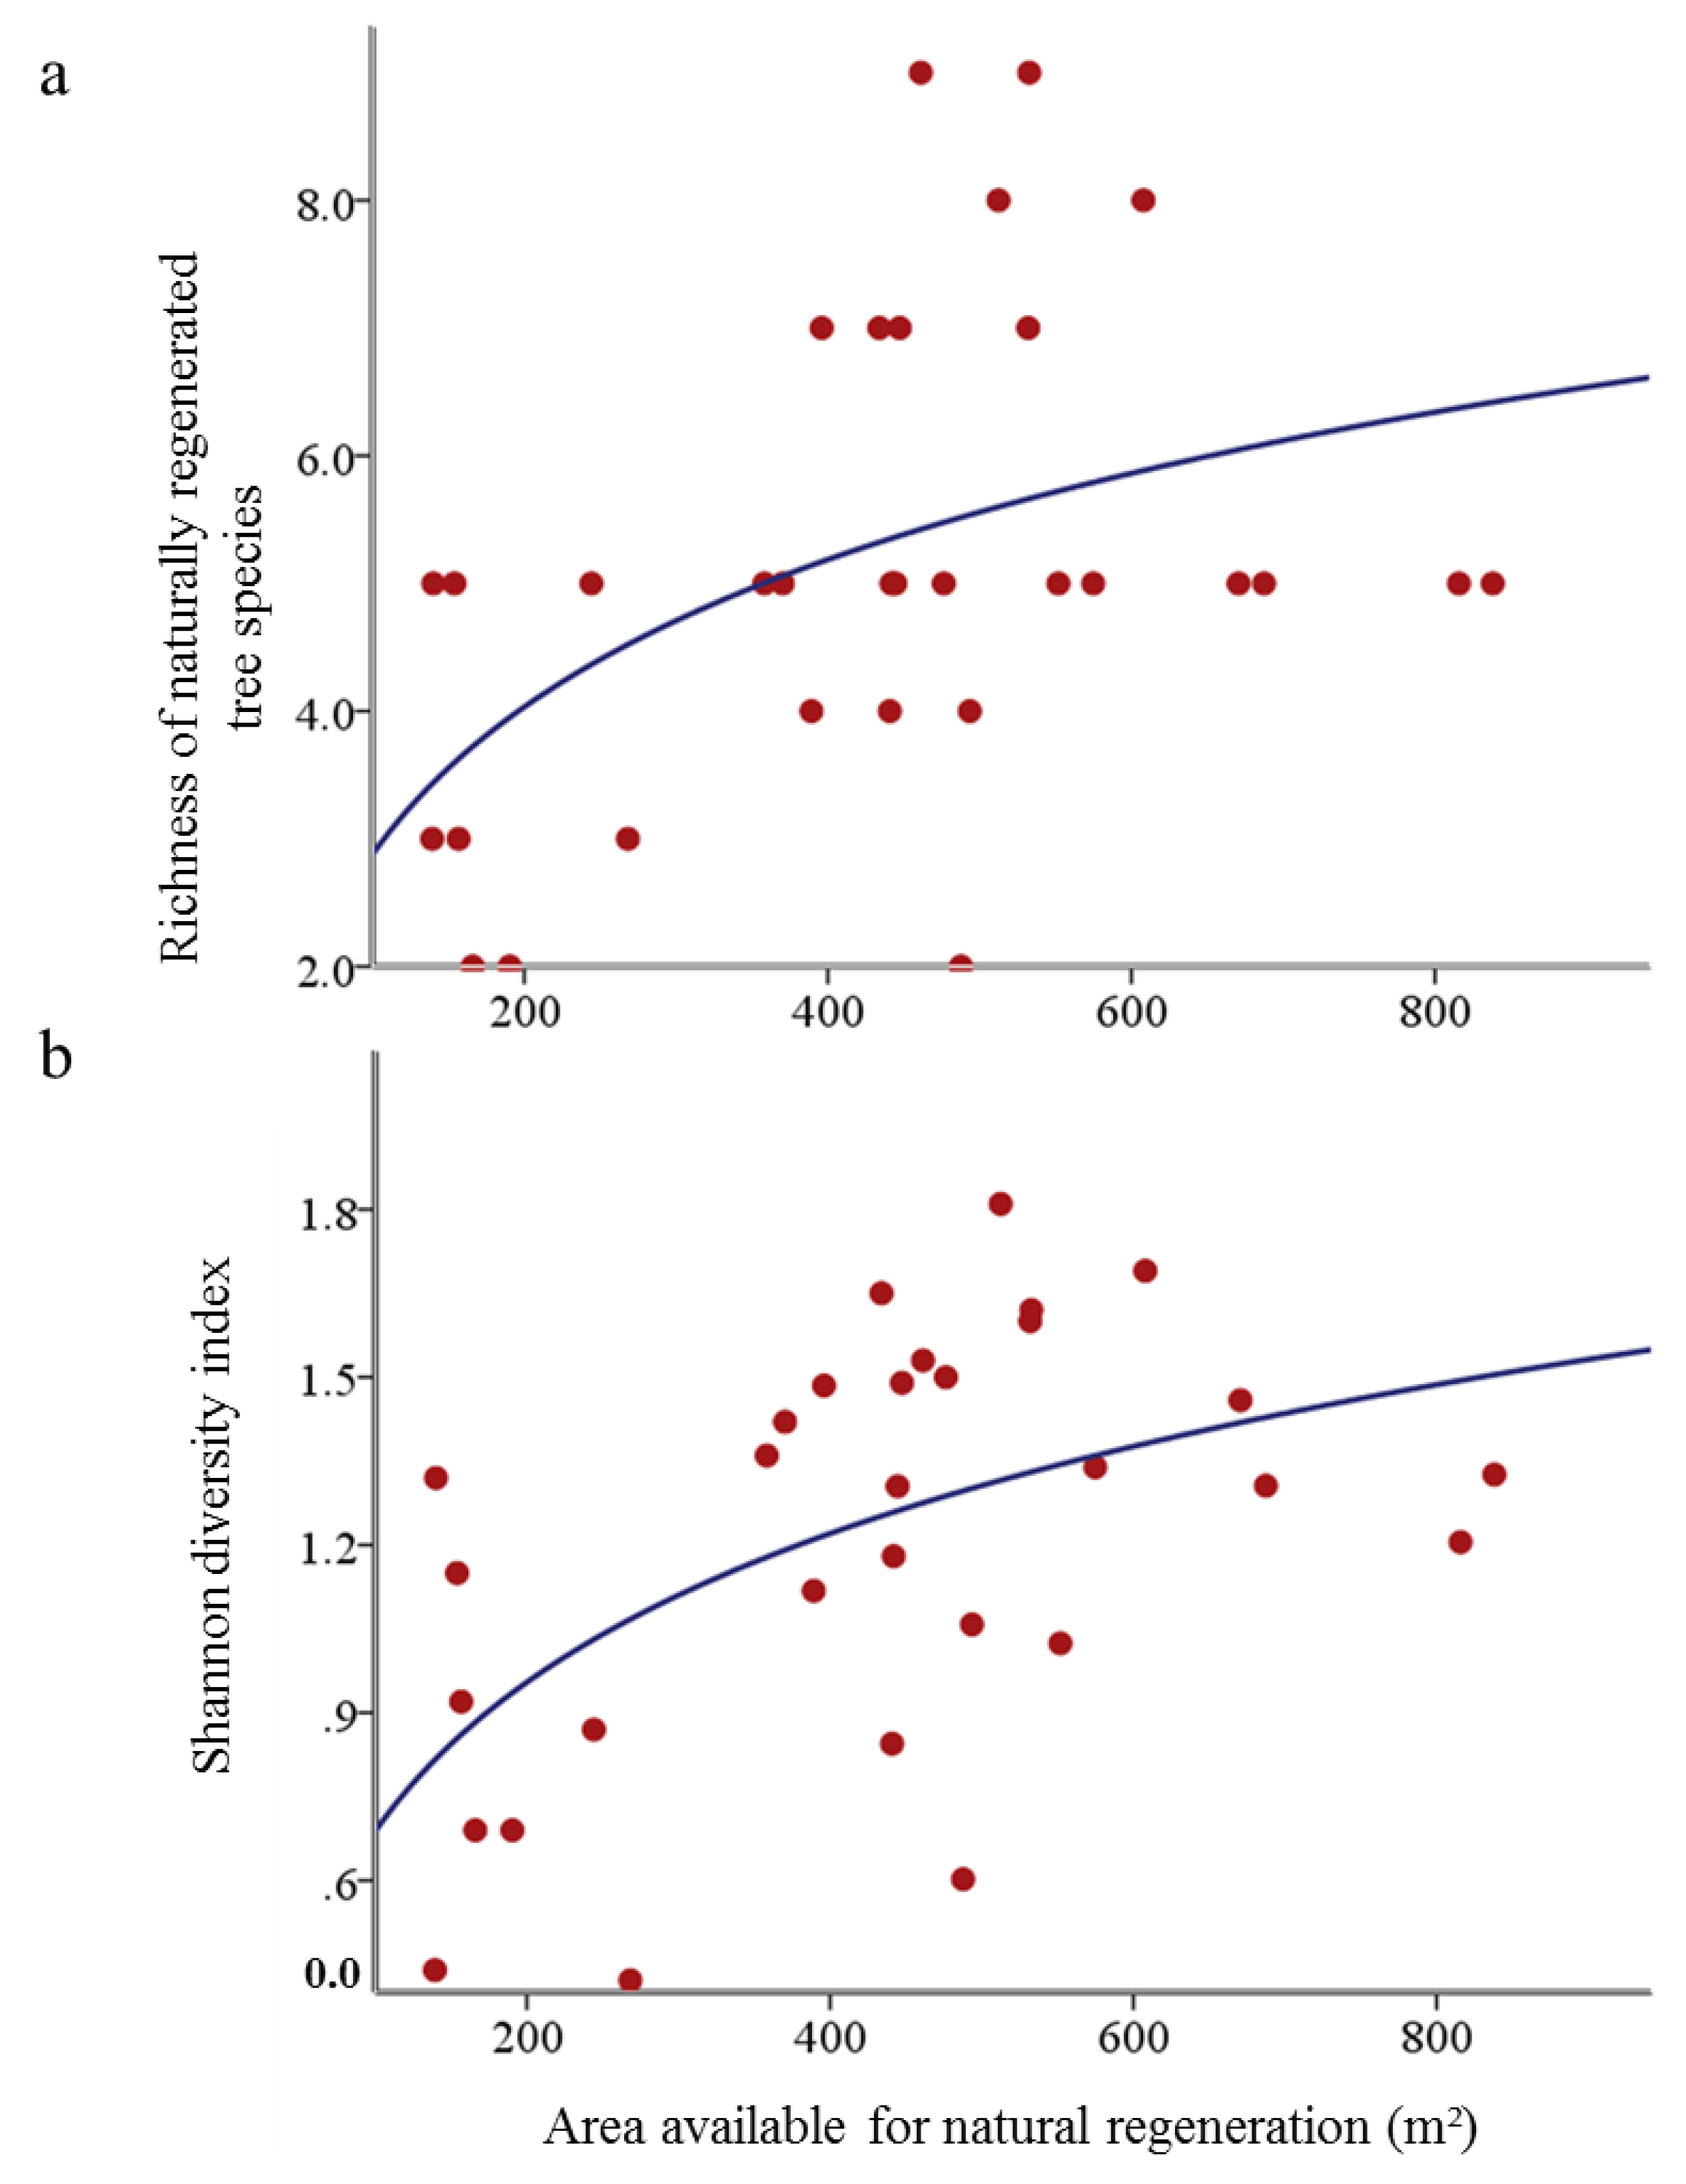
Betula pendula, Poplus tremula, Salix caprea and Sorbus aucuparia were the most common early-successional naturally regenerated tree species between clusters. The mean proportion of total stand basal area represented by early successional trees in cluster planting stands was 25% and the four species mentioned above collectively accounted on average for 20%. Mid-successional trees such as Acer spp., Picea abies, and Fraxinus excelscior contributed on average to 18% of stand basal area. Planted oaks and cherries contributed up to 40% of basal area, whereas trainer trees and woody shrubs comprised approximately 14% and 5%, respectively. The density (log-transformed) of naturally regenerated trees was positively related to the space available for natural regeneration between the clusters (R2 = 0.31, Pearson’s r = 0.51, p < 0.05) which in turn was positively related to basal area of naturally regenerated trees (R2 = 0.45, Pearson’s r = 0.68, p < 0.01) (Figure 5). In addition, we found that proportion of area available for natural regeneration (ratio of crown projection area of planted oaks and area available for natural regeneration) significantly increases basal area of naturally regenerated trees (R2 = 0.28, Pearson’s r = 0.48, p < 0.01, N = 31). The size of unplanted area between clusters also influenced species richness (R2 = 0.21, Pearson’s r = 0.46, p < 0.01) and Shannon diversity (R2 = 0.31, Pearson’s r = 0.50, p < 0.01) of naturally regenerated tree species (Figure 6).
Figure 5. Relationship between area available for natural regeneration and (a) density (log-transformed) (R2 = 0.31, p < 0.05, N = 31), (b) and basal area (R2 = 0.45, p < 0.01, N = 31) of naturally regenerated tree species.
Forests 04 00650 g005
Figure 6. Area between clusters available for natural regeneration as related to (a) richness (R2 = 0.21, p < 0.05, N = 31), and (b) the Shannon diversity index (R2 = 0.29, p < 0.01, N = 31) of naturally regenerated tree species.
Forests 04 00650 g006

3.2. Influence of Natural Regeneration on Stand Basal Area in Cluster Plantings

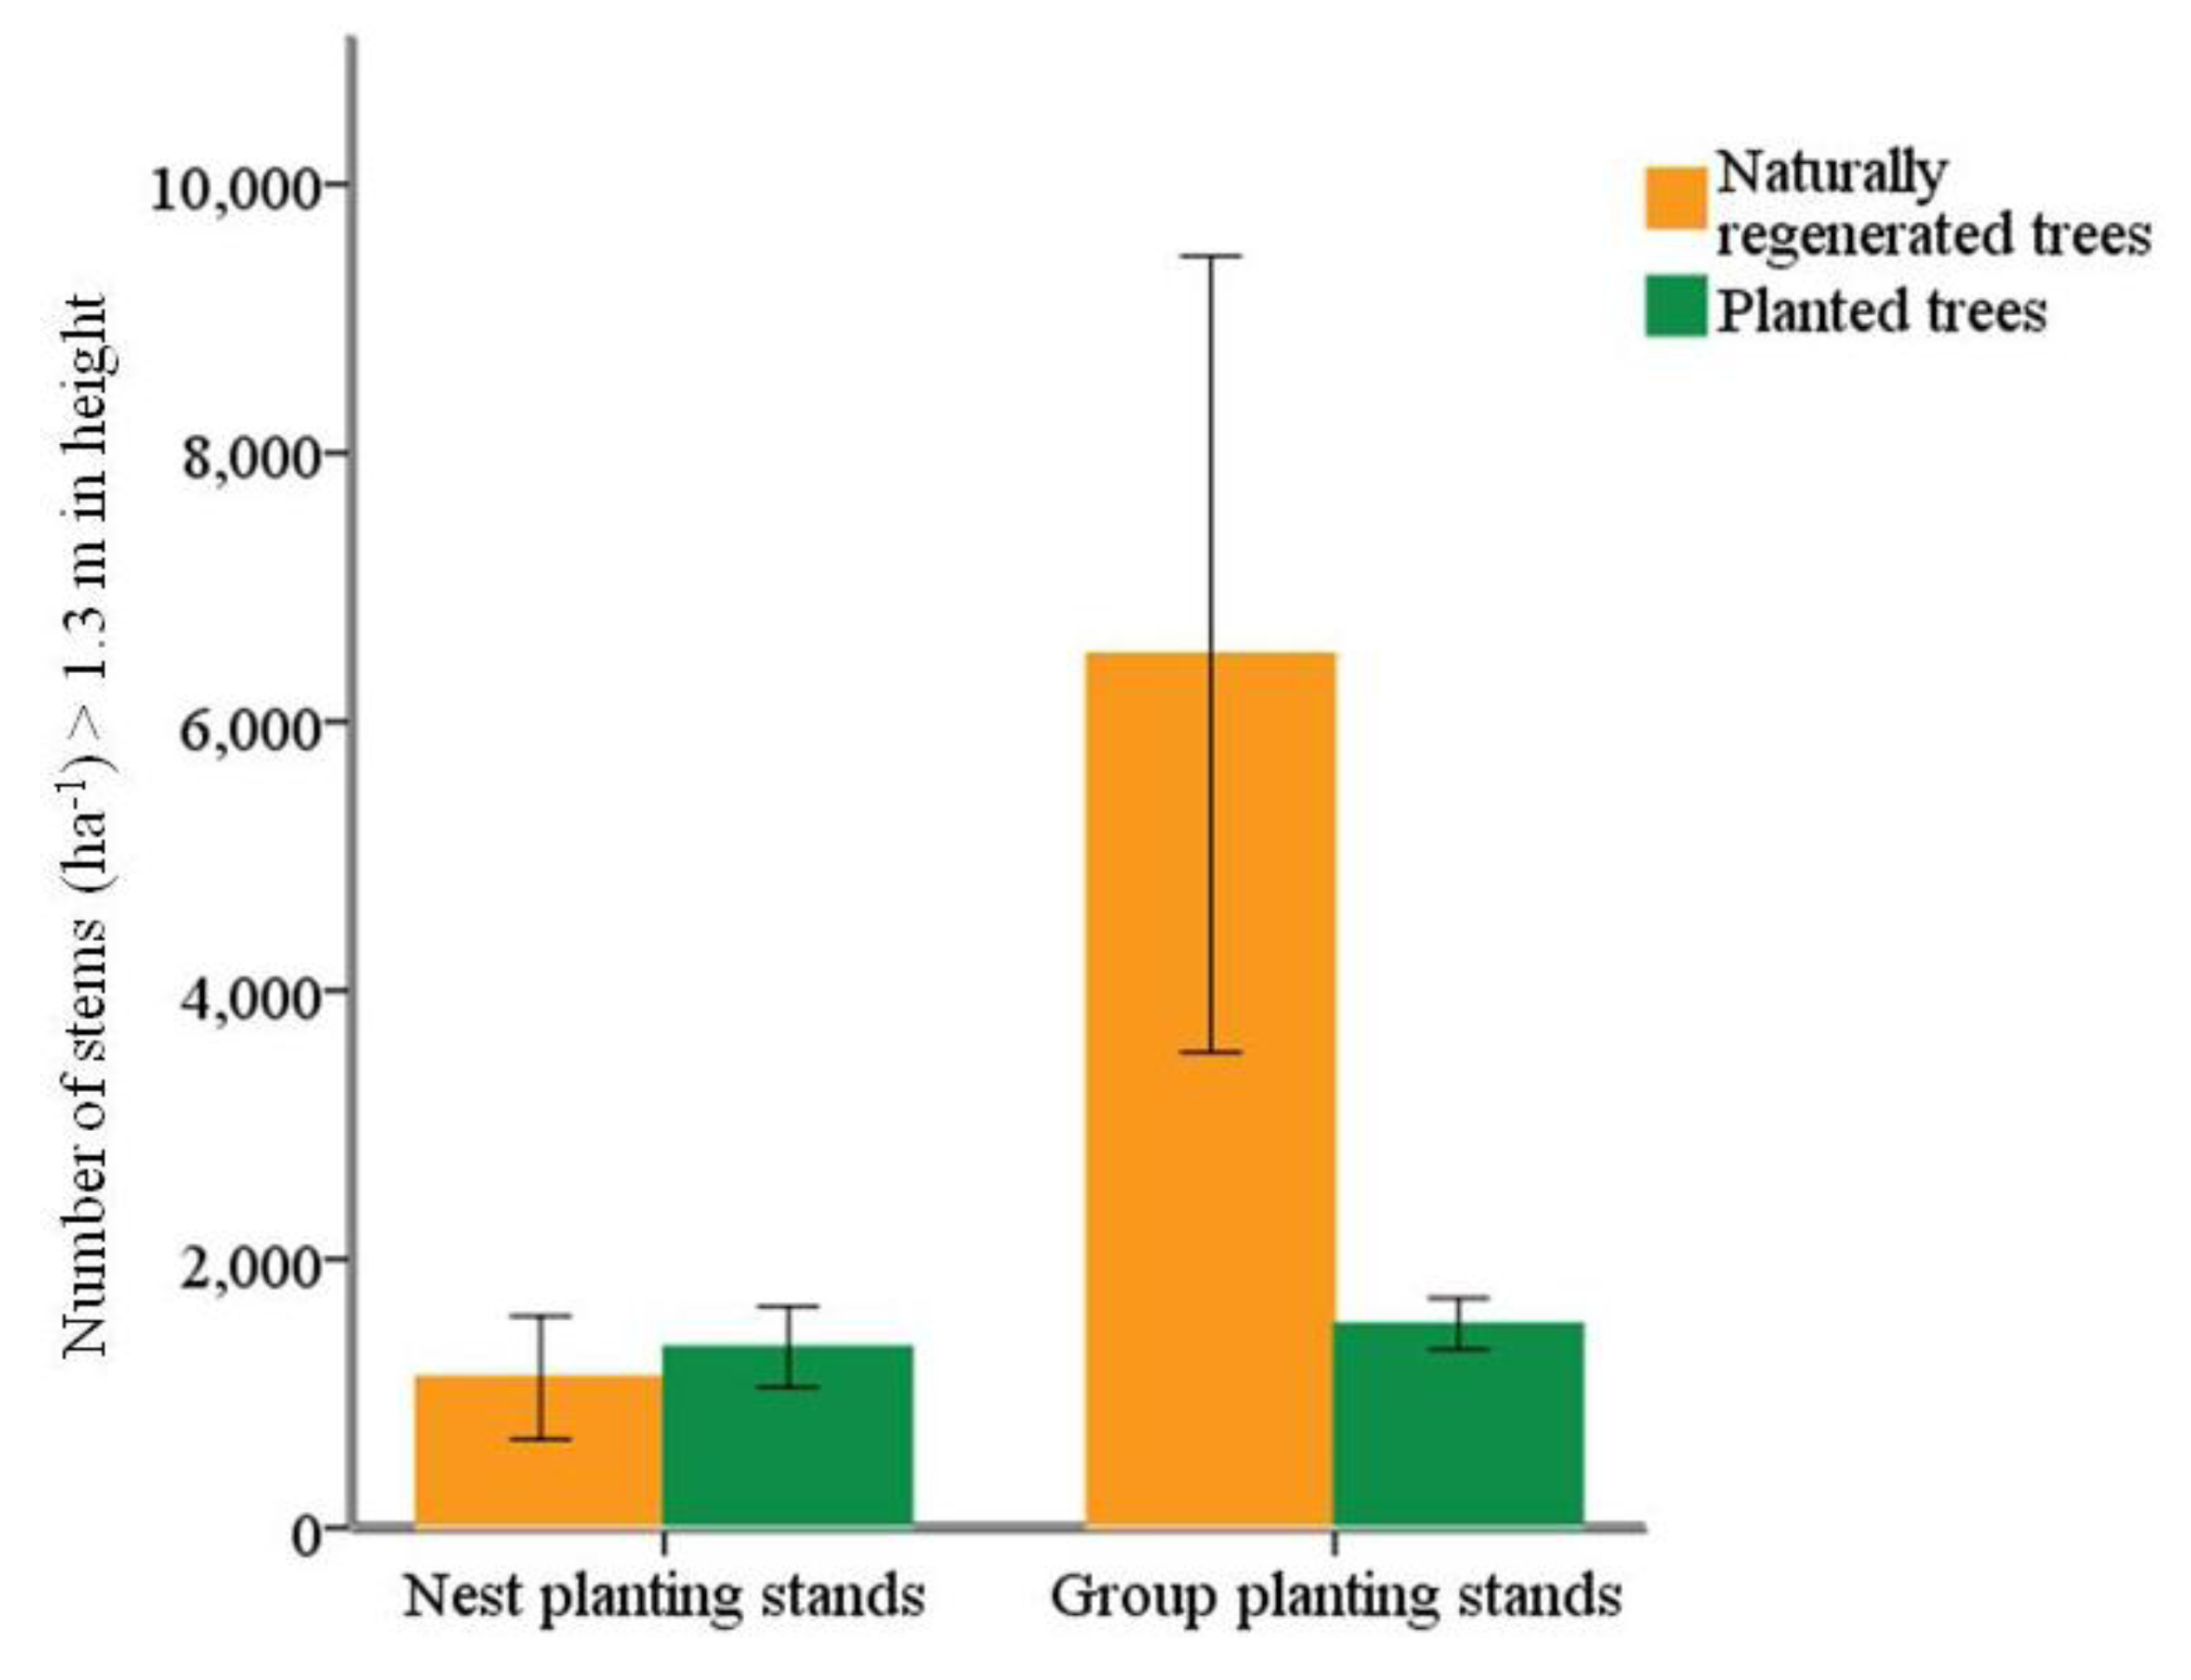
Density of natural regeneration (stems > 1.3 m height) was 1100 and 6500 stems ha−1 in nest and group planting, respectively (Figure 7). Univariate analysis of variance showed that stand basal area significantly increased with increasing density of natural regeneration in cluster planting stands. However, tree species richness or diversity had no influence on stand basal area in cluster planting stands (Table 3).
Figure 7. Density of naturally regenerated and planted trees (>1.3 m height) grown in cluster planting stands. Lines denote standard error at 95% confidence interval.
Forests 04 00650 g007
Table 3. The influence of species richness on stand basal area using tree density as a covariate (R2 = 0.41, p = 0.0838, N = 31, d.f. = degree of freedom).
Sourced.f.F valuep value
Corrected Model82.07520.0838
Intercept121.18400.0001
Density of planted trees (stems ha−1)10.96190.3374
Density of naturally regenerated tree (stems ha−1)15.77110.0252
Species richness61.19340.3462

4. Discussion

4.1. Tree Species Diversity and Stand Basal Area in Cluster and Row Planting

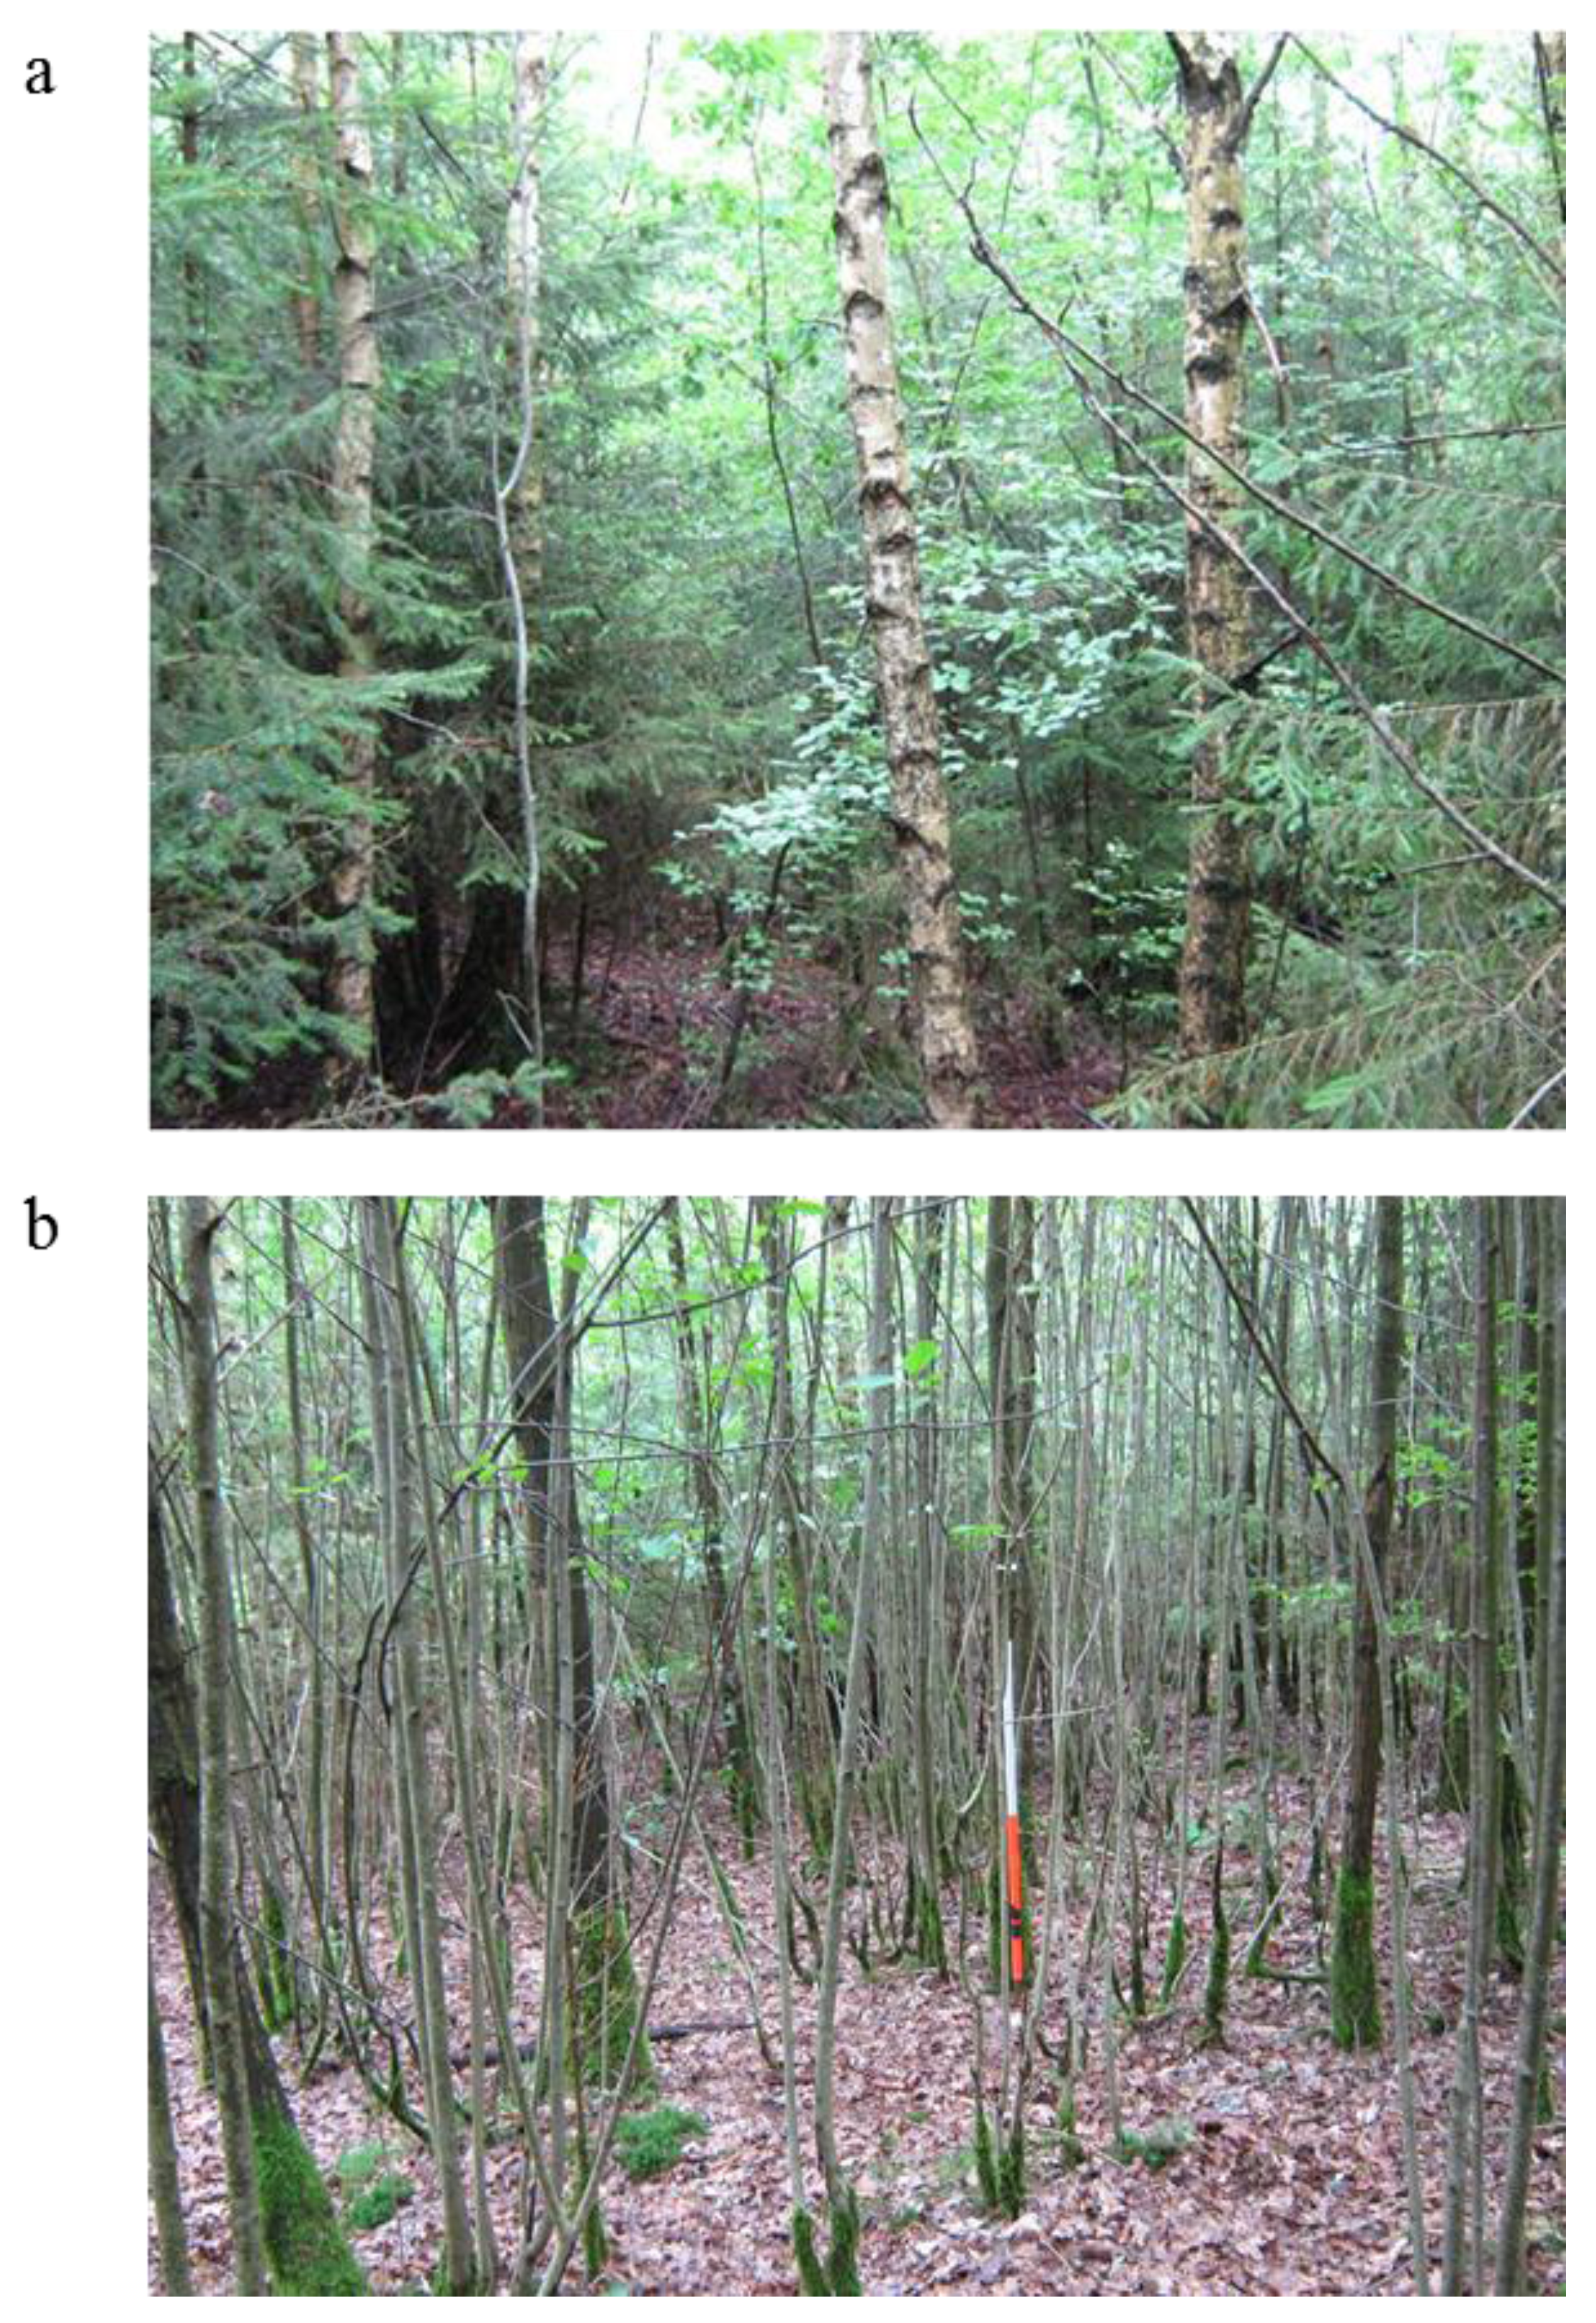
Tree species richness was significantly higher in both types of cluster planting compared to traditional row planting. This finding is in accordance with a previous study that found higher diversity of herbaceous plant species in stands established through group planting compared to row planting stands [22]. High species richness in cluster plantings may have resulted from two factors. First, unplanted interspaces between clusters provided a longer window of opportunity for the establishment of early- and mid-successional species, whereas canopies closed more quickly in the dense row plantings (Figure 8). Significant correlations between the area available for natural regeneration and the species richness and density of naturally regenerated trees supported this fact. Second, owing to the lack of site preparation in cluster plantings, old stand legacies [4] left between clusters (e.g., broken tree stumps, mounds, coarse woody debris etc.) might have provided more diverse conditions and micro-sites on the ground and thus facilitated establishment of seedlings of different species. Several studies on clear-felled and wind-thrown areas in central European temperate forests have shown that less intensive site preparation or absence of salvage logging after windthrow supported the establishment of diverse tree communities comprising early-successional woody species established [8,33], however, there are exceptions [34].
Figure 8. Natural regeneration of (a) Silver birch (Betula pendula) and Norway spruce (Picea abies); (b) European rowan (Sorbus aucuparia) between oak groups in Kaisereiche.
Forests 04 00650 g008
Cluster and row planting stands were surrounded by mature broadleaved and coniferous stands providing seeds for natural regeneration at the study sites. For example, high numbers of naturally regenerated seedlings of Picea abies in the Kaisereiche cluster planting was likely the result of its close proximity to an old Norway spruce stand, as has been found elsewhere [8]. Whether more species were found in cluster plantings than in row plantings through a more diverse seedling bank in less disturbed sites could not be ascertained in this study, in which ages of trees were not analyzed.
The prolific establishment of naturally regenerated tree species substantially increased total stand basal area in cluster plantings. Stand basal area was similar between group and row plantings, and not significantly lower in nest plantings than in row plantings. Even though in low density plantings with groups only half the number of oak seedlings (ca. 2000–2500 ha−1) were established compared to traditional row plantings (ca. 5000–6000 ha−1), total stand basal area was comparable among the two planting types with a similar rate of survival in oaks. However, as shown for a large data-set, very close initial growing space (0.04 m2 per seedling) significantly lowered the survival rate of oaks in nest plantings compared to row plantings [21]. This must have also occurred in the stands of this study in the first decade after planting. The surviving oak trees (ca. 50% of stand basal area) combined with the naturally regenerated trees between the nests produced a stand basal area that similar to row planting.

4.2. Influence of Tree Species Richness and Density on Stand Basal Area in Cluster Planting

Our study showed that in young cluster planted stands of oak trees, total stand basal area increased with the density of naturally regenerated trees. This somewhat supports our second hypothesis. Larger unplanted spaces in low density plantings allowed fast-growing and light demanding trees to establish between clusters [19,22,35]. We did not find direct evidence of tree species richness to influence stand basal area. Instead basal area depended significantly on the density of natural regeneration in unplanted spaces between clusters. Species richness may influence stand productivity in cluster plantings at a later stage of development, when greater levels of niche complementarity may develop owing to the different species traits [34]. This warrants further investigation through periodic inventories.

5. Conclusions

Our study provides the first assessment of tree species diversity and stand productivity in low-density cluster plantings established in wind-thrown and clear-felled areas across a number of sites. We demonstrated that both nest and group plantings harbour higher levels of tree species richness than traditional row planting. Of critical importance in this system of stand establishment is the area between clusters that is available for natural regeneration of other species. Effective colonization of this area not only contributes to tree species diversity, and thus, likely to resilience and adaptability of the new stands, but also to production of woody biomass and hence, carbon sequestration. Natural regeneration of early- and mid-successional species compensated for the reduced basal area production of oaks in low-density group plantings. Hence, this form of low density planting appears to combine environmental and economic benefits. The combined active and passive approach to establishing oak forests may increase resistance and adaptability to changing environmental conditions [35]. However, interactions between oaks and naturally regenerated species and their influence on susceptibility to pests and pathogens, diversity of dependent taxonomic groups and growth and timber quality of oaks at the individual tree level should be researched separately. Further research should also explore whether the naturally established trees in the interspaces offer the potential for the production of high value timber.

Acknowledgments

Somidh Saha gratefully acknowledges the receipt of a PhD scholarship from the German Academic Exchange Service (DAAD). We thank the State Forestry Administration of Rheinland-Pfalz, Georg-Ludwig-Hartig Stiftung, and the Graduate School “Environment, Society and Global Change” at Freiburg University for providing financial support. We thank Charlotte Krebs and Tamalika Chakraborty for helping in field data collection and database preparation. We also thank two anonymous reviewers for providing helpful suggestions to an earlier version of the manuscript.

Contributions of the Co-Authors

Somidh Saha and Jürgen Bauhus jointly developed the research concept and experimental design. Jürgen Bauhus provided doctoral supervision to the first author. Somidh Saha carried out the field work, and did all statistical analysis. Somidh Saha, Jürgen Bauhus and Christian Kuehne wrote the manuscript. Christian Kuehne also helped in field data collection.

Conflict of Interest

The authors declare no conflict of interest.

References

  1. Drouineau, S.; Laroussinie, O.; Birot, Y.; Terrasson, D.; Formery, T.; Roman-Amat, B. Joint Evaluation of Storms, Forest Vulnerability and Their Restoration; Discussion paper 9; European Forest Institute: Joensuu, Finland, 2000; p. 40. [Google Scholar]
  2. Gockel, H. Die Trupp-Pflanzung, Ein neues Pflanzschema zur Begründung von Eichenbeständen. Forst und Holz 1995, 50, 570–575. [Google Scholar]
  3. Ehring, A.; Keller, O. Eichen-Trupp-Pflanzung in Baden-Württemberg. AFZ/Dder Wald 2006, 9, 491–494. [Google Scholar]
  4. Swanson, M.E.; Franklin, J.F.; Beschta, R.L.; Crisafulli, C.M.; DellaSala, D.A.; Hutto, R.L.; Lindenmayer, D.B.; Swanson, F.J. The forgotten stage of forest succession: Early-successional ecosystems on forest sites. Front. Ecol. Environ. 2010, 9, 117–125. [Google Scholar]
  5. Kenk, G.K. New perspectives in German oak silviculture. Ann. Sci. For. 1993, 50, 563–570. [Google Scholar] [CrossRef]
  6. Larsen, J.B.; Nielsen, A.B. Nature-based forest management—Where are we going? Elaborating forest development types in and with practice. For. Ecol. Manag. 2007, 238, 107–117. [Google Scholar]
  7. Fischer, A.; Lindner, M.; Abs, C.; Lasch, P. Vegetation dynamics in central European forest ecosystems (near-natural as well as managed) after storm events. Folia Geobot. 2002, 37, 17–32. [Google Scholar] [CrossRef]
  8. Jonasova, M.; Vavrova, E.; Cudlin, P. Western Carpathian mountain spruce forest after a windthrow: Natural regeneration in cleared and uncleared areas. For. Ecol. Manag. 2010, 259, 1127–1134. [Google Scholar]
  9. Puettmann, K.J. Silvicultural challenges and options in the context of global change: “Simple” fixes and opportunities for new management approaches. J. For. 2011, 109, 321–331. [Google Scholar]
  10. Bauhus, J.; Schemerbeck, J. Silvicultural Options to Enhance and Use Forest Plantation Biodiversity. In Ecosystem Goods and Services from Plantation Forests; Bauhus, J., van der Meer, P., Kanninen, M., Eds.; Earthscan: London, UK, 2012; pp. 96–139. [Google Scholar]
  11. Saha, S. Development of Tree Quality, Productivity, and Diversity in Oak (Quercus robur and Q. petraea) Stands Established by Cluster Planting. Ph.D. Thesis, University of Freiburg, Freiburg, Germany, 23 November 2013. [Google Scholar]
  12. Demolis, C.; François, D.; Delannoy, L. Que sont devenues les plantations de feuillus par points d’appui? Off. Natl. For. Bull. Tech. 1997, 32, 27–37. [Google Scholar]
  13. Szymanski, S. Application of Ogijevski’s nest method of artificial regeneration of oak on fertile sites. Sylwan 1977, 121, 43–55. [Google Scholar]
  14. Szymanski, S. Die Begründung von Eichenbeständen in “Nest-Kulturen”. Forst und Holzwirt 1986, 41, 3–7. [Google Scholar]
  15. Gockel, H. Soziale und qualitative Entwicklungen sowie Z-Baumhäufigkeiten in Eichenjungbeständen. Die Entwicklung eines neuen Pflanzschemas “Die Trupppflanzung”. Ph.D. Thesis, Georg-August-Universität Göttingen, Göttingen, Germany, 1994. [Google Scholar]
  16. Saha, S.; Kühne, C.; Kohnle, U.; Bauhus, J. Eignung von Nester- und Trupppfl anzungen für die Begründung von Eichenbeständen. AFZ/Der Wald 2013, 2, 39–41. [Google Scholar]
  17. Brang, P.; Bürgi, A. Trupppflanzung im Test. Zürcher Wald 2004, 36, 13–16. [Google Scholar]
  18. Brang, P.; Kamm, S.; Mayland, J.-P. Kulturpflege auf Sturmflächen: Erhebliches Sparpotenzial. Wald und Holz 2004, 85, 54–57. [Google Scholar]
  19. Dong, P.H.; Eder, W.; Muth, M. Eichen-Nesterpflanzungsversuche in Rheinland-Pflaz—Ergebnisse eines 15jährigen Beobachtungszeitraums. In Eiche im Pfälzerwald; Forsschunganstalt für Waldökologie und Forstwirtschaft Rheinland-Pflaz: Trippstadt, Germany, 2007; pp. 4–22. [Google Scholar]
  20. Leder, B. Wachstum und qualitative Entwicklung von Eichennestern. AFZ/Der Wald 2007, 1, 420–423. [Google Scholar]
  21. Saha, S.; Kuehne, C.; Kohnle, U.; Brang, P.; Ehring, A.; Geisel, J.; Leder, B.; Muth, M.; Petersen, R.; Peter, J.; et al. Growth and quality of young oaks (Quercus robur and Q. petraea) grown in cluster plantings in central Europe: A weighted meta-analysis. For. Ecol. Manag. 2012, 283, 106–118. [Google Scholar]
  22. Rock, J.; Gockel, H.; Schulte, A. Vegetationsdiversität in Eichen-Jungwüchsen aus unterschiedlichen Pflanzschemata. Beitr. Forstwirtsch. u. Landsch. ökol. 2003, 37, 11–17. [Google Scholar]
  23. Michéli, E.; Schad, P.; Spaargared, O.; Dent, D.; Nachtergaele, F. World Reference Base for Soil Resources; Food and Agricultural Organization of the United Nations: Rome, Italy, 2006; p. 128. [Google Scholar]
  24. Nutto, L. Neue Perspektiven für die Begründung und Pflege von jungen Eichenbeständen. Ergebnisse einer Untersuchung zur Kronenentwicklung, Astreinigung und Dickenwachstum junger Stiel- und Traubeneichen in Europa. Freibg. Forstl. Forsch. 1999, 5, 147–150. [Google Scholar]
  25. Dubravac, T. Regularity of Growth of Crown Structures of Peduncled Oak and Common Hornbeam Depending on DBH and Age in Carpino Betuli-Quercetum Roboris Anic et Raus 1969 Community. Ph.D. Thesis, Zagreb University, Zagreb, Croatia, 15 September 2002. [Google Scholar]
  26. Dubravac, T. Developmental dynamics of crown diameters in peduncled oak and common hornbeam related to diameter brest height and age. Rad. Sumar. Inst. 2003, 38, 35–54. [Google Scholar]
  27. Piboule, A.; Collet, C.; Frochot, H.; Dhote, J.F. Reconstructing crown shape from stem diameter and tree position to supply light models. I. Algorithms and comparison of light simulations. Ann. For. Sci. 2005, 62, 645–657. [Google Scholar] [CrossRef]
  28. Vanclay, J.K. Assessing site productivity in tropical moist forests—A review. For. Ecol. Manag. 1992, 54, 257–287. [Google Scholar] [CrossRef]
  29. Sverdrup-Thygeson, A.; Skarpaas, O.; Odegaard, F. Hollow oaks and beetle conservation: The significance of the surroundings. Biodivers. Conserv. 2010, 19, 837–852. [Google Scholar] [CrossRef]
  30. Gotelli, N.J.; Colwell, R.K. Quantifying biodiversity: Procedures and pitfalls in the measurement and comparison of species richness. Ecol. Lett. 2001, 4, 379–391. [Google Scholar] [CrossRef]
  31. R Development Core Team, R: A Language and Environment for Statistical Computing; 2.14.0; R Foundation for Statistical Computing: Vienna, Austria, 2011.
  32. IBM, IBM® SPSS® Statistics; Version 20; IBM Corporation: Somers, NY, USA, 2012.
  33. Wohlgemuth, T.; Kull, P.; Wüthrich, H. Disturbance of microsites and early tree regeneration after windthrow in Swiss mountain forests due to the winter storm Vivian 1990. For. Snow Landsc. Res. 2002, 77, 17–47. [Google Scholar]
  34. Priewasser, K. Factors Influencing Tree Regeneration after Windthrow in Swiss Forests. Ph.D. Thesis, ETH-Zurich, Zurich, Switzerland, 2013. Available online: http://www.wsl.ch/fe/walddynamik/projekte/windwurf_ch/index_EN (accessed on 8 August 2013). [Google Scholar]
  35. Gockel, H.; Rock, J.; Schulte, A. Aufforsten mit Eichen-Trupppflanzungen. AFZ/Der Wald 2001, 5, 223–226. [Google Scholar]