Aboveground Tree Biomass for Pinus ponderosa in Northeastern California

Abstract
:1. Introduction
2. Methods

| Treatment | Sample Size | dbh (cm) | Height (m) | cr | BAp (m2 ha−1) | BAc (m2 ha−1) |
|---|---|---|---|---|---|---|
| U | 21 | 32.8 | 17.3 | 0.54 | – | 66 |
| T2 | 29 | 33.3 | 15.2 | 0.59 | 66 | 16 |
| T8 | 21 | 33.3 | 14.8 | 0.62 | 64 | 17 |
| T10 | 8 | 30.1 | 14.8 | 0.61 | 42 | 18 |
| Section | Branch | Wood | Foliage | ||||||
|---|---|---|---|---|---|---|---|---|---|
| Diameter | Weight | Weight | |||||||
| min. | mean | max. | min. | mean | max. | min. | mean | max. | |
| 1 | 13 | 41 | 70 | 33 | 1122 | 4241 | 16 | 403 | 1425 |
| 2 | 8 | 36 | 83 | 4 | 1186 | 7477 | 5 | 437 | 3322 |
| 3 | 7 | 34 | 80 | 3 | 891 | 6379 | 5 | 388 | 2507 |
| 4 | 11 | 32 | 53 | 21 | 417 | 1536 | 18 | 281 | 964 |
| 5 | 9 | 23 | 39 | 6 | 116 | 489 | 11 | 135 | 412 |
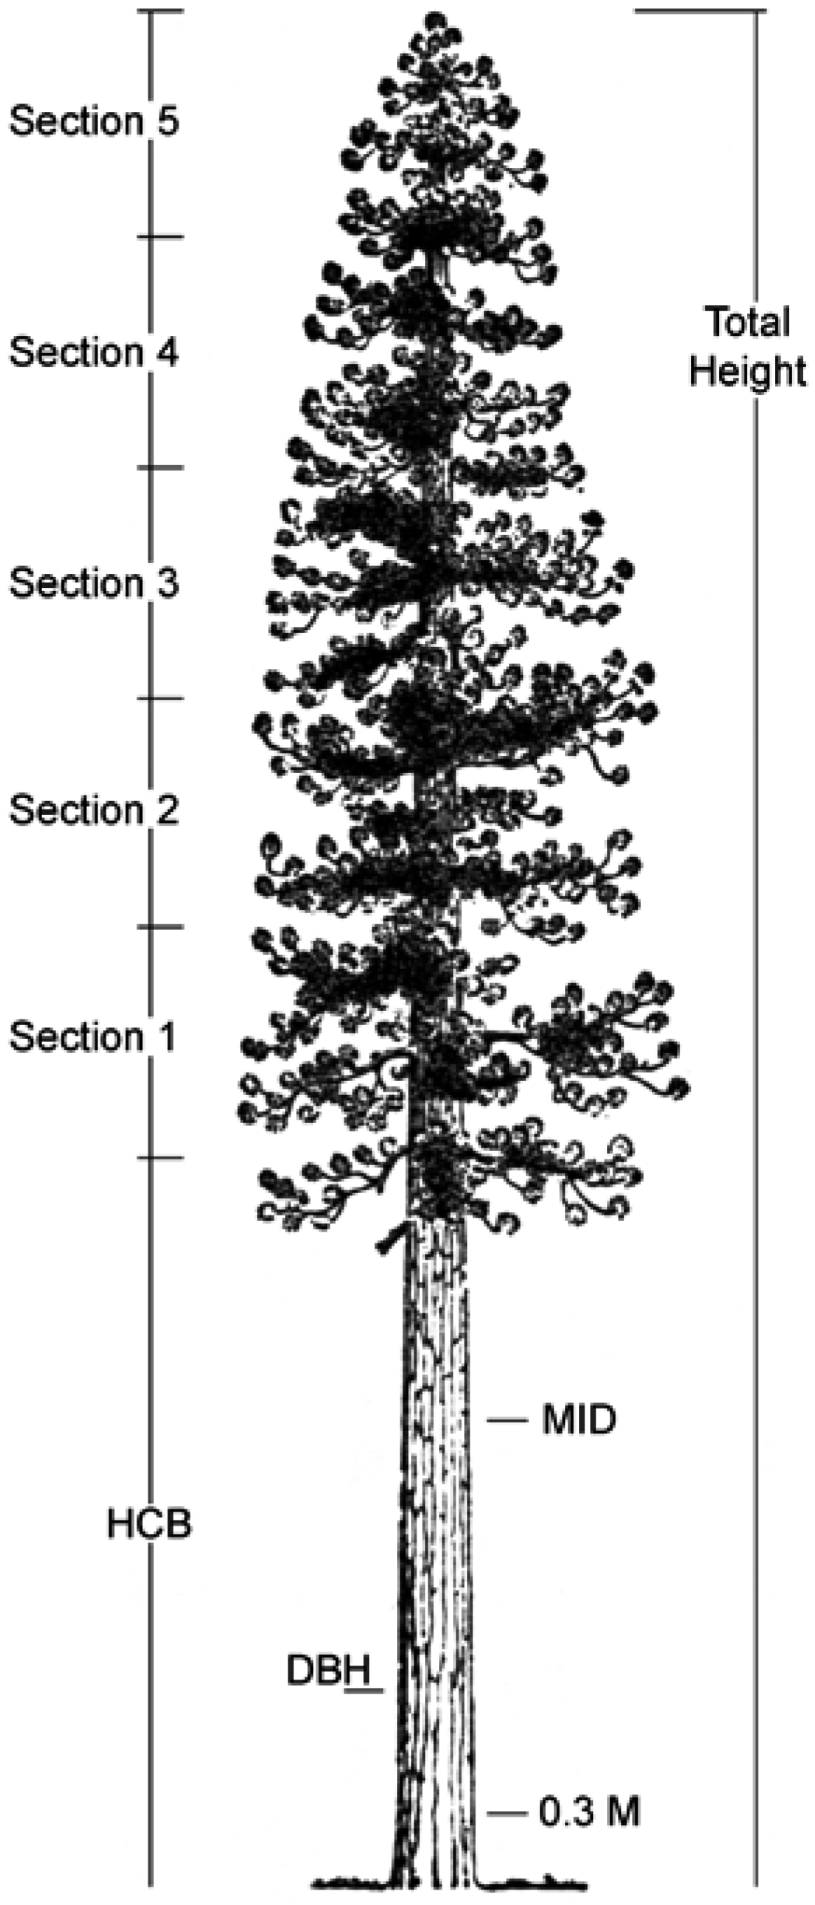
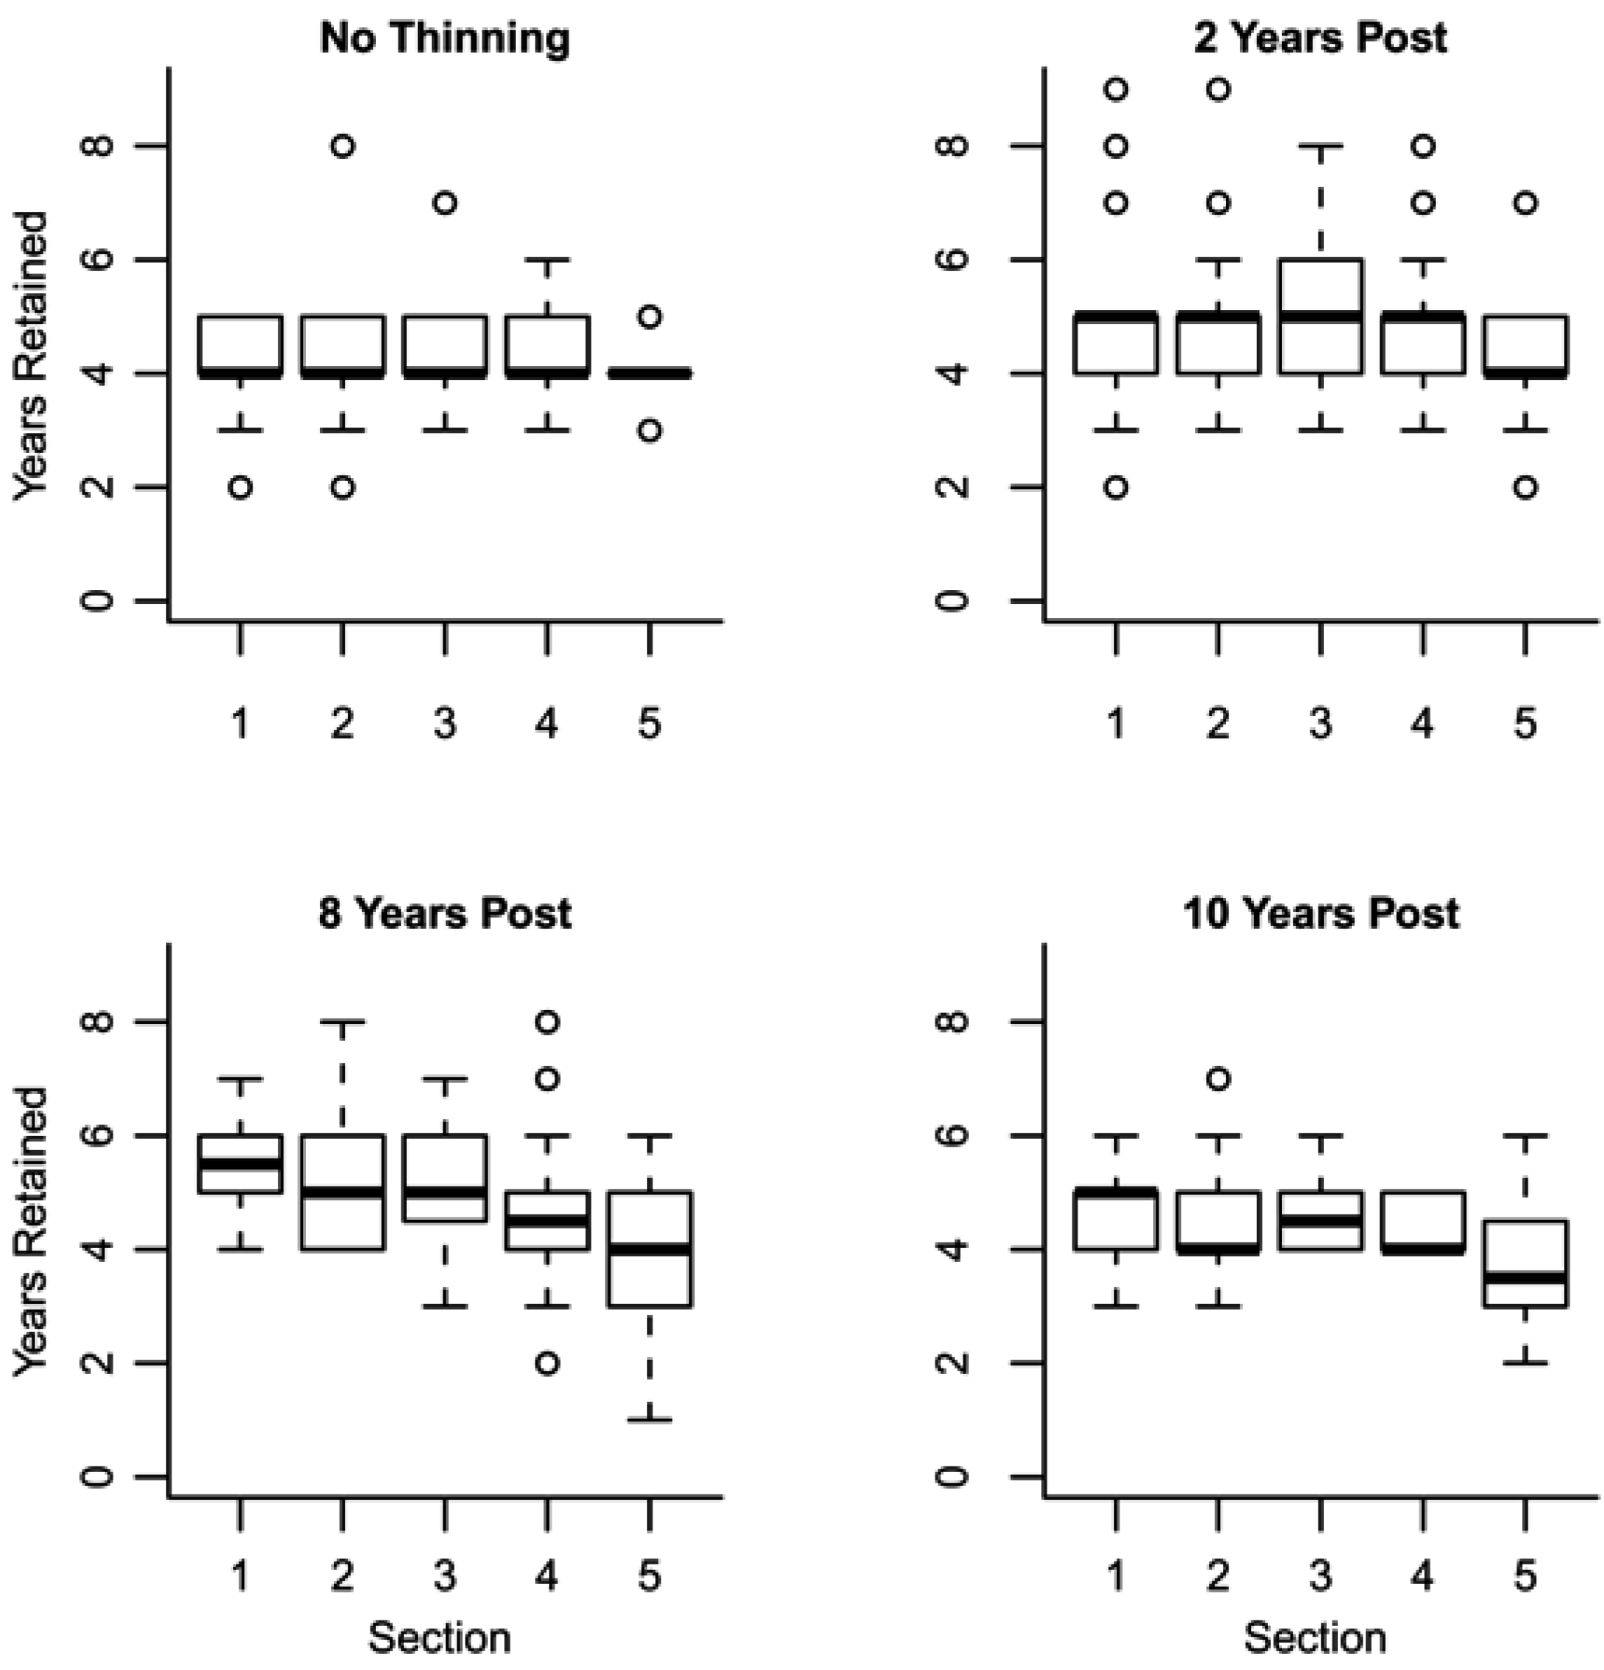
2.1. Branch Wood and Foliage Biomass
 .
.
 .
.2.2. Tree Biomass


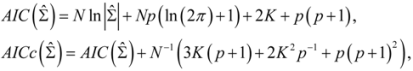
 , N is sample size, p is number of models in the system, and K is the number of system parameters estimated (including covariance terms).
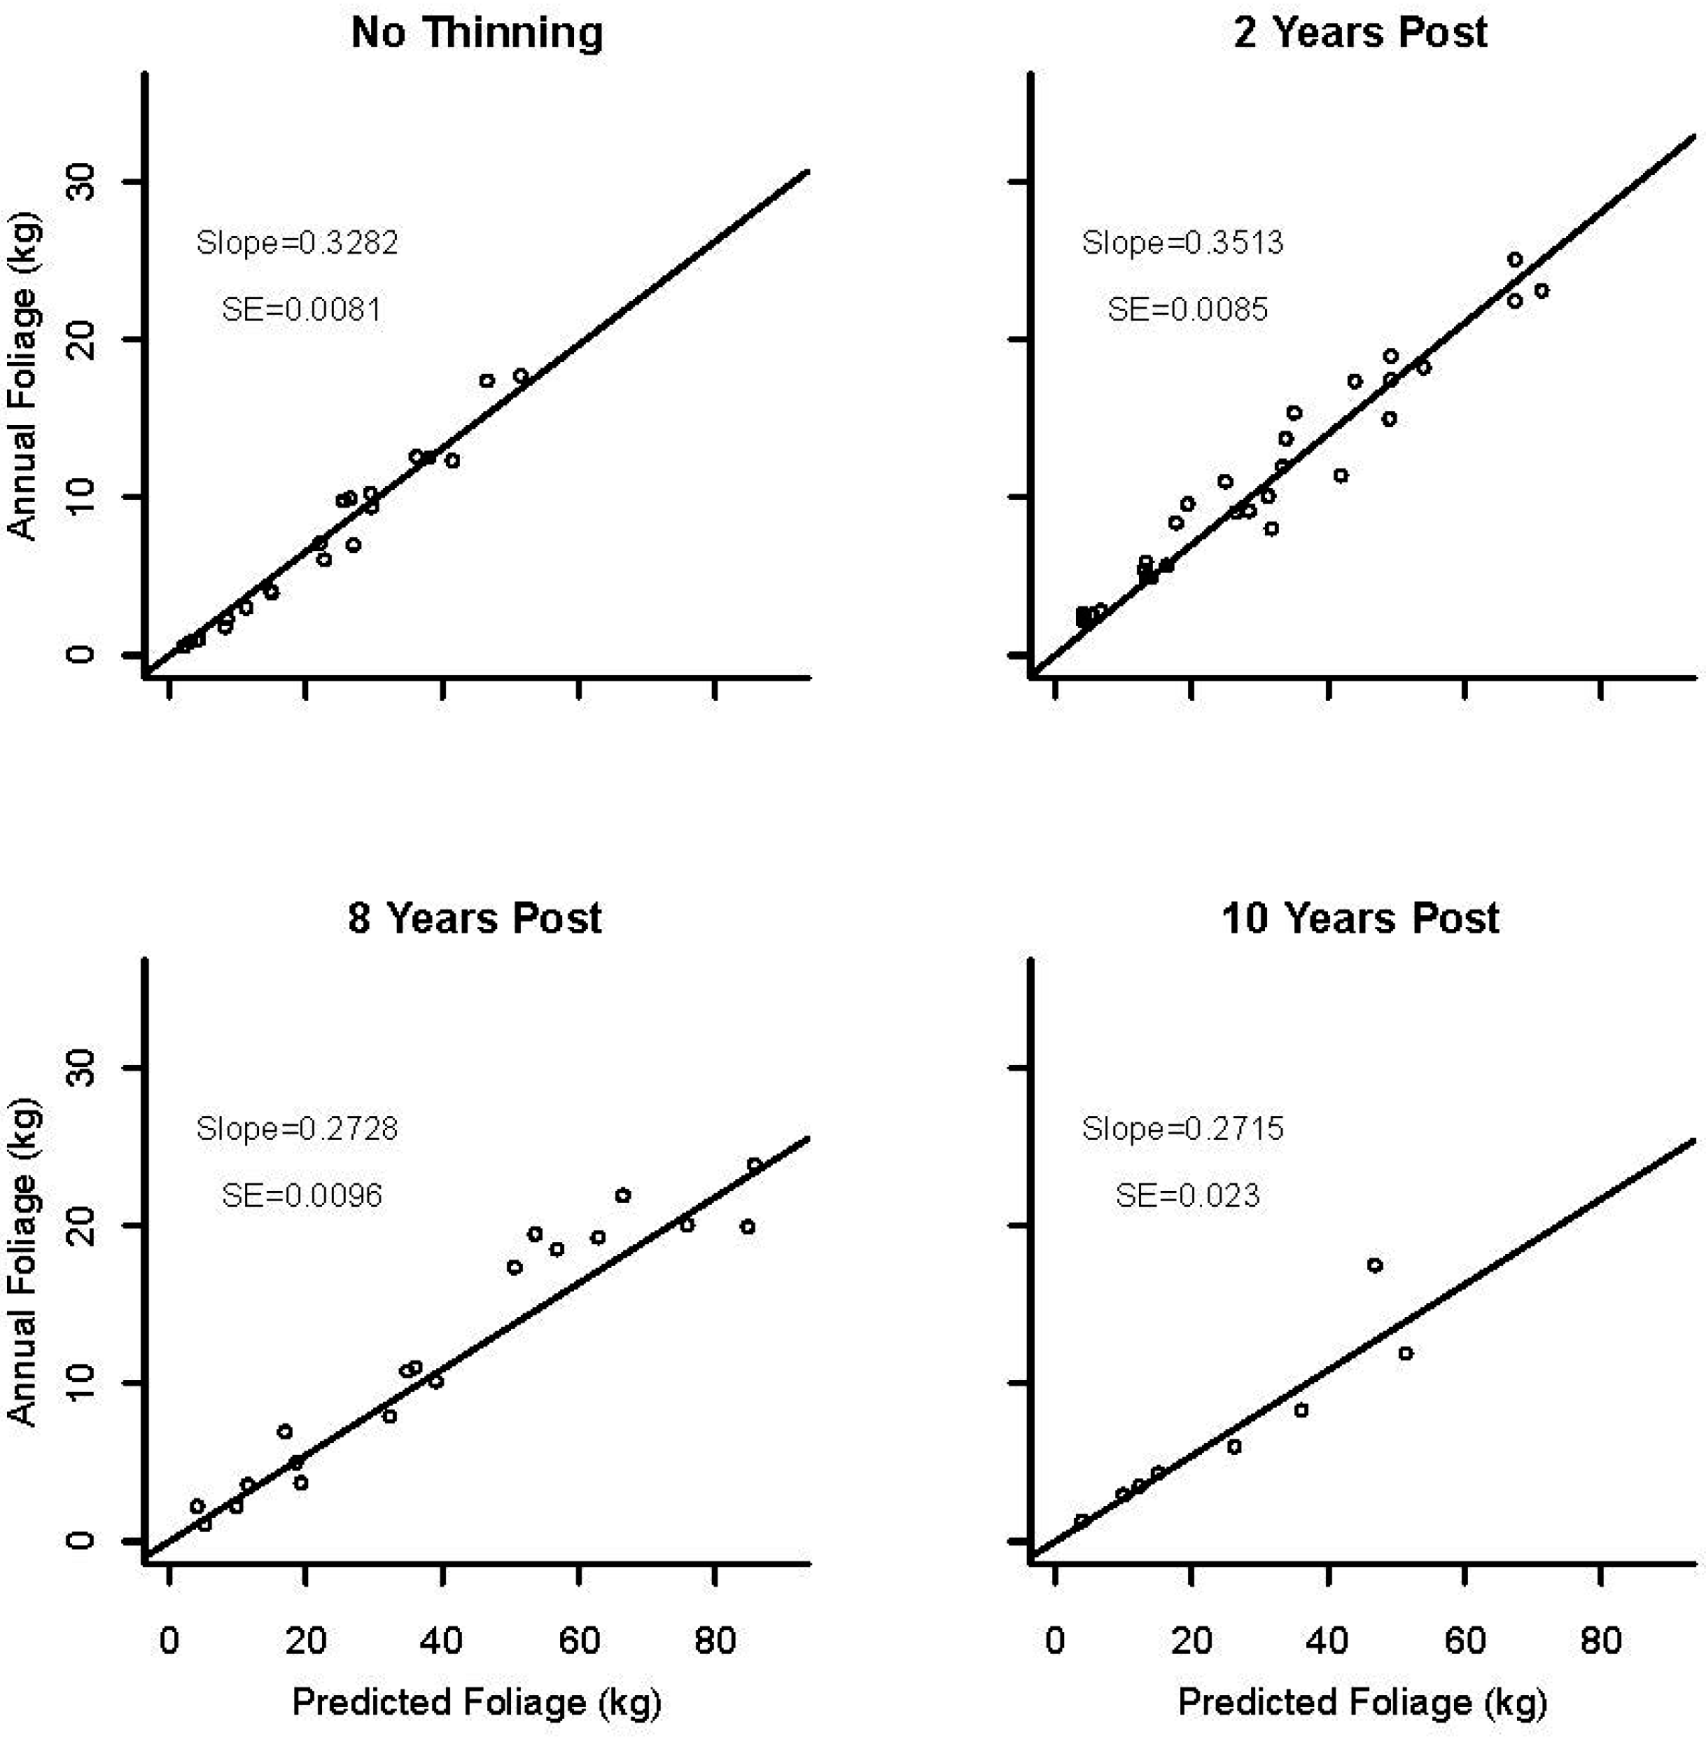
2.3. Foliage Production

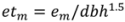
 is the predicted branch total from model 1. Indicator variables were used for sections and treatment: i1t = 1 for Sections 1–3, 0 otherwise; i2t = 1 for Section 4, 0 otherwise; i3t = 1 for Section 5, 0 otherwise. The branch-level error term assumed to have variance proportional to prediction, . This model was then used to estimate the amount of current annual foliage production for each tree by summation over all branches.
2.4. Application
3. Results and Discussion
3.1. Branch Wood and Foliage Biomass
| Stand | U | T2 | T8 | T10 |
|---|---|---|---|---|
| Foliage | ||||
| k1 | 0.1658 (0.033) | 0.2048 (0.033) | 0.1383 (0.030) | 0.1654 (0.044) |
| k2 | 2.0136 (0.054) | 2.0170 (0.044) | 2.2260 (0.056) | 2.0614 (0.075) |
 | 1.61 | 1.32 | 1.91 | 1.14 |
| n | 136 | 187 | 134 | 56 |
| Wood | ||||
| q1 | 0.0319 (0.0043) | 0.0221 (0.0029) | 0.0161 (0.0029) | 0.0209 (0.0043) |
| q2 | −0.0181 (0.0033) | −0.0120 (0.0021) | −0.0075 (0.0019) | −0.0112 (0.0032) |
| q3 | 2.7674 (0.034) | 2.8448 (0.034) | 2.9366 (0.045) | 2.8861 (0.053) |
| | 0.741 | 0.813 | 1.151 | 0.654 |
| n | 136 | 187 | 134 | 56 |
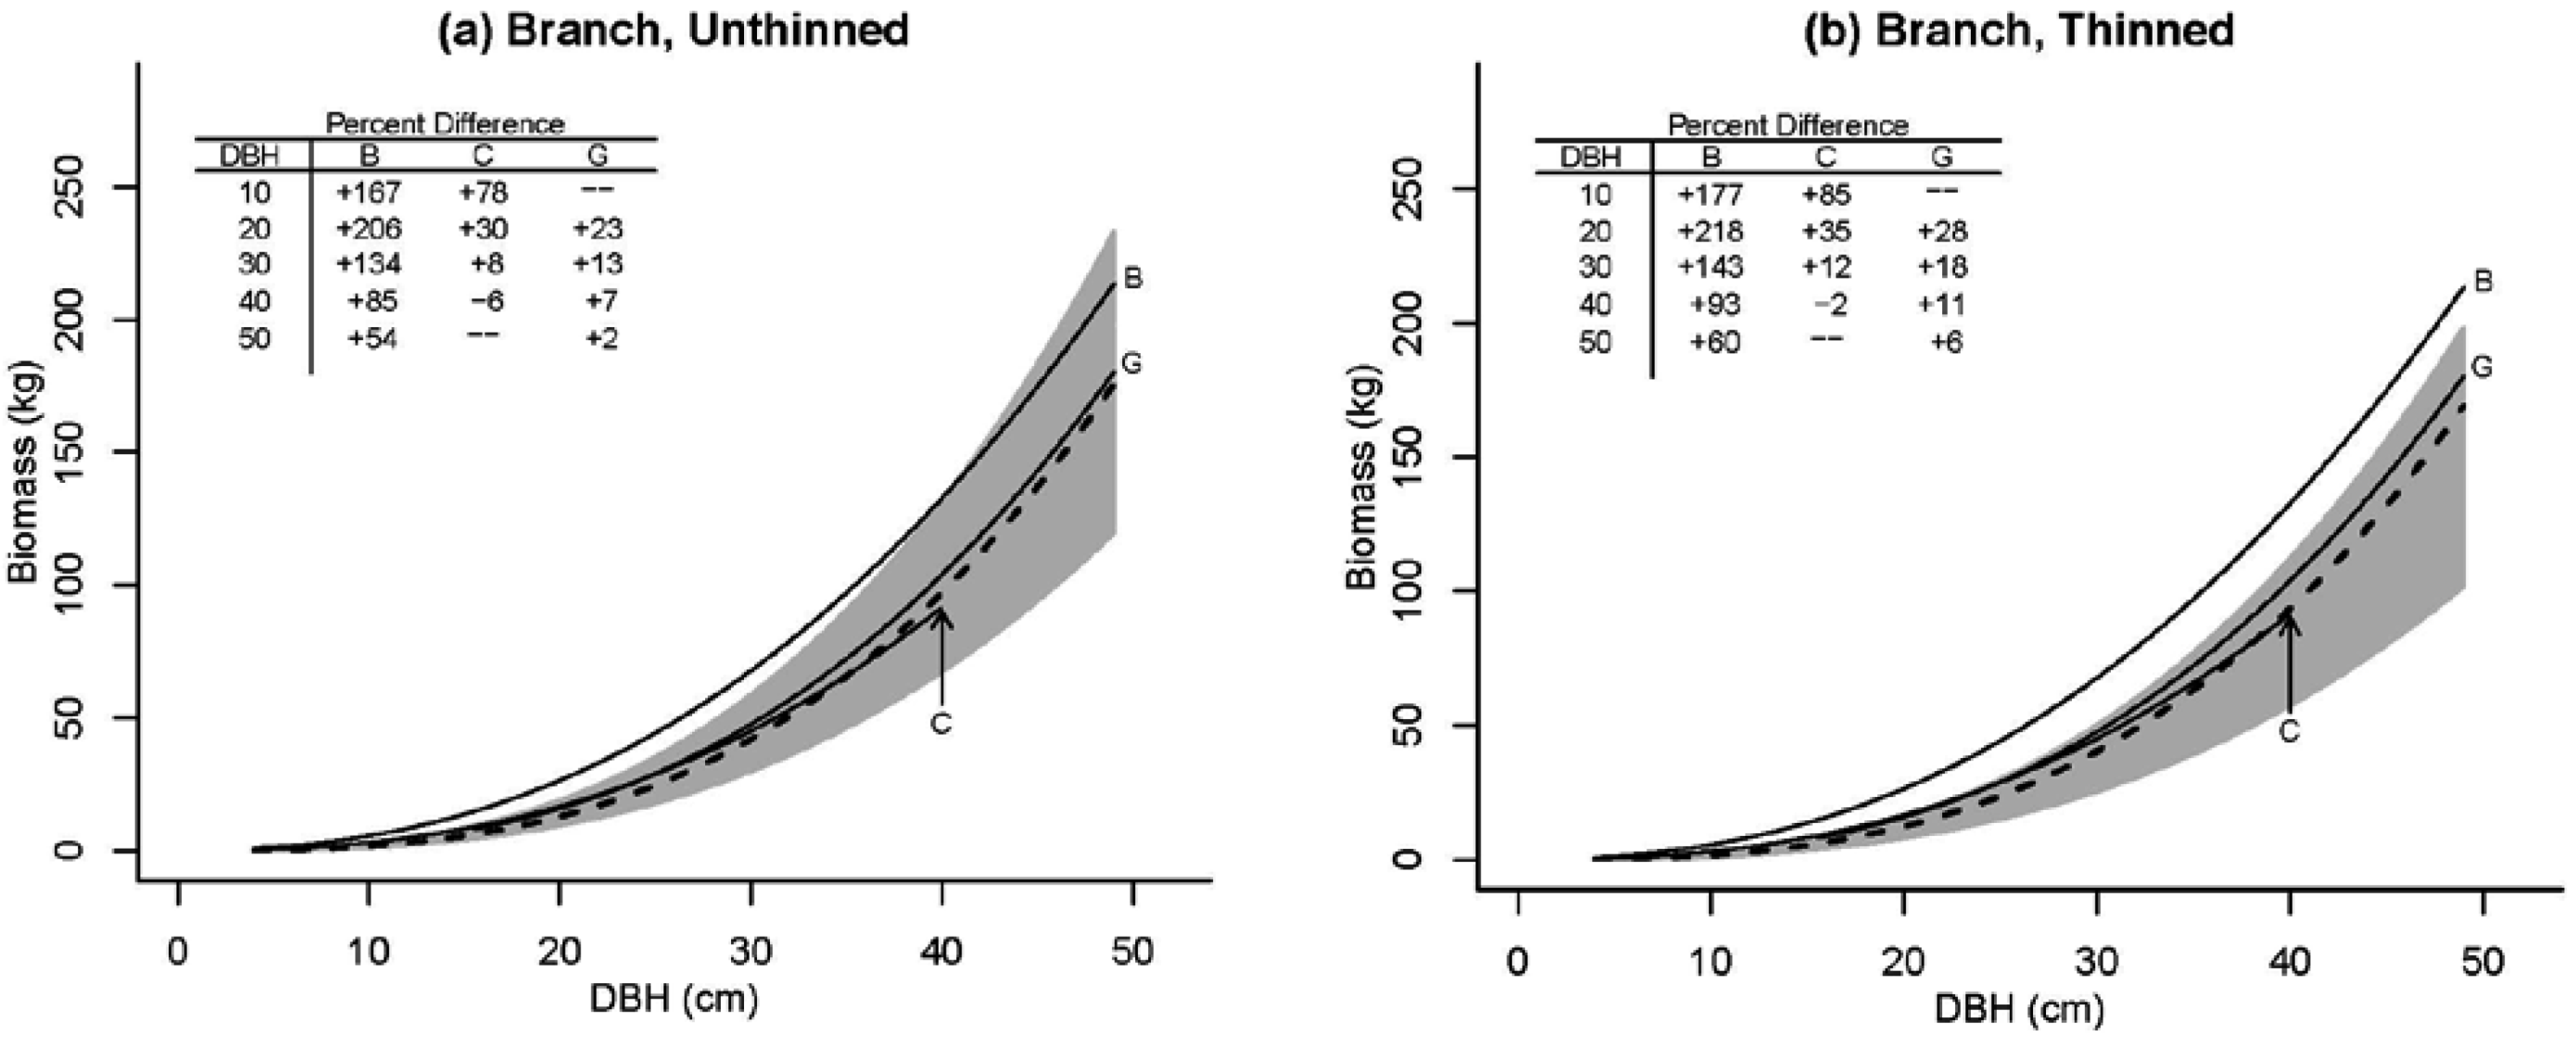
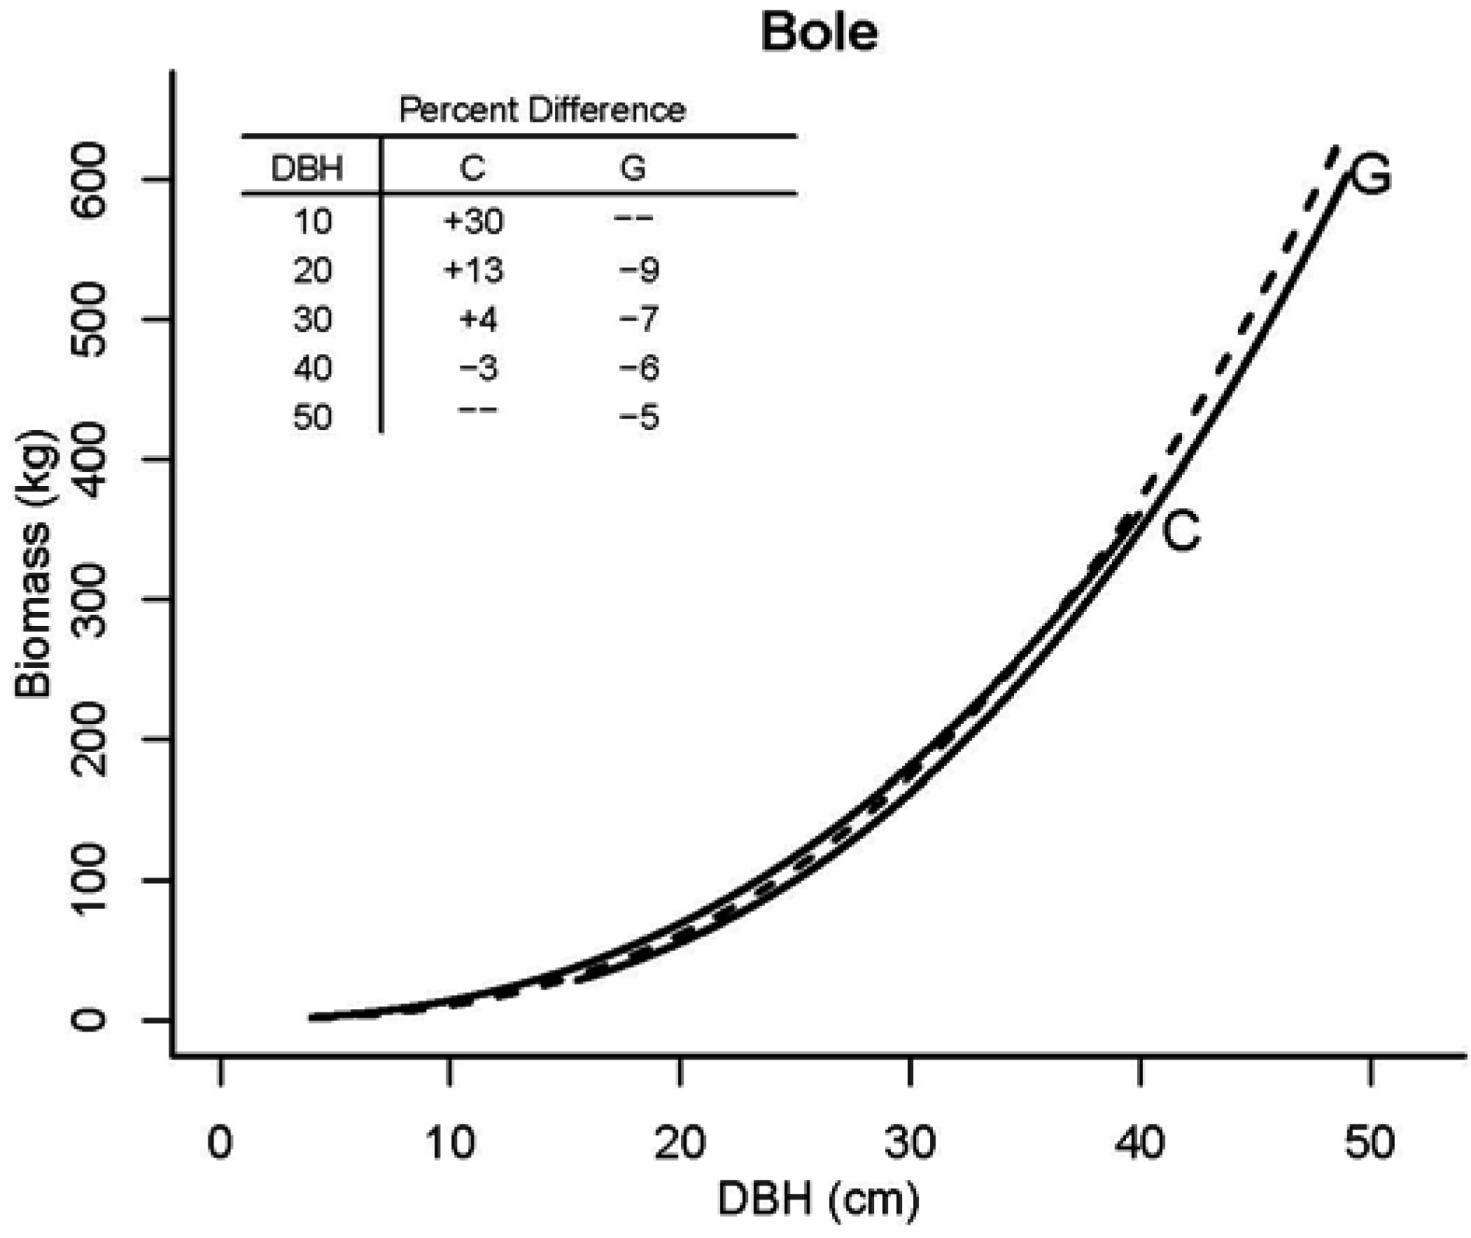
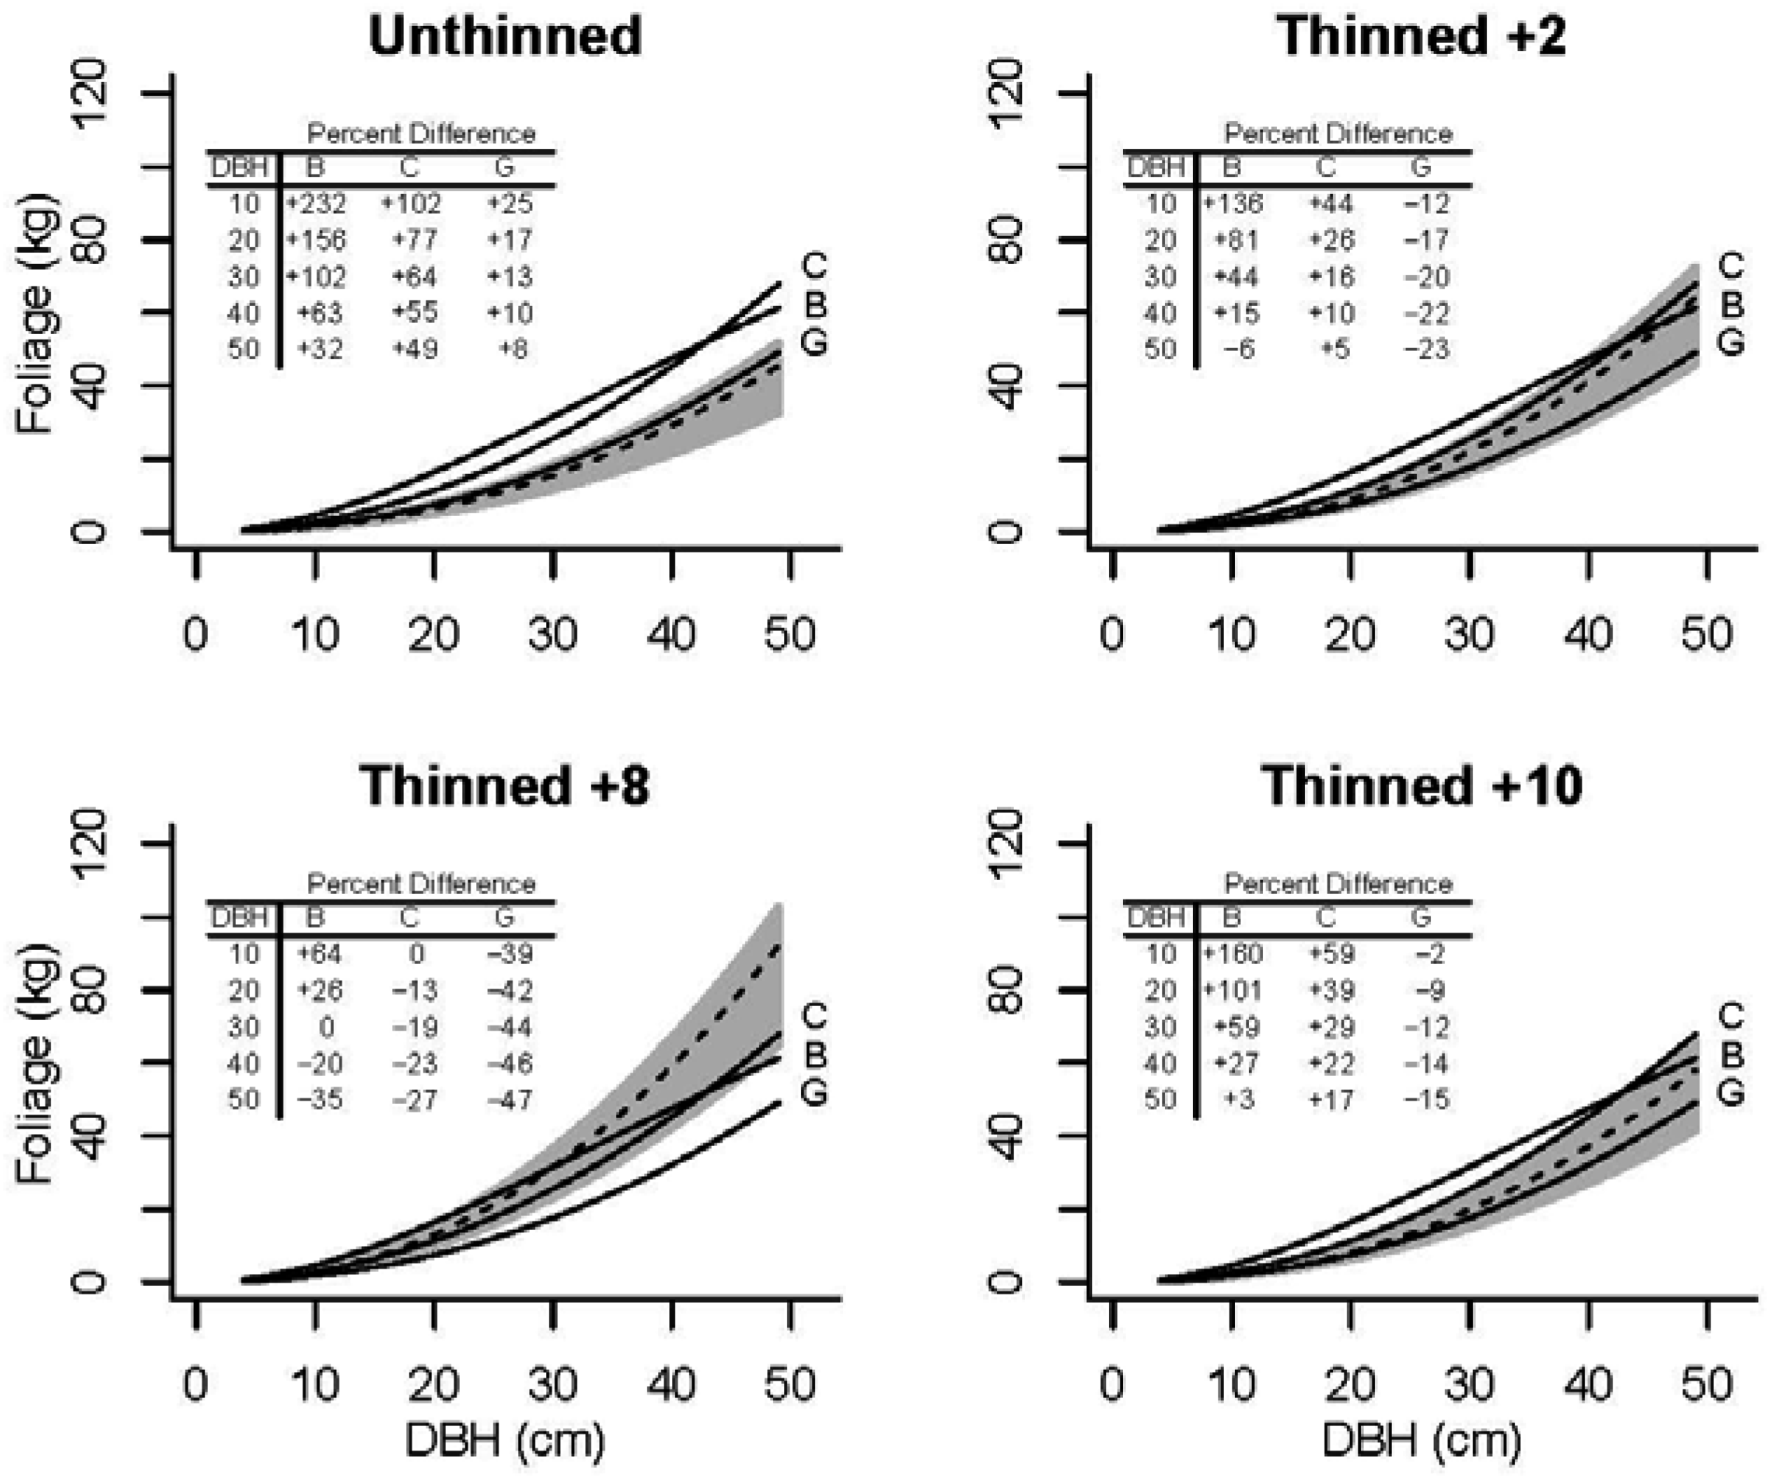
3.2. Tree Biomass


| Model | Parameter | Model 5 | S.E. | Model 6 | S.E. |
|---|---|---|---|---|---|
| foliage | a00 | 1.66802 | 0.230 | 2.29770 | 0.237 |
| a01 | 0.20355 | 0.055 | 0.29450 | 0.065 | |
| a02 | 0.55652 | 0.054 | 0.65466 | 0.062 | |
| a03 | 0.10737 | 0.063 | 0.18726 | 0.074 | |
| a04 | 1.68907 | 0.232 | – | – | |
| a1 | 2.08727 | 0.055 | 2.17566 | 0.063 | |
| branch | b00 | −0.15537 | 0.419 | 0.69671 | 0.429 |
| b01 | −0.16062 | 0.054 | −0.03770 | 0.061 | |
| b04 | 2.20682 | 0.332 | – | – | |
| b1 | 2.81810 | 0.101 | 2.92409 | 0.114 | |
| bole | c00 | −2.73498 | 0.316 | −2.97351 | 0.344 |
| c1 | 1.47812 | 0.062 | 1.44091 | 0.066 | |
| c2 | 1.34334 | 0.065 | 1.39323 | 0.069 |


3.3. Foliage Production


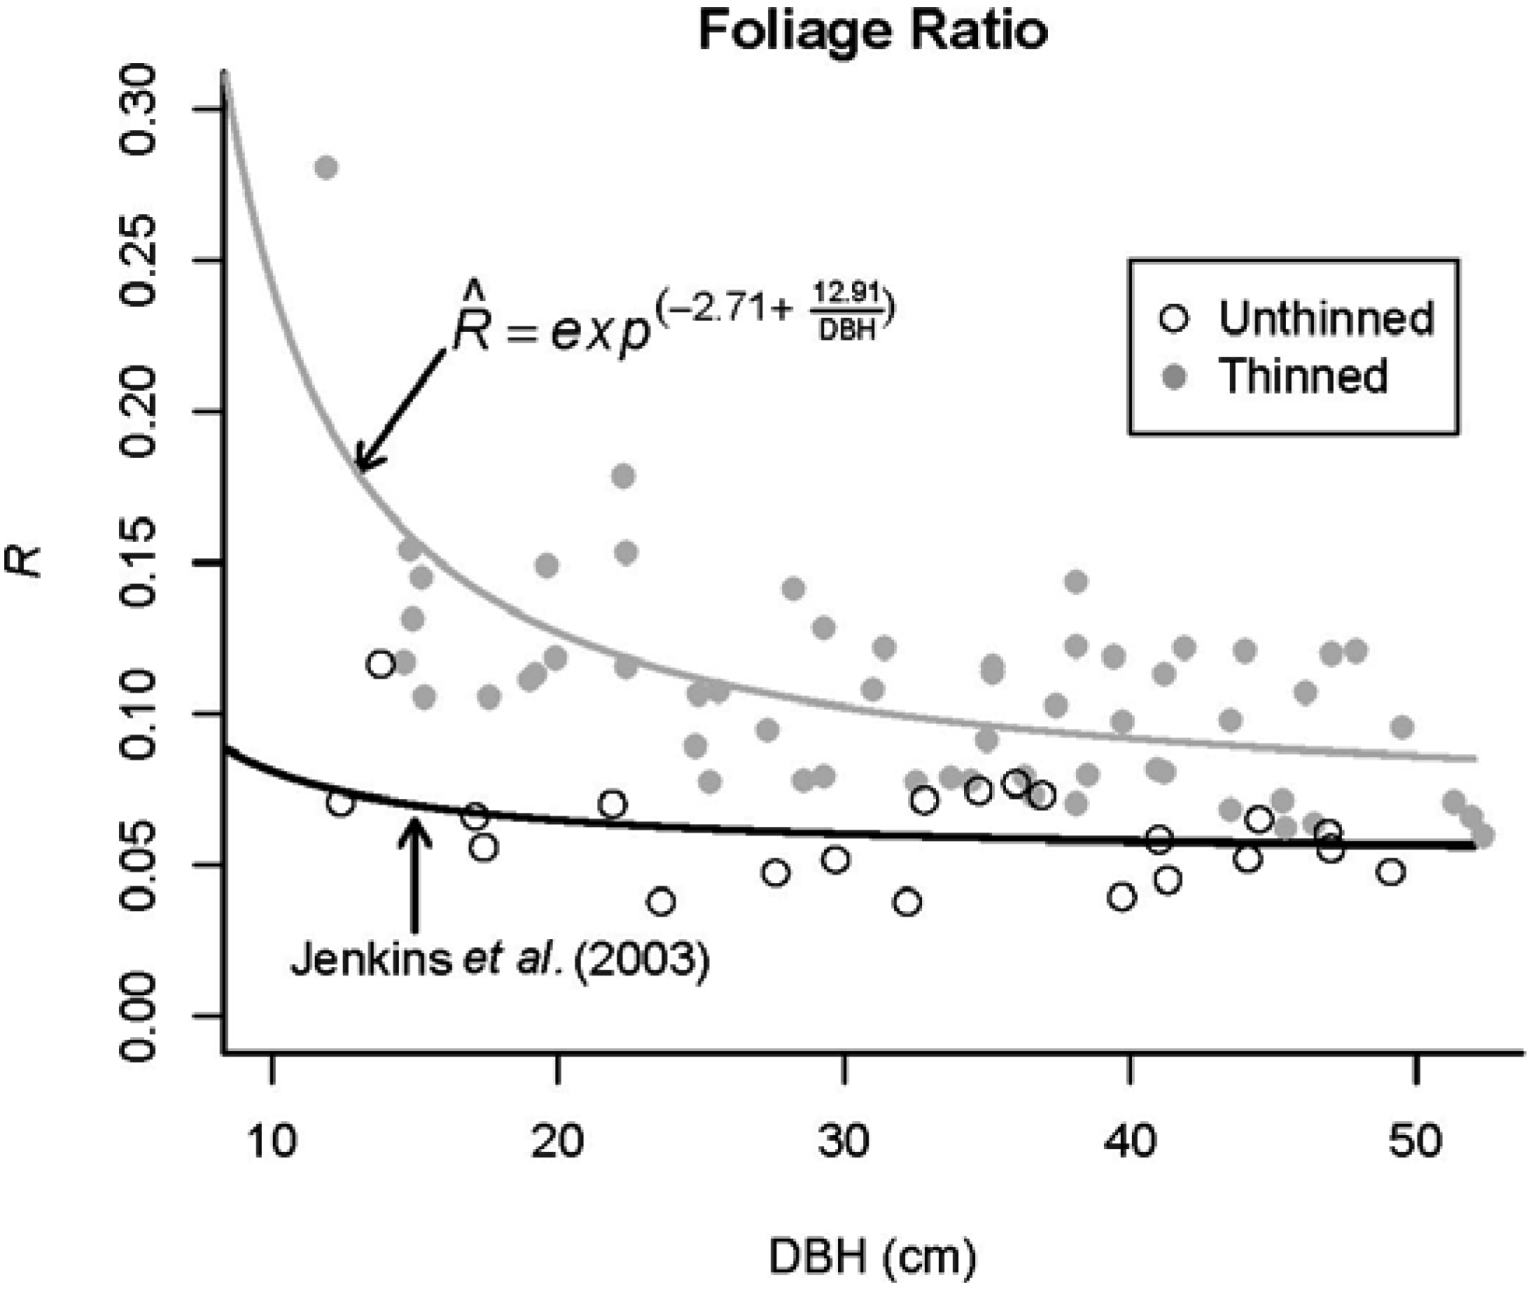
3.4. Application
| Condition | BA(m2 ha−1) | QMD (cm) | FW (Mg ha−1) | BW (Mg ha−1) | Annual(Mg ha−1) |
|---|---|---|---|---|---|
| Pre-Thin (I. = 0) | 53.5 | 18.8 | 12.0 | 29.4 | 4.0 |
| Post-Thin (I2 = 1) | 10.6 | 34.9 | 2.5 | 8.1 | 0.8 |
| Thin + 5 year (I2 = 1) | 11.9 | 37.1 | 3.9 | 9.1 | 1.0 |
| Thin + 5 year (I. = 0) | 2.9 | 9.5 | 0.8 |


4. Conclusions
Acknowledgments
Conflict of Interest
References
- Birdsey, R.A. Carbon Storage and Accumulation in United States Forest Ecosystems; General Technical Report GTR-WO-59; USDA Forest Service: Washington, DC, USA, 1992.
- Law, B.E.; Thornton, P.E.; Irvine, J.; Anthoni, P.M. Carbon storage and fluxes in ponderosa pine forests at different developmental stages. Glob. Chang. Biol. 2001, 7, 755–777. [Google Scholar] [CrossRef]
- Keane, R.E.; Reinhardt, E.D.; Scott, J.; Gray, K.; Reardon, J. Estimating forest canopy bulk density using six indirect methods. Can. J. For. Res. 2005, 3, 724–739. [Google Scholar]
- Rothermel, R.C. A Mathematical Model for Predicting Fire Spread; Research Paper INT-115; USDA Forest Service Intermountain Forest and Range Experiment Station: Ogden, UT, USA, 1972.
- Rothermel, R.C. How to Predict the Spread and Intensity of Forest and Range Fires; Technical Report INT-143; USDA Forest Service, Intermountain Forest and Range Experiment Station: Ogden, UT, USA, 1983.
- Fitzgerald, S.A. Fire Ecology of Ponderosa Pine and the Rebuilding of Fire Resilient Ponderosa Pine Ecosystems. In Proceedings of the Symposium on Ponderosa Pine: Issues, Trends and Management, Klamath Falls, OR, USA, 18–21 October 2004; Ritchie, M.W., Maguire, D.A., Youngblood, A., Eds.; USDA Forest Service, Pacific Southwest Research Station: Albany, CA, USA, 2005; pp. 207–225. [Google Scholar]
- Agee, J.K.; Skinner, C.N. Basic principles of forest fuel reduction treatments. For. Ecol. Manag. 2005, 211, 83–96. [Google Scholar] [CrossRef]
- Skinner, C.N.; Taylor, A.H. Southern Cascades Bioregion. In Fire in California’s Ecosystems; Sugihara, N.G, van Wagtendonk, J.W., Shaffer, K.E., Fites-Kaufman, J., Thode, A.E., Eds.; University of California Press: Berkeley, CA, USA, 2006; pp. 195–224. [Google Scholar]
- Affleck, D.L.R.; Keyes, C.R.; Goodburn, J.M. Conifer crown fuel modeling: Current limits and potential for improvement. West. J. Appl. For. 2012, 4, 165–169. [Google Scholar] [CrossRef]
- Christensen, G.A.; Campbell, S.J.; Fried, J.S. California’s Forest Resources, 2001–2005: Five-Year Forest Inventory and Analysis Report; General Technical Report PNW-GTR-763; USDA Forest Service: Portland, OR, USA, 2008.
- Zhang, J.W.; Powers, R.F.; Skinner, C.N. To Manage or Not to Manage: The Role of Silviculture in Sequestering Carbon in the Specter Of Climate Change. In Integrated Management of Carbon Sequestration and Biomass Utilization Opportunities in a Changing Climate, Proceedings of the 2009 National Silviculture Workshop, Boise, ID, USA, 15–18 June 2009; Jain, T.B., Graham, R.T., Sandquist, J., Tech., Eds.; USDA Forest Service Rocky Mountain Research Station: Fort. Collins, CO, USA, 2010; pp. 95–110. [Google Scholar]
- Gholz, H.L.; Grier, C.C.; Campbell, A.G.; Brown, A.T. Equations for Estimating Biomass and Leaf Area of Plants in the Pacific Northwest, Research Paper 41; Oregon State University Forest Research Laboratory: Corvallis, OR, USA, 1979. [Google Scholar]
- Cochran, P.H.; Jennings, J.W.; Youngberg, C.T. Biomass Estimators for Thinned Second-Growth Ponderosa Pine Trees; Research Paper PNW-415; USDA Forest Service, Pacific Northwest Forest and Range Experiment Station: Portland, OR, USA, 1984.
- Brown, J. Weight and Density of Crowns of Rocky Mountain Conifers; Research Paper INT-197; USDA Forest Service, Intermountain Forest and Range Experiment Station: Ogden, UT, USA, 1978.
- Monserud, R.A.; Marshall, J.D. Allometric crown relations in three northern Idaho conifer species. Can. J. For. Res. 1999, 29, 521–535. [Google Scholar]
- Jenkins, J.C.; Chojnacky, D.C.; Heath, L.S.; Birdsey, R.A. National scale biomass estimators for United States tree species. For. Sci. 2003, 49, 12–35. [Google Scholar]
- Moeur, M. Crown Width and Foliage Weight of Northern Rocky Mountain Conifers; Research Paper INT-283; USDA Forest Service Intermountain Forest and Range Experiment Station: Ogden, UT, USA, 1981.
- Assmann, E. Principles of Forest Yield Study; Pergamon Press: New York, NY, USA, 1970; p. 506. [Google Scholar]
- Tappeiner, J.C.; Maguire, D.A.; Harrington, T.B. Silviculture and Ecology of Western U.S. Forests; Oregon State University Press: Corvallis, OR, USA, 2007; p. 440. [Google Scholar]
- Harrod, R.J.; Peterson, D.W.; Povak, N.A.; Dodson, E.K. Thinning and prescribed fire effects on overstory tree and sang structure in dry coniferous forests of the interior Pacific Northwest. For. Ecol. Manag. 2009, 258, 712–721. [Google Scholar]
- Agee, J.K. Fire Ecology of Pacific Northwest Forests; Island Press: Washington, DC, USA, 1933; p. 493. [Google Scholar]
- Ritchie, M.W.; Skinner, C.N.; Hamilton, T.A. Probability of tree survival after wildfire in an interior pine forest of northern California: Effects of thinning and prescribed fire. For. Ecol. Manag. 2007, 247, 200–208. [Google Scholar]
- Barrett, J.W. Height Growth and Site Index Curves for Managed, Even-aged Stands of Ponderosa Pine in the Pacific Northwest; Research Paper PNW-232; USDA Forest Service, Pacific Northwest Forest and Range Experiment Station: Portland, OR, USA, 1978.
- Alexander, E.B. Ecological Unit Inventory of Blacks Mountain Experimental Forest; On File, Redding Laboratory, Pacific Southwest Research Station: Redding, CA, USA, 1994. [Google Scholar]
- Greene, W.H. Econometric Analysis, 5th ed; Prentice Hall: Upper Saddle River, New York, NY, USA, 2003; p. 1026. [Google Scholar]
- Parresol, B. Assessing tree and stand biomass: A review with examples and critical comparisons. For. Sci. 1999, 45, 573–593. [Google Scholar]
- Parresol, B. Additivity of nonlinear biomass equations. Can. J. For. Res. 2001, 31, 865–878. [Google Scholar]
- Burnham, K.P.; Anderson, D.R. Model Selection and Multimodel Inference: A Practical Information-Theoretic Approach, 2nd ed; Springer: New York, NY, USA, 2002; p. 488. [Google Scholar]
- Van Velsen, J.L. A Corrected AIC for Seemingly Unrelated Regressions Models; Cornell University: Ithaca, NY, USA, 2009; Available online: http://arxiv.org/PS_cache/arxiv/pdf/0906/0906.0708v2.pdf (accessed on 1 December 2012).
- Bozdogan, H. Akaike’s information criterion and recent developments in information complexity. J. Math. Psych. 2000, 44, 62–91. [Google Scholar]
- Kittredge, J. Estimation of the amount of foliage of trees and stands. J. For. 1944, 42, 905–912. [Google Scholar]
- Heath, L.S.; Hansen, M.H.; Smith, J.E.; Smith, W.B.; Miles, P.D. Investigation into Calculating Tree Biomass and Carbon in the FIADB Using a Biomass Expansion Factor Approach. In Proceedings of the 2008 Forest Inventory and Analysis (FIA) Symposium, Park City, UT, USA, 21–23 October 2008; McWilliams, W., Moisen, G., Czaplewski, R., Eds.; USDA Forest Service Rocky Mountain Research Station: Fort Collins, CO, USA, 2009. [Google Scholar]
- California Environmental Protection Agency, Air Resources Board. Compliance Offset Protocol U.S. Forest Projects; California Environmental Protection Agency: Sacramento, CA, USA, 2011; p. 113. Available online: http://www.arb.ca.gov/regact/2010/capandtrade10/copusforest.pdf (accessed on 5 December 2012).
- Jenkins, J.C.; Chojnacky, D.C.; Heath, L.S.; Birdsey, R.A. Comprehensive Database of Diameter-Based Biomass Regressions for North American Tree Species; General Technical Report GTR-NE-319; USDA Forest Service, Northeastern Research Station: Newtown Square, PA, USA, 2004.
- Návar Ch., J.J.; González B., N.; Graciano L., J.J.; Dale, V.; Parresol, B. Additive equations for pine species of forest plantations of Durango, Mexico. Madera y Bosques 2004, 10, 17–26. [Google Scholar]
© 2013 by the authors; licensee MDPI, Basel, Switzerland. This article is an open access article distributed under the terms and conditions of the Creative Commons Attribution license (http://creativecommons.org/licenses/by/3.0/).
Share and Cite
Ritchie, M.W.; Zhang, J.; Hamilton, T.A. Aboveground Tree Biomass for Pinus ponderosa in Northeastern California. Forests 2013, 4, 179-196. https://doi.org/10.3390/f4010179
Ritchie MW, Zhang J, Hamilton TA. Aboveground Tree Biomass for Pinus ponderosa in Northeastern California. Forests. 2013; 4(1):179-196. https://doi.org/10.3390/f4010179
Chicago/Turabian StyleRitchie, Martin W., Jianwei Zhang, and Todd A. Hamilton. 2013. "Aboveground Tree Biomass for Pinus ponderosa in Northeastern California" Forests 4, no. 1: 179-196. https://doi.org/10.3390/f4010179
APA StyleRitchie, M. W., Zhang, J., & Hamilton, T. A. (2013). Aboveground Tree Biomass for Pinus ponderosa in Northeastern California. Forests, 4(1), 179-196. https://doi.org/10.3390/f4010179