Article

Climate-Driven Shifts in Wild Cherry (Prunus avium L.) Habitats in Türkiye: A Multi-Model Projection for Conservation Planning

1
Institute of Science, Düzce University, 81620 Düzce, Türkiye
2
Department of Forest Engineering, Düzce University, 81620 Düzce, Türkiye
3
Arac Rafet Vergili Vocational School, Kastamonu University, 37800 Kastamonu, Türkiye
4
Department of Forest Engineering, Kastamonu University, 37150 Kastamonu, Türkiye
5
Department of Geography, Faculty of Humanities and Social Sciences, Usak University, 62400 Uşak, Türkiye
6
Department of Forest Engineering, Bartın University, 74100 Bartın, Türkiye
7
Department of Environmental Engineering, Kastamonu University, 37150 Kastamonu, Türkiye
*
Author to whom correspondence should be addressed.
Forests 2025, 16(9), 1484; https://doi.org/10.3390/f16091484
Submission received: 29 July 2025 / Revised: 25 August 2025 / Accepted: 16 September 2025 / Published: 18 September 2025
(This article belongs to the Section Forest Ecology and Management)

Abstract

Climate change poses a serious threat to biodiversity, particularly for woody species with limited dispersal capacity such as Prunus avium L. (wild cherry). In this study, we assessed potential shifts in its suitable distribution range (SDR) across Türkiye by applying an ensemble modeling framework that combined Generalized Additive Models (GAM), Maximum Entropy (MaxEnt), and Random Forest (RF). We used updated occurrence data (including GBIF and EUFORGEN records) and 11 ecologically relevant bioclimatic variables under SSP2-4.5 and SSP5-8.5 scenarios. Model performance was validated using AUC (Area Under the ROC Curve) and TSS (True Skill Statistic) metrics. Results suggest that while 60–70% of current SDRs remain stable by 2100, approximately 10% may be lost, with 20–23% new expansions. Temperature seasonality (Bio4) and seasonal precipitation (Bio15) were consistently identified as dominant predictors across models. Notably, newly suitable habitats are expected to be spatially isolated, limiting natural colonization. Our findings highlight the necessity of proactive conservation planning, including assisted migration and drought-resistant genotype selection, to ensure long-term persistence of wild cherry under changing climates. These results offer actionable insights for adaptive forest management and biodiversity conservation in Mediterranean-type ecosystems.

1. Introduction

Over the past century, industrialization and technological progress have dramatically increased global carbon emissions, largely driven by fossil fuel combustion and industrial activities. The resulting rise in atmospheric CO2 levels has accelerated global climate change (GCC), disrupting ecosystems and threatening long-term environmental stability [1,2,3]. Mitigating GCC remains one of the most pressing challenges for sustainable development worldwide.
Unlike other issues, GCC directly or indirectly affects all living organisms and ecosystems worldwide. Studies indicate that GCC is now irreversible, emphasizing the need to determine its effects and prepare for its consequences [4,5,6]. It is often mentioned that plants are the living group to be most affected by the process of climate change. Plants do not have effective mobility, and all phenotypic traits are shaped by environmental factors, especially climatic conditions [7,8,9]. It is often emphasized that the anticipated consequences of GCC, such as temperature increase and drought, induce plant stress and that inevitable losses will be experienced at the individual, species, and population levels in the future [4].
For this reason, predicting potential changes in the SDRs (suitable distribution ranges) of woody species and taking necessary measures are crucial to minimize species and population losses. Studies typically integrate Species Distribution Models (SDMs) with climate models and scenarios to project species responses under future environmental conditions. Niche models are based on the ecological principles of the niche concept and utilize specific algorithms to quantify species-environment relationships. The attributes of plant niches are acquired by the examination of the known geographical distribution of the plant and relevant environmental parameters to find the appropriate area for the plant [10,11]. Different models with different principles and algorithms are used for this purpose. Studies have shown that it is more beneficial to determine the effects of GCC and the changes in suitable distribution areas for the same tree species with different models. Therefore, studies using multiple models have become more critical recently [12,13].
Within the context of this study, the aim is to determine the SDRs of P. avium, an important species in Türkiye, based on three most preferred models; GAMs (Generalized Additive Models), RF (Random Forest), and MaxEnt (Maximum Entropy) [14,15,16] and two shared socio-economic paths (SSP2-45 and SSP5-85 scenarios). P. avium L. (wild cherry) is a deciduous broad-leaved tree that grows up to 30 m in height, characterized by smooth bark, serrated leaves, and showy white flowers. It has significant ecological value as a keystone species in mixed deciduous forests, providing food resources for wildlife and supporting pollinators. Economically, wild cherry is valued for its high-quality timber, used in furniture and veneer production, and for its edible fruits. The species demonstrates adaptive traits such as tolerance to a range of soil types and moderate drought resistance, which make it not only ecologically but also socio-economically important. These traits explain the rationale for selecting P. avium as a model species in climate change-related habitat suitability studies [17,18,19].
Recent advances in ensemble modeling approaches emphasize that combining multiple models provides more robust and ecologically realistic predictions than relying on a single algorithm [20,21]. For example, GAMs are flexible and interpretable but may underperform in highly non-linear responses, whereas Random Forests capture complex interactions but can be less transparent. MaxEnt remains powerful for presence-only datasets but may be sensitive to sampling bias [22,23]. MaxEnt, a machine learning method, determines the ecological requirements of species based on distribution records and environmental factors [24]. Owing to its broad applicability, objectivity, and high reliability, MaxEnt has been frequently used in studies on various species in recent years [25,26]. Multi-model ensemble approaches reduce individual model uncertainty and improve transferability of predictions, which is critical for conservation planning [27]. Previous studies have successfully applied SDMs to various taxa such as Fagus orientalis [8], Quercus brantii [28], Taxus baccata [29], and Castanea sativa [30], demonstrating their utility in forecasting range shifts and informing species conservation. However, despite the increasing applications of SDMs in Türkiye, few studies have focused on P. avium, a keystone species of high ecological and socio-economic importance. This research gap underscores the need to evaluate climate-driven range shifts for P. avium. Our hypothesis is that climate change will drive both elevational and latitudinal shifts in SDRs, leading to habitat losses in current strongholds while creating novel suitable areas. Accordingly, our objectives are: (i) to model current and future SDRs of P. avium under SSP2-4.5 and SSP5-8.5 scenarios using GAM, RF, and MaxEnt; (ii) to quantify habitat losses and gains; and (iii) to provide conservation recommendations based on comparative model outcomes.

2. Material and Methods

2.1. Occurrence Records of Prunus avium

In this research, the potential shifts in the SDRs of P. avium, which has a wide distribution in the northern regions of Türkiye, both abundantly present in natural areas and frequently used in landscape works, have been assessed in relation to GCC. The global distribution data of P. avium are obtained from the Global Biodiversity Information Facility (GBIF) (GBIF Occurrence Download. Available online: https://doi.org/10.15468/dl.6aj73n (accessed on 31 July 2023)) and from the European Forest Genetic Resources Programme (EUFORGEN) database (https://www.euforgen.org, accessed on 31 July 2023). Finally, analyses were performed on 226 asset data, i.e., coordinates.
Then, a spatial refinement of all obtained records was performed to eliminate spatial autocorrelation and sample bias, selecting only one coordinate per 1 km2 to avoid model underestimation. Therefore, occurrence data were diluted to one occurrence point per grid cell using the gridSample function in the R package (version 4.2.2) dismo (version 1.3-14), to a spatial scale of one sample per grid cell of ~1 km2 [31]. As a result, a total of 150 unbiased records with at least 1 km distance between occurrences were used to build species distribution models.

2.2. Environmental Variables Related to Prunus avium

We assessed P. avium’s distribution by integrating the current 19 bioclimatic variables (Table 1) (downloaded WorldClim database) with future projections from CNRM-CM6-1 (CMIP6). Future conditions were modeled for 2022–2060 and 2061–2100 under SSP2-4.5 (moderate mitigation) and SSP5-8.5 (high emissions), capturing a range of potential climate impacts on habitat suitability.
We evaluated multicollinearity among all 19 variables through pairwise Pearson’s correlations. For any variable pairs with r > 0.8, we selected the more biologically meaningful variable for P. avium’s distribution and removed the other to reduce redundancy in the model. Finally, 11 bioclimatic variables (see * in Table 1) were used for modeling: Bio1 (Annual mean temperature), Bio2 (Daily temperature range), Bio3 (Isothermality), Bio4 (Seasonal temperature change), Bio5 (Max temperature of warmest month), Bio8 (Mean temperature in the wettest quarter), Bio9 (Mean temperature in the driest quarter), Bio12 (Annual total precipitation), Bio14 (Precipitation of the driest month), Bio15 (Seasonal precipitation change) and Bio19 (Precipitation in the coldest quarter).

2.3. Construction and Evaluation of SDMs

ShinyBIOMOD, a platform for Ensemble Modeling of Species Distributions, is an integrated platform that uses various statistical and machine learning algorithms to examine the relationship between species and their environments, estimate their distributions in space and time, and evaluate the uncertainty in predictions. ShinyBIOMOD (version 0.0.0.9000) contains 10 SDMs, and among these 10 SDMs, the most preferred Generalized Additive Model (GAM) [32], Random Forest (RF) [33], and Maximum Entropy (MaxEnt) [34] were used in the modeling process. To ensure model robustness and account for variability, each algorithm was run with five cross-validation replicates. The final ensemble projection for each scenario and time period was created by averaging the continuous suitability outputs from all five replicates of each model. The performance of each model was trained with 80% of the data and tested with 20%. The success of the models was evaluated with the Area Under the ROC Curve (AUC) and True Skill Statistic (TSS) values. Model performance was assessed using the TSS, which ranges from −1 to +1, with values of 0, −1, and +1 indicating random performance, worse-than-random prediction, and perfect agreement, respectively. TSS effectively balances sensitivity and specificity and is independent of prevalence [35]. Models with TSS values above 0.80 and AUC values above 0.90 were considered suitable for analysis, and only these were included in the final ensemble. The outputs from each model and the proper habitat of P. avium were divided into six categories using ArcGIS 10.6: unsuitable habitat (0–0.5), very low suitability habitat (0.5–0.6), low suitability habitat (0.6–0.7), moderate suitability (0.7–0.8), high suitability (0.8–0.9) and very high suitability (0.9–1) [13].
Suitability values can be obtained at different levels depending on the characteristics of the species and the structure of the study. In a study conducted on Pistacia eurycarpa and Pistacia khinjuk, pixels with values of 0.3 and above were considered suitable areas, and suitability maps were classified as high suitability (0.67–0.89), medium suitability (0.45–0.67), low suitability (0.3–0.45), and unsuitable (0–0.3) [36]. In another study, suitability classes were determined. In a study conducted on Cunninghamia lanceolata, suitability classes were divided into five equal parts: 0–0.2, non-suitable area; 0.2–0.4, low-suitability area; 0.4–0.6, general-suitability area; 0.6–0.8, medium-suitability area; and 0.8–1, high-suitability area [37]. In a study conducted on Litchi chinensis, the suitability classes were also determined as follows: unsuitable areas (p ≤ 0.0685), marginally suitable areas (0.0685 ≤ p ≤ 0.2328), moderately suitable areas (0.2328 ≤ p ≤ 0.4656), and highly suitable areas (p ≥ 0.4656) [38]. However, the literature review shows that one of the most commonly used classification methods is the one used in this study. Cantürk et al. [13] on Pinus nigra, Adhikari et al. [39] on Parthenium hysterophorus, Zhao et al. [40] on Camellia sinensis, and Zhao et al. [41] on Cnaphalocrocis medinalis used the classification used in this article in their studies.
To address spatial autocorrelation and avoid over-optimistic AUC/TSS estimates, future analyses should adopt spatially explicit cross-validation approaches such as blockCV or leave-one-region-out CV. These methods reduce spatial sorting bias and provide more reliable uncertainty estimates in model performance metrics.
For model transparency and reproducibility, it is essential to explicitly define the accessible area (M), incorporate a bias treatment in MaxEnt (e.g., bias file or target-group background), and describe the pseudo-absence sampling scheme in GAM and RF. Reliance on ShinyBIOMOD defaults is insufficient; future studies should justify pseudo-absence number, weights, and spatial extent of M (e.g., based on eco-regions or dispersal-limited convex hulls).
Finally, a presence/absence (0, 1) 1 × 1 km resolution matrix was created for P. avium under the 2022 and projected climate change scenarios. Changes in P. avium’s appropriate distribution area across several climate scenarios were examined using this matrix. The area changes were computed using the P. avium appropriate habitat area as of 2022. In line with Ye et al., the following changes were identified: 0→1 matrix value denoted a newly suitable area, 1→0 denoted a lost suitable region, 1→1 denoted a protected suitable area, and 0→0 denoted an unsuitable area [42].
We first determined the species’ current (2022) distribution in this study using our selected models. We then modeled its potential SDRs for 2060 (2022–2060) and 2100 (2061–2100) under both SSP2-4.5 and SSP5-8.5 scenarios. Finally, we calculated temporal changes by comparing these future SDRs to the 2022 baseline, quantifying proportional shifts across different climate scenarios and models.

3. Results

The MaxEnt model was run with five repetitions using environmental variables with P. avium distribution data specific to Türkiye. As a result of the study, TSS (0.865) and AUC (0.962) values of the model were obtained. These findings reveal that the model has high predictive power. Variables affecting the model are presented in Figure 1.
As seen in Figure 1, the environmental variable that has the most significant effect on the MaxEnt model is Bio15 (Seasonal precipitation change) with 62.8%. This is followed by Bio4 (Seasonal temperature change) with 13.3% and Bio12 (Annual total precipitation) with 10.2%. The effect of other environmental factors on the model is below 10%.
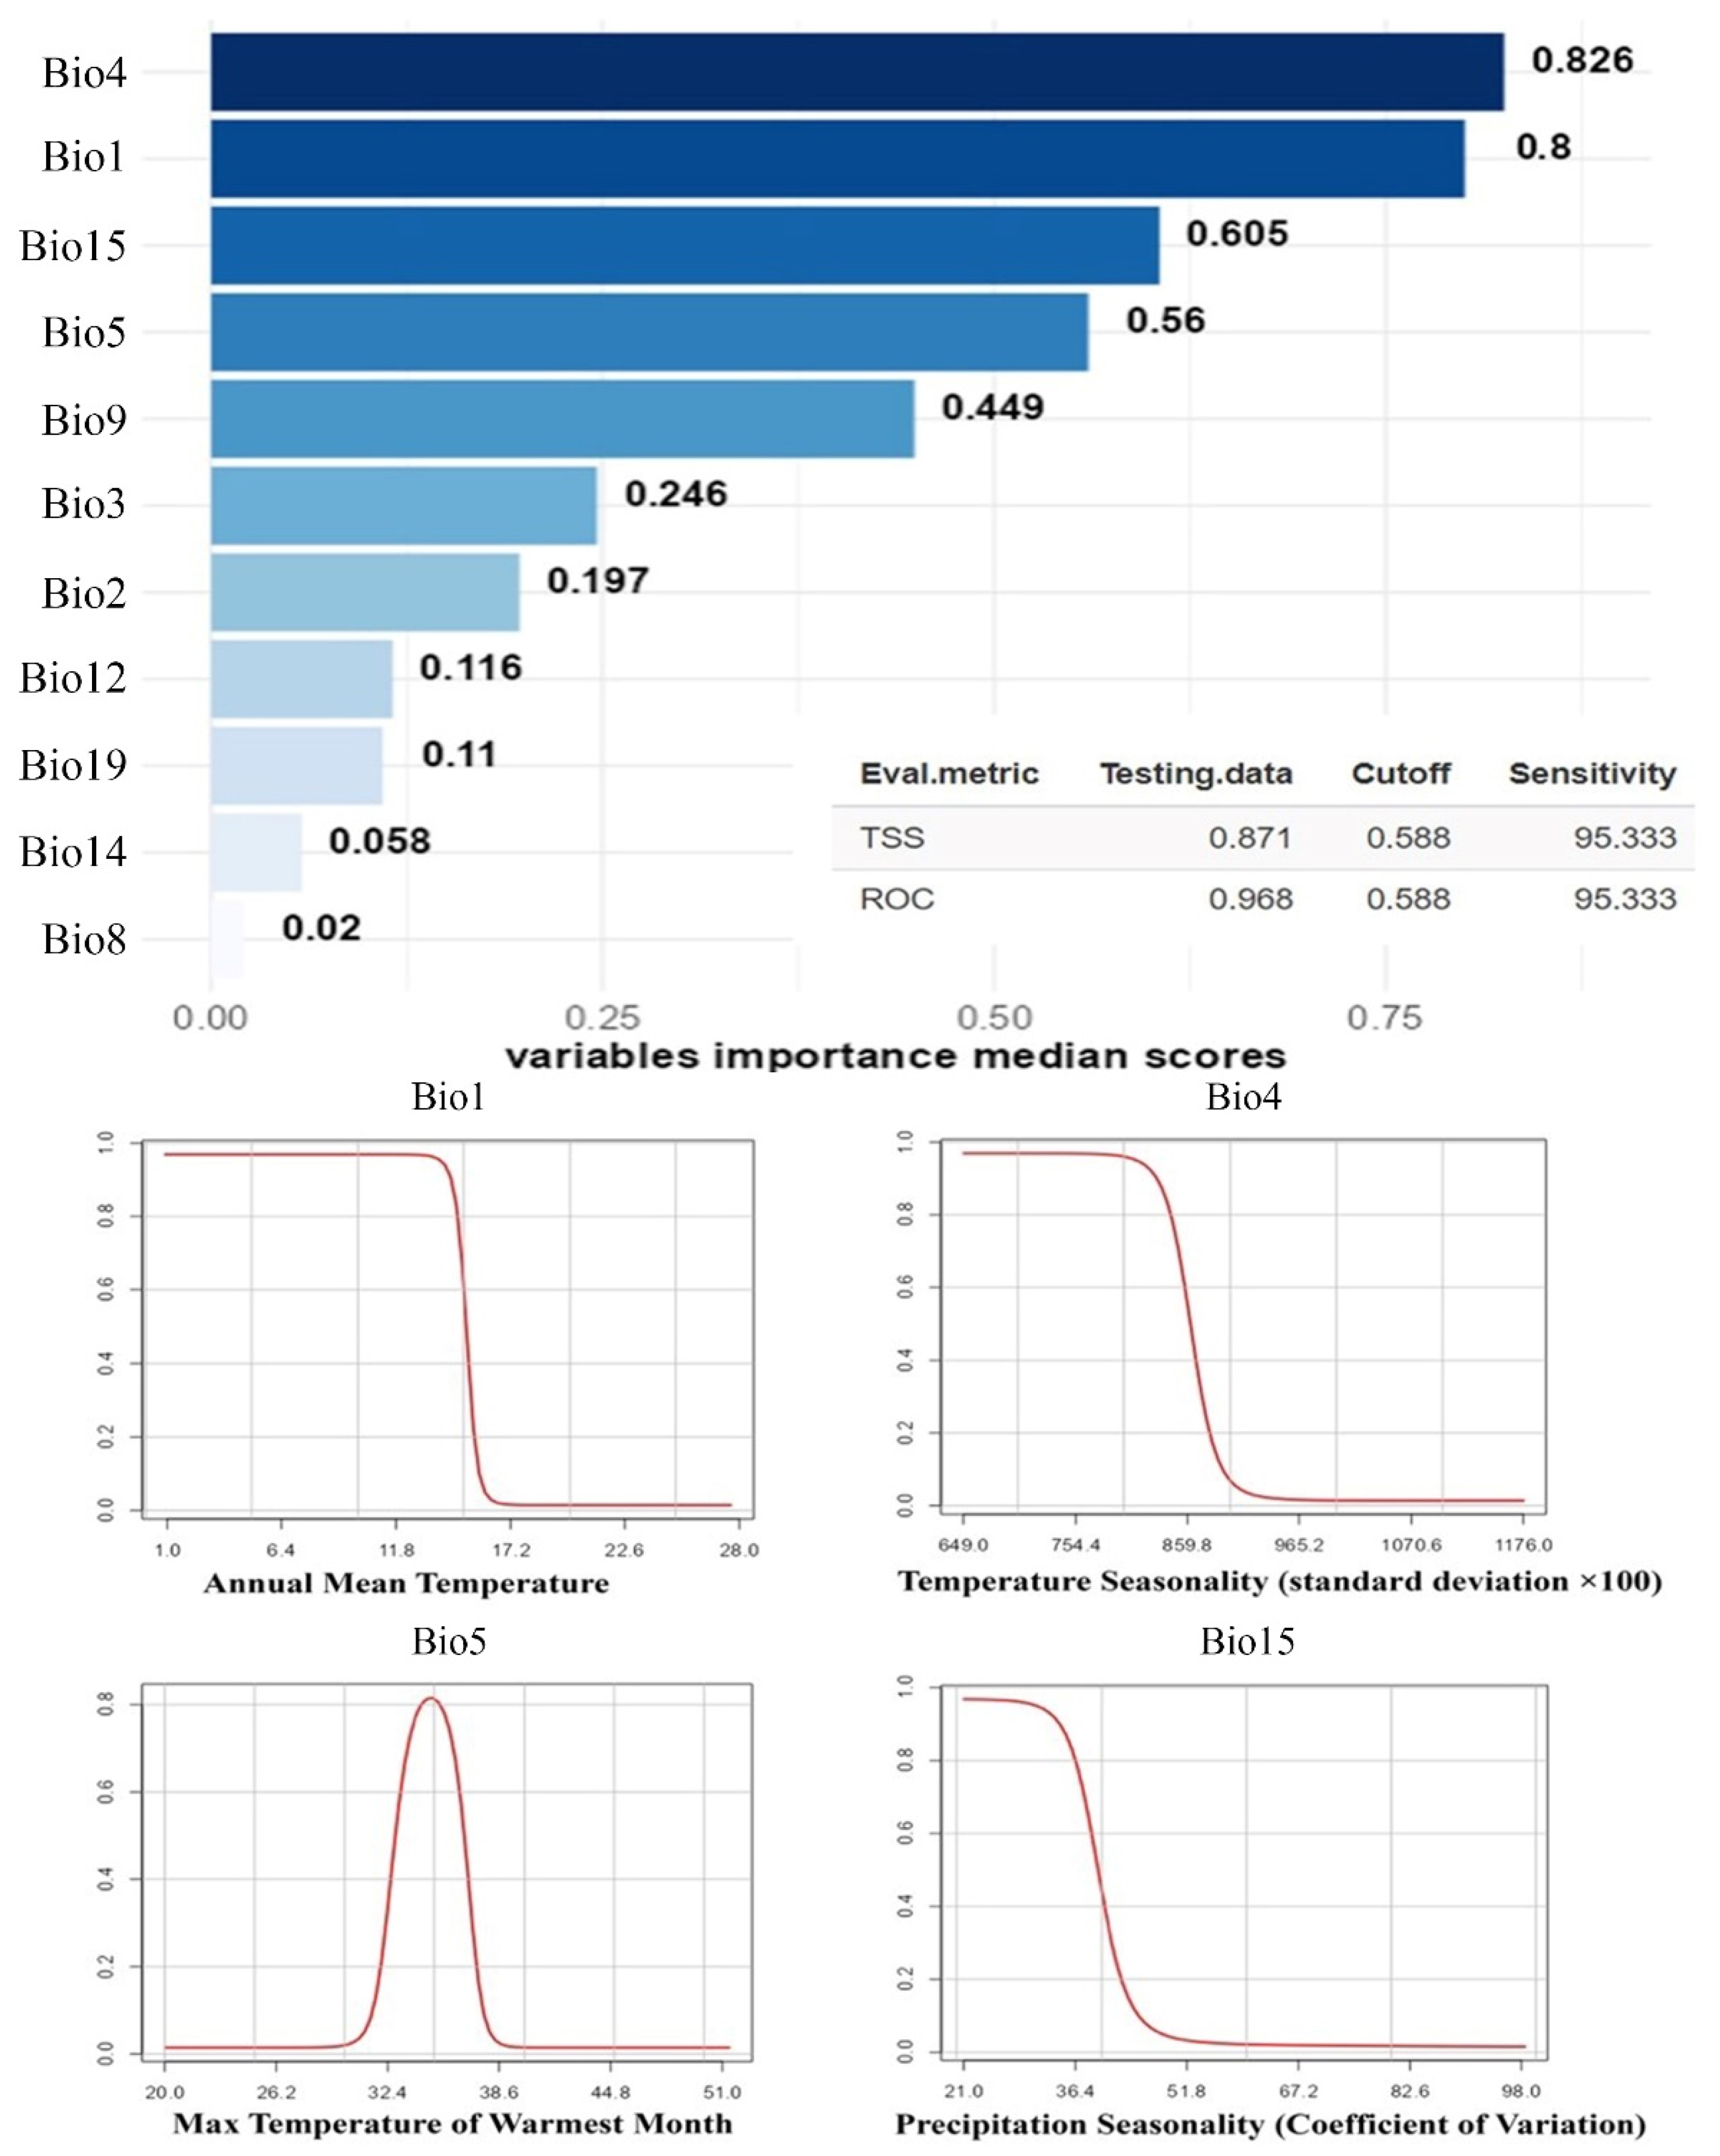
The GAM model was run with five repetitions using environmental variables with P. avium distribution data specific to Türkiye. As a result of the study, the TSS (0.871) and AUC (0.968) values of the model were obtained. These findings reveal that the model has high predictive power. The variables affecting the model are presented in Figure 2.
When the variables with highest impact on the model are examined, it is found that Bio4 (Seasonal temperature change) has the highest impact with 82.6%, which is followed by Bio1 (Annual mean temperature) with 80%, Bio15 (Seasonal precipitation change) with 60.5%, and Bio5 (max temperature of warmest month) with 56%. The impact of other environmental factors on the model is below 50%.
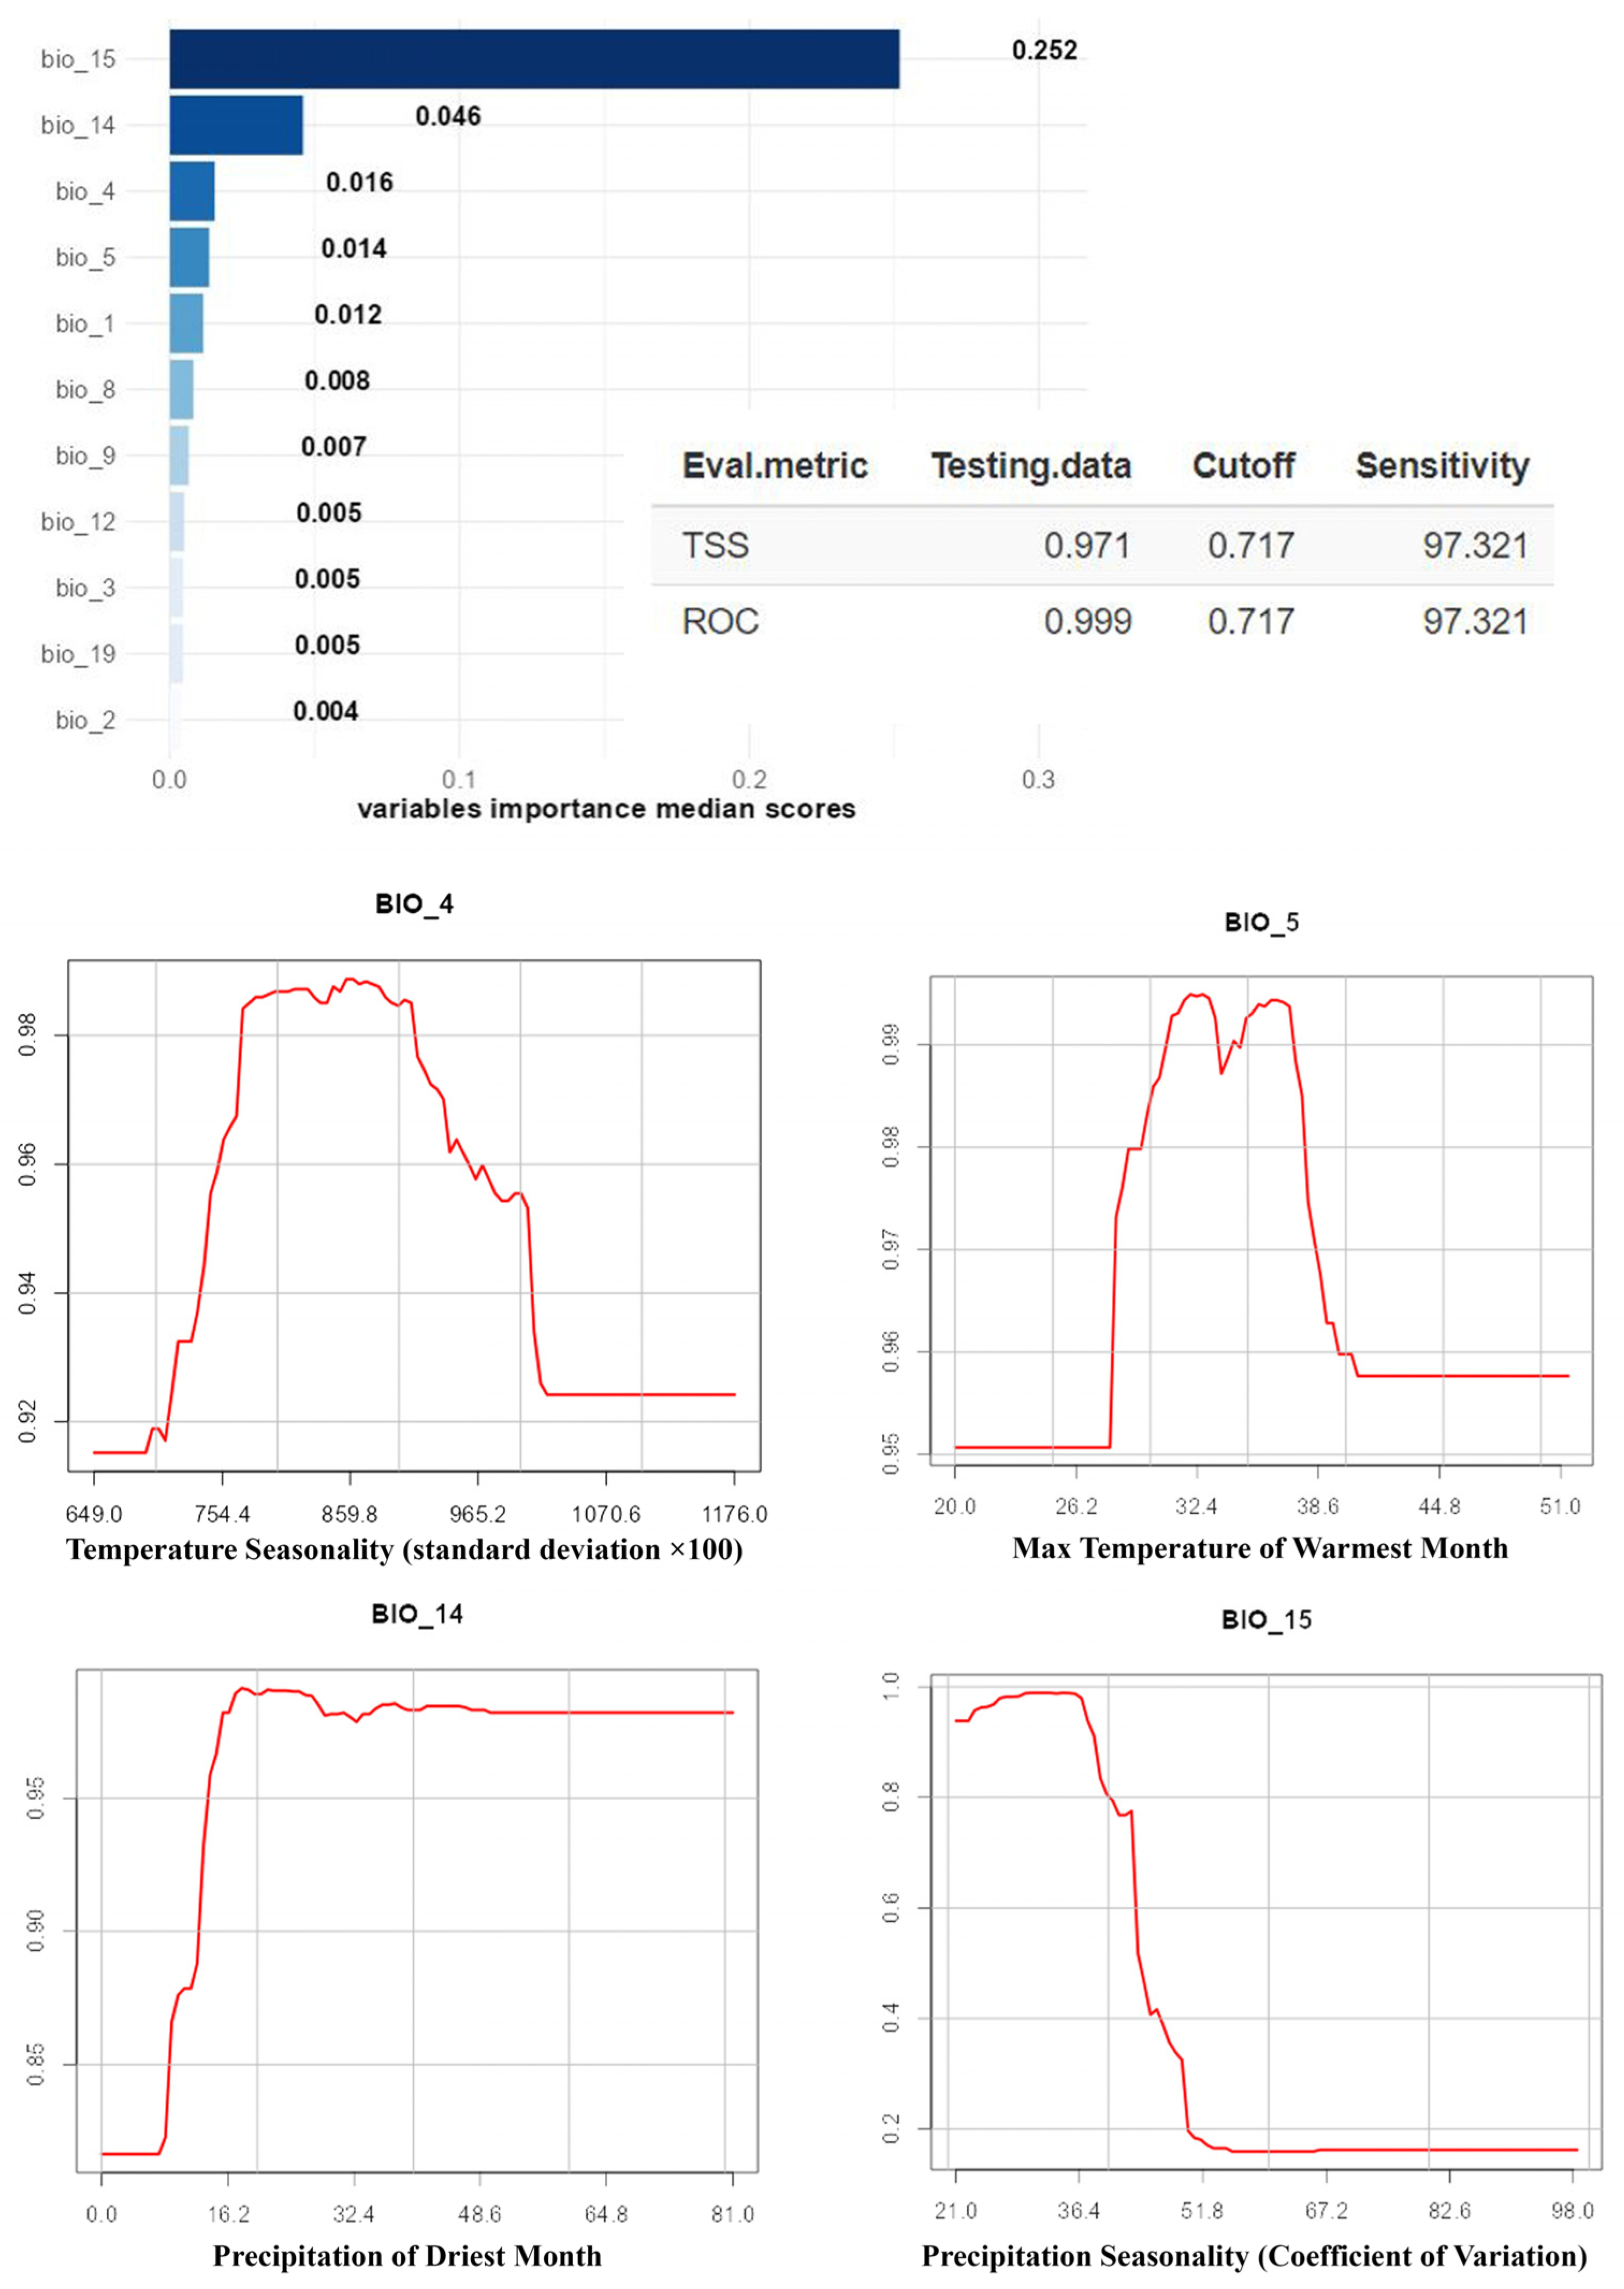
Based on testing data for RF model, TSS and AUC values of the model were obtained 0.971 and 0.999, respectively. These findings reveal that the model has high predictive power. The variables affecting the model are presented in Figure 3.
When the variables affecting the RF model are examined, it is found that Bio15 (Seasonal precipitation change) has the highest effect with 25.2%, which is followed by Bio14 (Precipitation of the driest month) with 4.6%, Bio4 (Seasonal temperature change) with 1.4%, and Bio5 (max temperature of warmest month) with 1.2%. The power of other environmental factors on the RF model was below 1%.
The SDRs of P. avium around Türkiye in 2022, as well as the potential changes in these areas for the years 2060 and 2100 based on the SSP2-45 and SSP5-85 scenarios, were determined using GAM, RF, and MaxEnt models. The maps of SDRs are presented in Figure 4, whereas the numeric values of the distribution ranges are illustrated in Table 2.
When examining Figure 4, the shifts in SDRs for P. avium vary significantly based on the models used in the study. According to the MaxEnt model, an increase in SDRs for P. avium is expected in the Western Black Sea regions, the GAM model generally predicts an increase in the eastern regions, and the RF model predicts an increase in SDRs in Thrace and the Western Black Sea region. When the changes are examined numerically, a general decrease is expected in the high SDRs for the species according to the MaxEnt model in the coming years, whereas a slight increase is expected in SDRs. While approximately 8.42% (suitability > 0.5) of the study area in 2022 was evaluated as a suitable distribution area for the species, this rate is expected to increase to 8.53% in 2100 according to the SSP2-45 scenario and 8.73% according to the SSP5-45 scenario. In other words, an overall increase of around 3.5% is expected in the SDR for the species.
According to the GAM climate model, the species’ SDR in 2022 is approximately 10.37%. According to the SSP2-45 scenario, this rate is expected to increase to 11% in 2100 and to around 11.77% in the SSP5-85 scenario. There may be a potential increase of around 6% in the SDR for P. avium.
Similarly, according to the RF climate model, a significant increase is expected in the SDR for P. avium. Approximately 8.25% of the study area is considered a SDR in 2022, and this proportion is expected to increase to 9.86% in the year 2100 based on the SSP2-45 scenario and to around 9.79% based on the SSP5-85 scenario. In other words, an increase of around 19% is expected in the total SDR for P. avium.
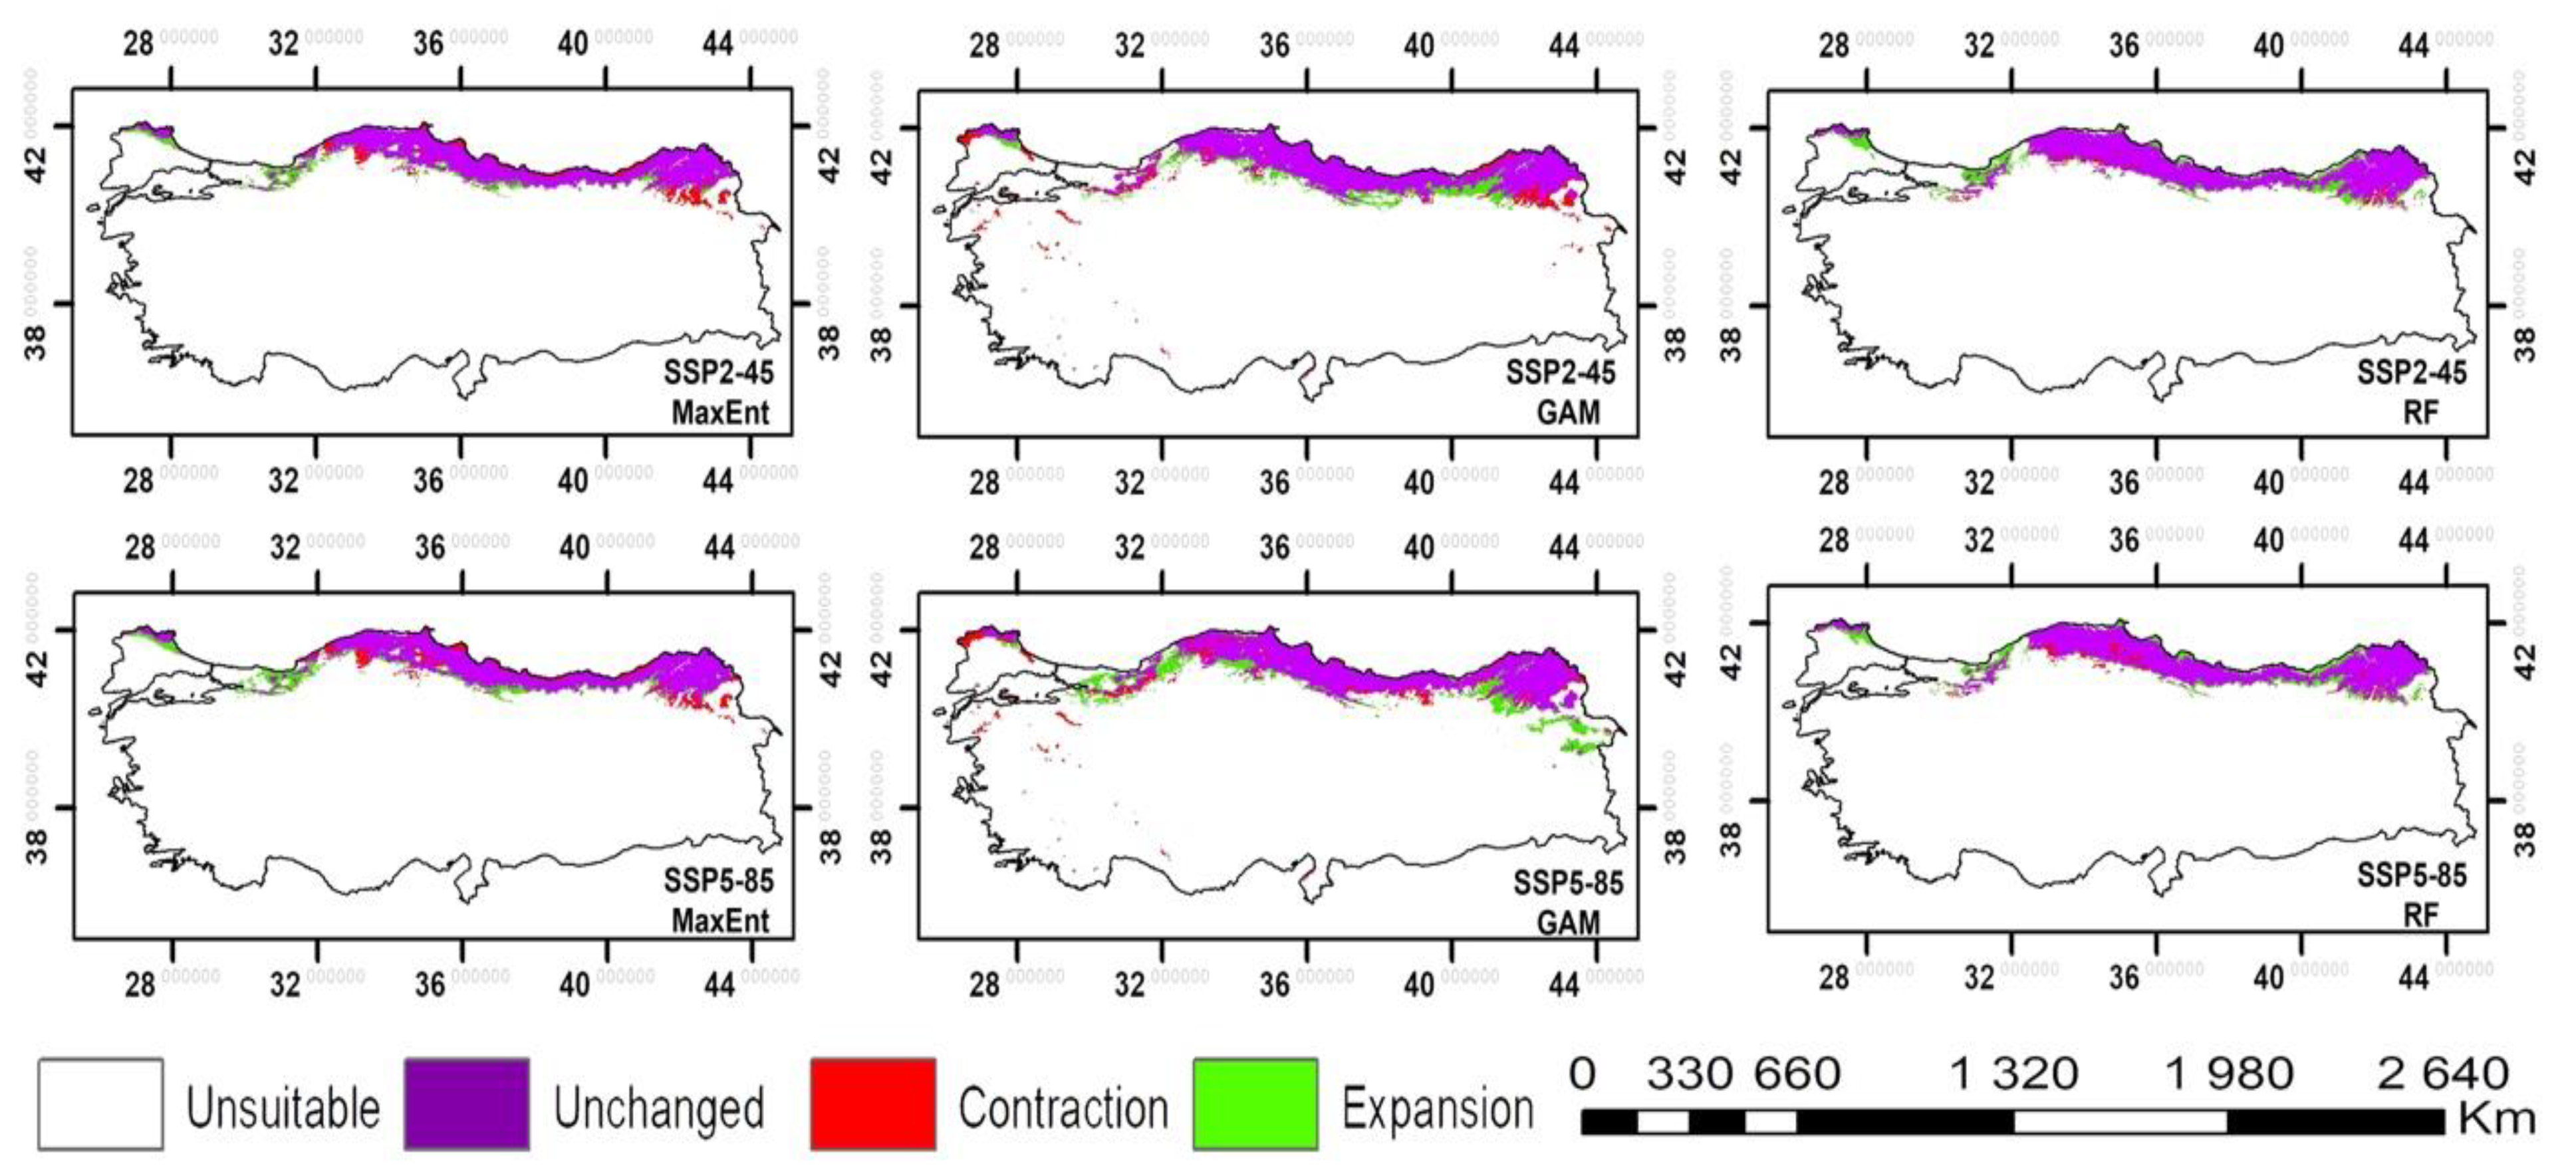
These results suggest a substantial increase in the total SDR for P. avium. However, it is crucial to consider not only the total quantity of SDRs but also the changes occurring in such areas. For this reason, the change in the SDR for the species until the year 2100 based on the models and scenarios under consideration was identified and illustrated on the map given in Figure 5. The numeric values are illustrated in Table 3.
When examining Figure 5, it is observed that, according to all three models, significant changes in the SDRs for P. avium species will occur in the Western Black Sea and the North-eastern Anatolian regions. This change has a tendency to increase. However, a significant loss of SDR is expected to occur, especially in the Northern Anatolian region. According to the GAM model, new SDR of P. avium are expected to emerge in large areas south of its suitable distribution areas in Northern Anatolia in 2022. In general, the SDRs for the species is predicted to shift towards south.
When the values are examined in Table 3, it is predicted that according to the SSP2-45 scenario, there will be a decrease ranging from 0.44% (RF) to 1.56% (GAM) in the distribution range of the species, and an increase ranging from 1.43% (MaxEnt) to 2.19% (GAM). These figures represent a significant increase compared to the SDR in 2022, for example, an increase of 17.4% according to the GAM model and 19.8% according to the RF model. However, the SDR decrease varies between 4.3% (RF) and 13.4% (MaxEnt) of the SDRs in 2022.
Based on the SSP5-85 scenario, a decrease ranging from 0.53% (RF) to 1.62% (GAM) is predicted in the distribution range of the species, whereas an increase ranging from 1.67% (MaxEnt) to 3.02% (GAM) is predicted. When compared to the SDR in 2022, these figures represent a loss of SDR of 13.4% according to the MaxEnt model, 12.1% according to the GAM model, and 5.1% according to the RF model. However, the new SDRs to emerge represent a proportion of 16.6% according to the MaxEnt model, 22.6% according to the GAM model, and 20% according to the RF model, when compared to the SDRs in 2022.

4. Discussion

The study aimed to predict the 2022 and future SDRs of P. avium using MaxEnt, GAM, and RF models according to the SSP2-45 and SSP5-85 scenarios. The models utilized within the study are among the most commonly used models on similar subjects. For example, in order to determine the SDRs, Zhang et al. [43] utilized the RF model for Anredera cordifolia; Zhang and Wang [44] used the RF model for Meconopsis punicea; Williams et al. [45] used the RF model for Harmonia stebbinsii, Leptosiphon nuttallii, and Riogonum libertini; Ardestani and Ghahfarrokhi [46] used the RF model for Salvia hydrangea; Dutra Silva et al. [47] used the GAM model for studying, Acacia melanoxylon, Morella faya, and Pittosporum undulatum; Safaei et al. [28] used the MaxEnt model for Quercus brantii; Sung et al. [48] employed the GAM model for Solenopsis invicta; Alavi et al. [49] utilized GAM and RF models for Taxus baccata; Adhikari et al. [50] utilized MaxEnt and RF models for Lactuca serriola, Sicyos angulatus, Solanum carolinense, Ambrosia trifida, Paspalum distichum, Ambrosia artemisiifolia, Hypochaeris radicata, Symphyotrichum pilosum, Ageratina altissima, Paspalum dilatatum, Solidago altissima, and Rumex acetosella.
Our models project significant range shifts for P. avium L. under climate change scenarios. Although the total area of suitable habitat shows a net increase, this apparent expansion masks important ecological changes: about 70% of currently suitable areas will remain stable. In contrast, approximately 10% of current habitats will become unsuitable, and new suitable areas will emerge in previously uninhabited regions. In this case, unless the proper interventions are made, there will be inevitable population losses, as the species cannot naturally migrate to the new suitable areas. If the species is not carried to the newly formed suitable areas artificially, it is not possible for the new populations to be formed in such areas. This is because studies emphasize that climate changes are expected to occur much faster than plants can adapt [6]. In this case, it is underscored that species may be inadequate in migrating to the recently formed appropriate regions, leading to inevitable individual and population losses [51,52]. In summary, based on the study results, it can be concluded that while the species will maintain approximately 60 to 70% of its SDRs, decreases in the total distribution range of the species may occur unless new suitable areas are artificially populated.
Elevation is another critical factor influencing the distribution of P. avium. Previous studies have shown that many temperate tree species exhibit upward shifts in elevation under warming climates (e.g., Abies, Fagus, Carpinus). Since P. avium populations in Türkiye are distributed in mountain and sub-mountain regions, climate-driven elevational shifts may substantially alter habitat availability. Under high-emission scenarios, suitable habitats may shift upslope, leading to habitat contraction at lower elevations and potential isolation of populations at higher elevations. This elevational dimension must be incorporated into future conservation planning [53,54].
The claim that new habitats are geographically isolated and require artificial translocation must be interpreted cautiously. This assertion remains untested without explicit dispersal or connectivity modeling (e.g., MIGCLIM, circuit theory, kernel-based dispersal functions). Incorporating dispersal kernels or connectivity analyses would provide stronger justification for conservation recommendations. However, considering the species biology, it must be acknowledged that it will be very difficult for the species to migrate to new suitable areas by natural means. For this reason, it is predicted that individual and population losses will be inevitable, and that the rate of settlement of the species in new suitable areas will remain low. Similar studies have also mentioned this situation [55,56,57].
It is also important to acknowledge that SDMs based on adult occurrences do not capture demographic processes such as fecundity, seed dispersal, germination, and seedling recruitment, which strongly govern long-term species persistence. Next-generation niche dynamics have been shown to diverge from adult niches [58], and such demographic factors should be integrated into future modeling and conservation planning frameworks.
In the studies conducted, it is generally concluded that the impacts of GCC will lead to a momentous reduction in the SDRs of plant species. In some studies carried out in Türkiye, the effects of climate change are estimated for specific tree species: for Tilia platypyllos, it is estimated that there could be a 15% loss due to climate change [59]; for Carpinus betulus it is estimated that the losses may exceed 25% at elevations below 1600 m, while Carpinus orientalis could face population losses surpassing 30% at elevations below 1000 m [51]; for Castanea sativa, its SDRs are estimated to decrease to one-fifth of the current levels by the year 2100, or even disappear entirely, according to the best-case scenario [30]; and for Abies bornmuelleriana, it is estimated that its SDRs may decrease by up to 38.5% compared to the current levels, particularly at elevations of 1800 to 2000 m, by the year 2100 [6].
Global studies reveal contrasting responses of species distributions to climate change, with both significant range contractions and expansions reported. While Gomez-Pineda et al. [60] project up to 77% habitat loss for Mexican montane species by 2060, and Li et al. [61] estimate 23–57% of Chinese tree species may become vulnerable by 2070, some temperate species show compensatory range expansions. For instance, Fagus sylvatica, Quercus frainetto, and Quercus pubescens populations in Greece may decline by 93%, 72%, and 64%, respectively [62]. Yet, the same species exhibits northward expansion in Scandinavia [63]. Similarly, Malus sylvestris is projected to gain 15% suitable habitat in Central Europe [64]. These patterns suggest that climate-driven range shifts may benefit some woody plants through expansion into newly suitable areas, even as substantial habitat losses occur elsewhere [65].
Our variable importance analysis determined that temperature seasonality (Bio4) and maximum temperature of the warmest month (Bio15) were the most influential characteristics shaping P. avium’s distribution. These findings align well with the species’ known ecophysiological constraints. Bio4 critically regulates P. avium’s phenological cycles, particularly winter dormancy release and spring budburst timing [66]. The species’ sensitivity to Bio15 reflects its limited thermotolerance—maintained temperatures above 32 °C during the growing season impair photosynthetic efficiency and increase xylem embolism risk [67]. These physiological thresholds explain why our models project greater range contractions in southern latitudes under SSP5-8.5, where summer temperatures increasingly exceed the species’ viability limits. Notably, P. avium’s shallow root system [68] exacerbates its vulnerability to temperature-mediated drought stress, creating a bioclimatic niche particularly sensitive to these thermal variables.
The study results reveal that the primary variables affecting the distribution ranges of the species in all models are temperature and precipitation parameters. The previous studies conducted show that the most common effects of GCC will manifest as increases in temperature and decreases in precipitation [69,70], and thus climate types will shift towards arid climate types [71]. This situation is expected to induce significant stress on plants, since the phenotypic traits of plants are shaped under the interaction between genetic factors [72] and several environmental parameters [73,74]. Permanent changes, which may occur in environmental factors, can lead to the formation of stress factors in plants [13]. In addition, the exposure of plants to stress factors can slow down plant development as well [75,76]. Therefore, GCC will not only affect the quantity of SDRs for plants but also the health and quality of plants. For instance, it has been indicated that radial tree growth may decline by up to 20% in species like Lagerstroemia speciose, Chukrasia tabularis, and Toona ciliata, and that this situation may have serious consequences, particularly on the carbon equilibrium of tropical forests [77].
Although GBIF (GBIF Occurrence Download. Available online: https://doi.org/10.15468/dl.6aj73n (accessed on 31 July 2023)) and EUFORGEN datasets provided a comprehensive baseline for species distribution modeling, this study recognizes a limitation due to the absence of herbarium and targeted field survey data. Future studies should integrate herbarium specimens, published occurrence records, and systematic field surveys across the species’ natural distribution range in Türkiye. Such integrations will improve the accuracy and ecological realism of species distribution models [78,79].
Microclimatic and micro-edaphic circumstances are other important components that may affect how species react to the GCC. Research indicates that basic climatic types may not always be as effective as microenvironmental conditions [13]. These results suggest that the effects of the GCC may differ at the local and even regional scales [80]. It is evident that when numerous factors interact, the effects of the GCC impact both individuals and species. However, study findings also indicate that the most suitable models for determining these impacts have not yet been identified, and there might be significant differences among the outputs of different models.

5. Conclusions

Within the scope of the study, it was aimed to identify the potential changes in the SDRs of P. avium until the year 2100, using three different models and two different scenarios. Findings regarding how the distribution range of P. avium will change vary significantly depending on the models and scenarios. For instance, unlike other models, the GAM climate model predicts the emergence of extensive new SDRs in western Anatolia by the year 2100 according to the SSP5-85 scenario. However, this situation is not evident in other models, even within the same model based on the SSP2-45 scenario. Therefore, it is not definitively known which model provides the most accurate prediction and which scenario is to occur. Therefore, it is recommended to monitor the ongoing changes and consider the results of the model and scenario that predict the outcome in the best way possible.
The impact of GCC on the potential outcomes for species’ distribution ranges is shaped by numerous factors, and these results cannot yet be predicted with certainty. In spite of that, it is taken for granted that an increase will occur in temperature, and thus, there will be drought. For this reason, we recommended prioritizing drought-resistant species and origins in afforestation efforts in addition to measures such as establishing and preserving mixed forests in order to enhance population stability, maintain a diverse gene pool, and take precautions against insect and fungal pests in forests, as well as abiotic pests.
In conclusion, our ensemble modeling approach demonstrates that climate change will drive both contractions and expansions of suitable habitats for P. avium in Türkiye. While 60–70% of current SDRs are likely to persist, up to 13% may be lost, with novel habitats emerging in southern and higher-elevation regions. Based on comparative model performance, GAM and RF appear to provide more robust long-term predictions, whereas MaxEnt remains valuable for presence-only analyses. Accordingly, we recommend that conservation strategies prioritize: (i) assisted migration to newly suitable areas, (ii) the use of drought-resistant provenances in afforestation, (iii) maintenance of genetic diversity through mixed-species forestry, and (iv) monitoring elevational shifts to anticipate habitat isolation risks. These findings underscore the urgent need to integrate predictive modeling into adaptive forest management and biodiversity conservation planning.
According to the study results, the formation of new SDRs for P. avium is expected to emerge in areas where the species is not currently populated. However, it is not considered possible for the species to naturally populate these areas. In this case, facilitating the necessary migration mechanisms for the species artificially will become mandatory. Based on the study results, it is recommended that necessary adjustments be made to forest management and silviculture plans.

Author Contributions

U.C.: Conceptualization, Methodology, Software, Writing—original draft. İ.K.: Conceptualization, Software, Formal analysis, Writing—original draft—review and editing. R.E.: Conceptualization, Writing—review and editing. A.O.P.: Conceptualization, Writing—review and editing. S.D.: Conceptualization, review and editing. N.K.O.: Methodology, review and editing. H.S.: Methodology, review and editing. H.B.O.: Methodology, review and editing. All authors have read and agreed to the published version of the manuscript.

Funding

This research received no external funding.

Data Availability Statement

All relevant data can be found within the manuscript.

Acknowledgments

We sincerely thank the editor and anonymous reviewers for their valuable comments and suggestions to improve the quality of this paper.

Conflicts of Interest

The authors declare no conflicts of interest.

References

  1. Kabir, M.; Habiba, U.E.; Khan, W.; Shah, A.; Rahim, S.; De los Rios-Escalante, P.R.; Farooqi, Z.-U.-R.; Ali, L.; Shafiq, M. Climate change due to increasing concentration of carbon dioxide and its impacts on environment in 21st century; a mini review. J. King Saud Univ.-Sci. 2023, 35, 102693. [Google Scholar] [CrossRef]
  2. Nunes, L.J. The rising threat of atmospheric CO2: A review on the causes, impacts, and mitigation strategies. Environments 2023, 10, 66. [Google Scholar] [CrossRef]
  3. Isinkaralar, O. Spatio-temporal patterns of climate parameter changes in Western Mediterranean basin of Türkiye and implications for urban planning. Air Qual. Atmos. Health 2023, 16, 2351–2363. [Google Scholar] [CrossRef]
  4. Isinkaralar, O.; Isinkaralar, K. Projection of bioclimatic patterns via CMIP6 in the Southeast Region of Türkiye: A guidance for adaptation strategies for climate policy. Environ. Monit. Assess. 2023, 195, 1448. [Google Scholar] [CrossRef] [PubMed]
  5. Kim, S.-K.; Shin, J.; An, S.-I.; Kim, H.-J.; Im, N.; Xie, S.-P.; Kug, J.-S.; Yeh, S.-W. Widespread irreversible changes in surface temperature and precipitation in response to CO2 forcing. Nat. Clim. Change 2022, 12, 834–840. [Google Scholar] [CrossRef]
  6. Tekin, O.; Cetin, M.; Varol, T.; Ozel, H.B.; Sevik, H.; Zeren Cetin, I. Altitudinal migration of species of Fir (Abies spp.) in adaptation to climate change. Water Air Soil Pollut. 2022, 233, 385. [Google Scholar] [CrossRef]
  7. Güney, D.; Seyis, E.; Atar, F.; Bayraktar, A.; Turna, İ. Effects of some nitrogen-fixing plants on seedling growth of Scotch pine. Turk. J. For. 2019, 20, 284–289. [Google Scholar] [CrossRef]
  8. Ertürk, N.; Arıcak, B.; Yiğit, N.; Sevik, H. Potential changes in the suitable distribution areas of Fagus orientalis Lipsky in Kastamonu due to global climate change. Forestist 2024, 74, 159–165. [Google Scholar] [CrossRef]
  9. Güney, D.; Bayraktar, A.; Atar, F.; Chavoshi, S.H.; Turna, İ. The effects of different rooting temperatures and phytohormones on the propagation of boxwood cuttings. Balt. For. 2023, 29, id593. [Google Scholar] [CrossRef]
  10. Zhang, Y.B.; Liu, Y.L.; Qin, H.; Meng, Q.X. Prediction on spatial migration of suitable distribution of Elaeagnus mollis under climate change conditions in Shanxi Province, China. Ying Yong Sheng Tai Xue Bao=J. Appl. Ecol. 2019, 30, 496–502. [Google Scholar]
  11. Zhao, G.; Cui, X.; Sun, J.; Li, T.; Wang, Q.; Ye, X.; Fan, B. Analysis of the distribution pattern of Chinese Ziziphus jujuba under climate change based on optimized biomod2 and MaxEnt models. Ecol. Indic. 2021, 132, 108256. [Google Scholar] [CrossRef]
  12. Zurell, D.; Zimmermann, N.E.; Brun, P. The niche through time: Considering phenology and demographic stages in plant distribution models. J. Ecol. 2024, 112, 1926–1939. [Google Scholar] [CrossRef]
  13. Cantürk, U.; Koç, İ.; Özel, H.B.; Şevik, H. Possible changes of Pinus nigra distribution regions in Türkiye with the impacts of global climate change. BioResources 2024, 19, 6190. [Google Scholar] [CrossRef]
  14. Zhao, Z.; Xiao, N.; Shen, M.; Li, J. Comparison between optimized MaxEnt and random forest modeling in predicting potential distribution: A case study with Quasipaa boulengeri in China. Sci. Total Environ. 2022, 842, 156867. [Google Scholar] [CrossRef]
  15. Zhao, Y.; O’Neill, G.A.; Coops, N.C.; Wang, T. Predicting the site productivity of forest tree species using climate niche models. For. Ecol. Manag. 2024, 562, 121936. [Google Scholar] [CrossRef]
  16. El-Khalafy, M.M.; El-Kenany, E.T.; Al-Mokadem, A.Z.; Shaltout, S.K.; Mahmoud, A.R. Habitat suitability modeling to improve conservation strategy of two highly-grazed endemic plant species in saint Catherine Protectorate, Egypt. BMC Plant Biol. 2025, 25, 485. [Google Scholar] [CrossRef]
  17. Chen, M.; Feng, S.; Gao, M.; Liu, M.; Wang, K.; Wang, J.; Shangguan, Z.; Zhang, Y. The difference in the photosynthetic characteristics and soil moisture of different varieties of sweet cherry (Prunus avium L.). Agric. Water Manag. 2024, 302, 109002. [Google Scholar] [CrossRef]
  18. Li, H.; Peng, X.; Jiang, P.; Xing, L.; Sun, X. Prediction of potential suitable distribution for sweet cherry (Prunus avium) based on the MaxEnt model. PLoS ONE 2024, 19, e0294098. [Google Scholar] [CrossRef]
  19. EFSA Panel on Plant Health (PLH); Bragard, C.; Baptista, P.; Chatzivassiliou, E.; Gonthier, P.; Miret, J.A.J.; Justesen, A.F.; MacLeod, A.; Magnusson, C.S.; Milonas, P.; et al. Commodity risk assessment of Prunus avium plants from United Kingdom. EFSA J. 2024, 22, e8836. [Google Scholar] [CrossRef]
  20. Araújo, M.B.; New, M. Ensemble forecasting of species distributions. Trends Ecol. Evol. 2007, 22, 42–47. [Google Scholar] [CrossRef]
  21. Hao, T.; Elith, J.; Lahoz-Monfort, J.J.; Guillera-Arroita, G. Testing whether ensemble modelling is advantageous for maximising predictive performance of species distribution models. Ecography 2020, 43, 549–558. [Google Scholar] [CrossRef]
  22. Elith, J.; Phillips, S.J.; Hastie, T.; Dudík, M.; Chee, Y.E.; Yates, C.J. A statistical explanation of MaxEnt for ecologists. Divers. Distrib. 2011, 17, 43–57. [Google Scholar] [CrossRef]
  23. Morales-Barbero, J.; Vega-Álvarez, J. Input matters matter: Bioclimatic consistency to map more reliable species distribution models. Methods Ecol. Evol. 2019, 10, 212–224. [Google Scholar] [CrossRef]
  24. Fang, J.; Shi, J.; Zhang, P.; Shao, M.; Zhou, N.; Wang, Y.; Xu, X. Potential distribution projections for Senegalia senegal (L.) Britton under climate change scenarios. Forests 2024, 15, 379. [Google Scholar] [CrossRef]
  25. Luo, J.; Chen, Y.; Wu, Y.; Xie, G.; Jia, W.; Sardar, M.F.; Binobead, M.A.; Li, X. Suitability and structural optimization of vegetation restoration on the loess plateau: A MaxEnt model-based study of environmental and anthropogenic impacts. Forests 2024, 15, 1528. [Google Scholar] [CrossRef]
  26. Bao, X.; Zhou, P.; Zhang, M.; Fang, Y.; Zhang, Q. MaxEnt-based habitat suitability assessment for Vaccinium mandarinorum: Exploring industrial cultivation opportunities. Forests 2024, 15, 2254. [Google Scholar] [CrossRef]
  27. Zurell, D.; Franklin, J.; König, C.; Bouchet, P.J.; Dormann, C.F.; Elith, J.; Fandos, G.; Feng, X.; Guillera-Arroita, G.; Guisan, A.; et al. A standard protocol for reporting species distribution models. Ecography 2020, 43, 1261–1277. [Google Scholar] [CrossRef]
  28. Safaei, M.; Rezayan, H.; Firouzabadi, P.Z.; Sadidi, J. Optimization of species distribution models using a genetic algorithm for simulating climate change effects on Zagros forests in Iran. Ecol. Inform. 2021, 63, 101288. [Google Scholar]
  29. Zeren Cetin, I.; Ozel, H.B.; Varol, T.; Canturk, U.; Sevik, H. Climate change impacts on Taxus baccata distribution and conservation. J. For. Res. 2025, 36, 95. [Google Scholar] [CrossRef]
  30. Cobanoglu, H.; Canturk, U.; Koç, İ.; Kulaç, Ş.; Sevik, H. Climate change effect on potential distribution of Anatolian chestnut (Castanea sativa mill.) in the upcoming century in Türkiye. Forestist 2023, 73, 247–256. [Google Scholar] [CrossRef]
  31. Hijmans, R.J.; Phillips, S.; Leathwick, J.; Elith, J.; Hijmans, M.R.J. Package ‘dismo’. Circles 2017, 9, 1–68. [Google Scholar]
  32. Guisan, A.; Edwards Jr, T.C.; Hastie, T. Generalized linear and generalized additive models in studies of species distributions: Setting the scene. Ecol. Model. 2002, 157, 89–100. [Google Scholar] [CrossRef]
  33. Breiman, L. Random forests. Mach. Learn. 2001, 45, 5–32. [Google Scholar] [CrossRef]
  34. Phillips, S.J.; Anderson, R.P.; Schapire, R.E. Maximum entropy modeling of species geographic distributions. Ecol. Model. 2006, 190, 231–259. [Google Scholar] [CrossRef]
  35. Allouche, O.; Tsoar, A.; Kadmon, R. Assessing the accuracy of species distribution models: Prevalence, kappa and the true skill statistic (TSS). J. Appl. Ecol. 2006, 43, 1223–1232. [Google Scholar] [CrossRef]
  36. HamadAmin, B.A.; Khwarahm, N.R. Mapping impacts of climate change on the distributions of two endemic tree species under socioeconomic pathway scenarios (SSP). Sustainability 2023, 15, 5469. [Google Scholar] [CrossRef]
  37. Li, M.; Sun, Y.; Yang, Y.; Zhang, X. Impacts of climate change and human activity on the habitat distribution of Metasequoia glyptostroboides. Ecol. Evol. 2025, 15, e71269. [Google Scholar] [CrossRef]
  38. Ma, W.X.; Jiang, C. Prediction of the suitable areas of Litchi (Litchi chinensis Sonn.) in China mainland under climate change scenarios. Theor. Appl. Climatol. 2025, 156, 236. [Google Scholar] [CrossRef]
  39. Adhikari, P.; Lee, Y.H.; Poudel, A.; Lee, G.; Hong, S.H.; Park, Y.S. Predicting the impact of climate change on the habitat distribution of Parthenium hysterophorus around the world and in South Korea. Biology 2023, 12, 84. [Google Scholar] [CrossRef]
  40. Zhao, Y.; Zhao, M.; Zhang, L.; Wang, C.; Xu, Y. Predicting possible distribution of tea (Camellia sinensis L.) under climate change scenarios using MaxEnt model in China. Agriculture 2021, 11, 1122. [Google Scholar] [CrossRef]
  41. Zhao, Y.; Zhang, L.; Wang, C. Predicting possible distribution of rice leaf roller (Cnaphalocrocis medinalis) under climate change scenarios using MaxEnt model in China. Sci. Rep. 2024, 14, 21245. [Google Scholar] [CrossRef]
  42. Ye, X.-z.; Zhao, G.-h.; Zhang, M.-z.; Cui, X.-y.; Fan, H.-h.; Liu, B. Distribution pattern of endangered plant Semiliquidambar cathayensis (Hamamelidaceae) in response to climate change after the last interglacial period. Forests 2020, 11, 434. [Google Scholar] [CrossRef]
  43. Zhang, X.; Wei, H.; Zhao, Z.; Liu, J.; Zhang, Q.; Zhang, X.; Gu, W. The global potential distribution of invasive plants: Anredera cordifolia under climate change and human activity based on random forest models. Sustainability 2020, 12, 1491. [Google Scholar] [CrossRef]
  44. Zhang, H.-T.; Wang, W.-T. Prediction of the potential distribution of the endangered species Meconopsis punicea Maxim under future climate change based on four species distribution models. Plants 2023, 12, 1376. [Google Scholar] [CrossRef] [PubMed]
  45. Williams, J.N.; Seo, C.; Thorne, J.; Nelson, J.K.; Erwin, S.; O’Brien, J.M.; Schwartz, M.W. Using species distribution models to predict new occurrences for rare plants. Divers. Distrib. 2009, 15, 565–576. [Google Scholar] [CrossRef]
  46. Ardestani, E.G.; Ghahfarrokhi, Z.H. Ensembpecies distribution modeling of Salvia hydrangea under future climate change scenarios in Central Zagros Mountains, Iran. Glob. Ecol. Conserv. 2021, 26, e01488. [Google Scholar] [CrossRef]
  47. Dutra Silva, L.; Brito de Azevedo, E.; Vieira Reis, F.; Bento Elias, R.; Silva, L. Limitations of species distribution models based on available climate change data: A case study in the Azorean forest. Forests 2019, 10, 575. [Google Scholar] [CrossRef]
  48. Sung, S.; Kwon, Y.S.; Lee, D.K.; Cho, Y. Predicting the potential distribution of an invasive species, Solenopsis invicta Buren (Hymenoptera: Formicidae), under climate change using species distribution models. Entomol. Res. 2018, 48, 505–513. [Google Scholar] [CrossRef]
  49. Alavi, S.J.; Ahmadi, K.; Hosseini, S.M.; Tabari, M.; Nouri, Z. The response of English yew (Taxus baccata L.) to climate change in the Caspian Hyrcanian Mixed Forest ecoregion. Reg. Environ. Change 2019, 19, 1495–1506. [Google Scholar] [CrossRef]
  50. Adhikari, P.; Lee, Y.H.; Adhikari, P.; Hong, S.H.; Park, Y.-S. Climate change-induced invasion risk of ecosystem disturbing alien plant species: An evaluation using species distribution modeling. Front. Ecol. Evol. 2022, 10, 880987. [Google Scholar] [CrossRef]
  51. Varol, T.; Cetin, M.; Ozel, H.B.; Sevik, H.; Zeren Cetin, I. The effects of climate change scenarios on Carpinus betulus and Carpinus orientalis in Europe. Water Air Soil Pollut. 2022, 233, 45. [Google Scholar] [CrossRef]
  52. Varol, T.; Canturk, U.; Cetin, M.; Ozel, H.B.; Sevik, H.; Zeren Cetin, I. Identifying the suitable habitats for Anatolian boxwood (Buxus sempervirens L.) for the future regarding the climate change. Theor. Appl. Climatol. 2022, 150, 637–647. [Google Scholar] [CrossRef]
  53. Körner, C. The use of ‘altitude’in ecological research. Trends Ecol. Evol. 2007, 22, 569–574. [Google Scholar] [CrossRef]
  54. Lenoir, J.; Gégout, J.C.; Marquet, P.A.; de Ruffray, P.; Brisse, H. A significant upward shift in plant species optimum elevation during the 20th century. Science 2008, 320, 1768–1771. [Google Scholar] [CrossRef] [PubMed]
  55. Fedriani, J.M.; Wiegand, T.; Garrote, P.J.; Leiva, M.J.; Ayllón, D. Seed dispersal effectiveness in fragmented and defaunated landscapes. Ecosphere 2023, 14, e4658. [Google Scholar] [CrossRef]
  56. Takahashi, K.; Kamitani, T. Effect of dispersal capacity on forest plant migration at a landscape scale. J. Ecol. 2004, 92, 778–785. [Google Scholar] [CrossRef]
  57. Nathan, R.; Muller-Landau, H.C. Spatial patterns of seed dispersal, their determinants and consequences for recruitment. Trends Ecol. Evol. 2000, 15, 278–285. [Google Scholar] [CrossRef]
  58. Qiu, T.; Sharma, S.; Woodall, C.W.; Clark, J.S. Niche shifts from trees to fecundity to recruitment that determine species response to climate change. Front. Ecol. Evol. 2021, 9, 719141. [Google Scholar] [CrossRef]
  59. Canturk, U.; Kulaç, Ş. The effects of climate change scenarios on Tilia ssp. in Turkey. Environ. Monit. Assess. 2021, 193, 771. [Google Scholar] [CrossRef] [PubMed]
  60. Gómez-Pineda, E.; Sáenz-Romero, C.; Ortega-Rodríguez, J.M.; Blanco-García, A.; Madrigal-Sánchez, X.; Lindig-Cisneros, R.; Lopez-Toledo, L.; Pedraza-Santos, M.E.; Rehfeldt, G.E. Suitable climatic habitat changes for Mexican conifers along altitudinal gradients under climatic change scenarios. Ecol. Appl. 2020, 30, e02041. [Google Scholar] [CrossRef]
  61. Li, D.; Yue, D.; Liu, D.; Zhang, L.; Song, S. Phytochemical and chemotaxonomic study on Ziziphus jujuba Mill. (Rhamnaceae). Biochem. Syst. Ecol. 2020, 91, 104058. [Google Scholar] [CrossRef]
  62. Fyllas, N.M.; Koufaki, T.; Sazeides, C.I.; Spyroglou, G.; Theodorou, K. Potential impacts of climate change on the habitat suitability of the dominant tree species in Greece. Plants 2022, 11, 1616. [Google Scholar] [CrossRef]
  63. Bolte, A.; Czajkowski, T.; Kompa, T. The north-eastern distribution range of European beech—A review. Forestry 2007, 80, 413–429. [Google Scholar] [CrossRef]
  64. Dyderski, M.K.; Paź, S.; Frelich, L.E.; Jagodziński, A.M. How much does climate change threaten European forest tree species distributions? Glob. Change Biol. 2018, 24, 1150–1163. [Google Scholar] [CrossRef]
  65. Lenoir, J.; Bertrand, R.; Comte, L.; Bourgeaud, L.; Hattab, T.; Murienne, J.; Grenouillet, G. Species better track climate warming in the oceans than on land. Nat. Ecol. Evol. 2020, 4, 1044–1059. [Google Scholar] [CrossRef]
  66. Vitasse, Y.; Lenz, A.; Kollas, C.; Randin, C.F.; Hoch, G.; Körner, C. Genetic vs. non-genetic responses of leaf morphology and growth to elevation in temperate tree species. Funct. Ecol. 2014, 28, 243–252. [Google Scholar] [CrossRef]
  67. Arend, M.; Brem, A.; Kuster, T.M.; Günthardt-Goerg, M.S. Seasonal photosynthetic responses of European oaks to drought and elevated daytime temperature. Plant Biol. 2013, 15, 169–176. [Google Scholar] [CrossRef]
  68. Chmura, D.; Rozkowski, R. Variability of beech provenances in spring and autumn phenology. Silvae Genet. 2002, 51, 123–127. [Google Scholar]
  69. Dossa, K.F.; Bissonnette, J.F.; Barrette, N.; Bah, I.; Miassi, Y.E. Projecting climate change impacts on Benin’s cereal production by 2050: A SARIMA and PLS-SEM analysis of FAO data. Climate 2025, 13, 19. [Google Scholar] [CrossRef]
  70. Wolfe, J.D.; Luther, D.A.; Jirinec, V.; Collings, J.; Johnson, E.I.; Bierregaard Jr, R.O.; Stouffer, P.C. Climate change aggravates bird mortality in Pristine tropical forests. Sci. Adv. 2025, 11, eadq8086. [Google Scholar] [CrossRef] [PubMed]
  71. Andrade, C.; Fonseca, A.; Santos, J.A.; Bois, B.; Jones, G.V. Historic changes and future projections in Köppen–Geiger climate classifications in major wine regions worldwide. Climate 2024, 12, 94. [Google Scholar] [CrossRef]
  72. Becker, C.; Berthomé, R.; Delavault, P.; Flutre, T.; Fréville, H.; Gibot-Leclerc, S.; Le Corre, V.; Morel, J.-B.; Moutier, N.; Munos, S. The ecologically relevant genetics of plant–plant interactions. Trends Plant Sci. 2023, 28, 31–42. [Google Scholar] [CrossRef] [PubMed]
  73. Cebi Kilicoglu, M. Metagenomic characterization of root fungal microbiota resistant to heavy metal stress in Pinus brutia. Water Air Soil Pollut. 2024, 235, 654. [Google Scholar] [CrossRef]
  74. Love, J.M.; Ferris, K.G. Local adaptation to an altitudinal gradient: The interplay between mean phenotypic trait variation and phenotypic plasticity in Mimulus laciniatus. Perspect. Plant Ecol. Evol. Syst. 2024, 63, 125795. [Google Scholar] [CrossRef]
  75. Ergül, H.A.; Kravkaz Kuşçu, İ.S. Variations in Sr, Tl, and V concentrations at copper mining sites based on soil depth, plant species, and plant organ. BioResources 2024, 19, 7931–7945. [Google Scholar] [CrossRef]
  76. Napier, J.D.; Heckman, R.W.; Juenger, T.E. Gene-by-environment interactions in plants: Molecular mechanisms, environmental drivers, and adaptive plasticity. Plant Cell 2023, 35, 109–124. [Google Scholar] [CrossRef] [PubMed]
  77. Rahman, M.; Islam, M.; Braeuning, A. Tree radial growth is projected to decline in South Asian moist forest trees under climate change. Glob. Planet. Change 2018, 170, 106–119. [Google Scholar] [CrossRef]
  78. Feeley, K.J.; Silman, M.R. Keep collecting: Accurate species distribution modelling requires more collections than previously thought. Divers. Distrib. 2011, 17, 1132–1140. [Google Scholar] [CrossRef]
  79. Graham, C.H.; Hijmans, R.J. A comparison of methods for mapping species ranges and species richness. Glob. Ecol. Biogeogr. 2006, 15, 578–587. [Google Scholar] [CrossRef]
  80. Taylor Aiken, G.; Middlemiss, L.; Sallu, S.; Hauxwell-Baldwin, R. Researching climate change and community in neoliberal contexts: An emerging critical approach. Wiley Interdiscip. Rev. Clim. Change 2017, 8, e463. [Google Scholar] [CrossRef]
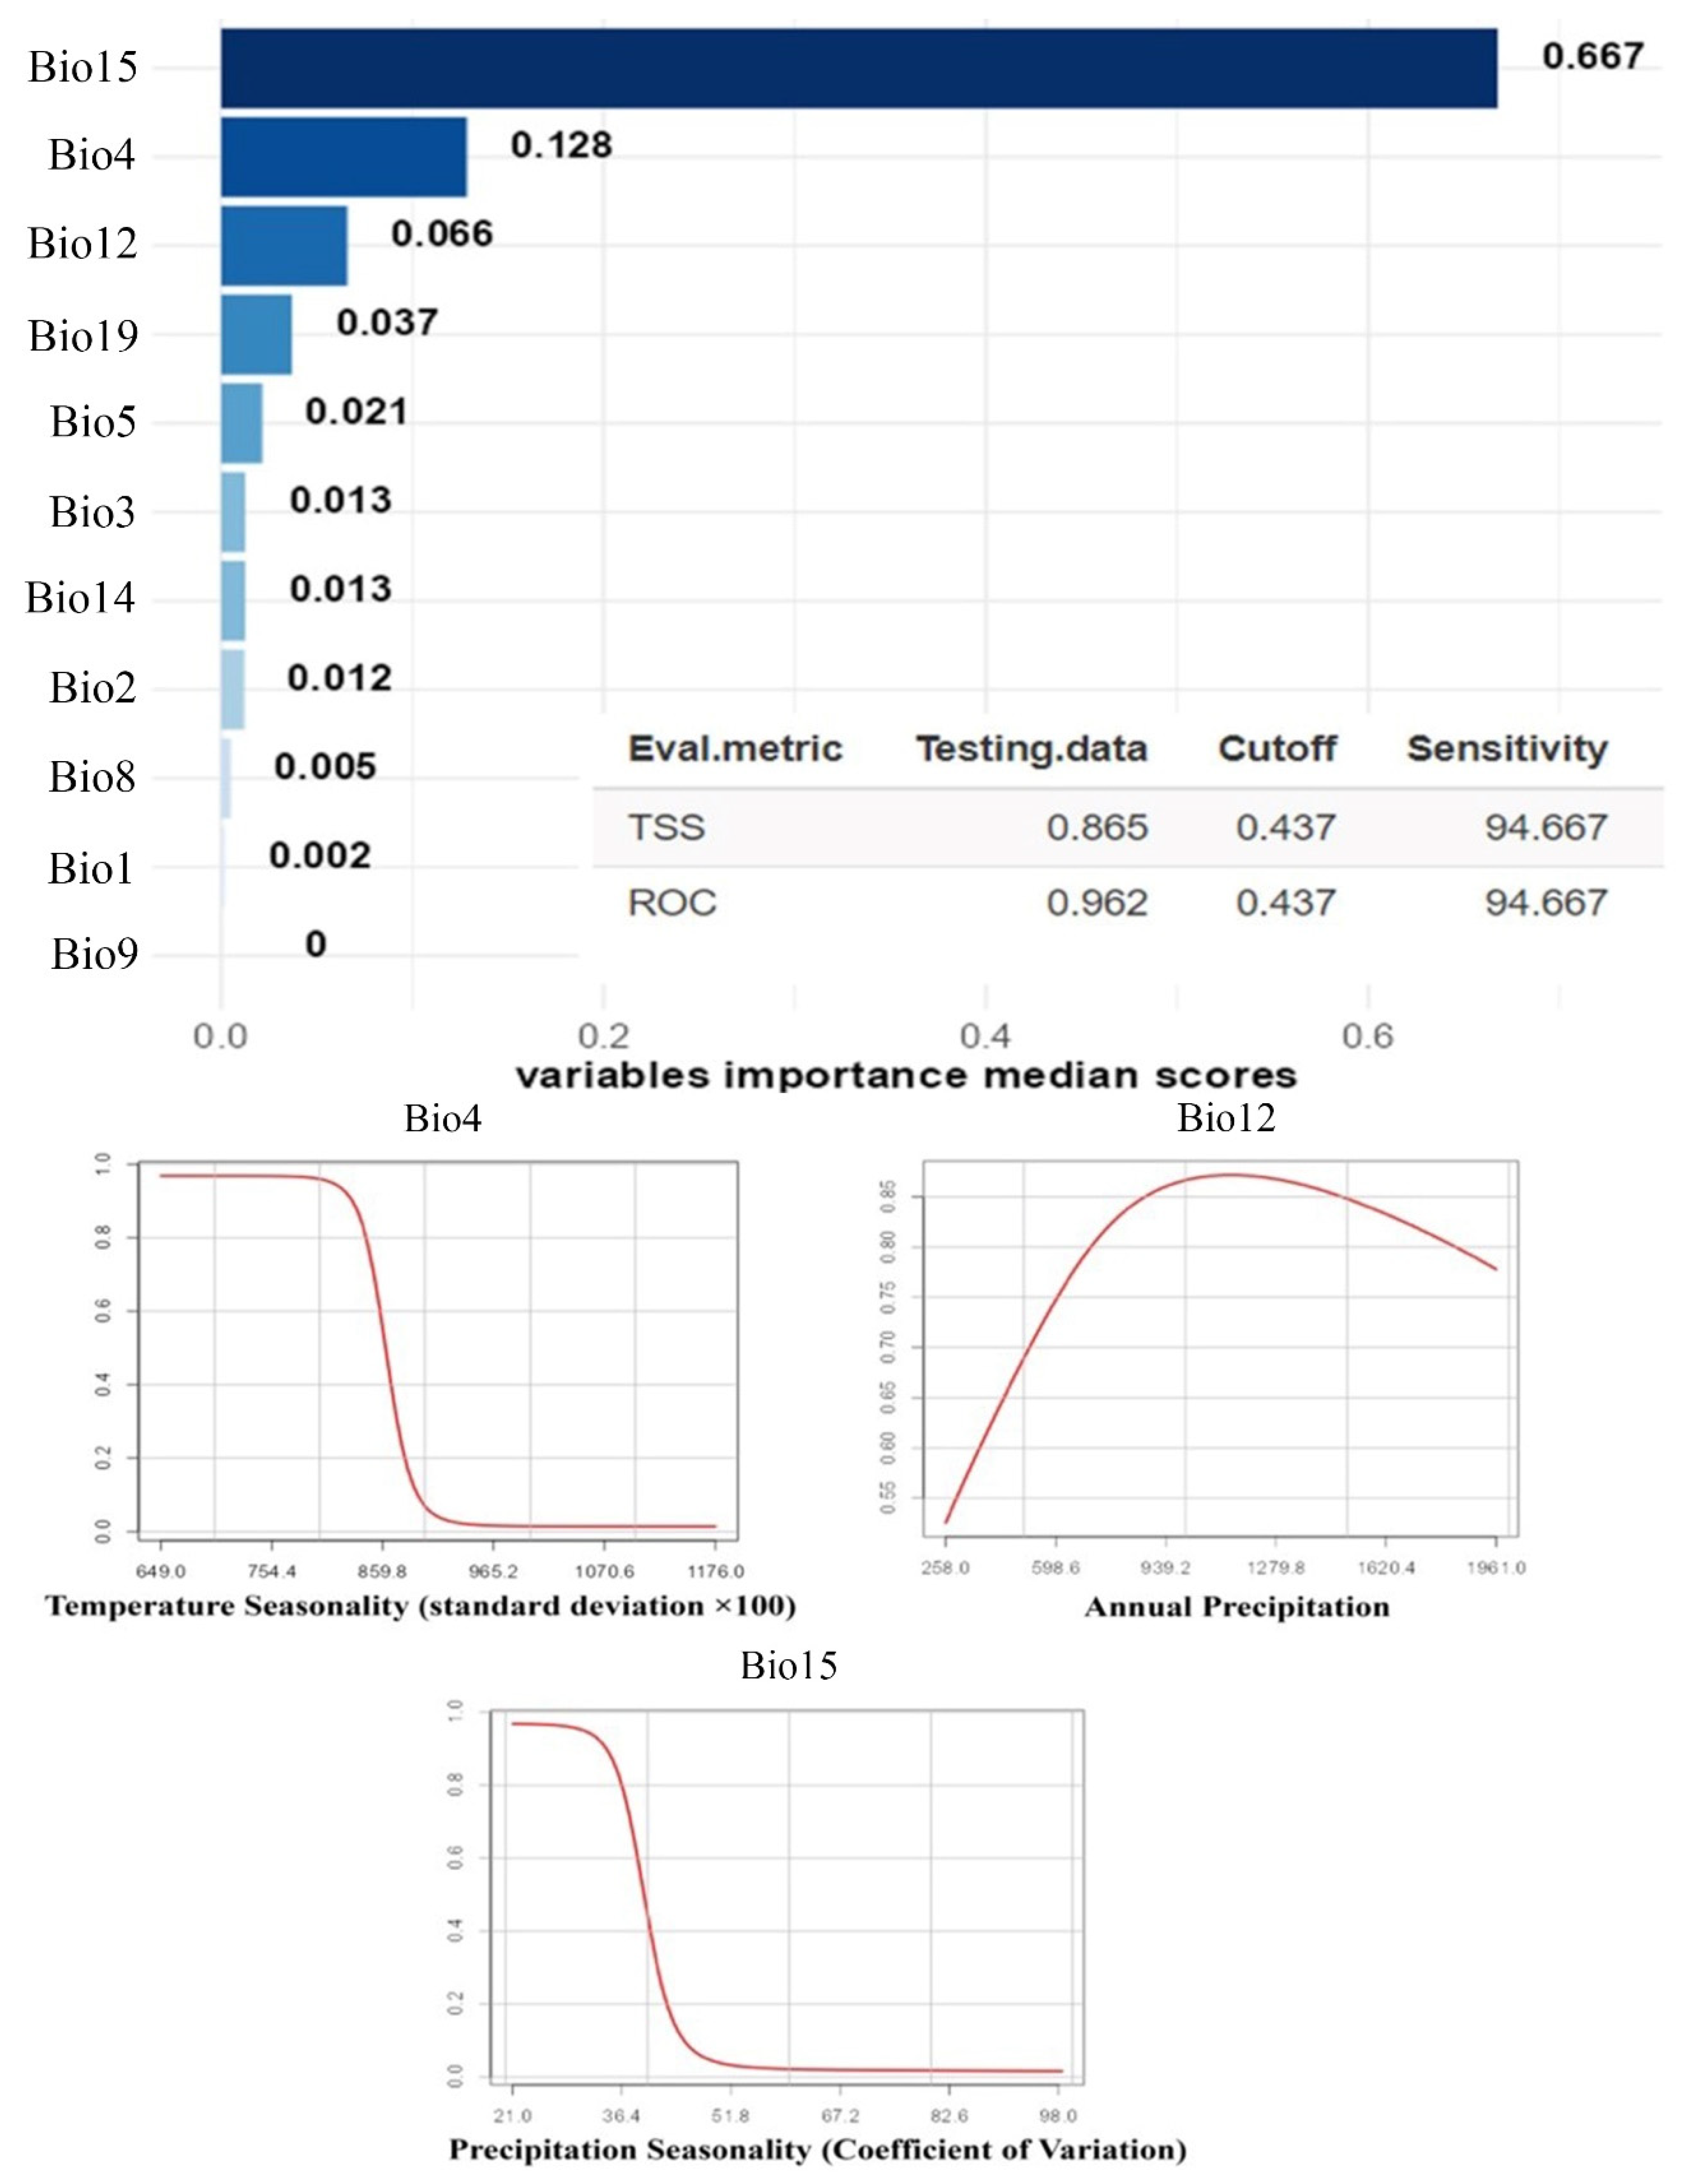
Figure 1. Effects of environmental parameters on the distribution range of Prunus avium in the MaxEnt model.
Forests 16 01484 g001
Figure 2. Effects of environmental parameters on the distribution range of Prunus avium in the GAM model.
Forests 16 01484 g002
Figure 3. Effects of environmental factors on the distribution range of Prunus avium in the RF model.
Forests 16 01484 g003
Figure 4. Current and projected future distributions of Prunus avium under moderate (SSP2-4.5) and high-emission (SSP5-8.5) scenarios. Dark green colors indicate higher habitat suitability, with blue areas representing unsuitable regions (probability < 0.5).
Forests 16 01484 g004
Figure 5. Changes in the proper distribution ranges of Prunus avium.
Forests 16 01484 g005
Table 1. Bioclimatic variables (WorldClim) used in the species distribution modeling.
Variable TypeLabelDescriptionUnit
Bioclimatic (Bio)Bio1 *Annual Mean Temperature°C
Bio2 *Mean Diurnal Range (Mean of monthly (max temp − min temp))°C
Bio3 *Isothermality (Bio2/Bio7) (×100)
Bio4 *Temperature Seasonality (standard deviation × 100)°C
Bio5 *Max Temperature of Warmest Month°C
Bio6Min Temperature of Coldest Month°C
Bio7Temperature Annual Range (Bio5–Bio6)°C
Bio8 *Mean Temperature of Wettest Quarter°C
Bio9 *Mean Temperature of Driest Quarter°C
Bio10Mean Temperature of Warmest Quarter°C
Bio11Mean Temperature of Coldest Quarter°C
Bio12 *Annual Precipitationmm
Bio13Precipitation of Wettest Monthmm
Bio14 *Precipitation of Driest Monthmm
Bio15 *Precipitation Seasonality (Coefficient of Variation)-
Bio16Precipitation of Wettest Quartermm
Bio17Precipitation of Driest Quartermm
Bio18Precipitation of Warmest Quartermm
Bio19 *Precipitation of Coldest Quartermm
* indicates the selected (biologically meaningful) variables for P. avium’s distribution modelling.
Table 2. Suitable distribution ranges of Prunus avium.
ScenarioSuitability202220602100
MaxEntGAMRFMaxEntGAMRFMaxEntGAMRF
SSP2-450.0–0.591.5889.6391.7590.9889.1790.3291.4789.090.14
0.5–0.62.281.040.752.531.270.82.291.280.6
0.6–0.72.201.160.752.681.020.782.531.260.65
0.7–0.82.901.290.912.841.011.072.561.450.93
0.8–0.90.861.921.380.961.691.801.152.421.40
0.9–1.00.184.964.460.015.845.2304.596.28
SSP5-850.0–0.591.5889.6391.7591.4989.2689.8791.2788.2390.21
0.5–0.62.281.040.752.261.140.782.431.171.05
0.6–0.72.201.160.752.631.120.732.521.311.03
0.7–0.82.901.290.912.511.240.972.461.591.38
0.8–0.90.861.921.381.111.961.541.212.322.09
0.9–1.00.184.964.4605.286.110.115.384.24
Table 3. Changes in the proper distribution ranges of Prunus avium.
SSP2-45SSP5-85
MaxEntGAMRFMaxEntGAMRF
Unsuitable (%)90.1587.4489.7189.9286.6189.68
Unchanging (%)7.108.817.817.068.757.72
Contraction (%)1.321.560.441.351.620.53
Expansion (%)1.432.192.041.673.022.07
Disclaimer/Publisher’s Note: The statements, opinions and data contained in all publications are solely those of the individual author(s) and contributor(s) and not of MDPI and/or the editor(s). MDPI and/or the editor(s) disclaim responsibility for any injury to people or property resulting from any ideas, methods, instructions or products referred to in the content.