Spatial Structure Evaluation of Chinese Fir Plantation in Hilly Area of Southern China Based on UAV and Cloud Model
Abstract
1. Introduction
2. Materials and Methods
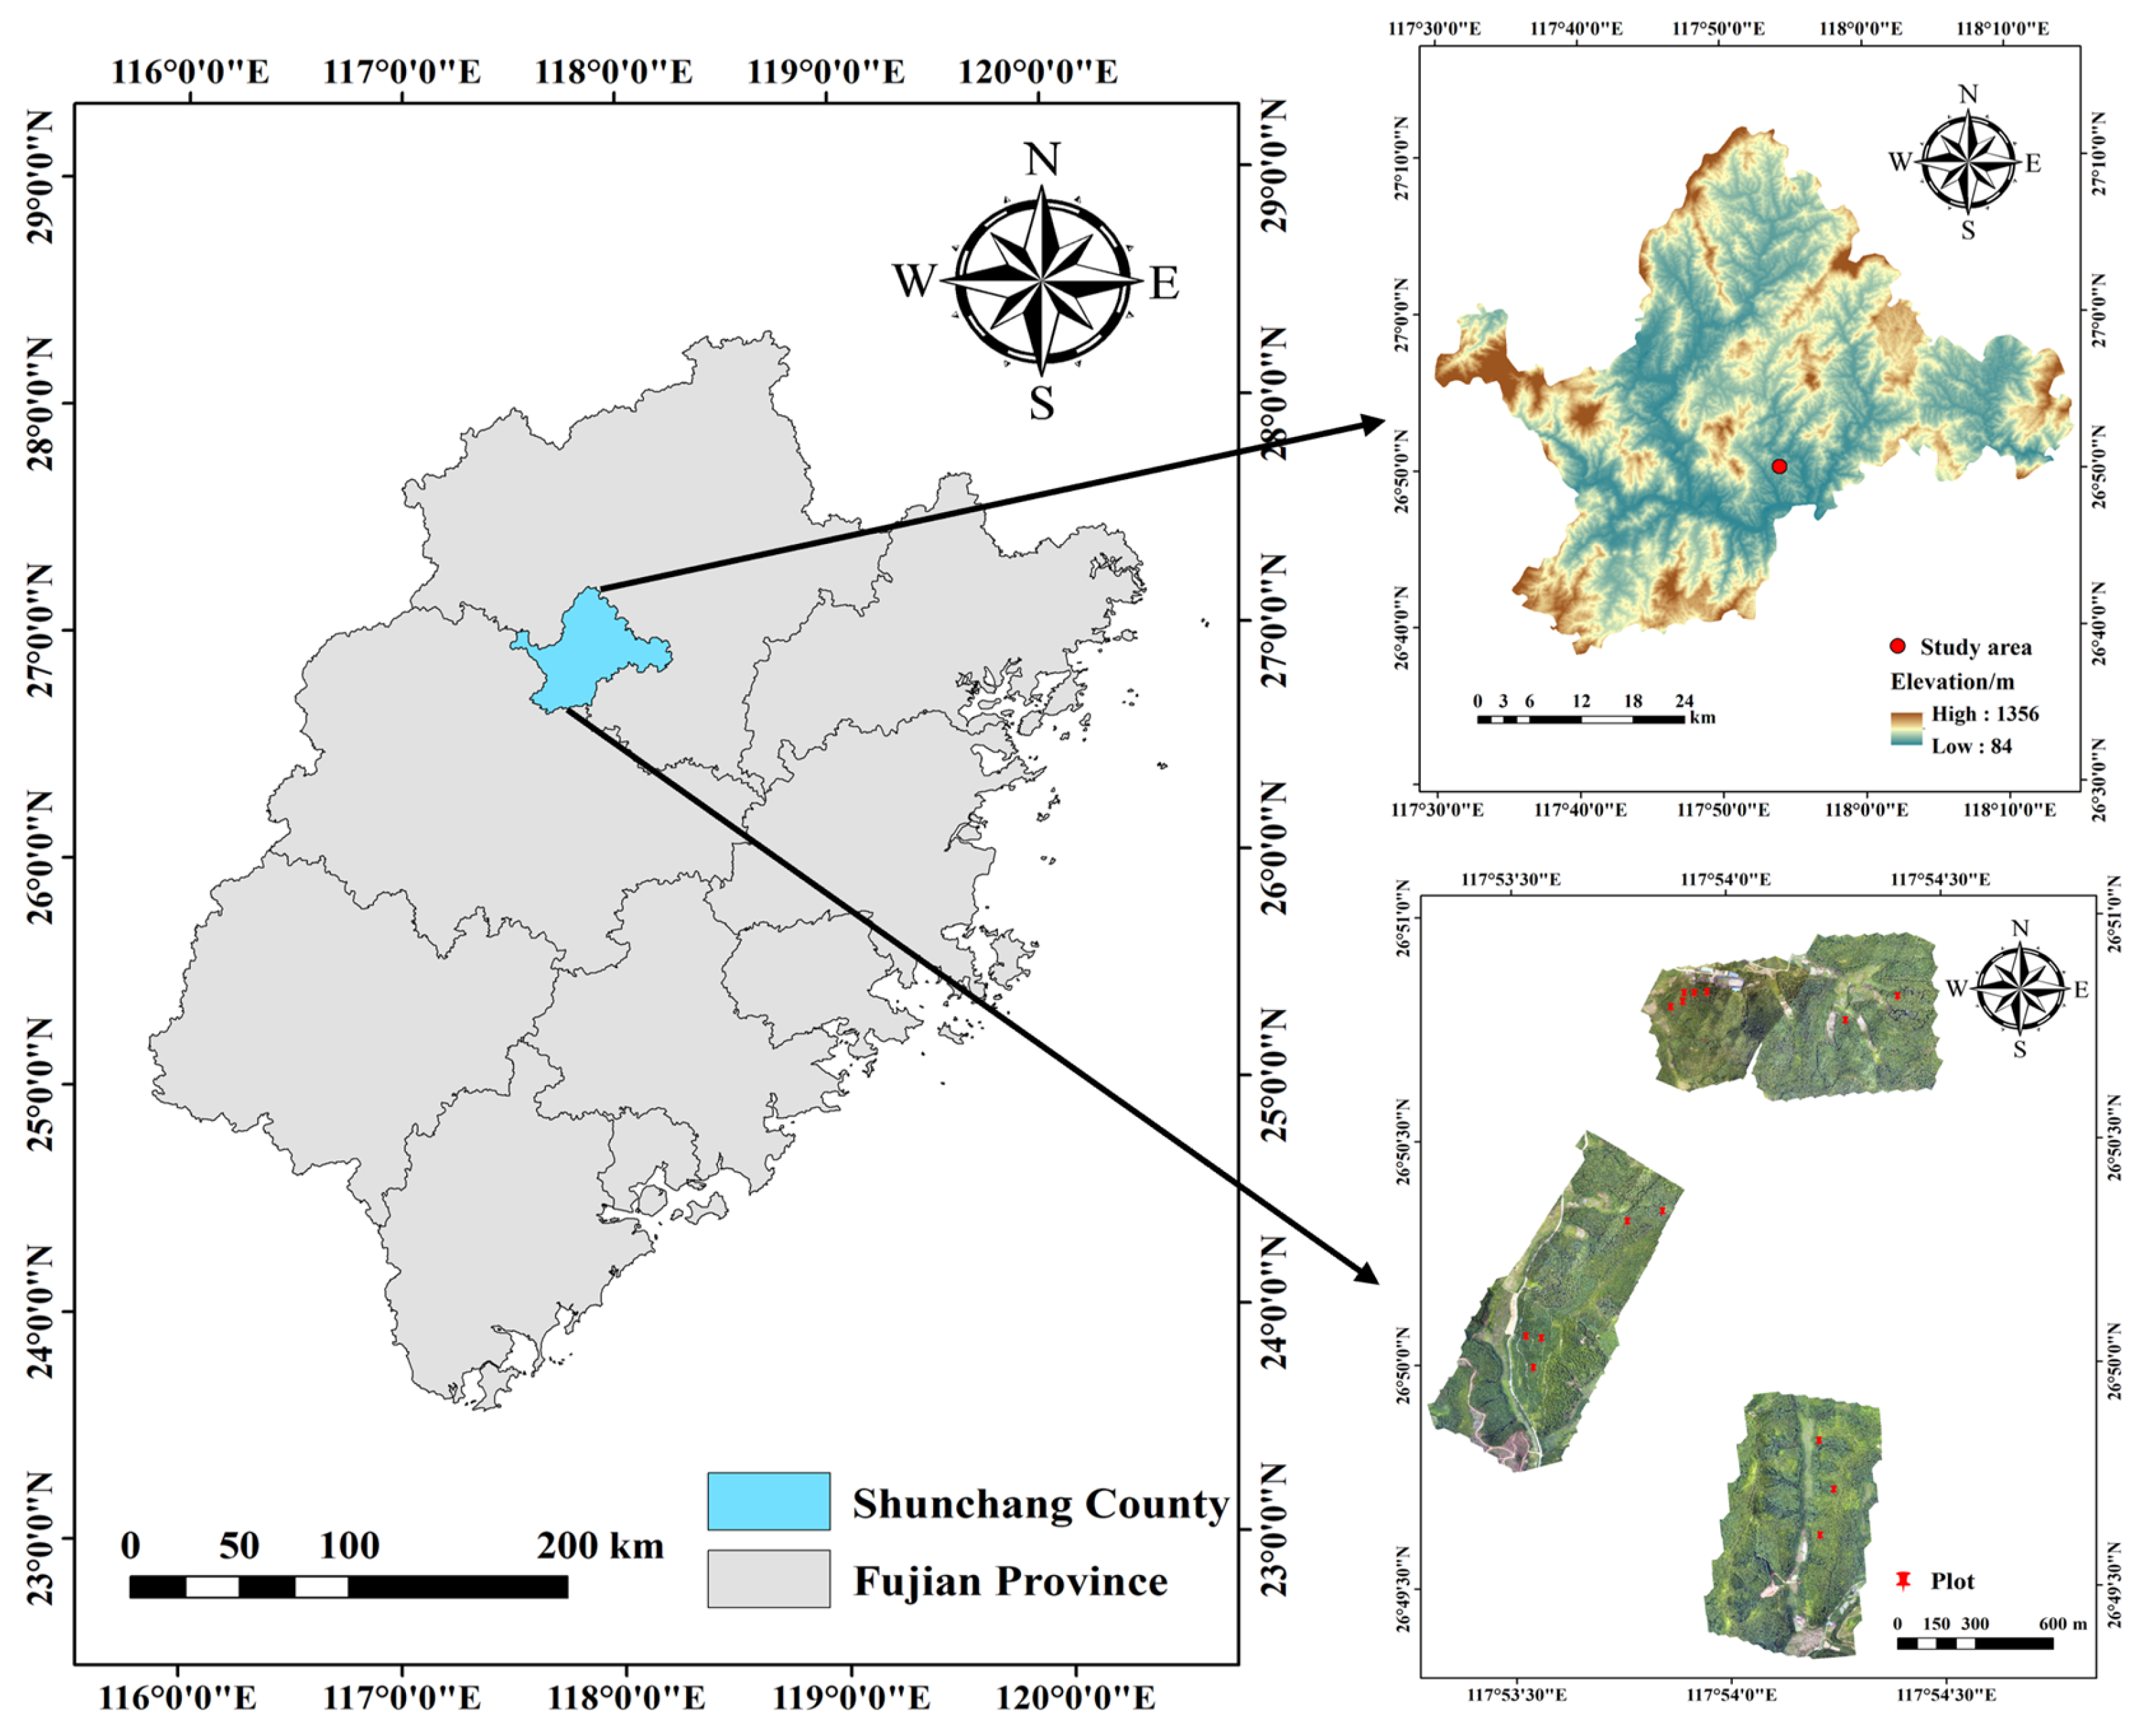
2.1. Study Area
2.2. Data Acquisition
2.3. Method
2.3.1. Extraction of Single-Tree Parameters
- (1)
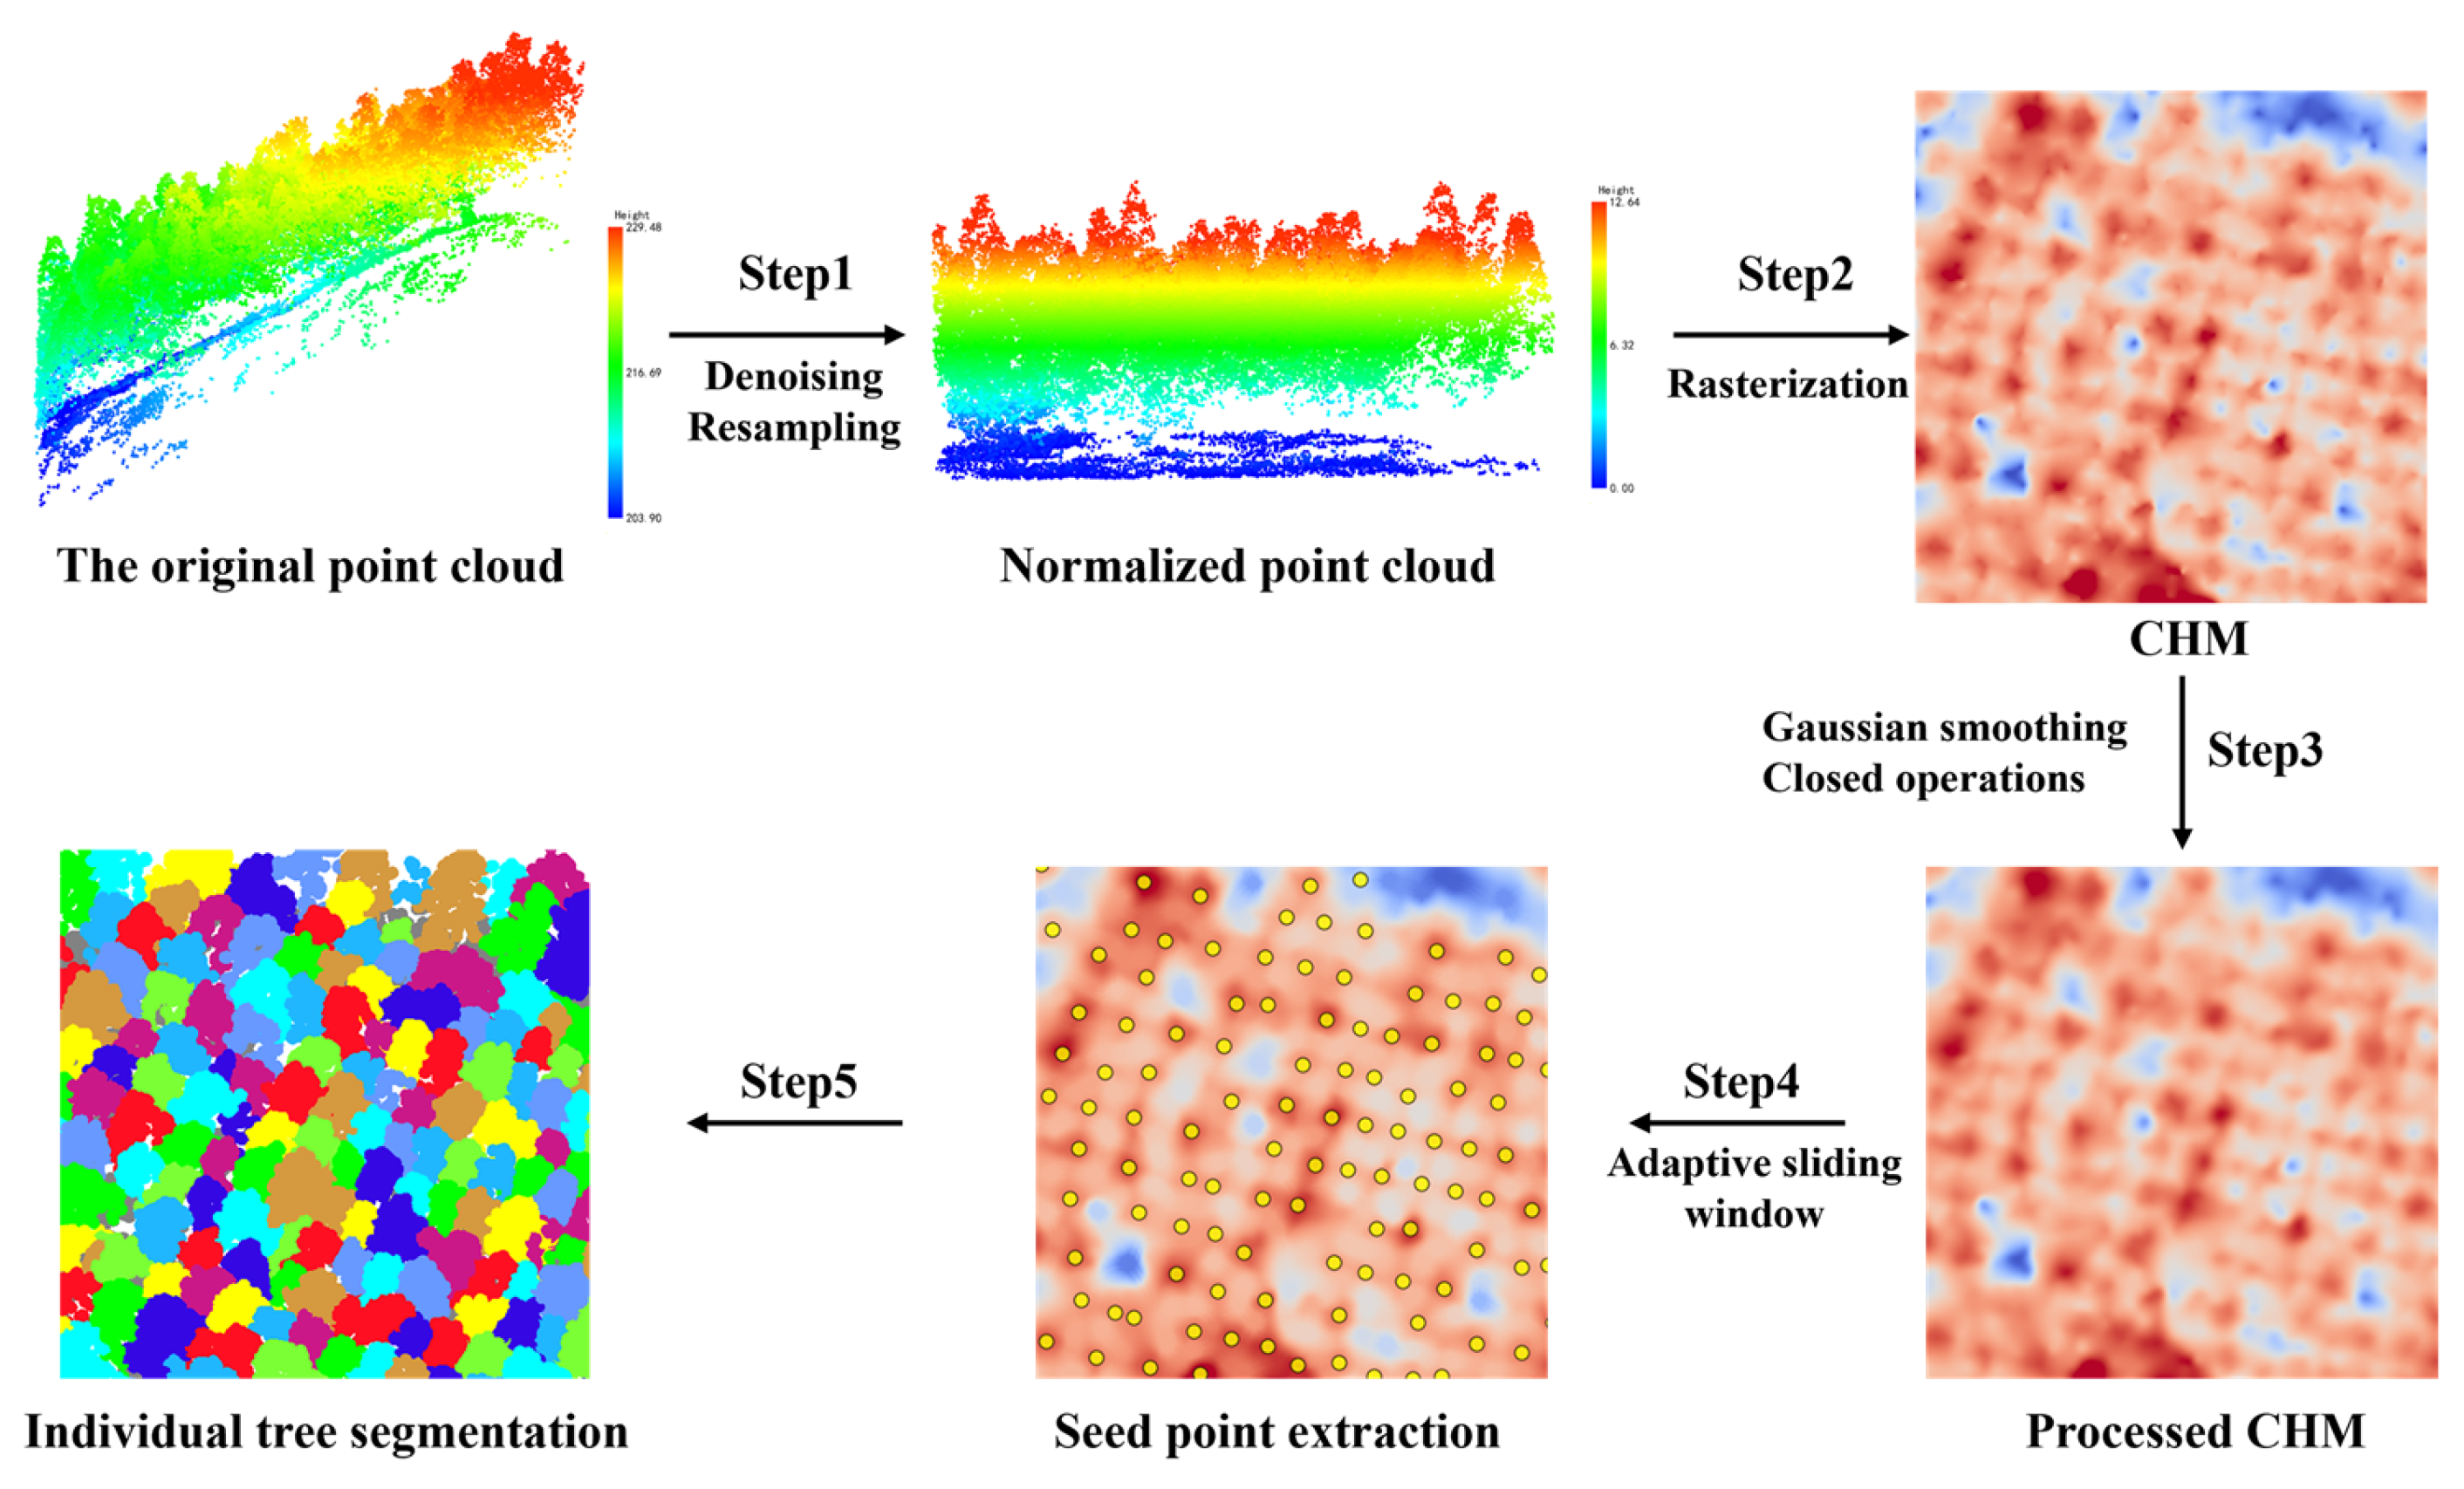
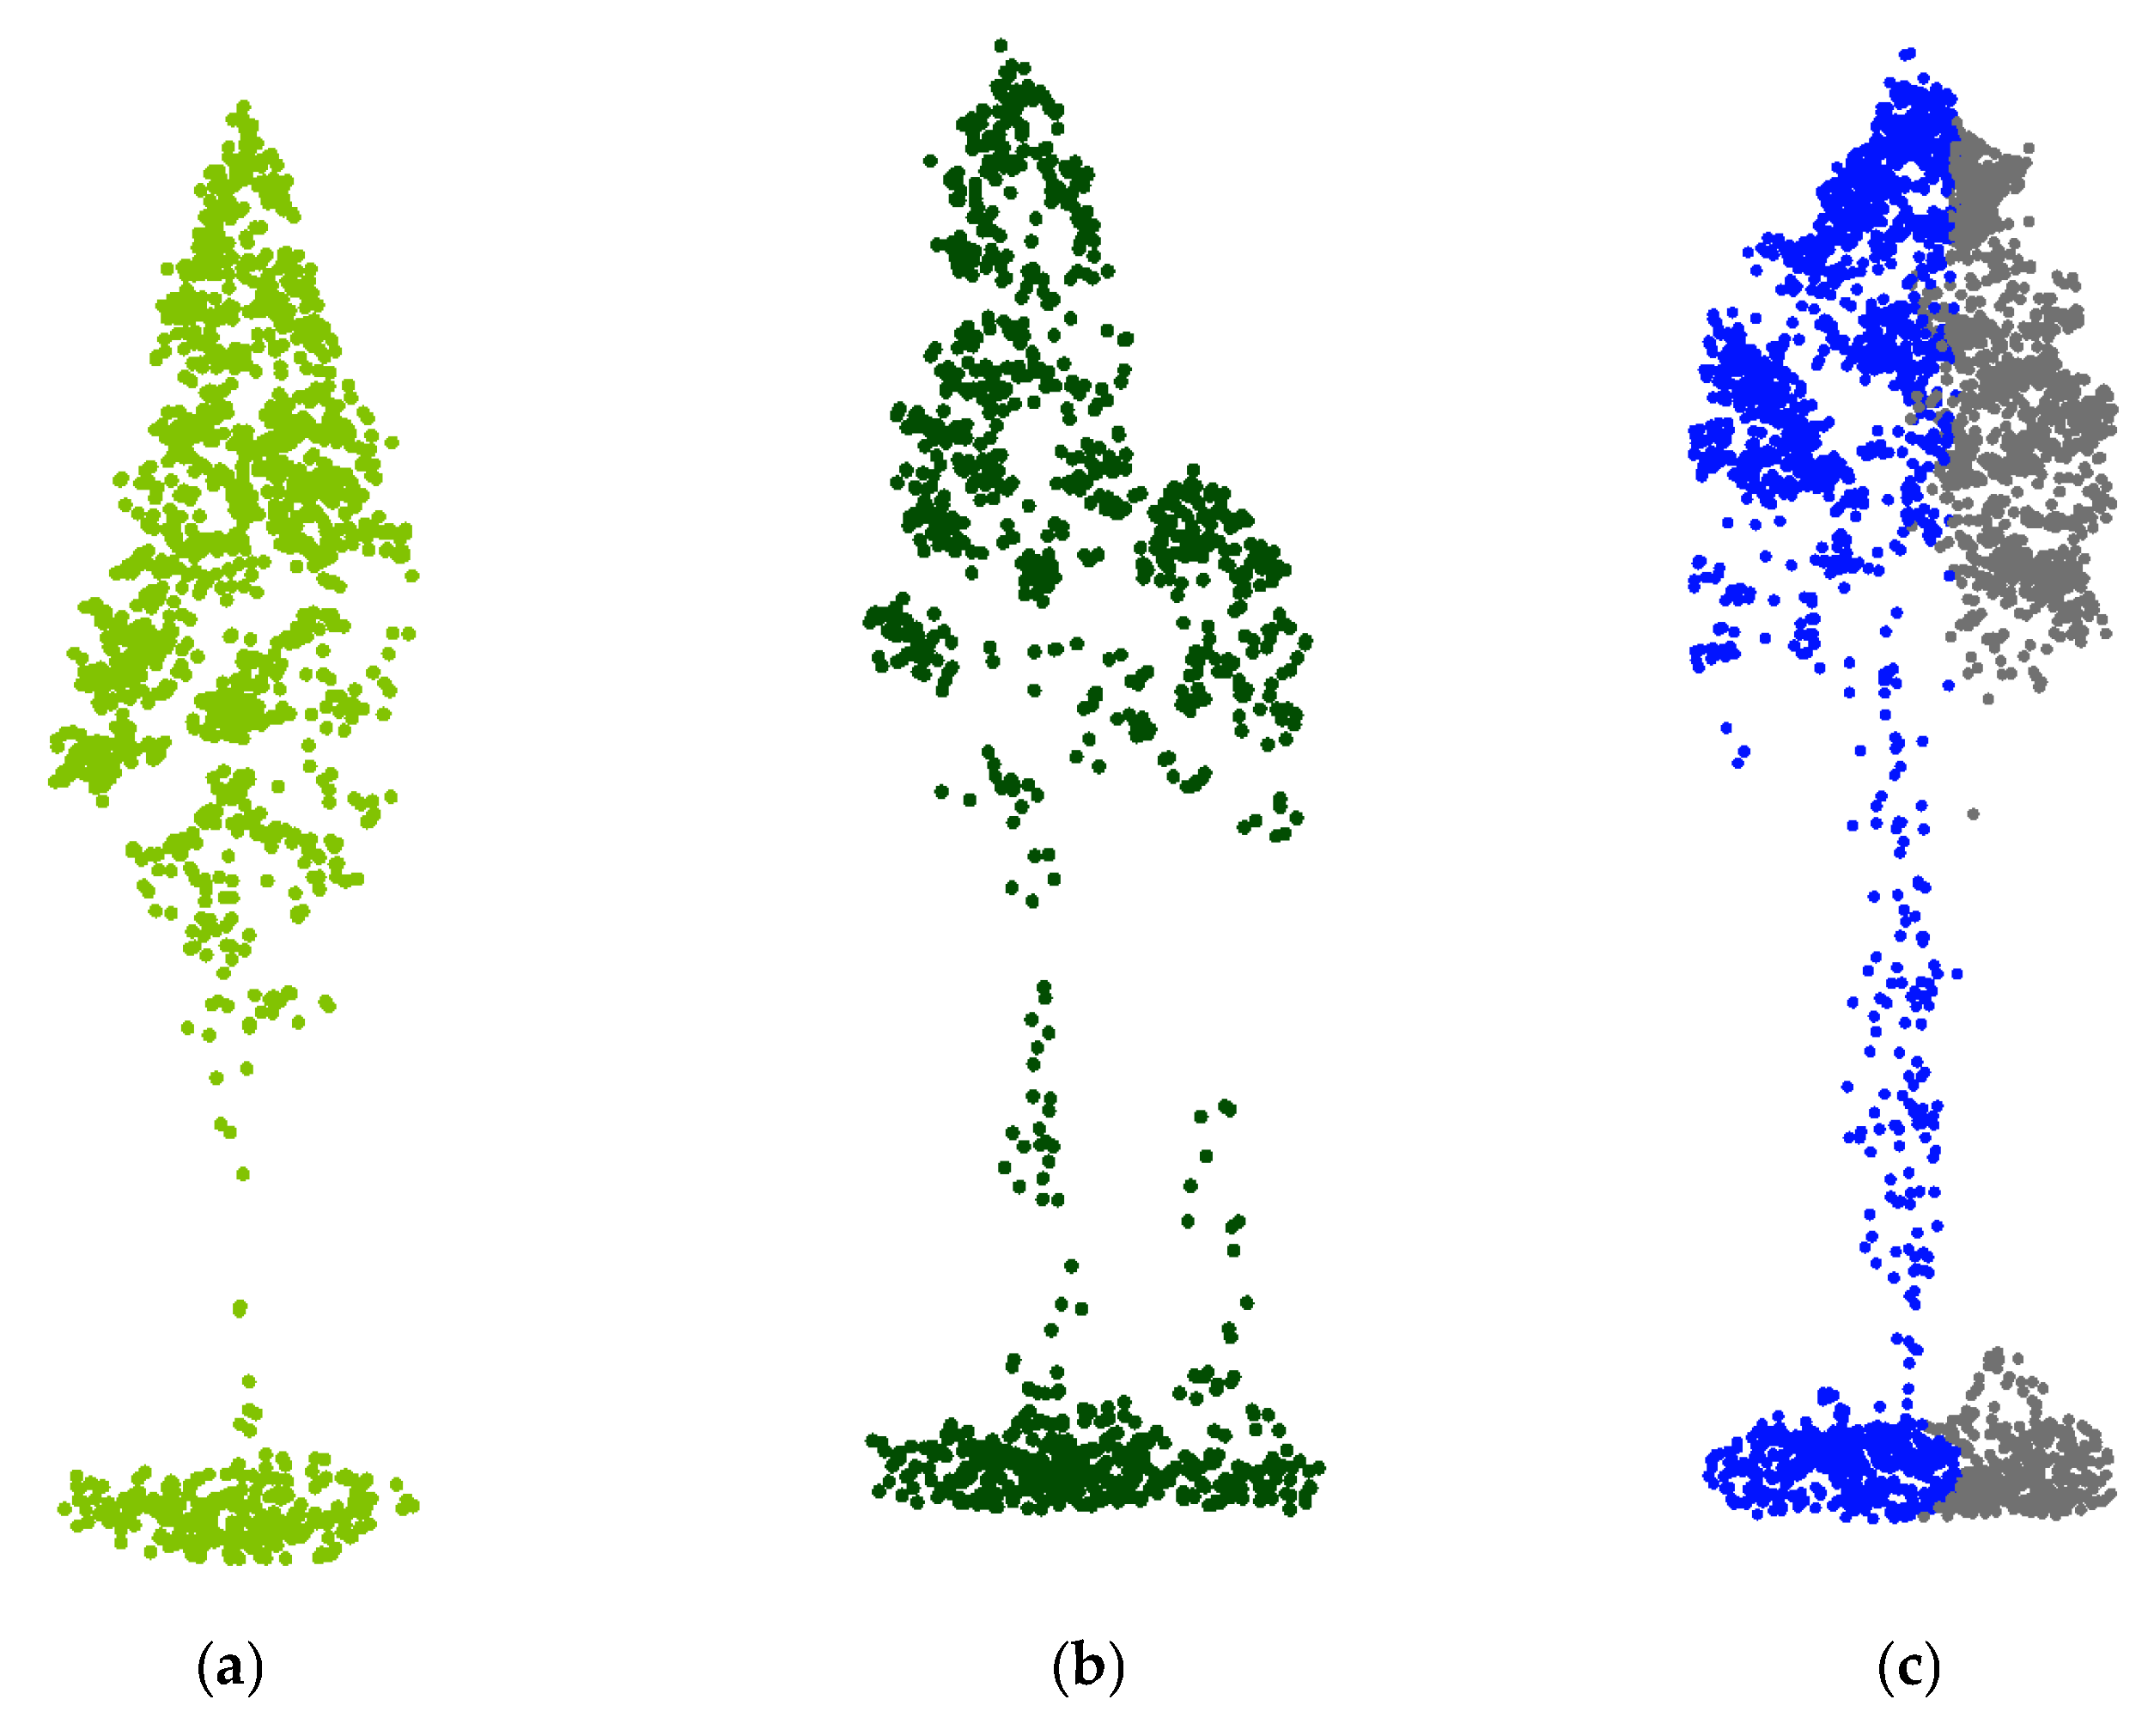
- Single-tree segmentation with CHM (Canopy Height Model) and point cloud
- (2)
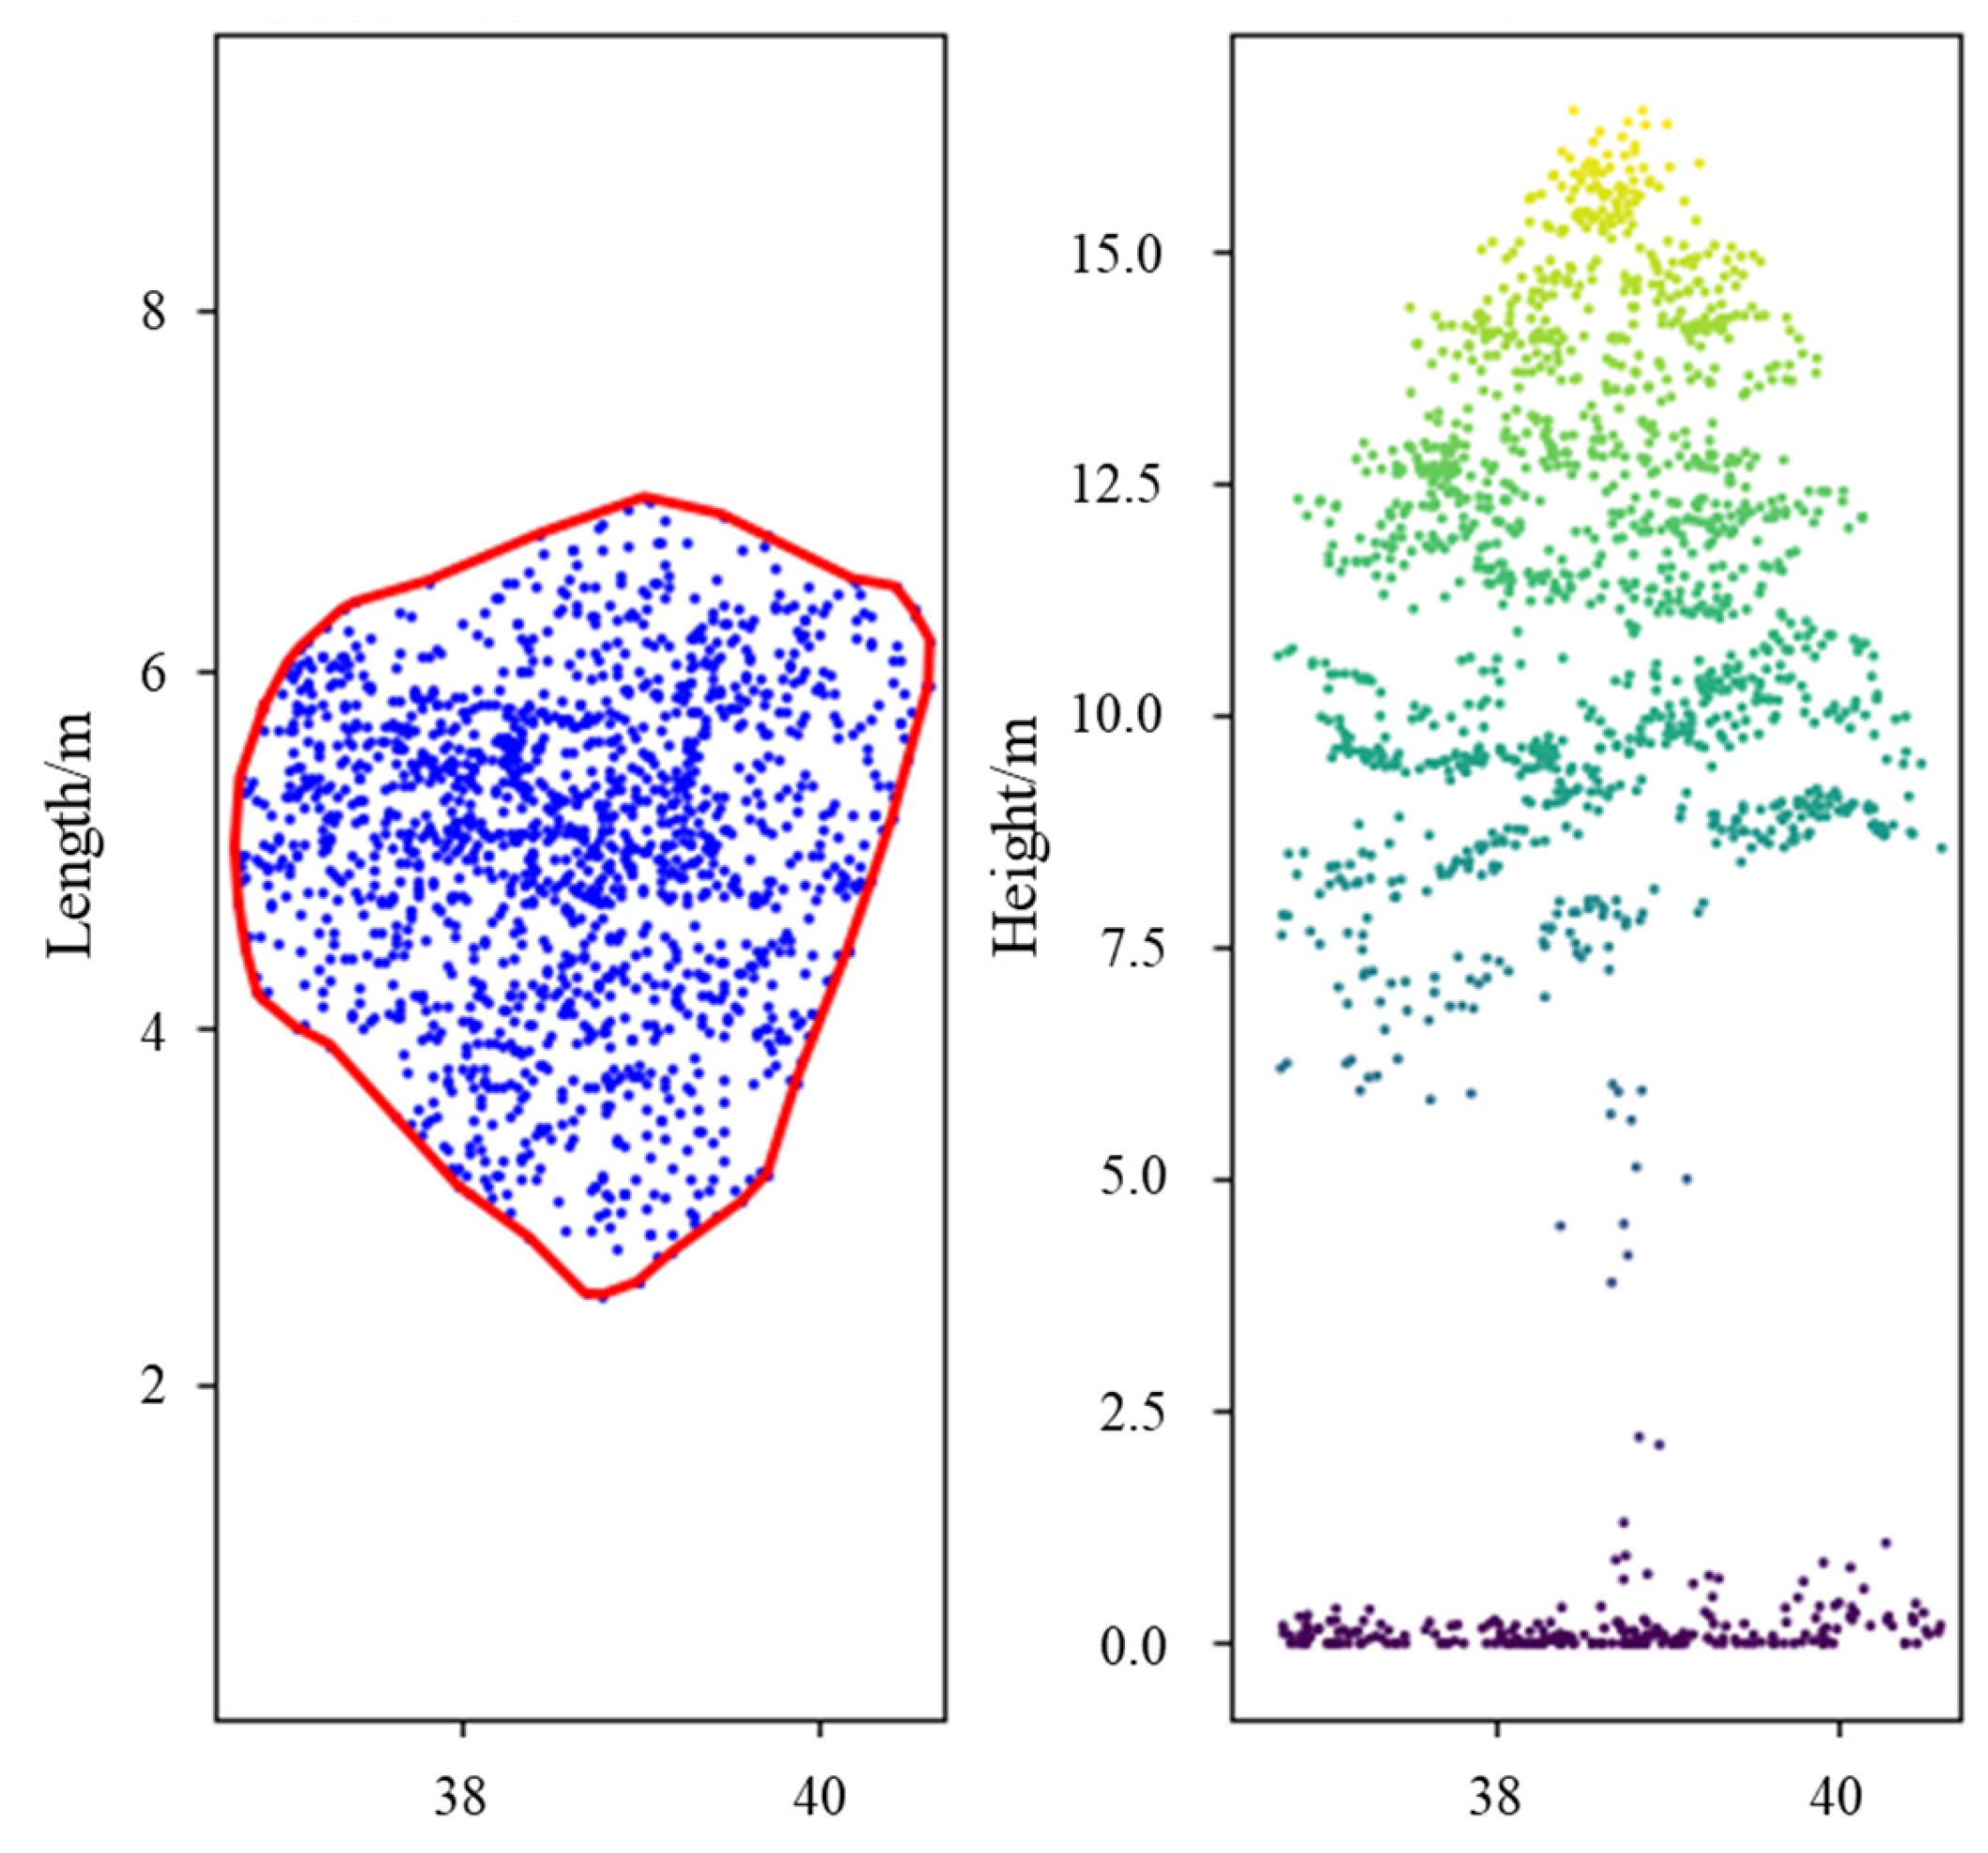
- Crown width extraction based on Alpha-shape algorithm
- (3)
- Construction of single-tree DBH model
- (4)
- Accuracy validation
2.3.2. Stand Spatial Structure Evaluation Indicators
2.3.3. Evaluation of Model Construction
- (1)
- Single weight empowerment method
- (2)
- Calculation of comprehensive weights based on game theory
- (3)
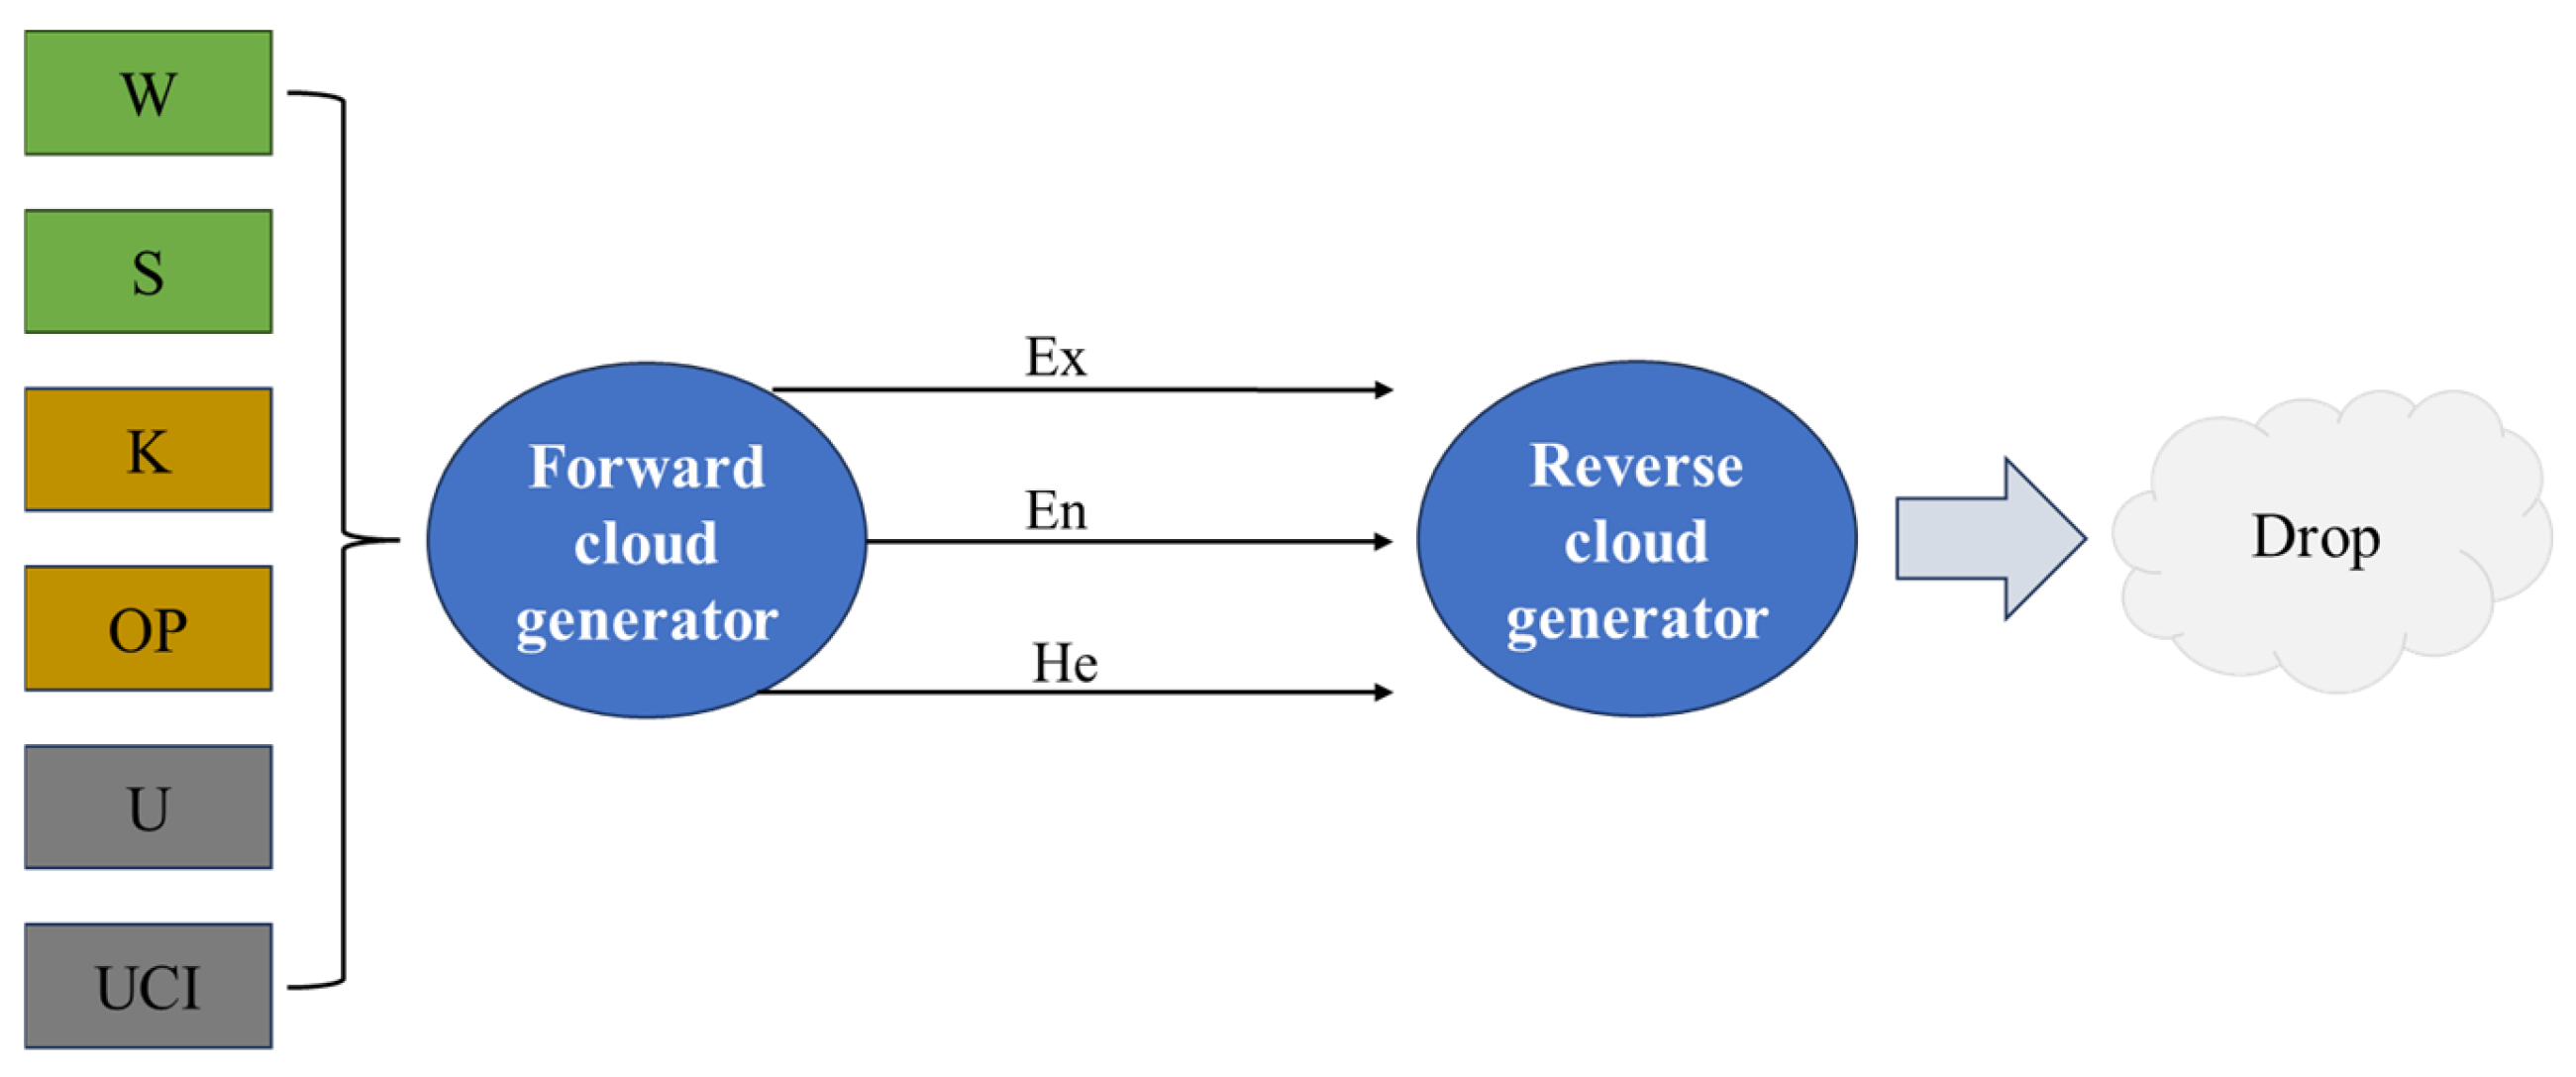
- Spatial structure evaluation model based on cloud model
3. Results
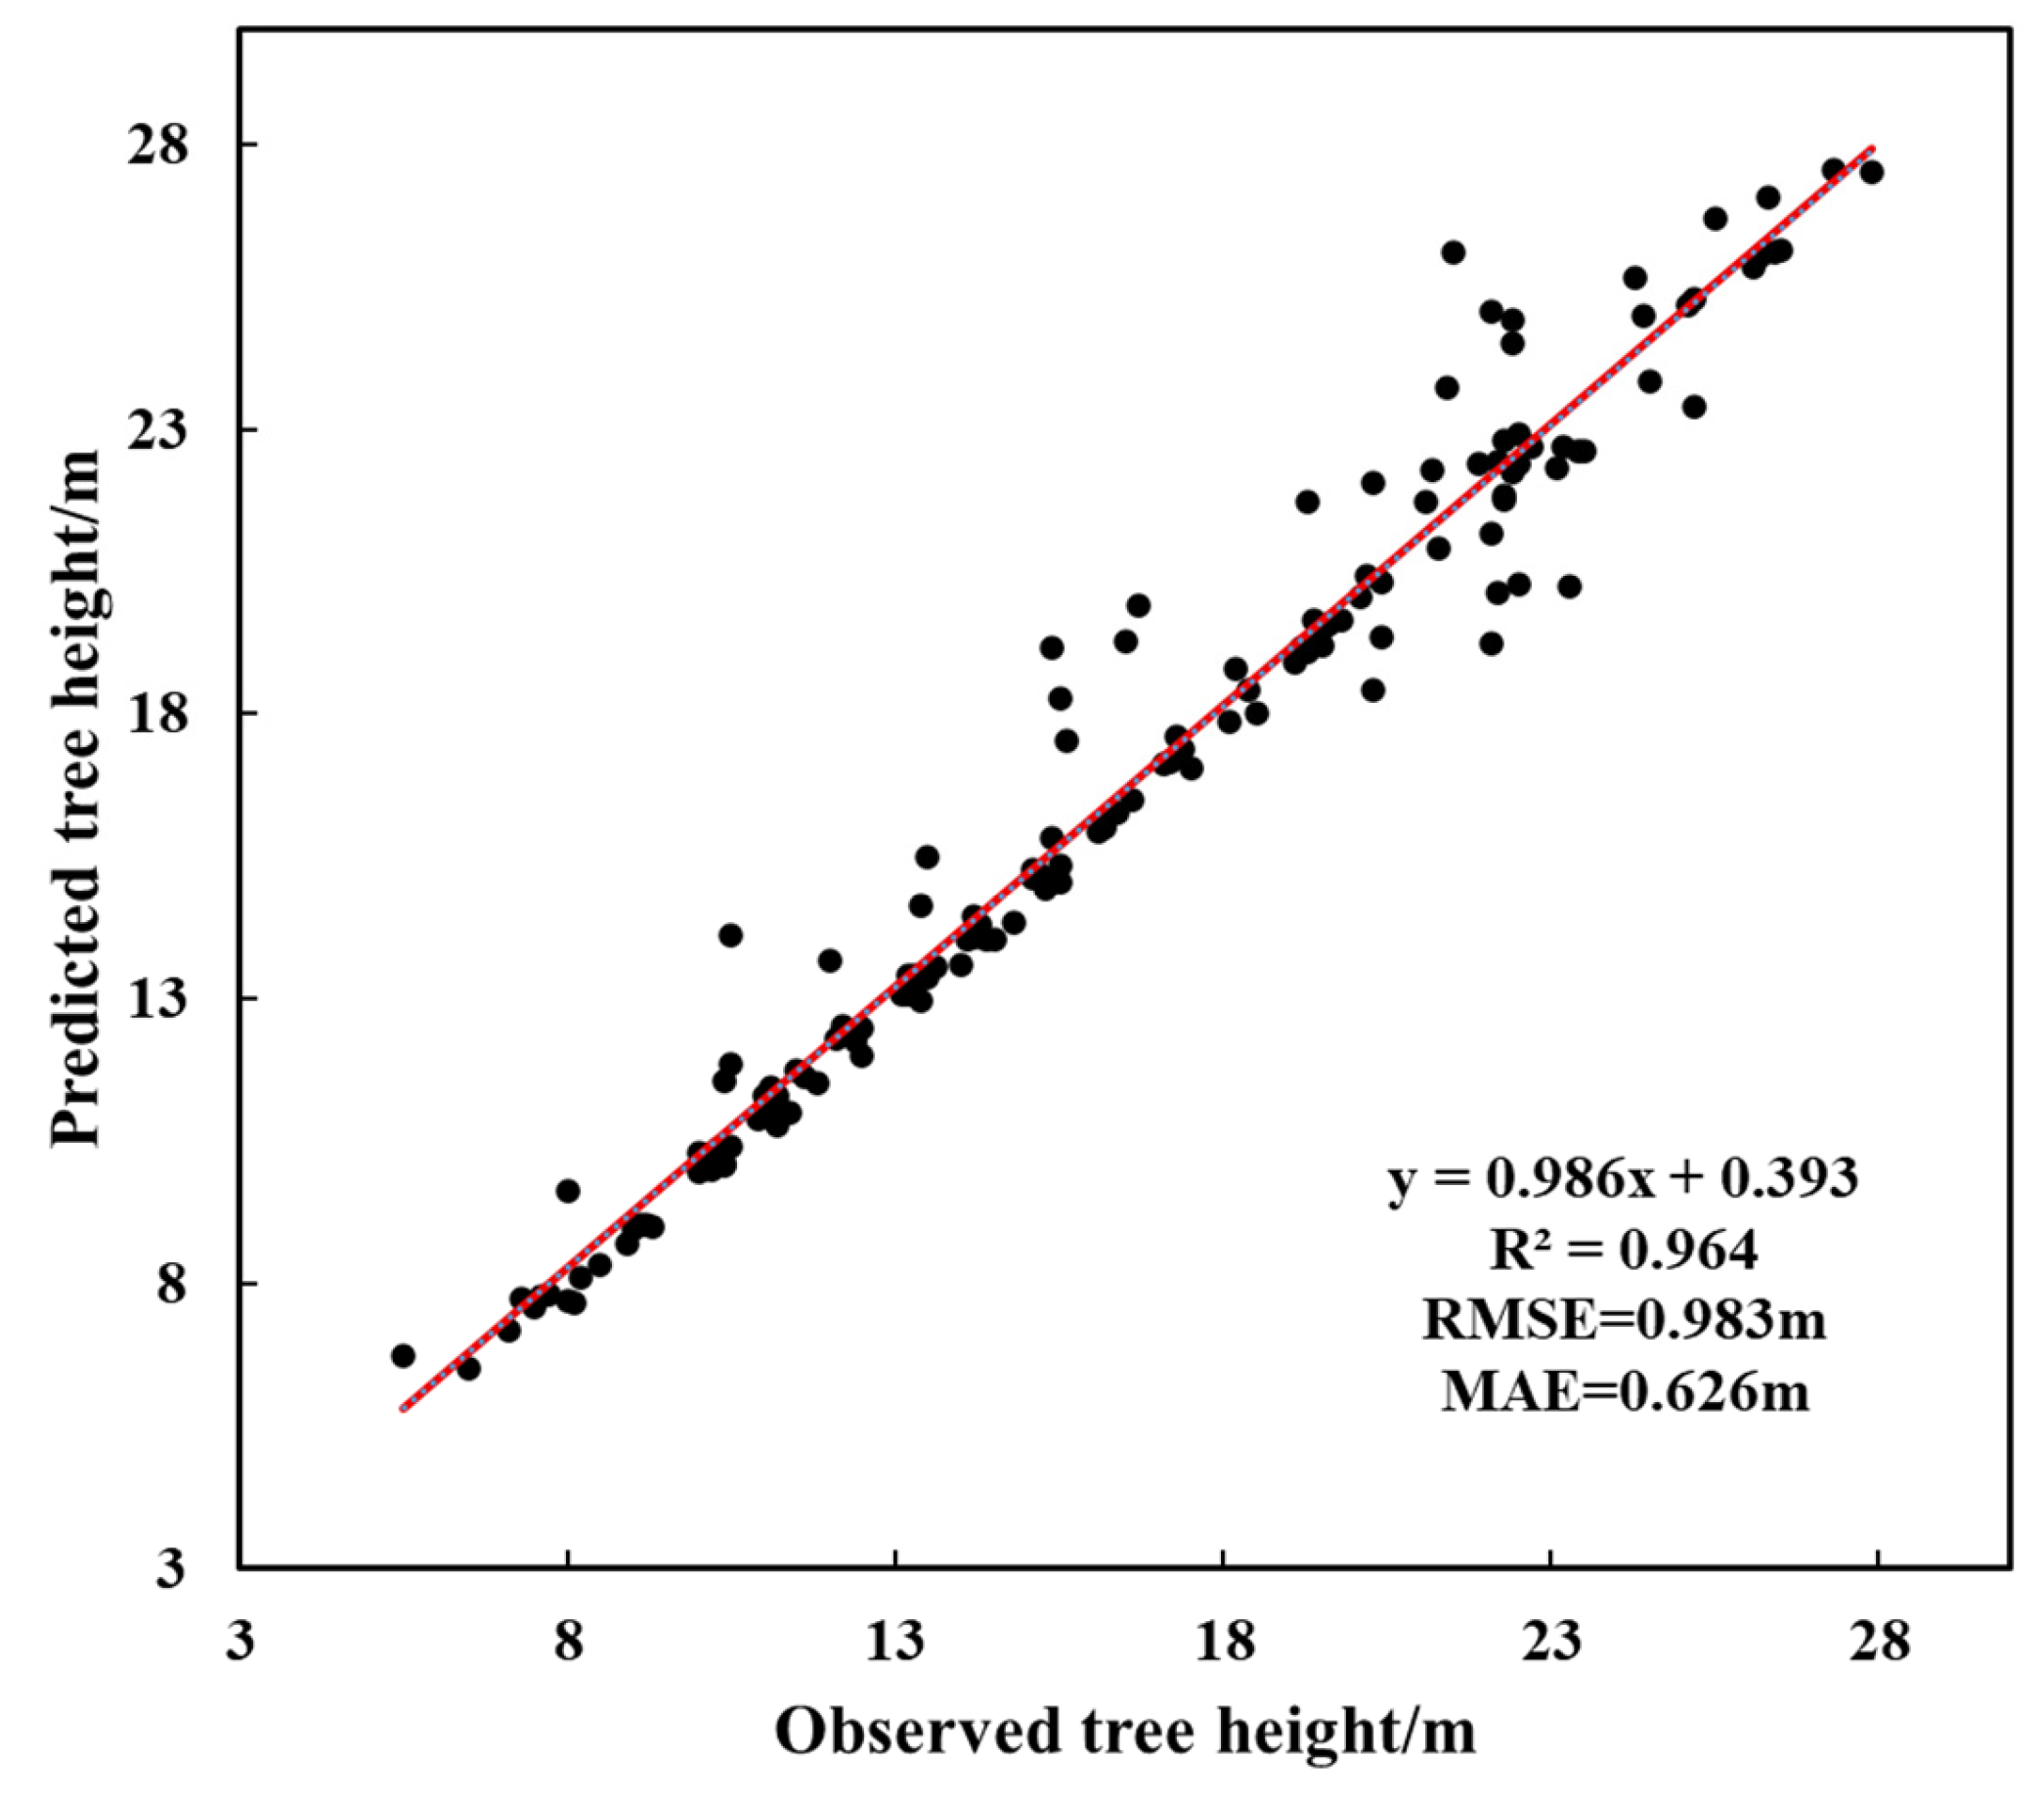
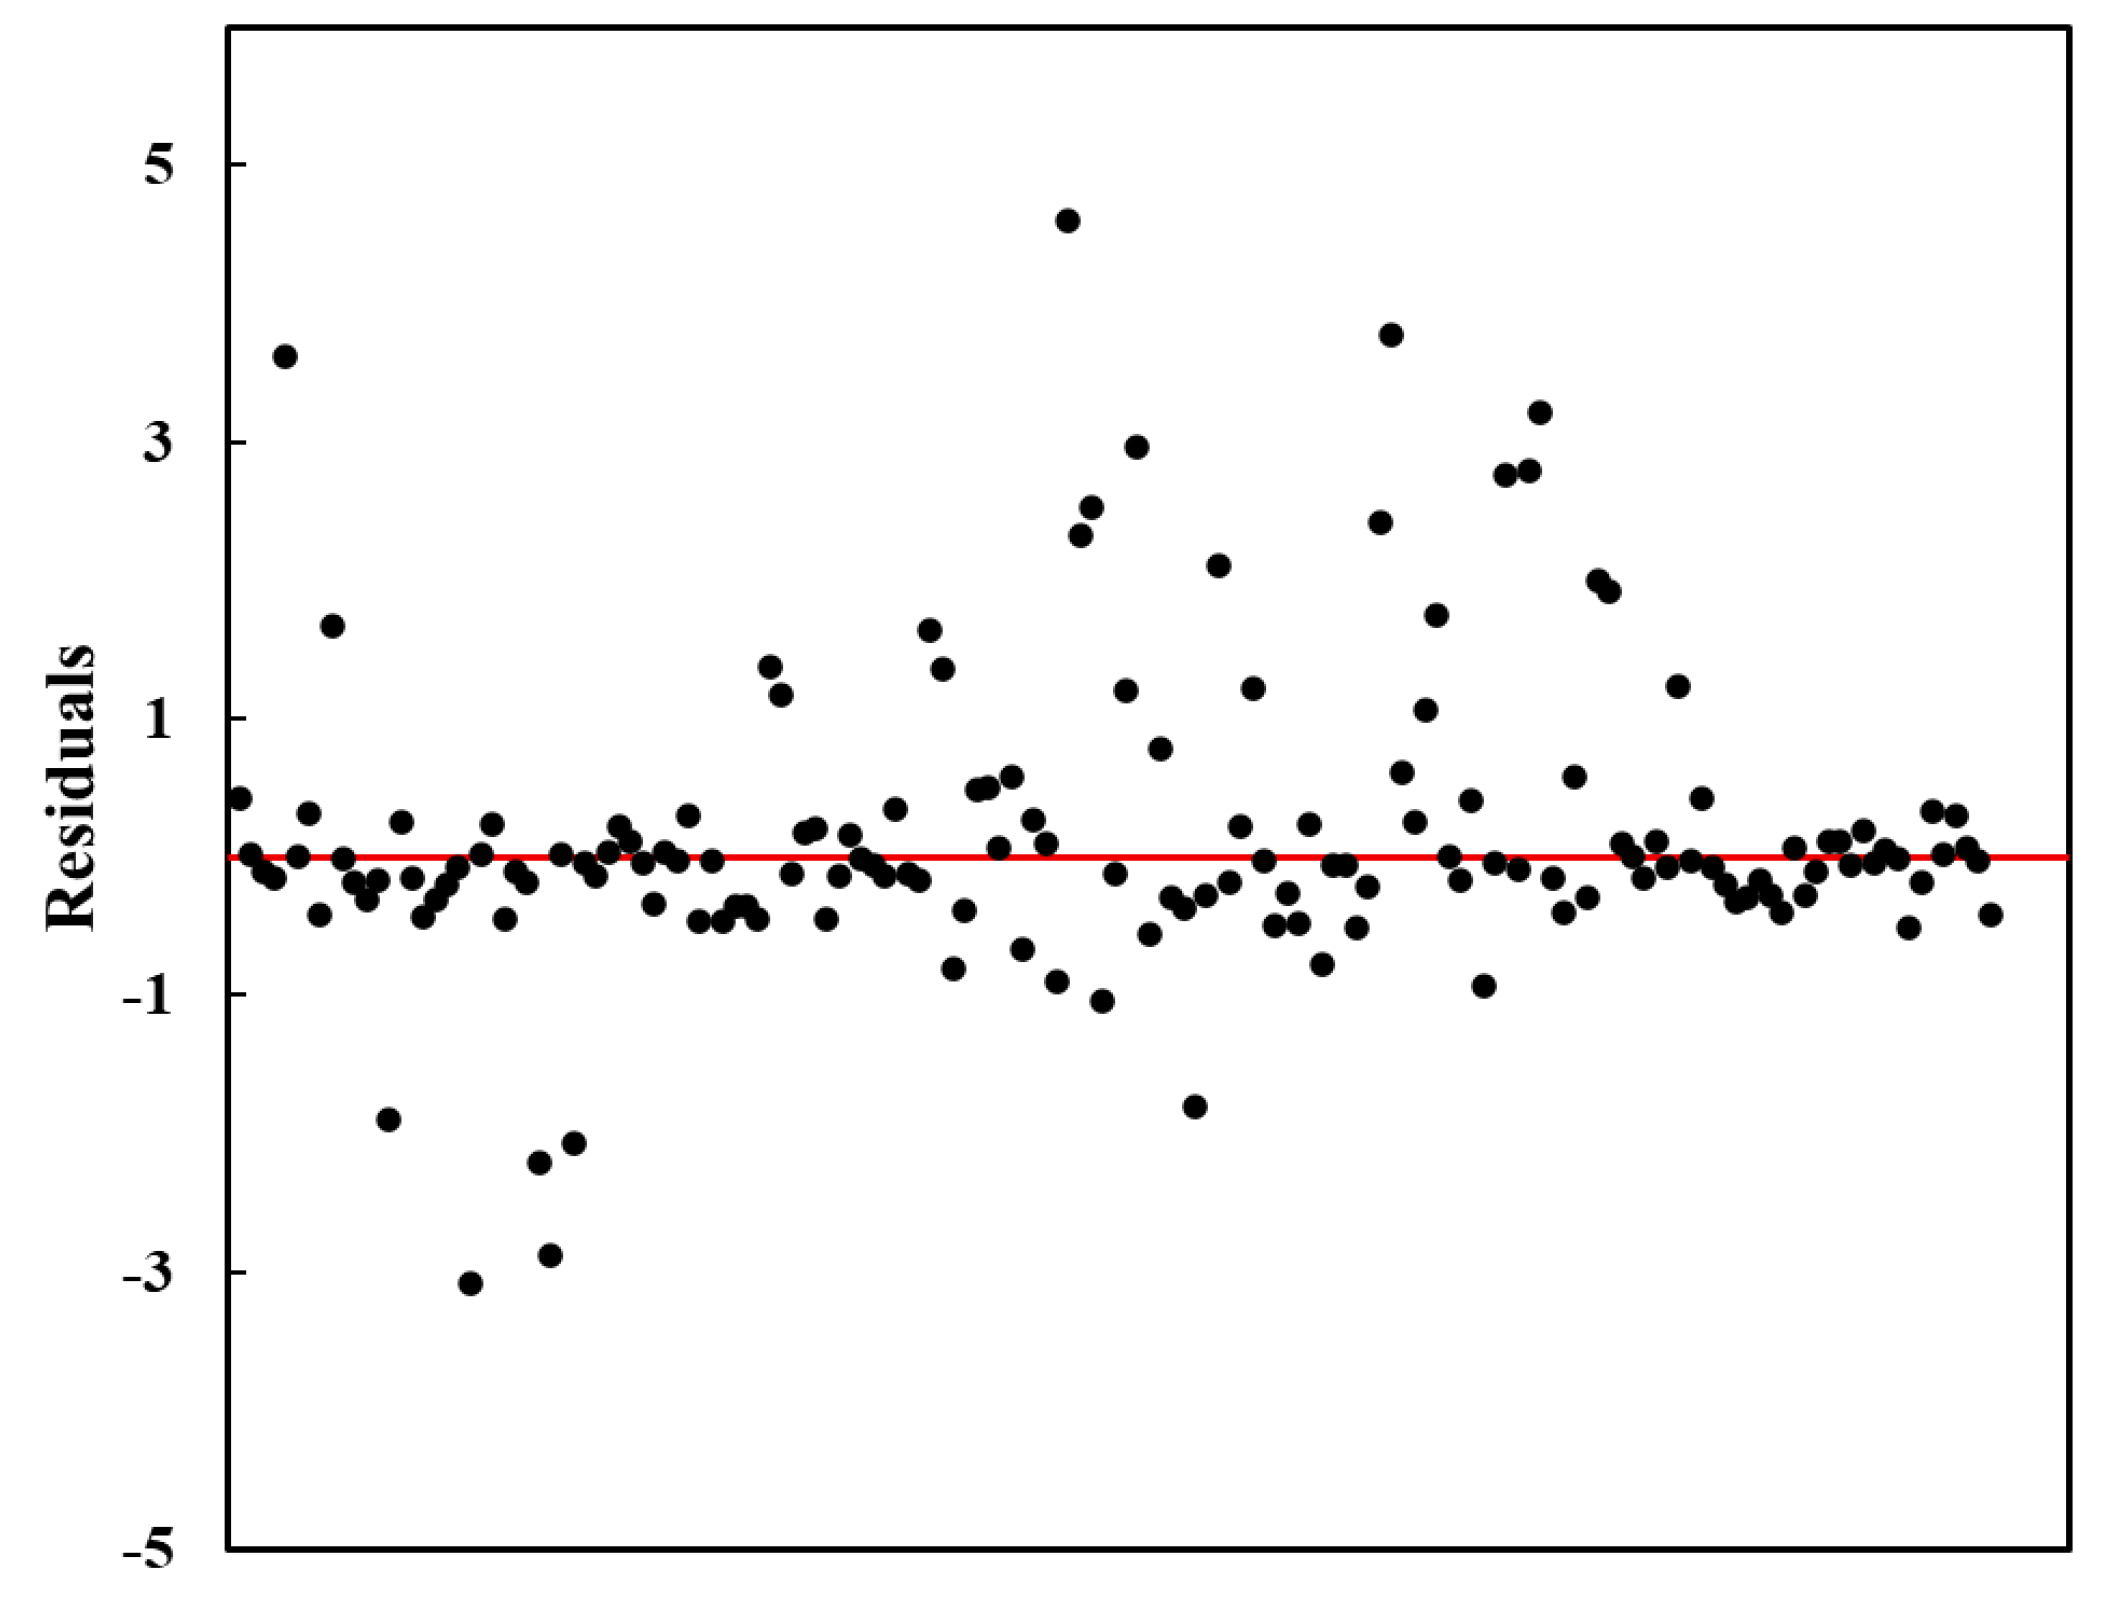
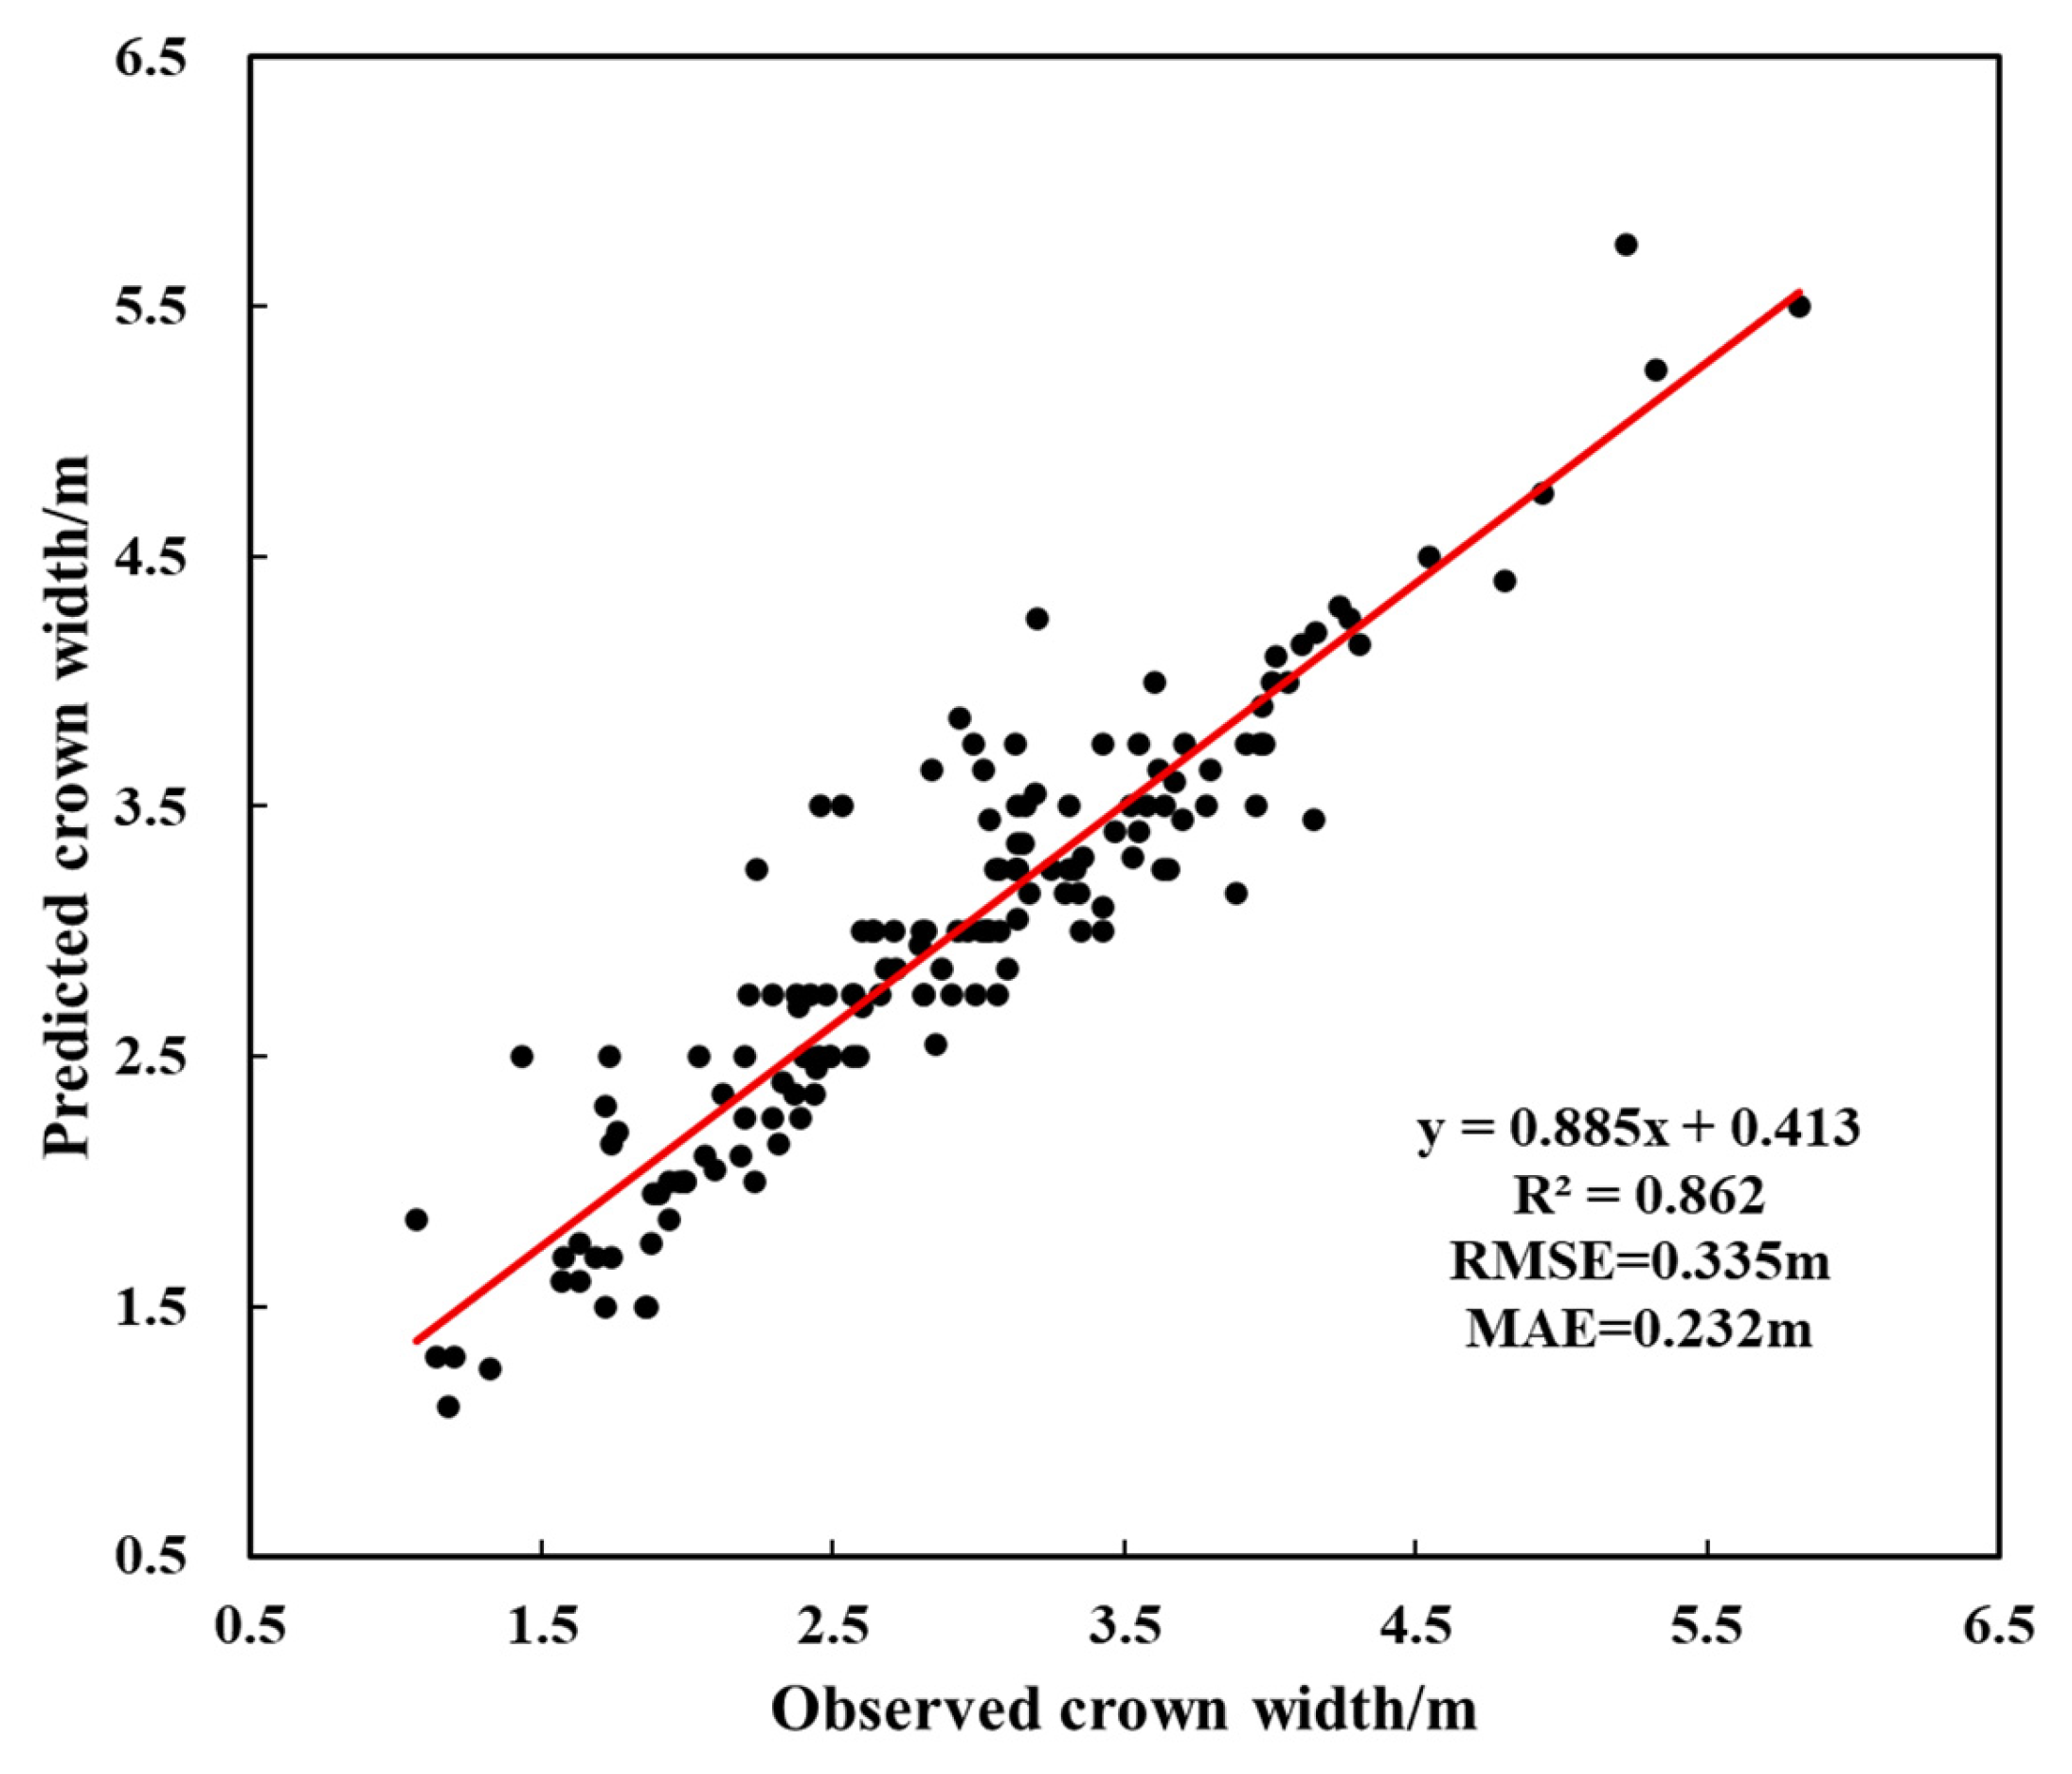
3.1. Accuracy Assessment of UAV Extraction of Single-Tree Parameters
3.2. Results of Single-Tree DBH Model Construction
3.3. Construction of Spatial Structure Evaluation System of Chinese Fir Plantation
3.3.1. Parameter Extraction Results for Spatial Structure of Stands
3.3.2. Evaluation Results of Forest Stand Spatial Structure
- (1)
- Combination weighting
- (2)
- Evaluation based on cloud models
4. Discussion
4.1. Extraction of Stand Spatial Structure Parameters
4.2. Construction of Stand Spatial Structure Evaluation System
5. Conclusions
Author Contributions
Funding
Data Availability Statement
Conflicts of Interest
Appendix A
| Sample Plot NO. | Spatial Structure Parameters | |||||||||||
|---|---|---|---|---|---|---|---|---|---|---|---|---|
| U | Mean | UCI | Mean | K | Mean | OP | Mean | W | Mean | S | Mean | |
| 1 | 0.494 ± 0.029 | 0.475 ± 0.179 B | 0.246 ± 0.019 | 0.253 ± 0.011 C | 0.313 ± 0.011 | 0.304 ± 0.004 A | 0.914 ± 0.014 | 0.901 ± 0.008 A | 0.758 ± 0.017 | 0.754 ± 0.009 A | 0.205 ± 0.015 | 0.245 ± 0.012 C |
| 2 | 0.480 ± 0.307 | 0.260 ± 0.018 | 0.304 ± 0.004 | 0.871 ± 0.015 | 0.761 ± 0.016 | 0.230 ± 0.013 | ||||||
| 3 | 0.455 ± 0.324 | 0.254 ± 0.194 | 0.296 ± 0.003 | 0.918 ± 0.013 | 0.744 ± 0.015 | 0.302 ± 0.027 | ||||||
| 4 | 0.550 ± 0.049 | 0.529 ± 0.027 A | 0.329 ± 0.027 | 0.329 ± 0.016 A | 0.269 ± 0.007 | 0.253 ± 0.004 B | 0.895 ± 0.017 | 0.864 ± 0.012 A | 0.721 ± 0.022 | 0.709 ± 0.012 A | 0.376 ± 0.044 | 0.282 ± 0.022 C |
| 5 | 0.514 ± 0.045 | 0.324 ± 0.024 | 0.236 ± 0.005 | 0.874 ± 0.016 | 0.716 ± 0.019 | 0.215 ± 0.028 | ||||||
| 6 | 0.527 ± 0.048 | 0.335 ± 0.031 | 0.259 ± 0.006 | 0.823 ± 0.028 | 0.688 ± 0.023 | 0.254 ± 0.038 | ||||||
| 7 | 0.524 ± 0.036 | 0.506 ± 0.021 A | 0.320 ± 0.024 | 0.312 ± 0.014 A | 0.272 ± 0.009 | 0.237 ± 0.005 B | 0.771 ± 0.022 | 0.775 ± 0.014 B | 0.664 ± 0.016 | 0.644 ± 0.013 B | 0.279 ± 0.018 | 0.351 ± 0.016 B |
| 8 | 0.503 ± 0.038 | 0.306 ± 0.025 | 0.249 ± 0.007 | 0.781 ± 0.026 | 0.631 ± 0.019 | 0.34 ± 0.003 | ||||||
| 9 | 0.488 ± 0.402 | 0.309 ± 0.027 | 0.184 ± 0.003 | 0.773 ± 0.029 | 0.633 ± 0.017 | 0.435 ± 0.004 | ||||||
| 10 | 0.512 ± 0.074 | 0.494 ± 0.029 B | 0.294 ± 0.051 | 0.285 ± 0.019 B | 0.202 ± 0.009 | 0.183 ± 0.004 C | 0.659 ± 0.053 | 0.742 ± 0.019 B | 0.502 ± 0.036 | 0.571 ± 0.015 B | 0.485 ± 0.045 | 0.472 ± 0.020 A |
| 11 | 0.475 ± 0.049 | 0.281 ± 0.033 | 0.182 ± 0.004 | 0.720 ± 0.033 | 0.596 ± 0.026 | 0.478 ± 0.027 | ||||||
| 12 | 0.503 ± 0.041 | 0.285 ± 0.026 | 0.176 ± 0.005 | 0.796 ± 0.021 | 0.579 ± 0.021 | 0.449 ± 0.035 | ||||||
| 13 | 0.464 ± 0.034 | 0.470 ± 0.023 B | 0.234 ± 0.019 | 0.246 ± 0.014 C | 0.173 ± 0.004 | 0.161 ± 0.003 C | 0.739 ± 0.013 | 0.695 ± 0.012 C | 0.477 ± 0.019 | 0.482 ± 0.013 C | 0.497 ± 0.021 | 0.509 ± 0.022 A |
| 14 | 0.481 ± 0.067 | 0.278 ± 0.046 | 0.196 ± 0.008 | 0.523 ± 0.039 | 0.484 ± 0.028 | 0.541 ± 0.051 | ||||||
| 15 | 0.466 ± 0.035 | 0.247 ± 0.021 | 0.135 ± 0.004 | 0.711 ± 0.018 | 0.487 ± 0.019 | 0.473 ± 0.023 | ||||||
| Indices | Formula | Value | ||||
|---|---|---|---|---|---|---|
| 0 | (0,0.25] | (0.25,0.5] | (0.5,0.75] | (0.75,1] | ||
| U | superior | sub-superior | moderation | disadvantage | absolute disadvantage | |
| UCI | no pressure | less pressure | medium pressure | greater pressure | great pressure | |
| OP | completely occluded | occluded | medium open | open | extremely open | |
| W | absolute uniform | uniform | random | aggregation | cluster distributions | |
| S | single | slightly simple | medium | slightly complex | complex | |
| K | Value | |||||
| (0,0.2] | (0.2,0.3] | (0.3,0.4] | (0.4,0.5] | (0.5,+∞) | ||
| serious insufficiency | insufficiency | basic sufficiency | sufficient | more than sufficient | ||
References
- Wang, Y.; Deng, X.; Zhang, X.; Xiao, F.; Zheng, R.; Yang, B.; Xiang, W. Variations of monthly radial growth of Chinese fir [Cunninghamia lanceolata (Lamb.) Hook.] considering its responses to climatic factors. Eur. J. For. Res. 2024, 143, 1525–1539. [Google Scholar] [CrossRef]
- Zhang, X.; Cao, Q.V.; Wang, H.; Duan, A.; Zhang, J. Projecting Stand Survival and Basal Area Based on a Self-Thinning Model for Chinese Fir Plantations. For. Sci. 2020, 66, 361–370. [Google Scholar] [CrossRef]
- Jactel, H.; Nicoll, B.C.; Branco, M.; Gonzalez-Olabarria, J.R.; Grodzki, W.; Långström, B.; Moreira, F.; Netherer, S.; Orazio, C.; Piou, D.; et al. The influences of forest stand management on biotic and abiotic risks of damage. Ann. For. Sci. 2009, 66, 701. [Google Scholar] [CrossRef]
- Bianchi, S.; Huuskonen, S.; Hynynen, J.; Niemistö, P. Comparing wood production and carbon sequestration after extreme thinnings in boreal Scots pine stands. For. Ecol. Manag. 2024, 553, 121641. [Google Scholar] [CrossRef]
- Kang, H.; Seely, B.; Wang, G.; Innes, J.; Zheng, D.; Chen, P.; Wang, T.; Li, Q. Evaluating management tradeoffs between economic fiber production and other ecosystem services in a Chinese-fir dominated forest plantation in Fujian Province. Sci. Total Environ. 2016, 557–558, 80–90. [Google Scholar] [CrossRef]
- Graz, F.P. The behaviour of the measure of surround in relation to the diameter and spatial structure of a forest stand. Eur. J. For. Res. 2008, 127, 165–171. [Google Scholar] [CrossRef]
- Hong, L.; Duan, G.; Fu, S.; Fu, L.; Ma, L.; Li, X.; Fu, J. Response of Stand Spatial Structure to Nitrogen Addition in Deciduous Broad-Leaved Forest in Jigong Mountain. Sustainability 2024, 16, 5137. [Google Scholar] [CrossRef]
- Ali, A.; Poudel, T.R.; Ismail, M.J.; Saha, S.; Dong, L. Associations between stand spatial structures and carbon sequestration on natural Larix gmelinii forests in Northeast China. Trees For. People 2025, 20, 100837. [Google Scholar] [CrossRef]
- Li, T.; Wu, Y.; Ren, F.; Tian, L.; Li, M. Assessing the impact of stand structure on forest net primary productivity: A multiple machine learning-SHAP models and DSEM integrated approach. Comput. Electron. Agric. 2025, 236, 110427. [Google Scholar] [CrossRef]
- Yang, B.; Ma, R.; Zhai, J.; Du, J.; Bai, J.; Zhang, W. Stand spatial structure is more important than species diversity in enhancing the carbon sink of fragile natural secondary forest. Ecol. Indic. 2024, 158, 111449. [Google Scholar] [CrossRef]
- Chen, Y.; Shao, X.; Wang, S.; Jiang, Y.; Zang, L.; Zhang, G.; Liu, Q.; Chen, D.; Ding, F.; Sui, M. How does the water use efficiency of keystone species act on the stand spatial structure and species diversity in a water-scarce karst forest? Ecol. Indic. 2025, 174, 113444. [Google Scholar] [CrossRef]
- Wen, G.; Ma, J.; Xu, W.; Wang, J.; He, W.; Wang, Y.; Wang, X.; Li, T.; Ye, M.; Chen, G.; et al. Response of understory plant functional groups to changes in stand spatial structure in Masson pine (Pinus massoniana Lamb.) plantations depends on thinning mode and intensity. J. Environ. Manag. 2025, 376, 124441. [Google Scholar] [CrossRef]
- Ye, S.; Zheng, Z.; Diao, Z.; Ding, G.; Bao, Y.; Liu, Y.; Gao, G. Effects of Thinning on the Spatial Structure of Larix principis-rupprechtii Plantation. Sustainability 2018, 10, 1250. [Google Scholar] [CrossRef]
- Liu, Y.; Wang, X.; He, L.; Liu, Z.; Zeng, X.; Sha, H.; He, B.; Jing, Y.; Li, J.; Chen, J.; et al. Effects of spatial structure on understory vegetation and soil properties in Pinus tabuliformis plantation of different succession types in Beijing. Acta Ecol. Sin. 2023, 43, 1959–1970. [Google Scholar] [CrossRef]
- Mao, Y.; Zhang, H.; Wang, R.; Yan, T.; Wei, W.; You, W. Spatial structure characteristics of the main tree species in a mixed broadleaved Korean pine (Pinus koraiensis) forest in a mountainous area of eastern Liaoning Province, China. Chin. J. Appl. Ecol. 2019, 30, 2933–2940. [Google Scholar]
- Szwagrzyk, J.; Szewczyk, J.; Maciejewski, Z. Shade-tolerant tree species from temperate forests differ in their competitive abilities: A case study from Roztocze, south-eastern Poland. For. Ecol. Manag. 2012, 282, 28–35. [Google Scholar] [CrossRef]
- Bāders, E.; Jõgiste, K.; Elferts, D.; Vodde, F.; Kiviste, A.; Luguza, S.; Jansons, Ā. Storm legacies shaping post-windthrow forest regeneration: Learnings from spatial indices in unmanaged Norway spruce stands. Eur. J. For. Res. 2021, 140, 819–833. [Google Scholar] [CrossRef]
- Bu, Y.; Li, W.; von Gadow, K.; Wei, J.; Zhao, P.; Yang, Y.; Zhou, C.; Wang, B.; Zhao, X. Toward a better understanding of forest spatial patterns: A generalisation of the uniform angle index. Ecol. Model. 2025, 503, 111070. [Google Scholar] [CrossRef]
- Zhang, X.; Zhou, C.; Zhang, Z.; Feng, L.; Wang, L.; Fu, L.; Tan, B. Structural Characteristics and Cutting Optimization Model of Larix principis-rupprechtii Plantation in Chongli Winter Olympics Core Area. Sci. Silvae Sin. 2022, 58, 79–88. [Google Scholar]
- Zhao, W.; Cao, X.; Xie, Z.; Pang, Y.; Sun, Y.; Li, J.; Mo, Y.; Yuan, D. Evaluation of Stand Spatial Structure of Cunninghamia lanceolata Public Welfare Forest by Using Structural Equation Model. Sci. Silvae Sin. 2022, 58, 76–88. [Google Scholar]
- Wang, Y.; Li, J.; Cao, X.; Liu, Z.; Lv, Y. The Multivariate Distribution of Stand Spatial Structure and Tree Size Indices Using Neighborhood-Based Variables in Coniferous and Broad Mixed Forest. Forests 2023, 14, 2228. [Google Scholar] [CrossRef]
- Li, Y.; He, J.A.; Yu, S.; Wang, H.; Ye, S. Spatial structures of different-sized tree species in a secondary forest in the early succession stage. Eur. J. For. Res. 2020, 139, 709–719. [Google Scholar] [CrossRef]
- Xia, Y.; Shao, D.; Wu, D. Temporal-spatial characteristics of park green space spatial structure and competitive relationship: A multidimensional perspective based on stand spatial structure. J. Environ. Manag. 2025, 380, 125002. [Google Scholar] [CrossRef]
- Dong, L.; Bettinger, P.; Liu, Z. Stand spatial structural diversity: Developing and validating a novel index. For. Ecol. Manag. 2024, 569, 122157. [Google Scholar] [CrossRef]
- Hartley, R.J.L.; Leonardo, E.M.; Massam, P.; Watt, M.S.; Estarija, H.J.; Wright, L.; Melia, N.; Pearse, G.D. An Assessment of High-Density UAV Point Clouds for the Measurement of Young Forestry Trials. Remote Sens. 2020, 12, 4039. [Google Scholar] [CrossRef]
- Oddi, L.; Cremonese, E.; Ascari, L.; Filippa, G.; Galvagno, M.; Serafino, D.; Cella, U.M.D. Using UAV Imagery to Detect and Map Woody Species Encroachment in a Subalpine Grassland: Advantages and Limits. Remote Sens. 2021, 13, 1239. [Google Scholar] [CrossRef]
- Ota, T.; Ogawa, M.; Mizoue, N.; Fukumoto, K.; Yoshida, S. Forest Structure Estimation from a UAV-Based Photogrammetric Point Cloud in Managed Temperate Coniferous Forests. Forests 2017, 8, 343. [Google Scholar] [CrossRef]
- Neuville, R.; Bates, J.S.; Jonard, F. Estimating Forest Structure from UAV-Mounted LiDAR Point Cloud Using Machine Learning. Remote Sens. 2021, 13, 352. [Google Scholar] [CrossRef]
- Castilla, G.; Filiatrault, M.; McDermid, G.J.; Gartrell, M. Estimating Individual Conifer Seedling Height Using Drone-Based Image Point Clouds. Forests 2020, 11, 924. [Google Scholar] [CrossRef]
- Hu, X.; Li, D. Research on a Single-Tree Point Cloud Segmentation Method Based on UAV Tilt Photography and Deep Learning Algorithm. IEEE J. Sel. Top. Appl. Earth Obs. Remote Sens. 2020, 13, 4111–4120. [Google Scholar] [CrossRef]
- Yu, S.; Chen, X.; Huang, X.; Chen, Y.; Hu, Z.; Liu, J.; Yu, K. Research on the Estimation of Chinese Fir Stand Volume Based on UAV-LiDAR Technology. Forests 2023, 14, 1252. [Google Scholar] [CrossRef]
- Hu, Z.; Shan, L.; Chen, X.; Yu, K.; Liu, J. Individual Tree Segmentation of UAV-LiDAR Based on the Combination of CHM and DSM. Sci. Silvae Sin. 2024, 60, 14–24. [Google Scholar]
- You, H.; Liu, Y.; Lei, P.; Qin, Z.; You, Q. Segmentation of individual mangrove trees using UAV-based LiDAR data. Ecol. Inform. 2023, 77, 102200. [Google Scholar] [CrossRef]
- Chen, X.; Yu, K.; Yu, S.; Hu, Z.; Tan, H.; Chen, Y.; Huang, X.; Liu, J. Study on Single-Tree Segmentation of Chinese Fir Plantations Using Coupled Local Maximum and Height-Weighted Improved K-Means Algorithm. Forests 2023, 14, 2130. [Google Scholar] [CrossRef]
- He, X.; Wang, R.; Feng, C.; Zhou, X. A Novel Type of Boundary Extraction Method and Its Statistical Improvement for Unorganized Point Clouds Based on Concurrent Delaunay Triangular Meshes. Sensors 2023, 23, 1915. [Google Scholar] [CrossRef] [PubMed]
- Zhang, C.; Li, J.; Cao, X.; Zhao, C.; Li, J. Analysis on spatial structure of Cunninghamia lanceolata non-commerciaforest based on weighted Voronoi diagram. J. Cent. South Univ. For. Technol. 2015, 35, 19–26. [Google Scholar]
- Cao, X.; Li, J.; Hu, Y.; Yang, J. Spatial structure optimizing model of stand thinning of Cunninghamia lanceolata ecological forest. Chin. J. Ecol. 2017, 36, 1134–1141. [Google Scholar]
- Cao, X.; Li, J.; Wei, X. Effects of Spatial Structure on Soil Nutrient Content in Typical Forests in the Contral-Subtropics of China. Sci. Silvae Sin. 2020, 56, 20–28. [Google Scholar]
- Zhou, C.; Zhang, H.; Xu, Q.; Lei, X. Analysis of inter-layer structure based on the relationship of neighboring trees. J. Beijing For. Univ. 2019, 41, 66–75. [Google Scholar]
- Wang, Y.; Wang, D.; Wang, Y.; Yun, H.; Zhang, M.; Zhang, Y. Effects of density and spatial structure of middle-aged Robinia preudoacacia plantations on the diversity of shrub and grass in the Loess Plateau. Acta Ecol. Sin. 2025, 45, 822–836. [Google Scholar]
- Li, J.; Liu, S.; Zhang, H.; Kuang, Z.; Wang, C.; Zhang, J.; Cao, X. Heterogeneity evaluation of forest ecological system spatial structure in Dongting Lake. Acta Ecol. Sin. 2013, 33, 3732–3741. [Google Scholar] [CrossRef][Green Version]
- Huang, S.; Wang, H.; Peng, H.; Wang, Y.; Li, Y.; Ye, S. Analysis of Second-Order Characteristics of Tree Species Dominance in an Old GrowthForest Community in Yachang Nature Reserve. Sci. Silvae Sin. 2022, 58, 128–140. [Google Scholar][Green Version]
- Chen, K.; Zhang, H.; Lei, X.; Lou, M.; Wang, Q.; Mao, J. Effect of Thinning on Spatial Structure of Spruce-fir Mixed Broadleaf-conifer Forest Base on Crop Tree Management. For. Res. 2017, 30, 718–726. [Google Scholar][Green Version]
- Na, W.; Zhao, Z.C. The comprehensive evaluation method of low-carbon campus based on analytic hierarchy process and weights of entropy. Environ. Dev. Sustain. 2021, 23, 9308–9319. [Google Scholar] [CrossRef]
- Liang, H.; Wu, M.; Jia, X.; Yang, Q. Comprehensive Evaluation of Soil Improvement Benefits of Biological Retention Facilities Based on AHP-CRITIC. Buildings 2024, 14, 780. [Google Scholar] [CrossRef]
- Zhu, S.; Guo, L.; Cui, Y.; Xiao, R.; Yu, Z.; Jin, Y.; Fu, R.; Zhang, J.; Xu, T.; Chen, J.; et al. Quality suitability modeling of volatile oil in Chinese Materia Medica—Based on maximum entropy and independent weight coefficient method: Case studies of Atractylodes lancea, Angelica sinensis, Curcuma longa and Atractylodes macrocephala. Ind. Crop. Prod. 2019, 142, 111807. [Google Scholar] [CrossRef]
- Wang, M.W.; Wang, Y.; Shen, F.Q.; Jin, J.L. Projection Pursuit Method Based on Connection Cloud Model for Assessment of Debris Flow Disasters. J. Environ. Inform. 2022, 41, 118–129. [Google Scholar] [CrossRef]
- Peng, J.; Zhang, J. Urban flooding risk assessment based on GIS- game theory combination weight: A case study of Zhengzhou City. Int. J. Disaster Risk Reduct. 2022, 77, 103080. [Google Scholar] [CrossRef]
- Lyu, C.; Zhang, H.X.; Liu, S.; Guo, Y. Fishing capacity evaluation of fishing vessel based on cloud model. Sci. Rep. 2022, 12, 8976. [Google Scholar] [CrossRef]
- Li, L.; Wei, L.; Li, N.; Zhang, S.; Wu, Z.; Dong, M.; Chen, Y. Extracting the DBH of Moso Bamboo Forests Using LiDAR: Parameter Optimization and Accuracy Evaluation. Forests 2024, 15, 804. [Google Scholar] [CrossRef]
- Ye, N.; Mason, E.; Xu, C.; Morgenroth, J. Estimating individual tree DBH and biomass of durable Eucalyptus using UAV LiDAR. Ecol. Inform. 2025, 89, 103169. [Google Scholar] [CrossRef]
- Konôpka, B.; Pajtík, J.; Marušák, R.; Bošeľa, M.; Lukac, M. Specific leaf area and leaf area index in developing stands of Fagus sylvatica L. and Picea abies Karst. For. Ecol. Manag. 2016, 364, 52–59. [Google Scholar] [CrossRef]
- Owen, H.J.F.; Flynn, W.R.M.; Lines, E.R. Competitive drivers of interspecific deviations of crown morphology from theoretical predictions measured with Terrestrial Laser Scanning. J. Ecol. 2021, 109, 2612–2628. [Google Scholar] [CrossRef]
- Li, Z.; Gao, C.; Che, F.; Li, J.; Wang, L.; Cui, K. Trunk distortion weakens the tree productivity revealed by half-sib progeny determination of Pinus yunnanensis. BMC Plant Biol. 2024, 24, 629. [Google Scholar] [CrossRef] [PubMed]
- Zhang, S.; Fu, B.; Gao, E.; Jia, M.; Sun, W.; Wu, Y.; Zhou, G. Combining UAV-LiDAR point clouds and SSAFormer algorithms for classification of mangrove communities. Natl. Remote Sens. Bull. 2025, 29, 1140–1163. [Google Scholar] [CrossRef]
- Yan, Y.; Lei, J.; Jin, J.; Shi, S.; Huang, Y. Unmanned Aerial Vehicle–Light Detection and Ranging-Based Individual Tree Segmentation in Eucalyptus spp. Forests: Performance and Sensitivity. Forests 2024, 15, 209. [Google Scholar] [CrossRef]
- McAlhaney, A.L.; Keim, R.F.; Allen, S.T. Species-specific growth capacity for floodplain forest trees inferred from sapwood efficiency and individual tree competition. For. Ecol. Manag. 2020, 476, 118427. [Google Scholar] [CrossRef]
- Tetemke, B.A.; Birhane, E.; Rannestad, M.M.; Eid, T. Competition and slope effect on wood basic density and its variation among tree species and within individual trees in a dry Afromontane Forest. For. Sci. Technol. 2024, 20, 349–360. [Google Scholar] [CrossRef]
- He, L.; Zhu, T.; Wu, Y.; Li, W.; Zhang, H.; Zhang, X.; Cao, T.; Ni, L.; Hilt, S. Littoral Slope, Water Depth and Alternative Response Strategies to Light Attenuation Shape the Distribution of Submerged Macrophytes in a Mesotrophic Lake. Front. Plant Sci. 2019, 10, 169. [Google Scholar] [CrossRef]
- Kumar, R.; Singh, S.; Bilga, P.S.; Jatin; Singh, J.; Singh, S.; Scutaru, M.; Pruncu, C.I. Revealing the benefits of entropy weights method for multi-objective optimization in machining operations: A critical review. J. Mater. Res. Technol. 2021, 10, 1471–1492. [Google Scholar] [CrossRef]
- Jiang, X.; Chen, X.; Jiao, Y.; Zhang, L. Objective Evaluation of Motion Cueing Algorithms for Vehicle Driving Simulator Based on Criteria Importance through Intercriteria Correlation (CRITIC) Weight Method Combined with Gray Correlation Analysis. Machines 2024, 12, 344. [Google Scholar] [CrossRef]
- Wu, H.; Zang, L.; Xiao, B.; Liu, Y.; Wang, X.; Guo, X. Evaluation of Driving Behavior Economy Based on Big Data of New Energy Bus. China J. Highw. Transp. 2022, 25, 177–190. [Google Scholar]
- Xu, F.; Wang, K.; Liu, Z. Attribute interval recognition model based on projection pursuit weight for evaluation of stability of surrounding rock. Rock Soil Mech. 2010, 31, 2587–2591, 2598. [Google Scholar]
- Li, Y.; Hu, Z. A tri-system urban waterlogging risk assessment framework based on GIS- game theory combination weight: A case of Zhengzhou City. Nat. Hazards 2024, 120, 14649–14681. [Google Scholar] [CrossRef]
- Yang, Z.; Huang, X.; Fang, G.; Ye, J.; Lu, C. Benefit evaluation of East Route Project of South to North Water Transfer based on trapezoid cloud model. Agric. Water Manag. 2021, 254, 106960. [Google Scholar] [CrossRef]
- Yang, J.; Wan, Q.; Han, J.; Xing, S. An evaluation model for automobile intelligent cockpit comfort based on improved combination weighting-cloud model. PLoS ONE 2023, 18, e0282602. [Google Scholar] [CrossRef] [PubMed]
- Ma, Z.; Zhang, S. Risk-Based Multi-Attribute Decision-Making for Normal Cloud Model Considering Pre-Evaluation Information. IEEE Access 2020, 8, 153891–153904. [Google Scholar] [CrossRef]
- Zhang, W.; Tian, Y.; Yang, Y.; Zhang, P.; Gu, J.; Yang, L.; Jiang, Y.; Zhang, K.; Wang, L. Multiple distribution of spatial structure parameters and tree competition of Larix gmelinii forest stand. J. Cent. South Univ. For. Technol. 2025, 45, 74–81. [Google Scholar]
- Guo, W.; Zhang, Q.; Wang, C.; Wang, Y. Effect of forest management on the secondary forest vegetation carbon density and its distribution in Northeast of China. Acta Ecol. Sin. 2024, 44, 8651–8660. [Google Scholar]
- Wu, S.; Cao, X.; Yan, W.; Yuan, D.; Zhang, Z.; Wang, M.; Huang, X.; Xiang, Y. Spatial structure and soil nutrient characteristics of Cunninghamia lanceolata forest of different age groups and their correlations. J. Cent. South Univ. For. Technol. 2025, 45, 115–122. [Google Scholar]
- Yao, L.; Wang, Z.; Wu, C.; Yuan, W.; Zhu, J.; Jiao, J.; Jiang, B. Competition and Facilitation Co-Regulate Spatial Patterns and Coexistence in a Coniferous and Broad-Leaved Mixed Forest Community in Zhejiang, China. Forests 2022, 13, 1356. [Google Scholar] [CrossRef]
- Cao, Y.; Ye, S.; Zhang, C.; Zhou, W.; Ning, C. Spatial Structure of Forest Stand and Intra-specific Competition in the Cunninghamia lanceolata Plantation in Da-tong Mountain. J. Northeast. For. Univ. 2024, 52, 8–12, 18. [Google Scholar]
- Zhu, J.; Li, X.; Liu, Y.; Chai, Z. Evaluation of Spatial Structure and Dynamic Analysis of Pinus massoniana Plantation. J. West China For. Sci. 2025, 54, 9–17. [Google Scholar]
- Reynolds, J.H.; Ford, E.D. Improving competition representation in theoretical models of self-thinning: A critical review. J. Ecol. 2005, 93, 362–372. [Google Scholar] [CrossRef]
- Zhang, M.; Luo, Y.; Wang, S.; Zhang, L.; Ma, C.; Yu, S.; Wang, J. Spatial Structure Analysis and Optimization of Larix principis-rupprechtii Plantation in Wangyedian, Inner Mongolia. J. Northwest For. Univ. 2024, 39, 81–87, 107. [Google Scholar]
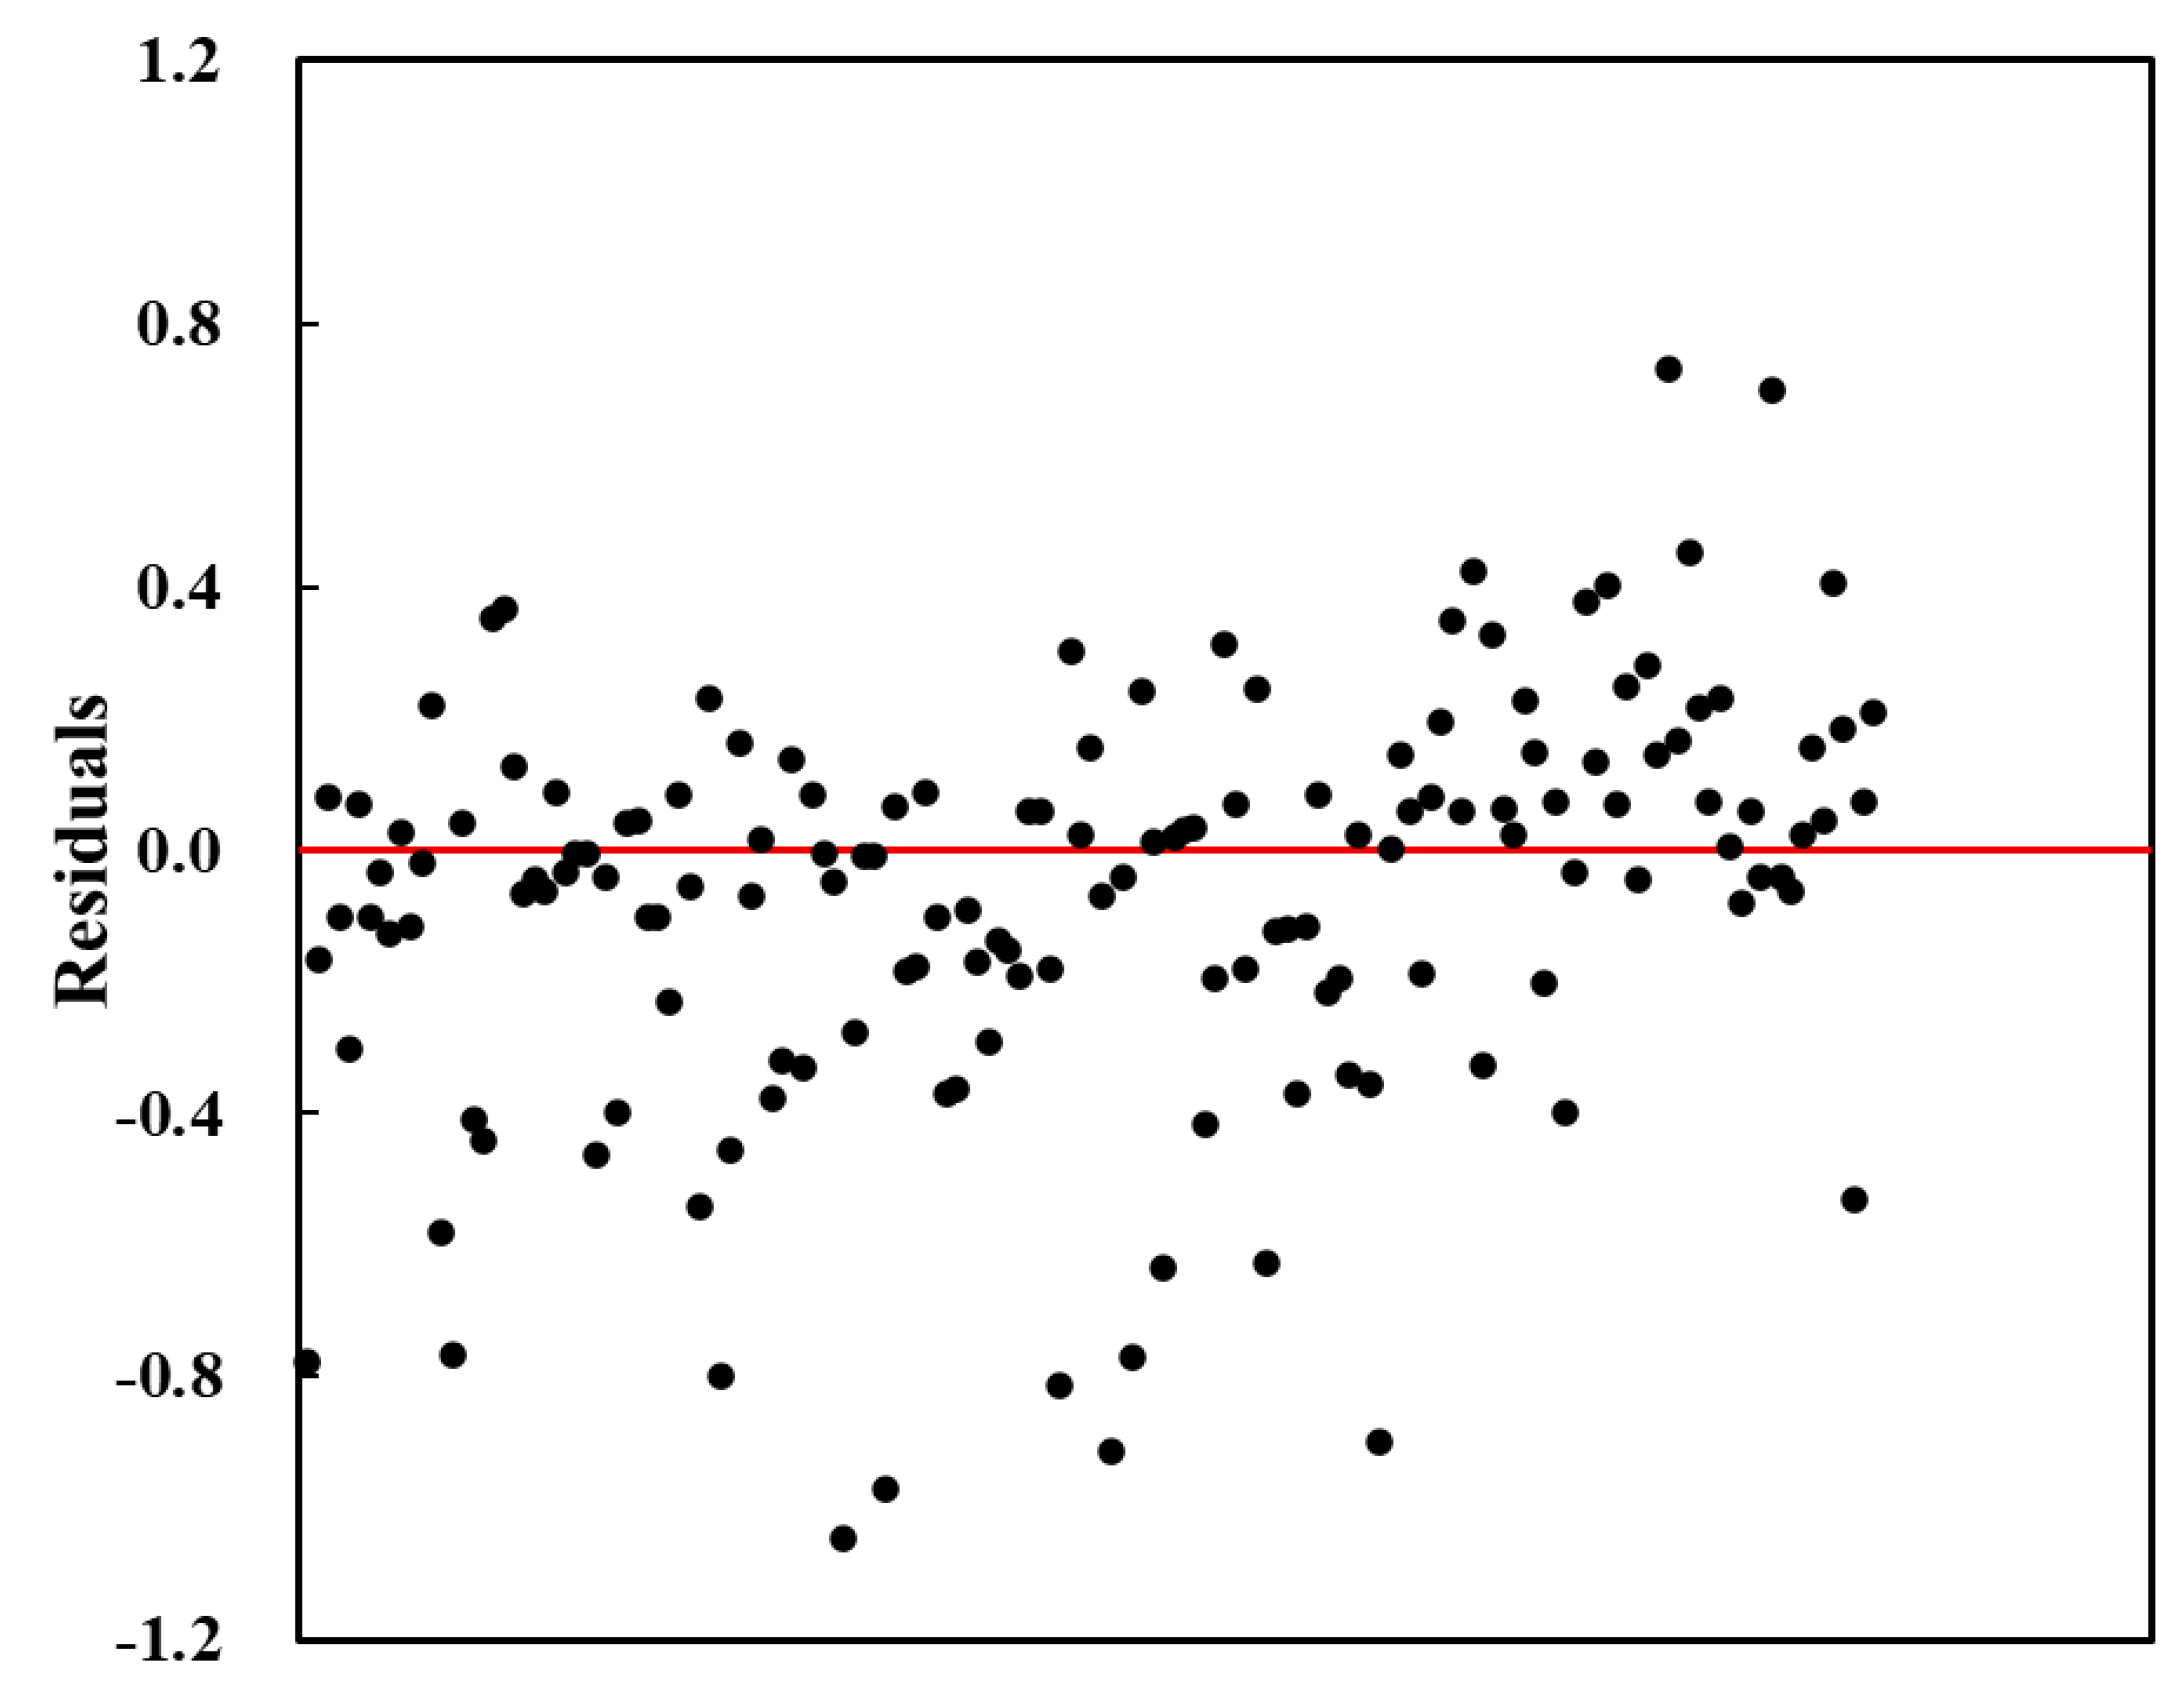
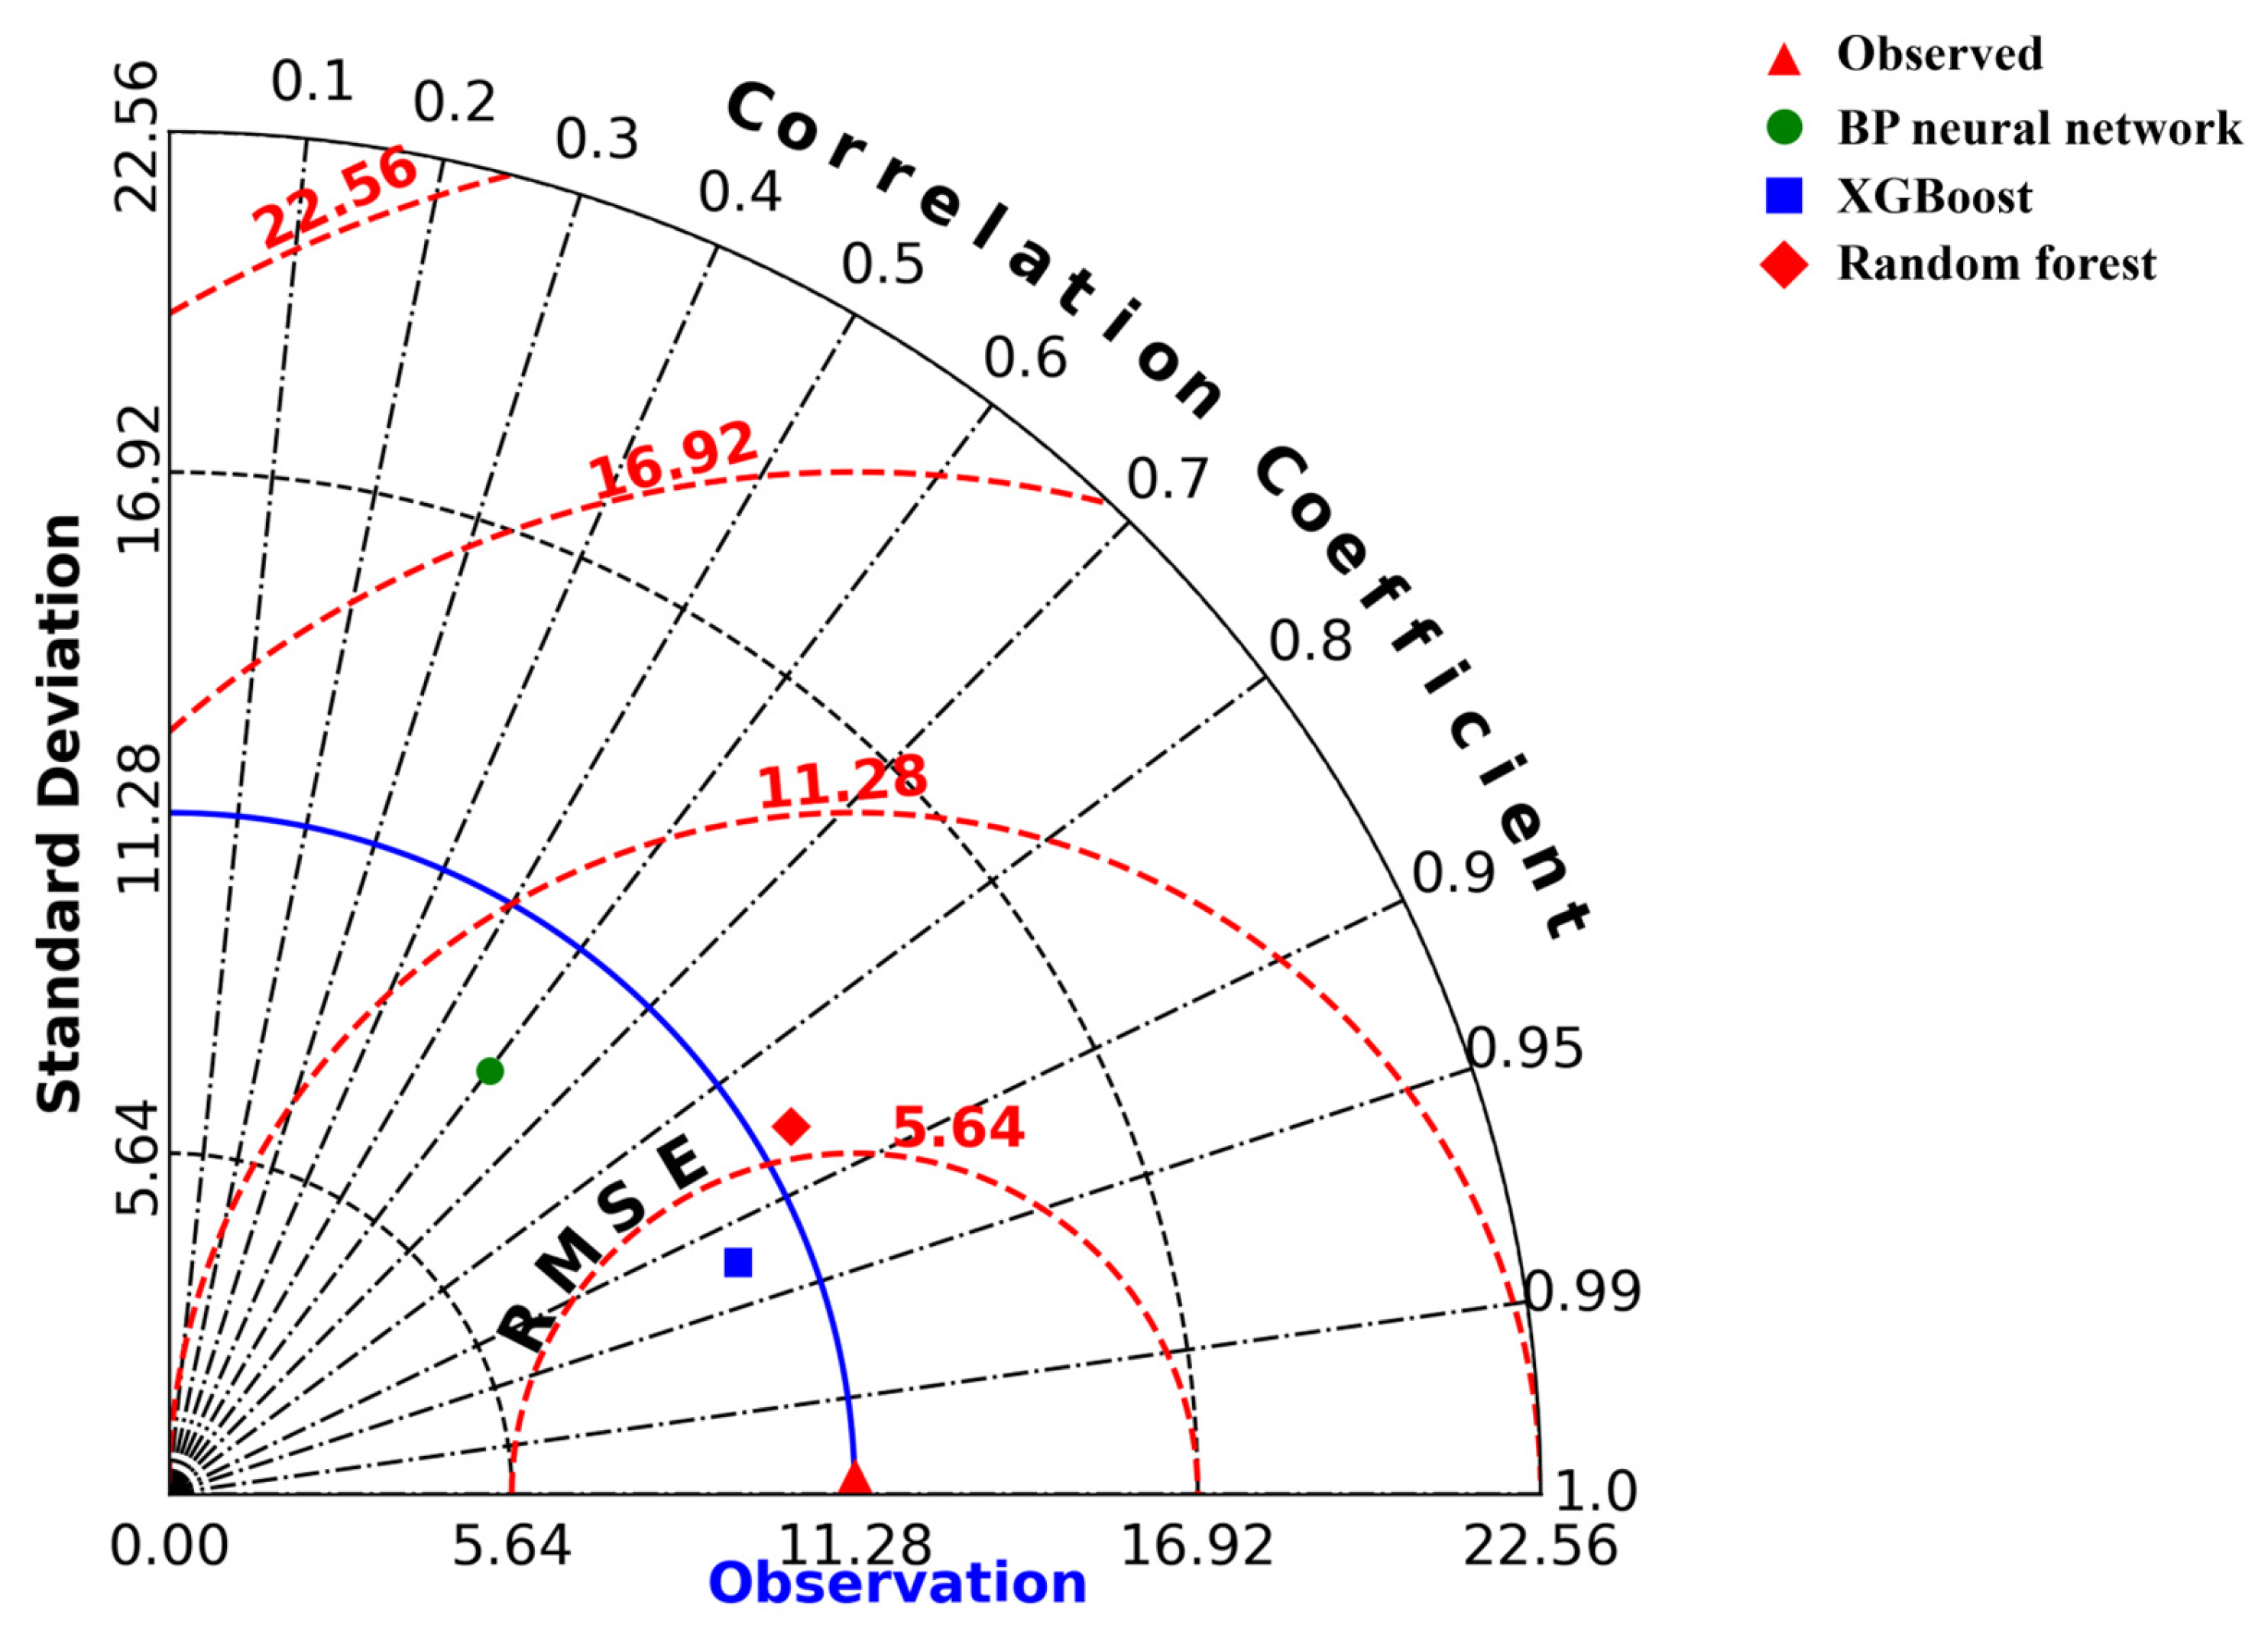
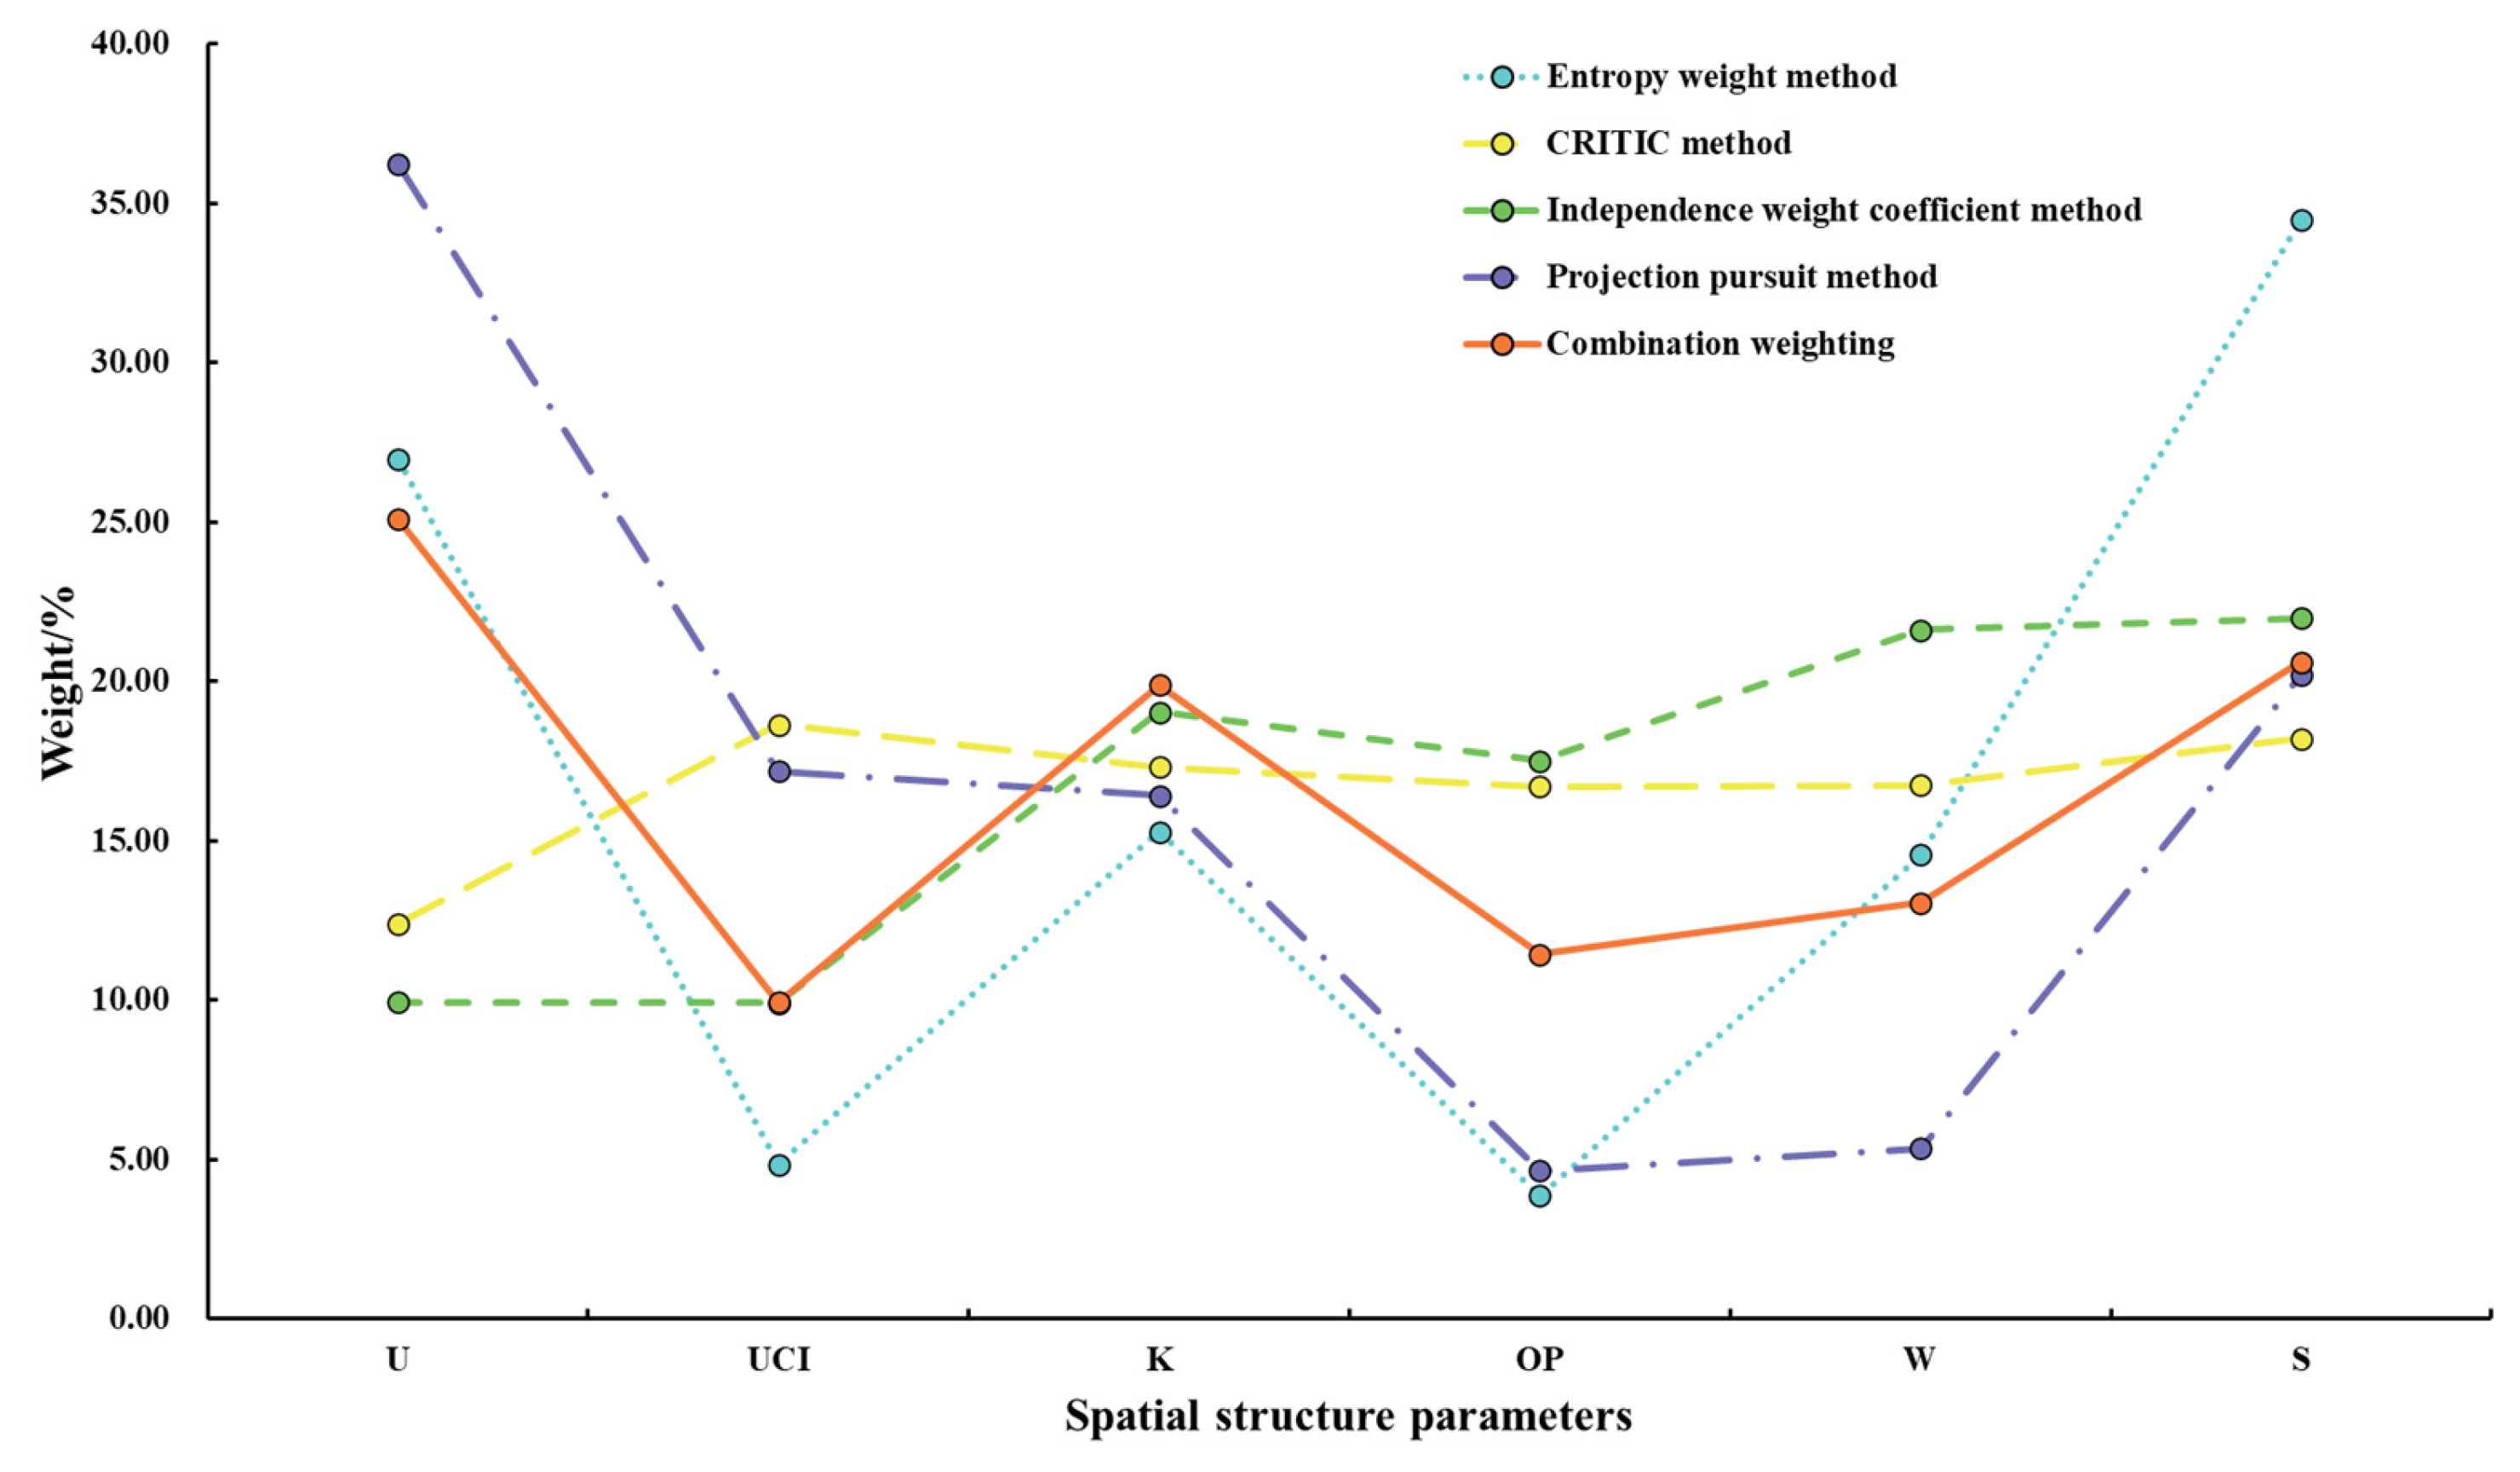
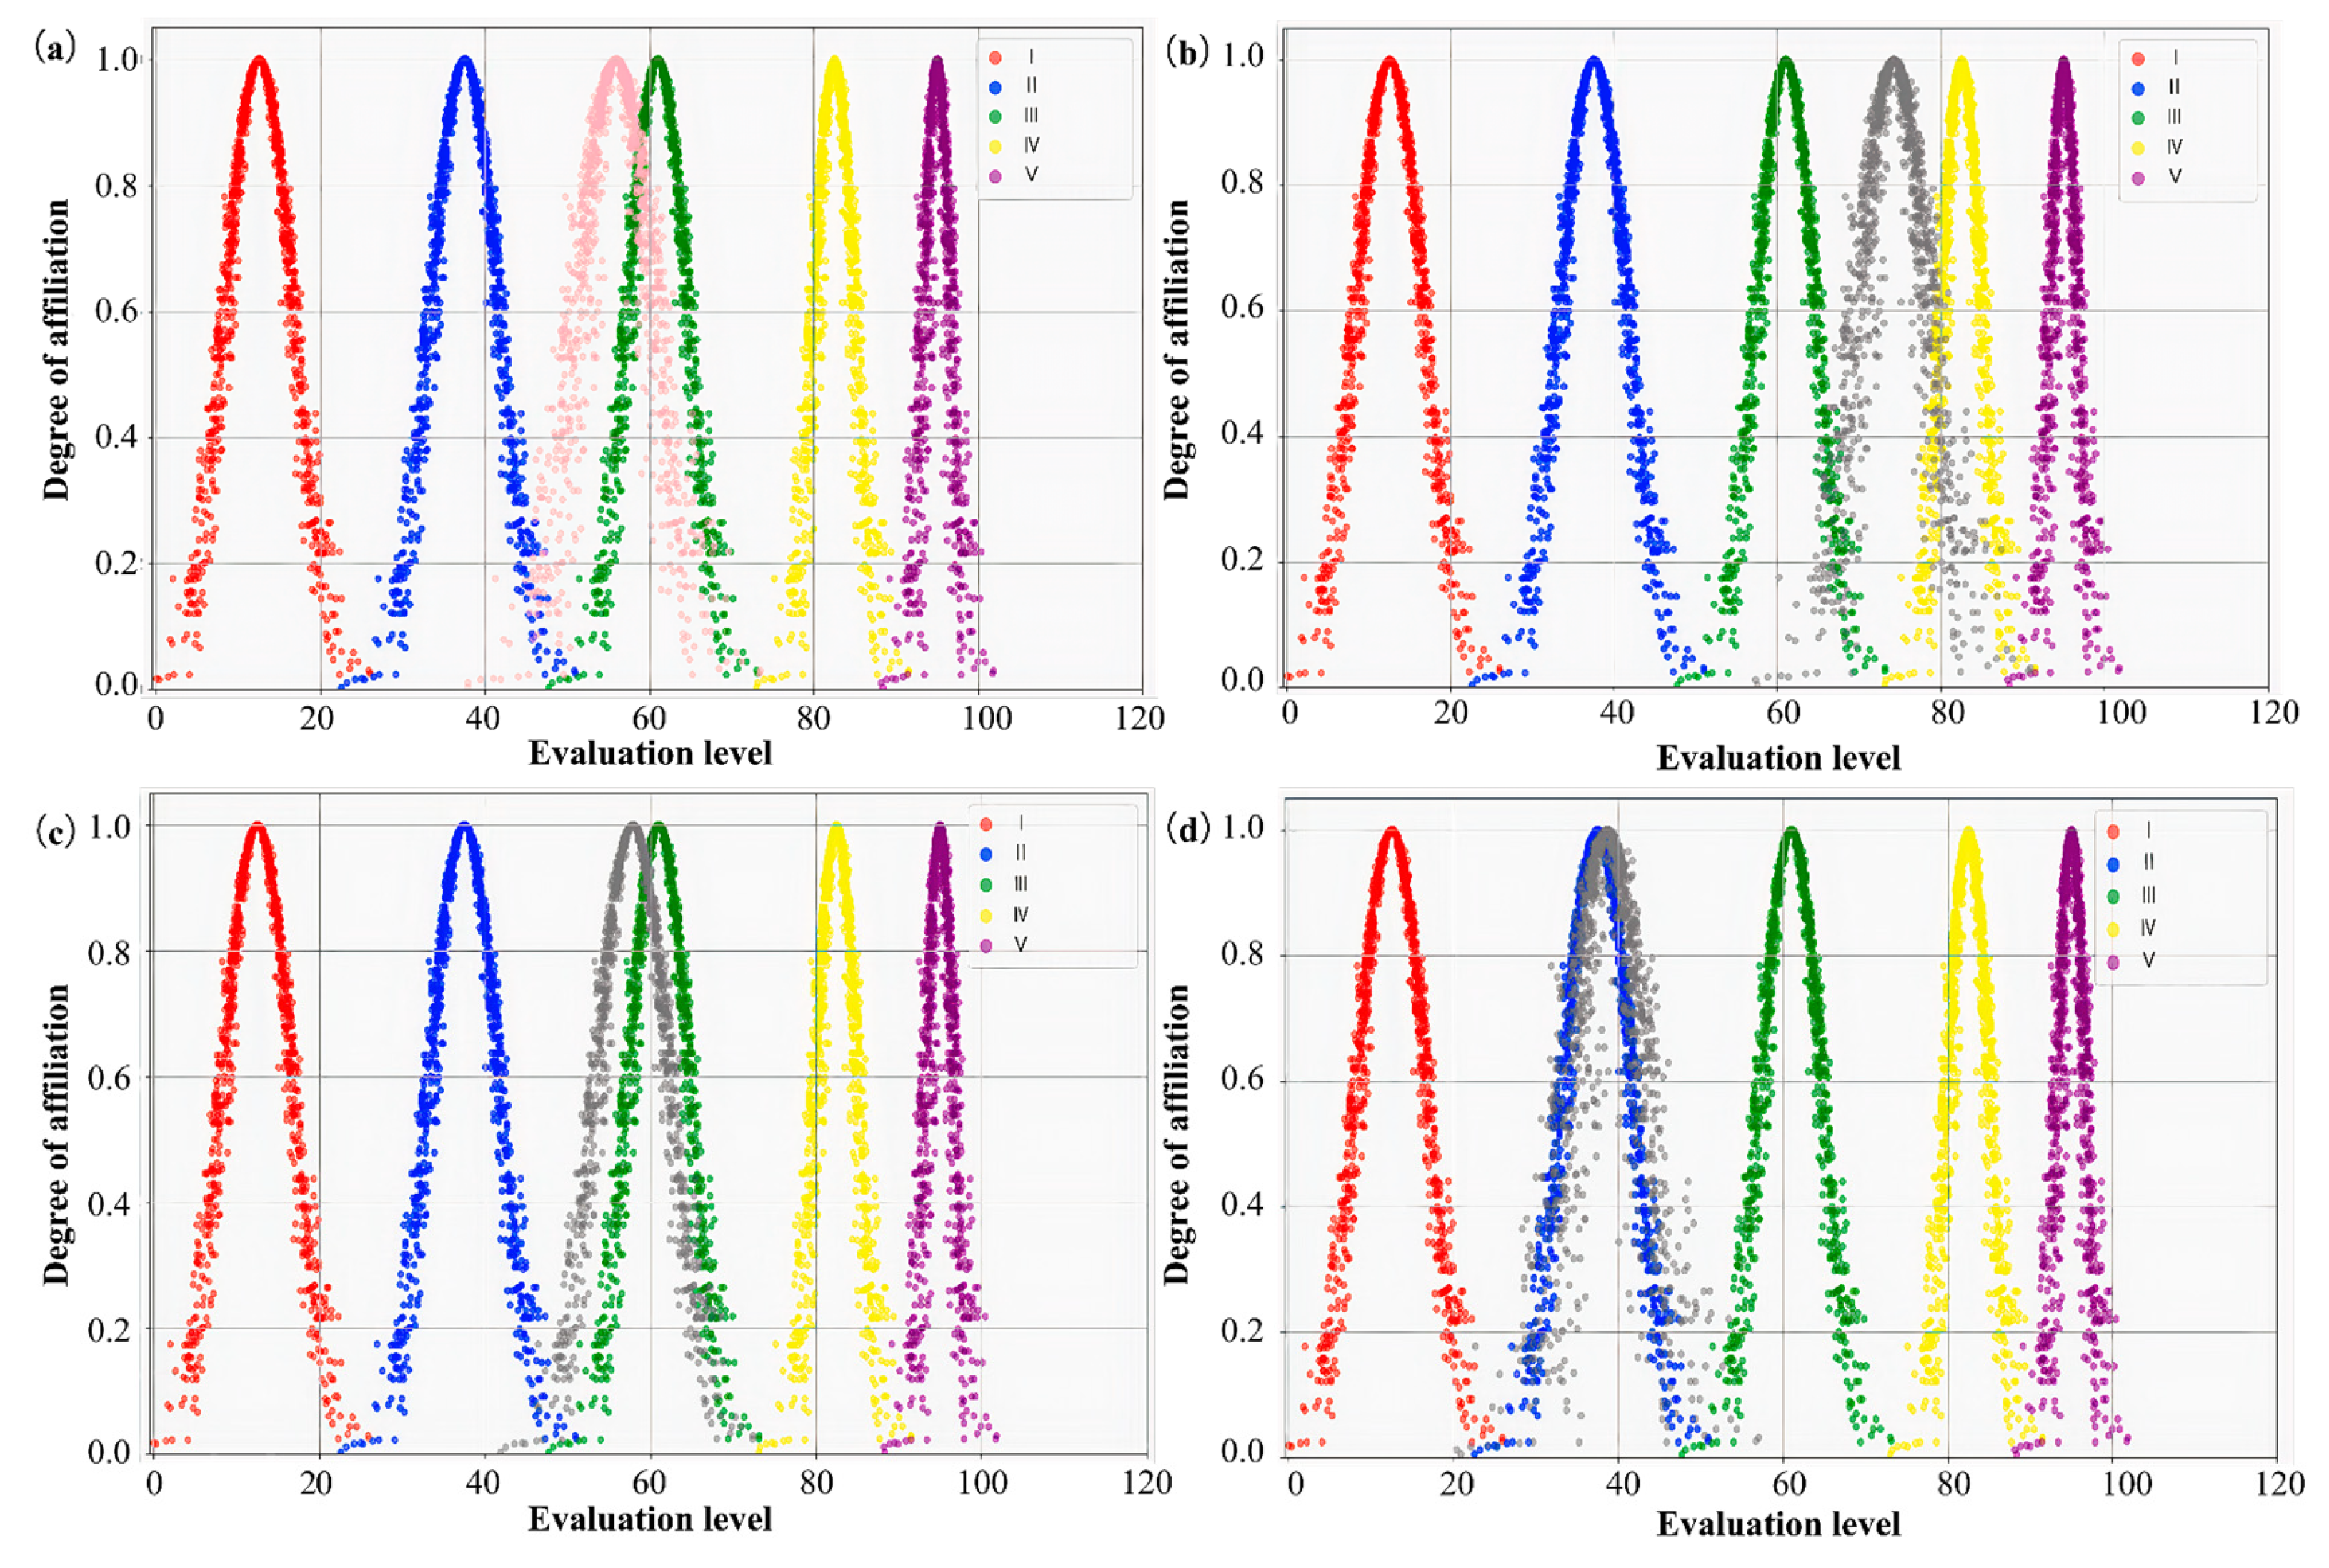
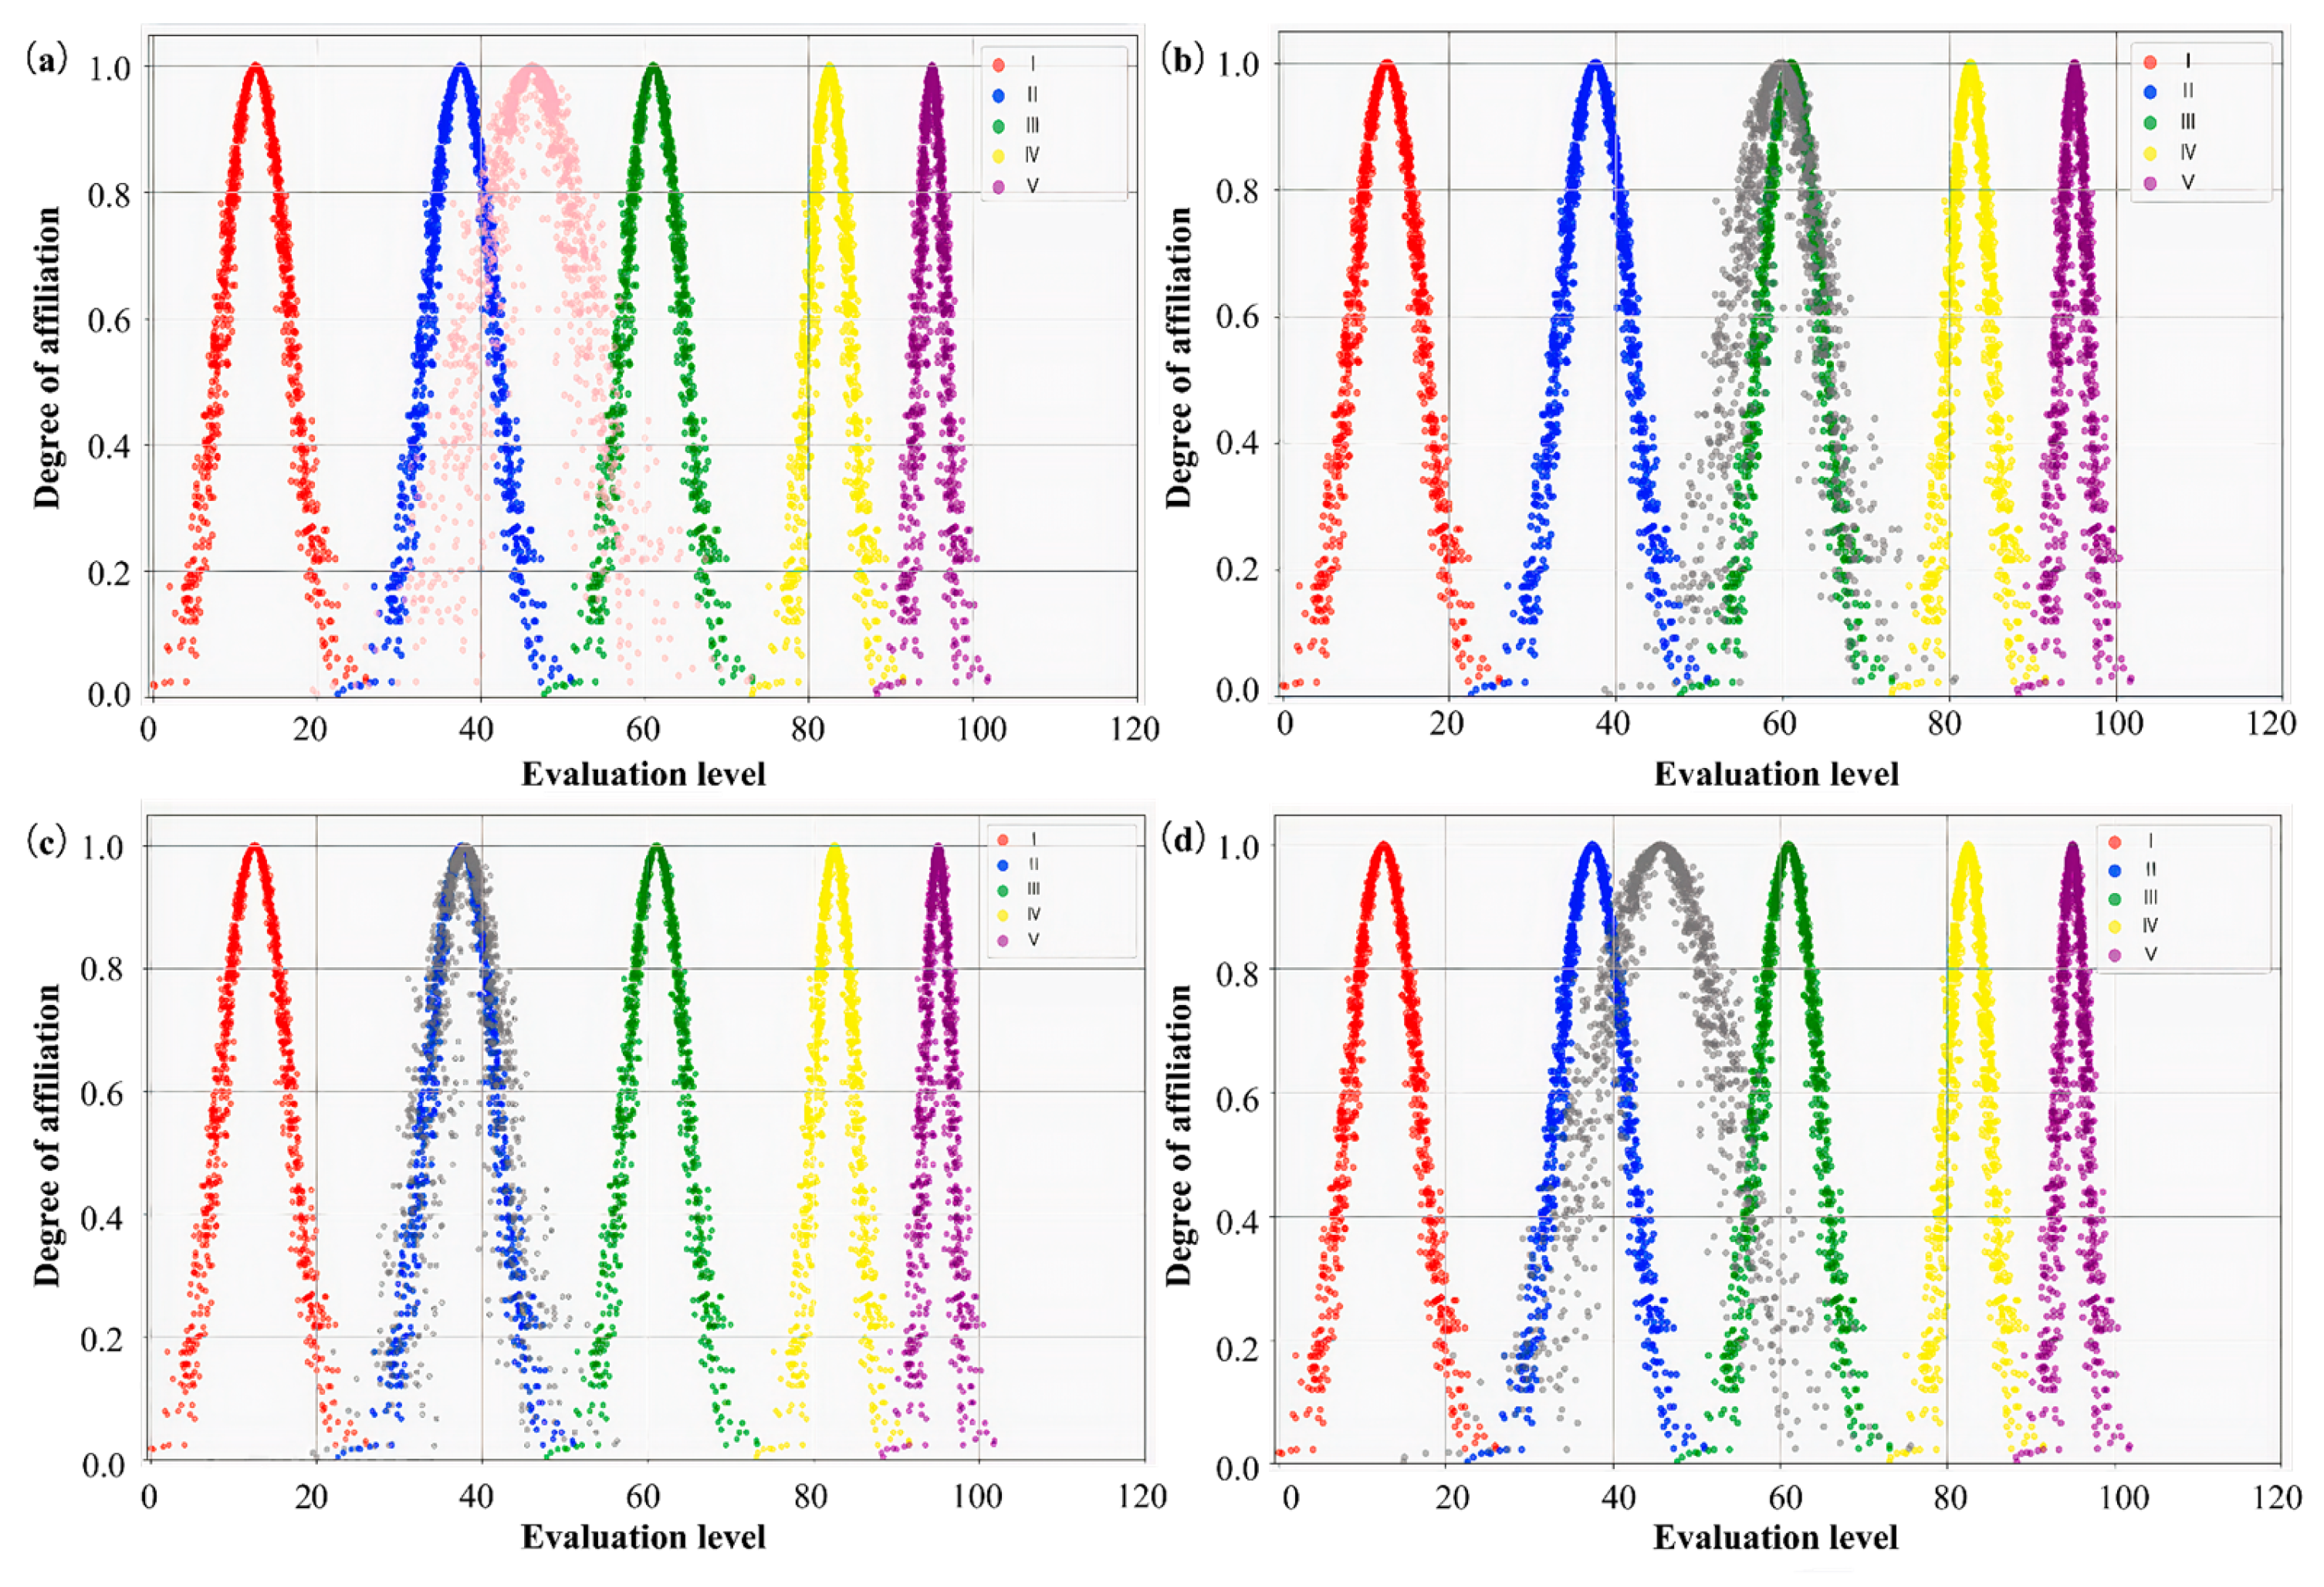
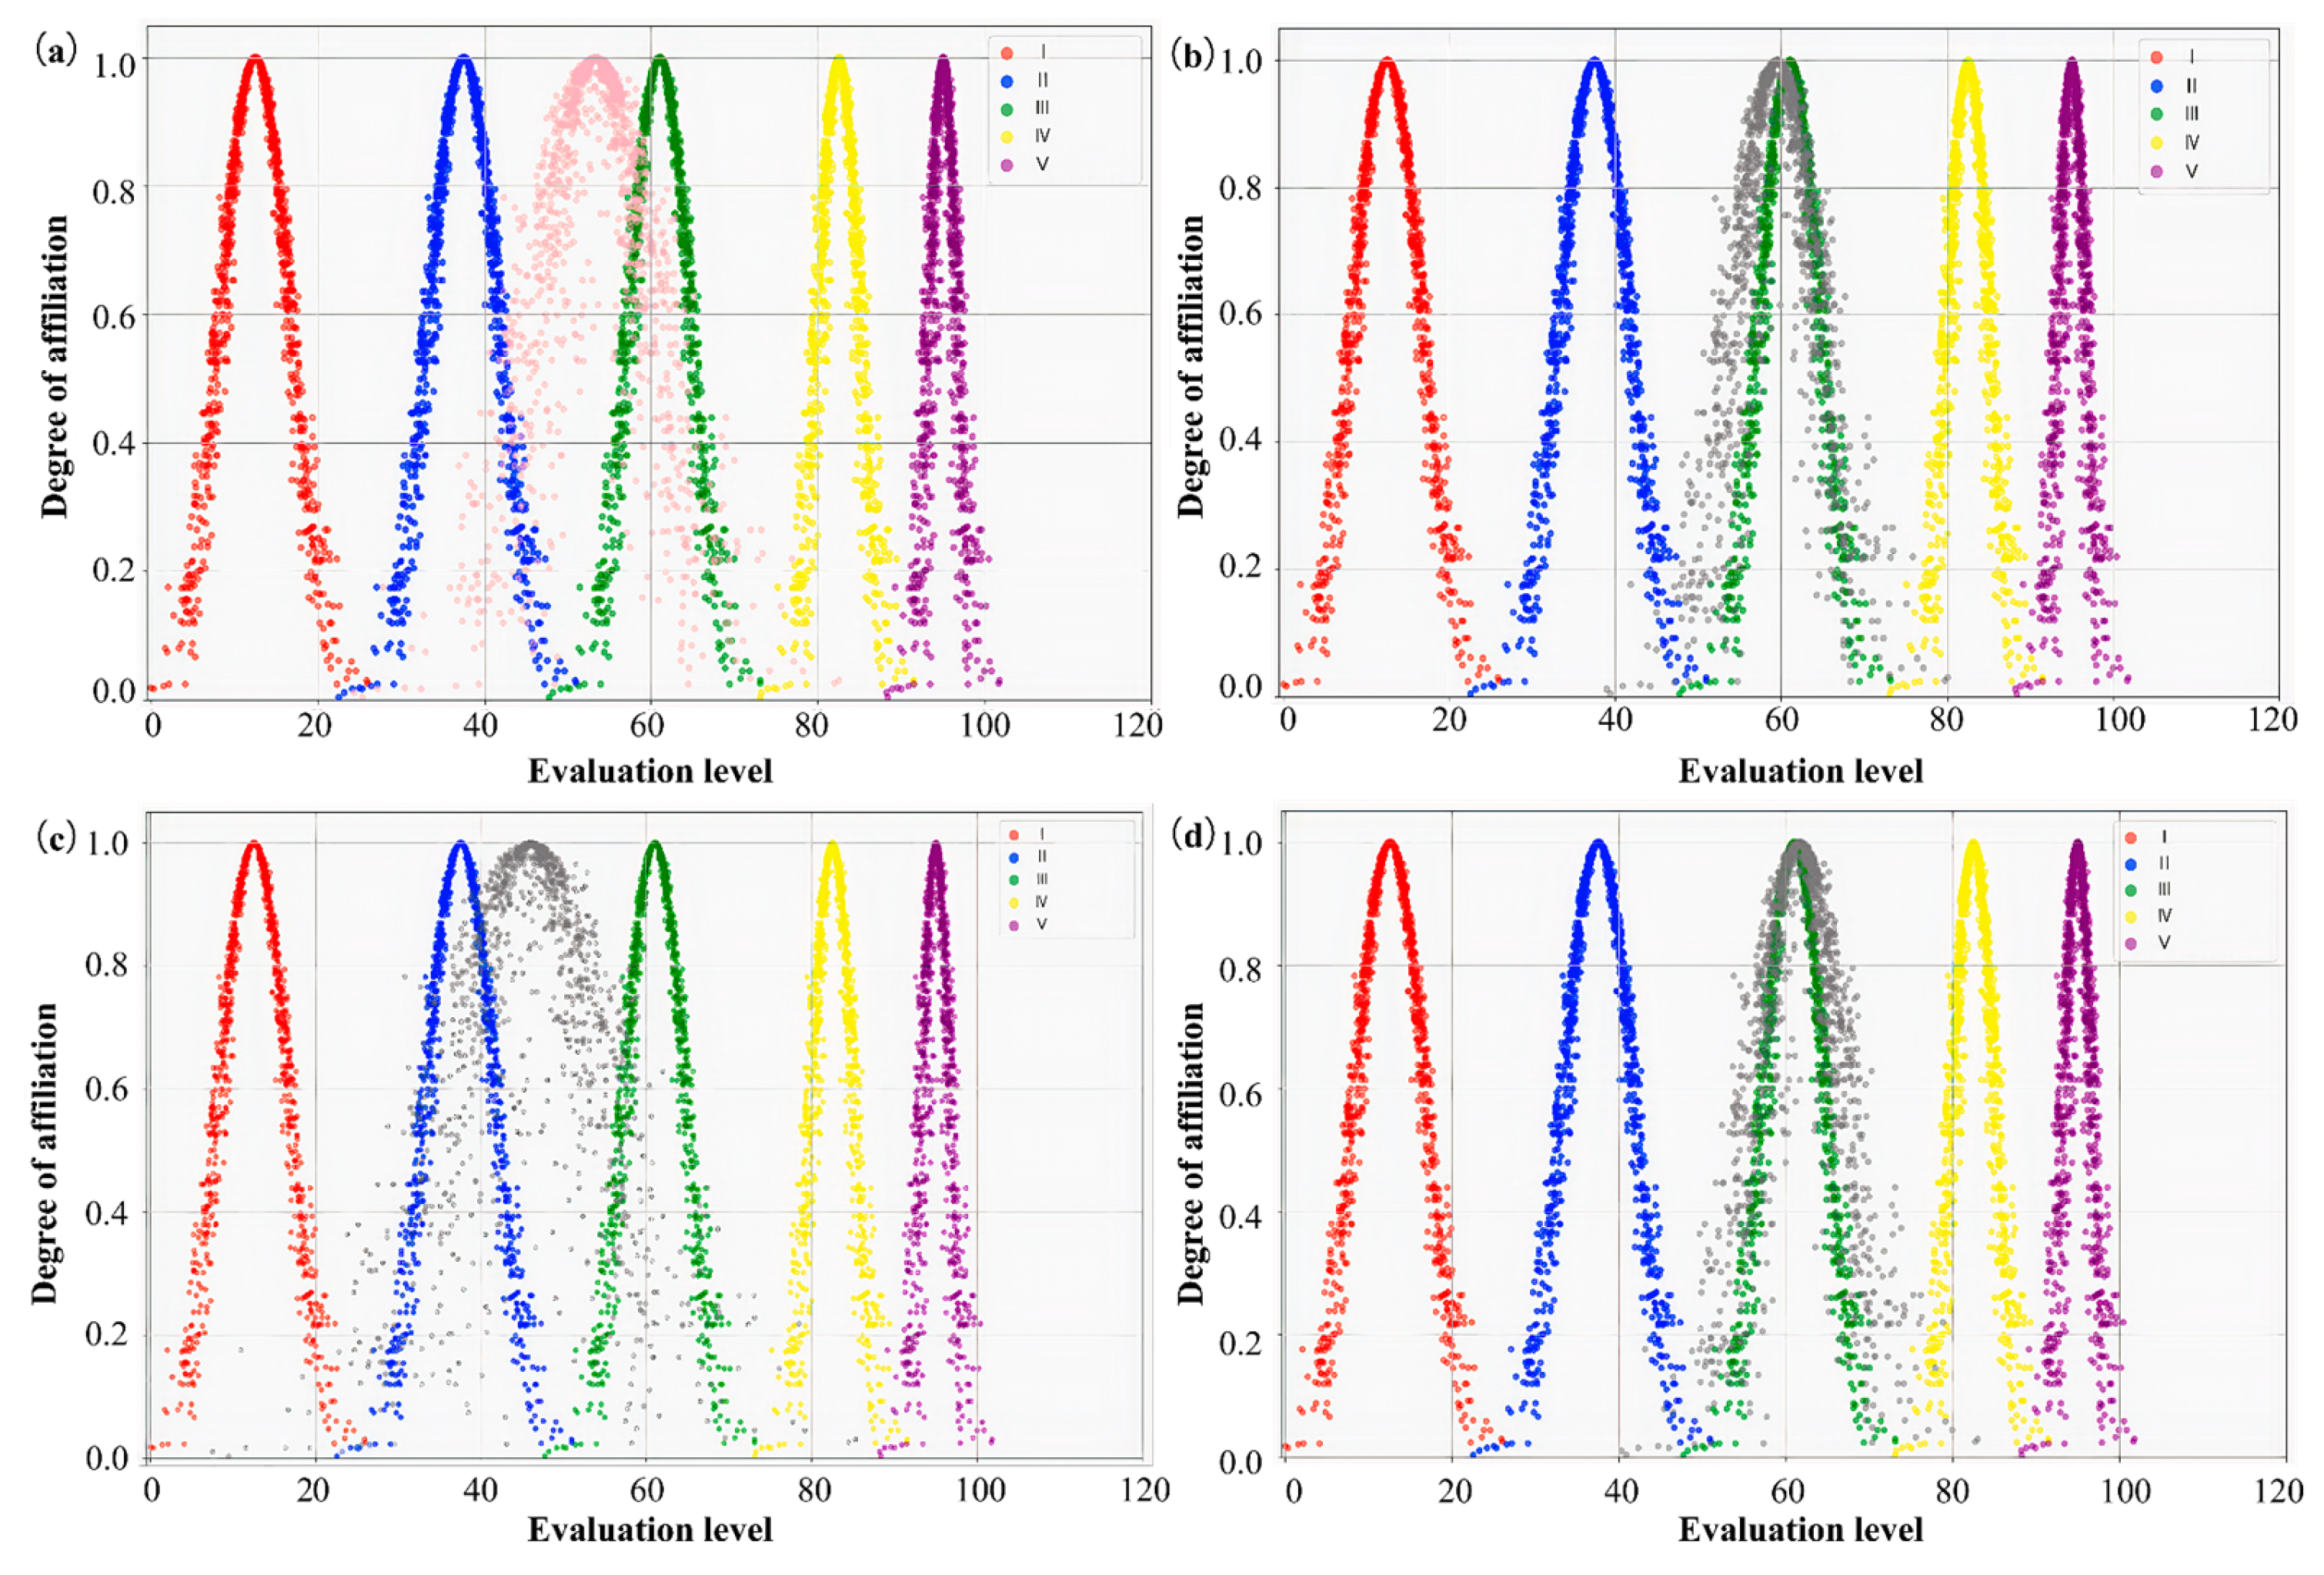
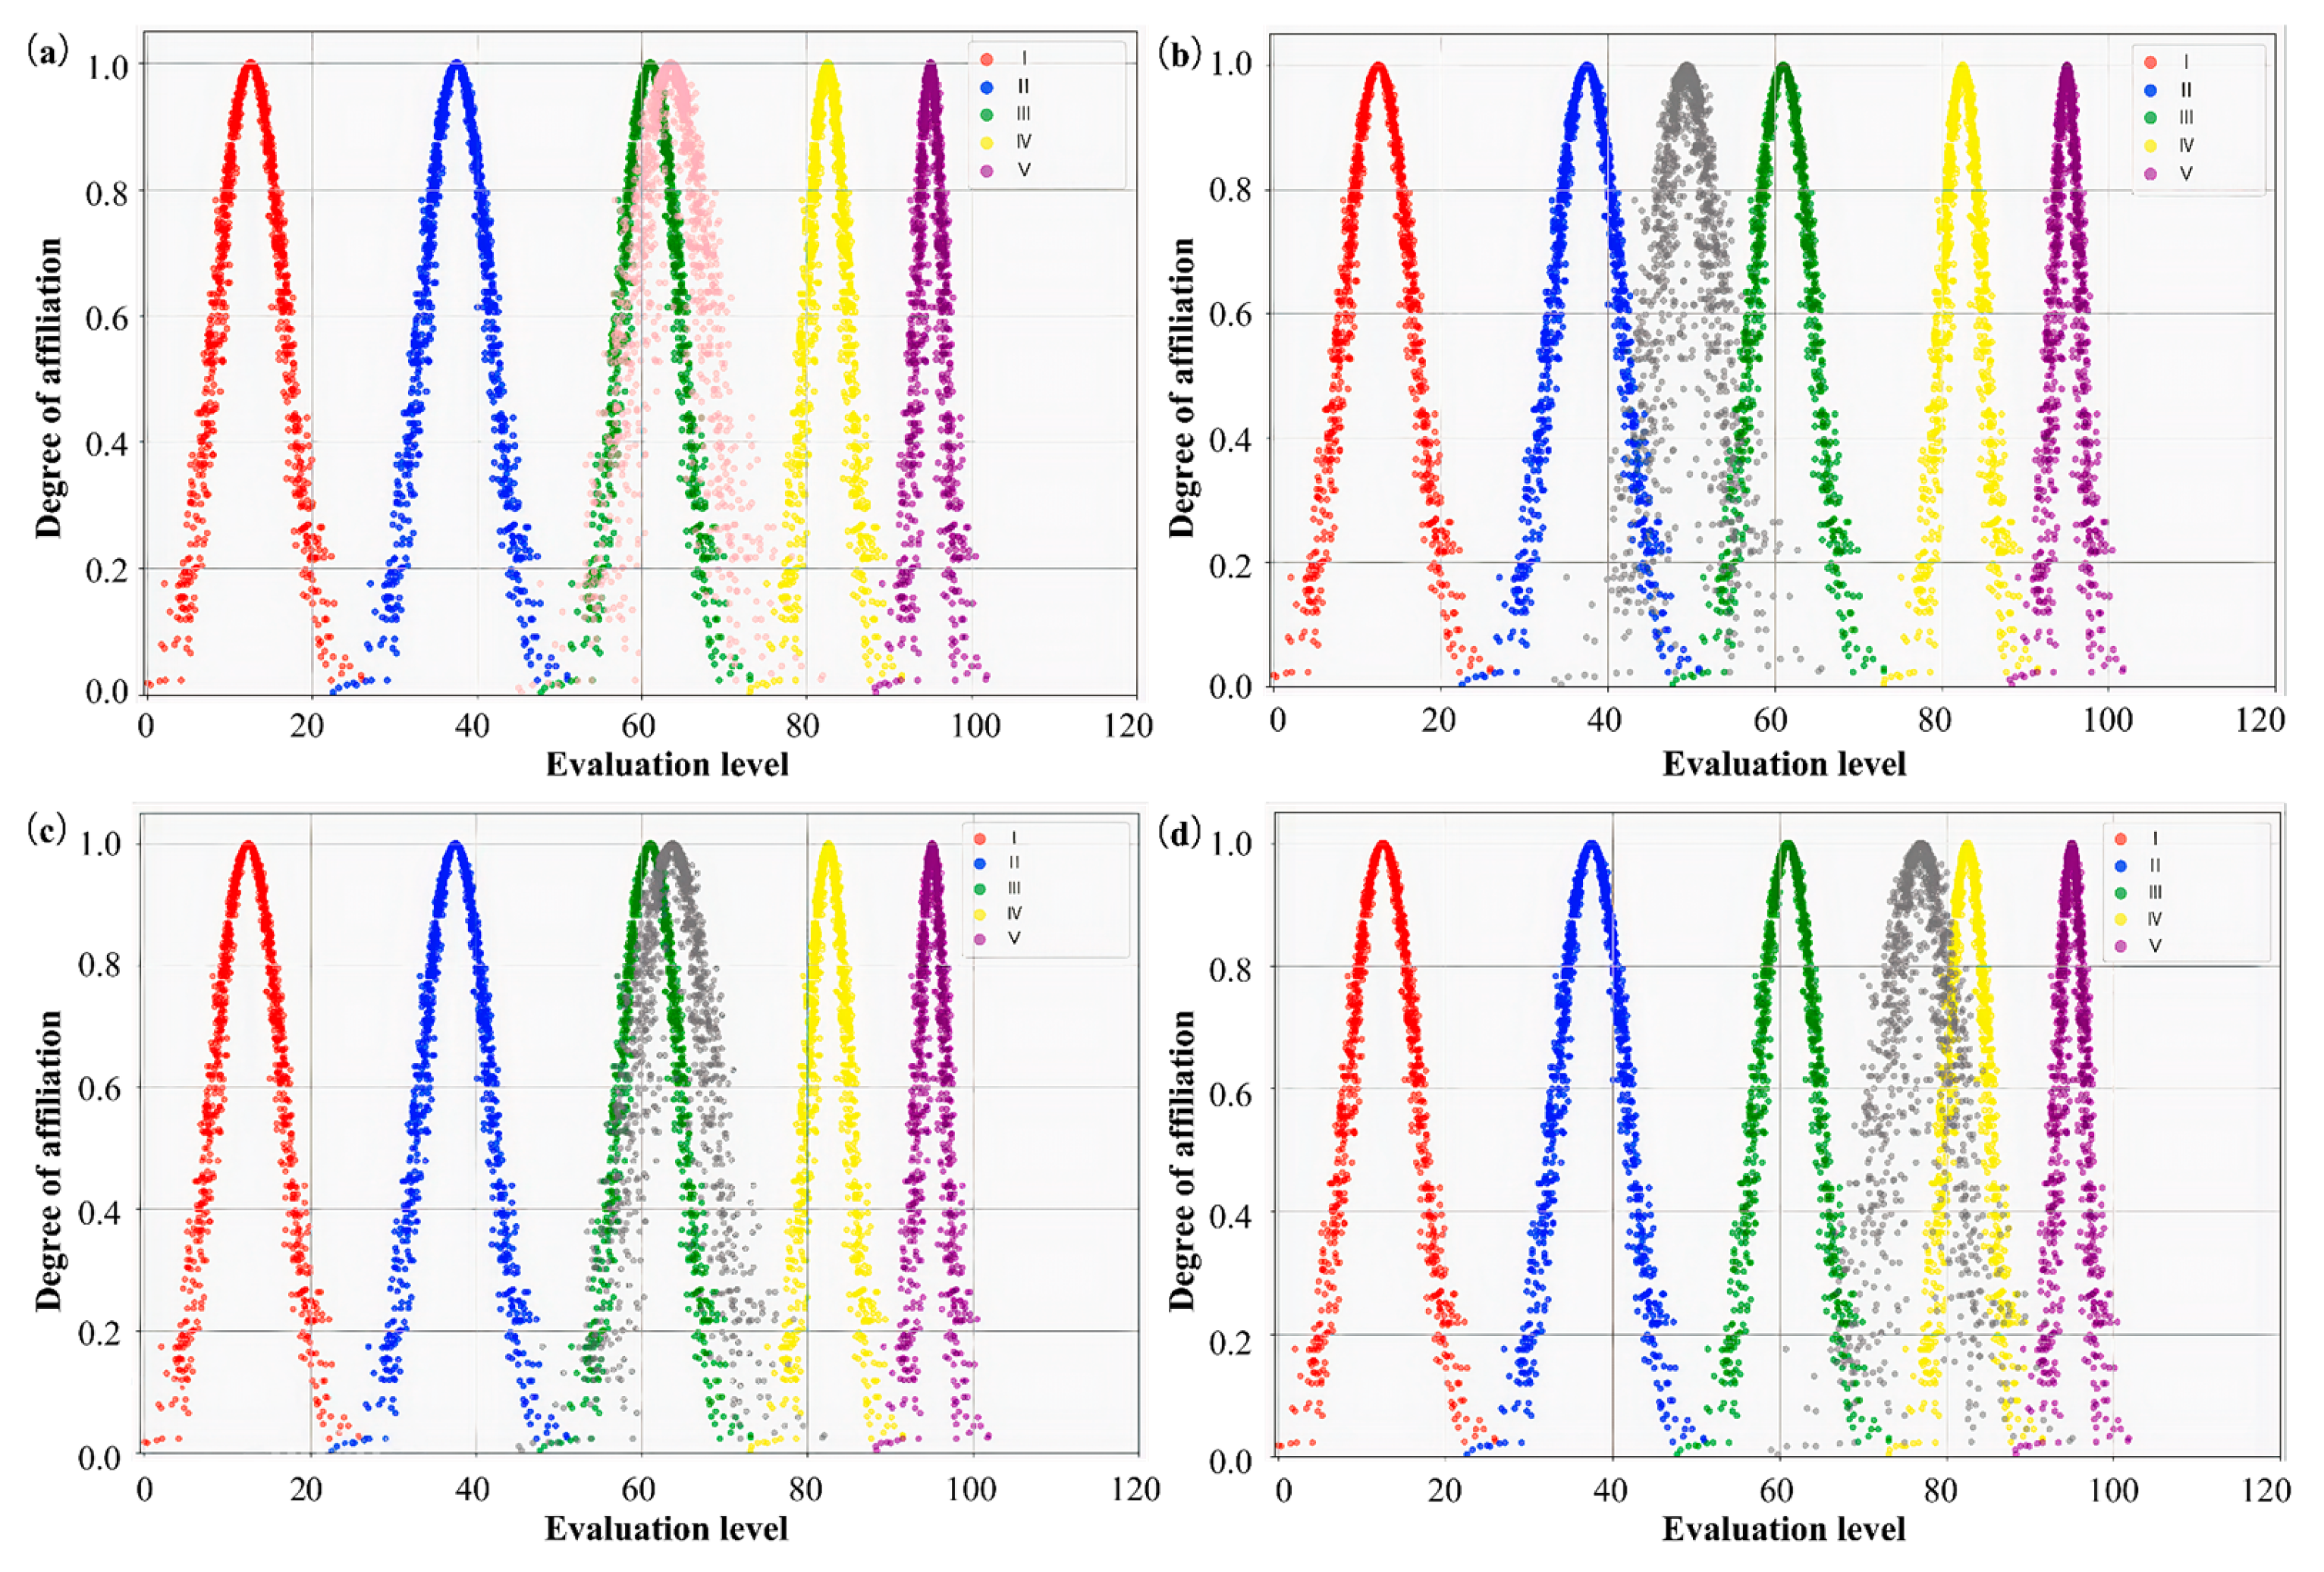
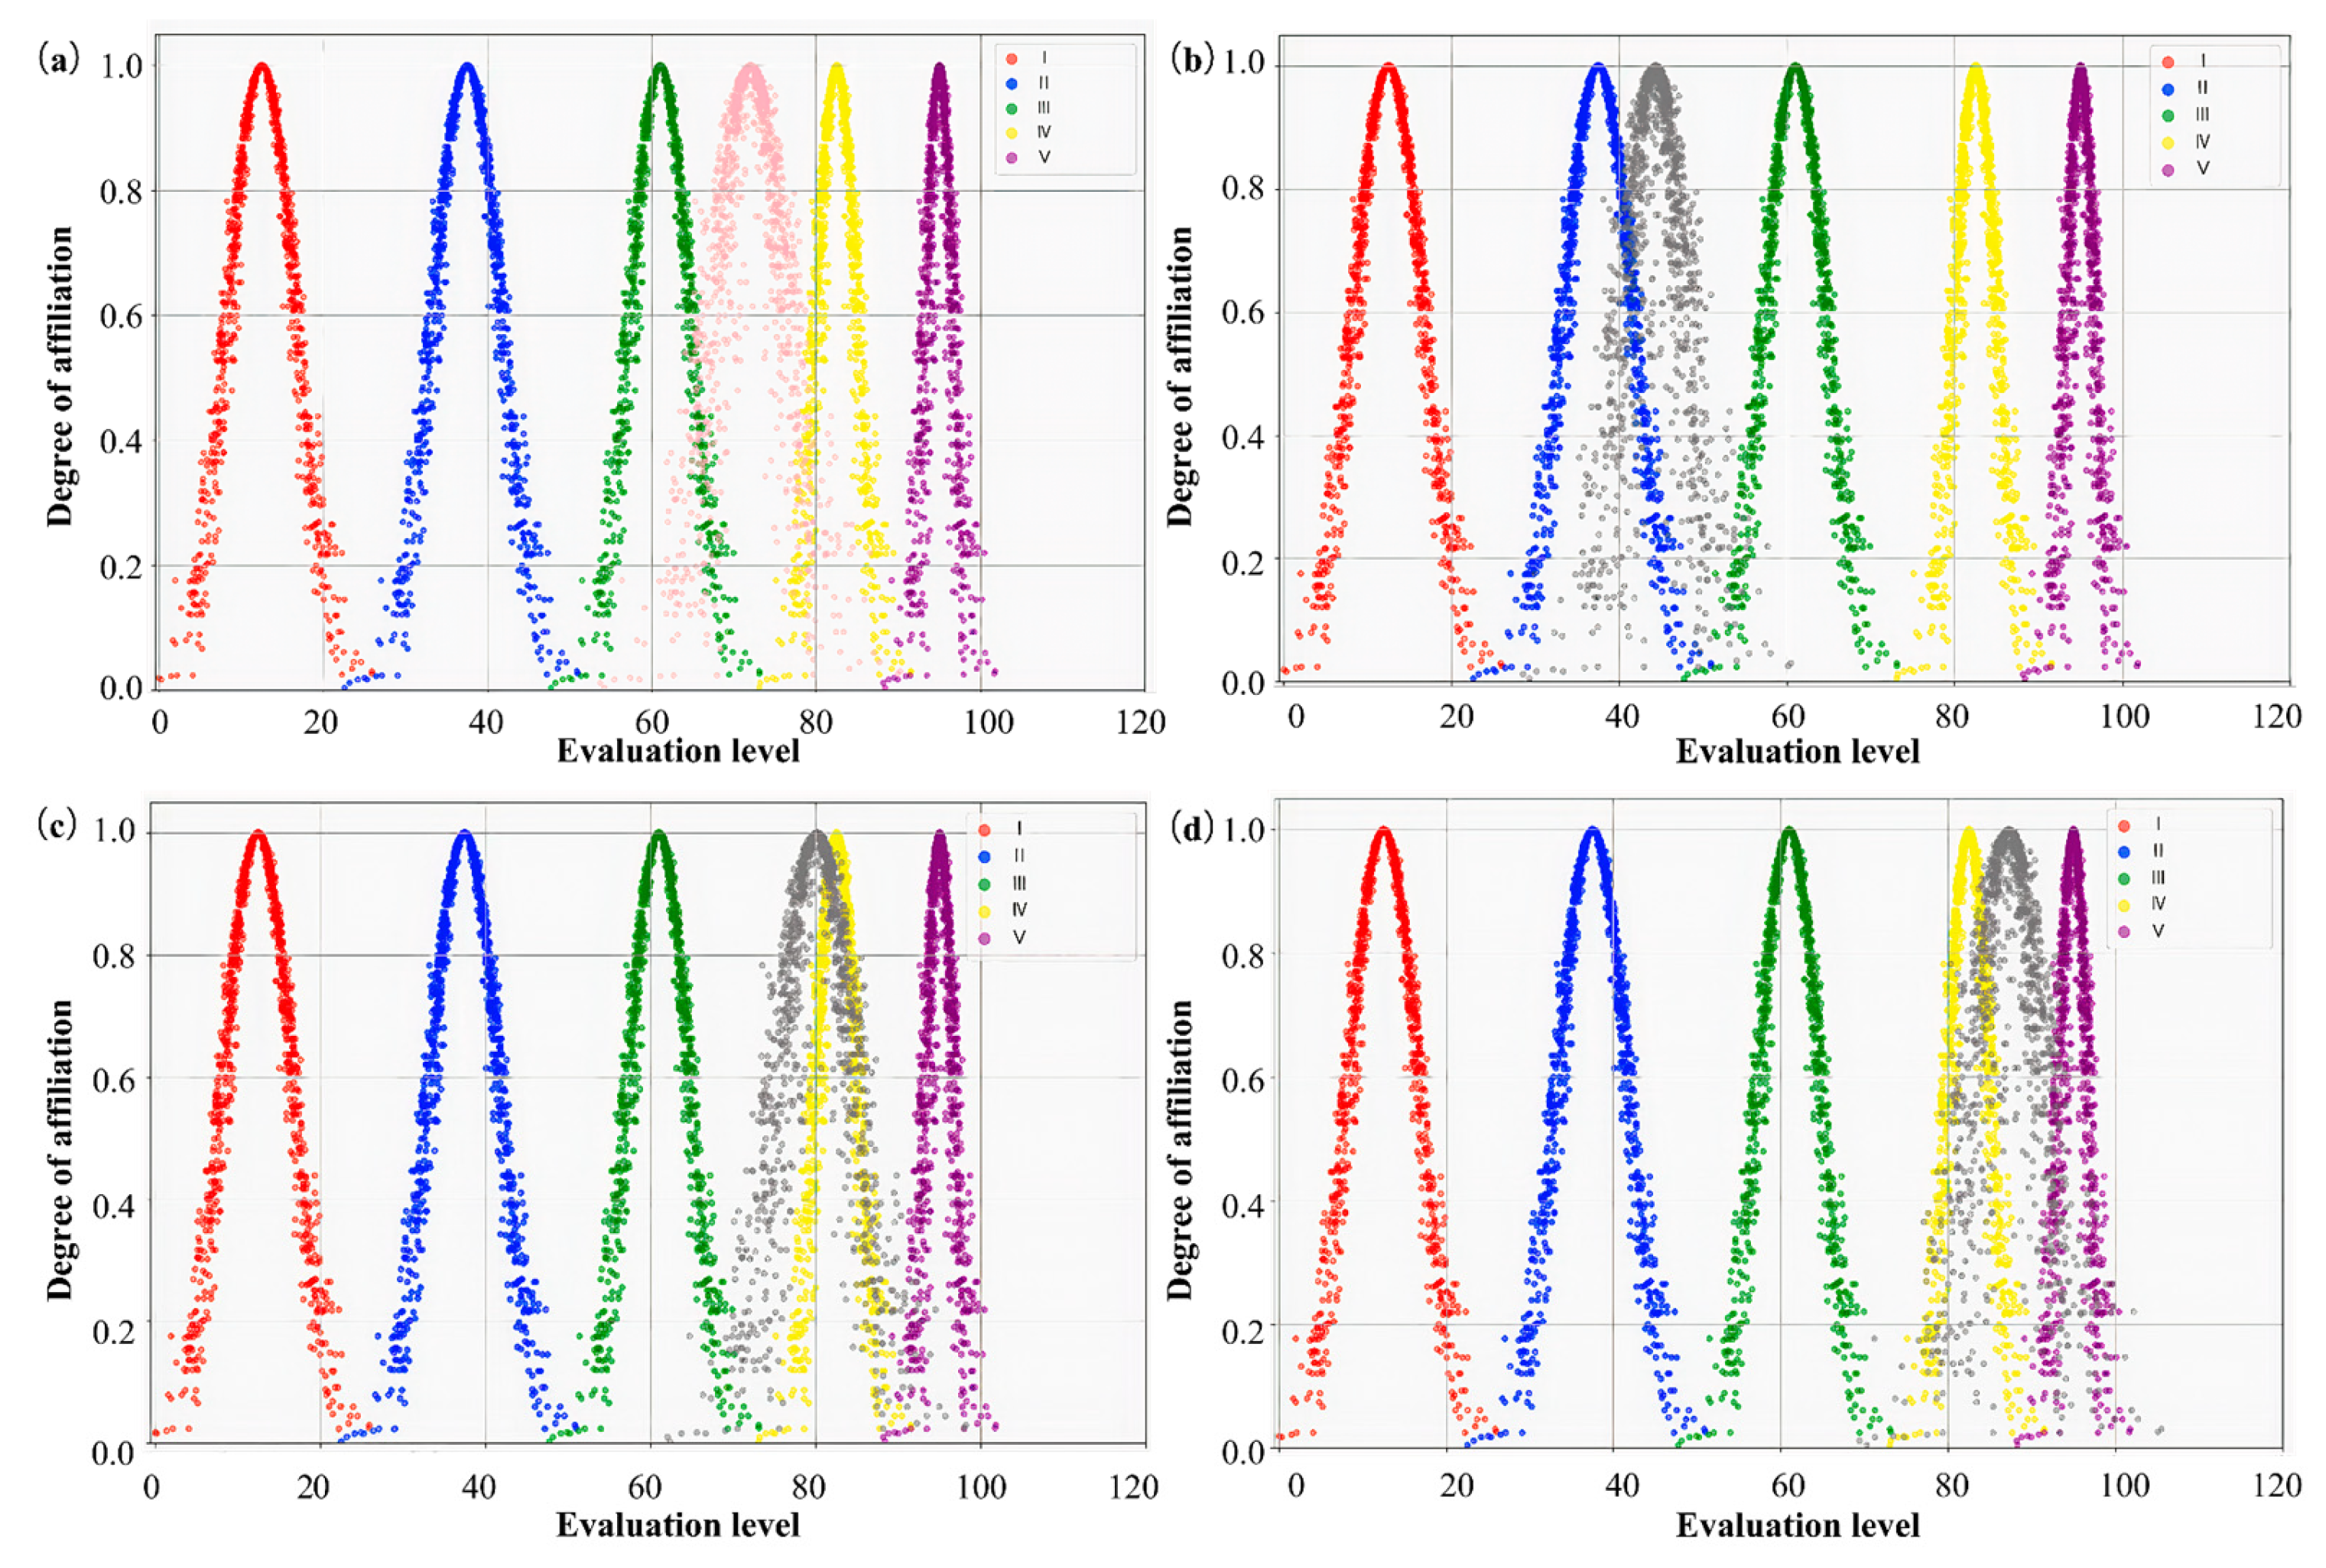
| Age Group | Average Tree Height/m | Average DBH/cm | Average CW/m | Stand Density | Canopy Closure | Slope/° | Elevation/m |
|---|---|---|---|---|---|---|---|
| Trees/ha | |||||||
| Young forest | 9.1 ± 0.8 | 12.2 ± 1.5 | 2.4 ± 0.2 | 2533.7 ± 320.6 | 0.8 ± 0.02 | 23.0 ± 3.5 | 220.7 ± 8.1 |
| Middle-aged forest | 13.2 ± 1.0 | 15.3 ± 1.8 | 2.8 ± 0.1 | 1244.4 ± 128.1 | 0.6 ± 0.06 | 26.7 ± 5.1 | 195.7 ± 6.5 |
| Near-ripe forest | 15.7 ± 1.5 | 17.6 ± 1.0 | 3.0 ± 0.1 | 2203.9 ± 166.9 | 0.8 ± 0.11 | 25.0 ± 1.0 | 212.3 ± 13.3 |
| Mature forest | 17.3 ± 1.5 | 22.8 ± 2.4 | 3.2 ± 0.2 | 914.5 ± 368.1 | 0.6 ± 0.10 | 26.0 ± 1.2 | 227.0 ± 32.6 |
| Overripe forest | 19.3 ± 1.9 | 25.9 ± 2.6 | 3.6 ± 0.1 | 1289.4 ± 550.4 | 0.7 ± 0.07 | 27.7 ± 2.8 | 208.3 ± 5.7 |
| Class | Variable | Description |
|---|---|---|
| Height variable | H_xth | Height percentile |
| H_mean, H_max, H_min, H_median | Mean, maximum, minimum, and median | |
| H_std, H_cv, H_ske, H_kur, H_cur, H_var | Standard deviation, coefficient of variation, skewness, kurtosis, cubic mean, and variance | |
| Density variable | D0, D1, D2, D3, D4, D5, D6, D7, D8, D9 | The density of the point cloud in each of the ten horizontal layers uniformly divided from low to high |
| Intensity variable | I_xth | Intensity percentile |
| I_mean, I_max, I_min, I_median | Mean, maximum, minimum, and median | |
| I_std, I_cv, I_ske, I_kur, I_var | Standard deviation, coefficient of variation, skewness, kurtosis, and variance |
| Evaluation Level | Evaluation Description | Evaluation Interval |
|---|---|---|
| I | Poor quality of space structures | 0.0–24.9 |
| II | Suboptimal spatial structure quality | 25.0–49.9 |
| III | Moderate spatial structure quality | 50.0–74.9 |
| IV | Good spatial structure quality | 75.0–89.9 |
| V | Excellent spatial structure quality | 90.0–100 |
| Age Group | Sample Plot NO. | Standard Deviation of Gaussian Kernel | Measured Quantity | Number of Segments | Number of Errors | R | P | F |
|---|---|---|---|---|---|---|---|---|
| Young forest | 1 | 0.7 | 152 | 140 | 1 | 0.914 | 0.993 | 0.952 |
| 2 | 1.2 | 162 | 158 | 4 | 0.951 | 0.975 | 0.963 | |
| 3 | 1.2 | 193 | 173 | 6 | 0.865 | 0.965 | 0.913 | |
| Middle-aged forest | 4 | 1.3 | 83 | 83 | 8 | 0.904 | 0.904 | 0.904 |
| 5 | 2.4 | 91 | 91 | 7 | 0.923 | 0.923 | 0.923 | |
| 6 | 0.7 | 74 | 72 | 3 | 0.932 | 0.958 | 0.945 | |
| Near-ripe forest | 7 | 0.3 | 157 | 125 | 11 | 0.726 | 0.912 | 0.809 |
| 8 | 2.5 | 149 | 127 | 1 | 0.846 | 0.992 | 0.913 | |
| 9 | 0.7 | 135 | 130 | 13 | 0.867 | 0.900 | 0.883 | |
| Mature forest | 10 | 2.5 | 40 | 38 | 9 | 0.800 | 0.842 | 0.821 |
| 11 | 3 | 62 | 70 | 11 | 0.887 | 0.786 | 0.833 | |
| 12 | 1.7 | 88 | 90 | 10 | 0.875 | 0.856 | 0.865 | |
| Overripe forest | 13 | 1.8 | 112 | 108 | 15 | 0.830 | 0.861 | 0.845 |
| 14 | 2.5 | 44 | 40 | 6 | 0.773 | 0.850 | 0.810 | |
| 15 | 1.5 | 102 | 98 | 13 | 0.833 | 0.867 | 0.850 |
| Variable | Correlation | Variable | Correlation | Variable | Correlation | Variable | Correlation | Variable | Correlation |
|---|---|---|---|---|---|---|---|---|---|
| H_cur | 0.720 *** | H_1th | 0.318 *** | H_50th | 0.737 *** | H_99th | 0.765 *** | I_ske | 0.158 * |
| H_max | 0.769 *** | H_5th | 0.572 *** | H_60th | 0.745 *** | D0 | −0.121 ** | I_std | 0.272 *** |
| H_mean | 0.703 *** | H_10th | 0.633 *** | H_70th | 0.747 *** | D1 | −0.185 ** | I_10th | −0.277 *** |
| H_median | 0.706 *** | H_20th | 0.682 *** | H_75th | 0.751 *** | D4 | −0.22 *** | I_20th | −0.259 *** |
| H_ske | −0.25 *** | H_25th | 0.698 *** | H_80th | 0.751 *** | D7 | 0.169 ** | I_30th | −0.161 * |
| H_std | 0.632 *** | H_30th | 0.704 *** | H_90th | 0.759 *** | I_cv | 0.332 *** | I_90th | 0.173 ** |
| H_var | 0.584 *** | H_40th | 0.713 *** | H_95th | 0.76 *** | I_max | 0.428 *** | I_95th | 0.209 ** |
| Regression Model | Data Set | |||||
|---|---|---|---|---|---|---|
| Training Set | Test Set | |||||
| R2 | RMSE | MAE | R2 | RMSE | MAE | |
| BP neural network | 0.744 | 5.221 | 3.911 | 0.556 | 7.485 | 5.433 |
| Random forest | 0.929 | 2.866 | 1.943 | 0.789 | 4.681 | 3.378 |
| XGBoost | 0.982 | 1.428 | 0.759 | 0.869 | 3.788 | 3.101 |
| Age Group | Cloud Digital Characteristics | Spatial Structure Parameters | |||||
|---|---|---|---|---|---|---|---|
| U | UCI | K | OP | W | S | ||
| Young forest | Ex | 56.933 | 60.000 | 67.067 | 85.867 | 42.267 | 36.000 |
| En | 4.601 | 3.509 | 4.768 | 3.041 | 5.036 | 4.011 | |
| He | 0.496 | 1.083 | 1.292 | 0.642 | 1.928 | 1.171 | |
| Middle-aged forest | Ex | 35.533 | 43.200 | 43.933 | 85.400 | 53.200 | 40.200 |
| En | 3.554 | 8.890 | 5.771 | 3.476 | 7.921 | 8.121 | |
| He | 1.032 | 3.360 | 1.632 | 1.351 | 2.420 | 1.488 | |
| Near-ripe forest | Ex | 45.800 | 46.267 | 43.800 | 85.000 | 68.133 | 56.867 |
| En | 8.924 | 7.041 | 5.281 | 4.345 | 5.715 | 4.835 | |
| He | 3.932 | 1.168 | 1.648 | 1.143 | 1.119 | 1.919 | |
| Mature forest | Ex | 63.400 | 64.200 | 33.800 | 74.933 | 78.133 | 76.000 |
| En | 4.378 | 5.615 | 3.743 | 3.097 | 3.565 | 4.345 | |
| He | 1.395 | 0.888 | 1.642 | 0.817 | 1.554 | 1.565 | |
| Overripe forest | Ex | 76.400 | 88.600 | 29.800 | 67.933 | 93.133 | 83.000 |
| En | 4.378 | 4.946 | 3.743 | 3.097 | 3.565 | 4.345 | |
| He | 1.395 | 0.799 | 1.642 | 0.817 | 1.554 | 1.565 | |
| Age Group | First-Level Indicators | Cloud Digital Characteristics (Ex, En, and He) |
|---|---|---|
| Young forest | growth quality | (57.871, 4.423, 0.591) |
| growth environment | (74.220, 4.295, 1.114) | |
| resource utilization | (38.645, 4.367, 1.434) | |
| comprehensive evaluation cloud | (55.925, 4.699, 1.087) | |
| Middle-aged forest | growth quality | (37.878, 4.422, 1.411) |
| growth environment | (59.709, 5.143, 1.555) | |
| resource utilization | (45.686, 8.051, 1.812) | |
| comprehensive evaluation cloud | (46.245, 6.616, 1.907) | |
| Near-ripe forest | growth quality | (45.943, 8.618, 3.482) |
| growth environment | (59.475, 5.025, 1.510) | |
| resource utilization | (61.621, 5.141, 1.641) | |
| comprehensive evaluation cloud | (53.271, 6.850, 2.325) | |
| Mature forest | growth quality | (63.645, 4.579, 1.313) |
| growth environment | (49.449, 3.566, 1.416) | |
| resource utilization | (76.900, 4.074, 1.561) | |
| comprehensive evaluation cloud | (63.462, 4.521, 1.364) | |
| Overripe forest | growth quality | (80.132, 4.470, 1.298) |
| growth environment | (44.308, 3.566, 1.416) | |
| resource utilization | (87.276, 4.074, 1.561) | |
| comprehensive evaluation cloud | (71.989, 4.441, 1.361) |
| Age Group | Growth Environment | Growth Quality | Resource Utilization | Comprehensive Evaluation |
|---|---|---|---|---|
| Young forest | IV | III | II | III |
| Middle-aged forest | III | II | II | II |
| Near-ripe forest | III | II | III | III |
| Mature forest | II | III | IV | III |
| Overripe forest | II | IV | IV | IV |
Disclaimer/Publisher’s Note: The statements, opinions and data contained in all publications are solely those of the individual author(s) and contributor(s) and not of MDPI and/or the editor(s). MDPI and/or the editor(s) disclaim responsibility for any injury to people or property resulting from any ideas, methods, instructions or products referred to in the content. |
© 2025 by the authors. Licensee MDPI, Basel, Switzerland. This article is an open access article distributed under the terms and conditions of the Creative Commons Attribution (CC BY) license (https://creativecommons.org/licenses/by/4.0/).
Share and Cite
Liu, J.; Jin, B.; Ding, G.; Huang, X.; Dong, J. Spatial Structure Evaluation of Chinese Fir Plantation in Hilly Area of Southern China Based on UAV and Cloud Model. Forests 2025, 16, 1483. https://doi.org/10.3390/f16091483
Liu J, Jin B, Ding G, Huang X, Dong J. Spatial Structure Evaluation of Chinese Fir Plantation in Hilly Area of Southern China Based on UAV and Cloud Model. Forests. 2025; 16(9):1483. https://doi.org/10.3390/f16091483
Chicago/Turabian StyleLiu, Jinyan, Bowen Jin, Guochang Ding, Xiang Huang, and Jianwen Dong. 2025. "Spatial Structure Evaluation of Chinese Fir Plantation in Hilly Area of Southern China Based on UAV and Cloud Model" Forests 16, no. 9: 1483. https://doi.org/10.3390/f16091483
APA StyleLiu, J., Jin, B., Ding, G., Huang, X., & Dong, J. (2025). Spatial Structure Evaluation of Chinese Fir Plantation in Hilly Area of Southern China Based on UAV and Cloud Model. Forests, 16(9), 1483. https://doi.org/10.3390/f16091483


