Article

Assessment of Potential Crown Fire Danger in Major Forest Types of the Da Xing’anling (Inner Mongolia) Mountains, China

1
College of Forestry, Inner Mongolia Agricultural University, Hohhot 010018, China
2
Baotou Forestry and Grassland Bureau, Baotou 014030, China
3
Hulunbuir Meteorological Bureau, Hulunbuir 021008, China
*
Author to whom correspondence should be addressed.
Forests 2025, 16(9), 1449; https://doi.org/10.3390/f16091449
Submission received: 26 June 2025 / Revised: 22 August 2025 / Accepted: 9 September 2025 / Published: 11 September 2025
(This article belongs to the Special Issue Fire Ecology and Management in Forest—2nd Edition)

Abstract

Crown fires are a major disturbance in boreal and cold–temperate forests worldwide, threatening both ecosystems and human activities. The Da Xing’anling Mountains of Northeast China exemplify these dangers due to their complex vegetation and high crown fire potential. Crown fire occurrence depends on vertical fuel continuity, fuel load, heating value, surface fire spread rate, and critical fireline intensity. However, many assessments rely on single-factor metrics or low-adaptability simulations. This study developed a Potential Canopy Fire Danger Index (PCDI) that integrates five parameters—fuel vertical distribution continuity index, fuel loading, heating value, surface fire rate of spread, and critical fireline intensity—based on field surveys and combustion tests. Pinus pumila (Regel, 1861), with its dense shrub layer, showed the highest PCDI values (0.502, 0.583 and 0.527), whereas other forest types generally fell in the low to low–moderate range (0.350–0.450), with ≈75% of plots within these classes. Surface fire spread rate correlated most strongly with PCDI, followed by vertical fuel continuity, heating value, and fuel load; critical fireline intensity had minimal influence. The elevated hazard in P. pumila reflects its structural and fuel characteristics, while other forest types present comparatively lower dangers. Model checks indicated high stability and agreement with BehavePlus 6.0 scenarios, with the PCDI showing the lowest sample SD. The PCDI provides a quantitative framework for assessing crown fire danger in cold–temperate forests and supports targeted mitigation—prioritizing P. pumila while employing cost-effective maintenance in low-danger forest types.

1. Introduction

Due to its rich forest resources and special climate conditions, Da Xing’anling has become an area with a high incidence of forest fires in northeastern China. Forest fires are among the most complex and destructive natural hazards, with their increasing frequency posing a significant threat to global carbon stocks, natural ecosystems, human infrastructure, and public safety [1,2,3,4]. Based on their location, forest fires are generally classified into underground, surface, and crown fires, with crown fires typically igniting when surface or brush fires escalate into the tree canopy [5]. The fundamental physics of crown fire spread involves complex interactions among convective and radiative heat transfer, turbulent flow within and above the canopy, and the pyrolysis of live and dead fuels, as described in foundational models such as those developed by Grishin [6]. As extreme fire phenomena, crown fires exhibit rapid spread and high-intensity combustion, making them particularly difficult to control [7]. Empirical and semi-empirical models, including the widely adopted Rothermel-based canopy extensions implemented in systems such as FARSITE (USA) and Prometheus (Canada), attempt to capture these dynamics through simplified relationships derived from experimental burns and historical fire data [8,9]. Their occurrence is primarily influenced by factors such as surface fire intensity and the vertical continuity of fuel layers [10]. Cellular automata approaches, which use spatial discretization and transition rules based on neighboring states (e.g., fuel, weather, and topography), have also been applied in the EU and Australia to simulate large-scale crown fire propagation across heterogeneous landscapes [11,12]. Consequently, a detailed examination of fuel distribution and combustion properties within forest stands is essential for predicting crown fire initiation and spread [13].
Understanding crown fire fundamentally depends on the comprehensive characterization of surface and canopy fuel properties [14]. Recent advances in LiDAR (Light Detection and Ranging) remote sensing, particularly airborne and UAV-based systems, have greatly improved the quantification of critical 3D canopy fuel structure metrics (e.g., canopy bulk density, canopy base height, and fuel layer connectivity) across extensive forested areas in North America and Europe [15,16]. Currently, fuel characterization is primarily based on small-scale combustion experiments conducted under controlled indoor conditions designed to simulate natural surface fire dynamics, thus exploring the fuel properties of crown fires [17]. However, scaling laboratory findings to field conditions remains a major challenge, as demonstrated by comparative studies of wind tunnel experiments in France and actual wildfire behavior in Mediterranean forests [18]. In addition, these experimental approaches are both time-consuming and labor-intensive, and the inherent variability of natural environments often leads to inconsistent simulation outcomes, limiting their broader applicability. To address these limitations, Xu [19] utilized remote sensing techniques to monitor fuel dynamics, an approach that has proven valuable for large-scale post-fire assessments, including vegetation burn severity and recovery. Integrating multi-temporal satellite data (e.g., Sentinel-2 and Landsat) with field inventories has improved the mapping of surface fuel moisture and load dynamics in fire-prone boreal forests of Canada and Siberia [20,21]. However, this method remains less precise for localized fire behavior analysis at finer spatial resolutions. Similarly, studies by Lyell and Hou [22,23] have applied machine learning algorithms to identify key fuel characteristics as indicators of fire occurrence and spread. Recent applications of deep learning (e.g., CNNs and Transformers) to fused satellite, weather station, and topographic data in California and southeastern Australia have demonstrated enhanced ability to predict fine-scale fire danger hotspots, including areas susceptible to crown fire development [24,25]. Although these models have advanced predictive capabilities, their accuracy is often hindered by sample underrepresentation and variability in fuel conditions across different forest types. These findings underscore the necessity of accounting for diverse fuel properties across different forest stand compositions. Future research should emphasize localized, stand-level investigations to elucidate how fuel properties influence fire dynamics, avoiding the problem of the poor accuracy of remote sensing and machine learning.
Traditionally, crown fire danger assessments have primarily focused on the vertical continuity of fuel distribution. Modern frameworks, such as the Potential Crown Fire Energy (PCFE) metric developed in the USA and implemented in systems like WFDS (Wildland–Urban Interface Fire Dynamics Simulator), incorporate both vertical and horizontal fuel heterogeneity to better estimate crowning potential and energy release [26,27]. However, such assessments frequently overlook critical parameters, including the height of understory vegetation and the accumulation of dead fuel layers, leading to potential biases in danger evaluation [28]. For example, research in managed Pinus stands in Portugal showed that ladder fuels (e.g., dense understory regeneration and dead branches) significantly reduce the threshold wind speed required for crown fire initiation, a factor often omitted from standard indices [29]. For example, Robert’s application of the Fire Weather Index (FWI) system demonstrated a strong correlation between predicted and observed crown fire occurrences, yet the study did not adequately account for the influence of height of understory vegetation [30]. Similarly, Kucuk quantified canopy fire hazards based on crown fuel properties and highlighted the non-linear relationship between the height distribution of fuel load and fire danger [31]. Refinements to the Canadian Forest Fire Behavior Prediction (FBP) System’s crown fire initiation submodels, incorporating canopy fuel moisture and foliar chemistry effects on ignitability based on field studies across diverse Canadian boreal forests, have been proposed to improve accuracy [32]. Further modeling efforts by Egor revealed that crown fire initiation is driven by an interplay of factors, including surface fire intensity, canopy base height, and meteorological conditions [33]. Morvan’s coupled fire-atmosphere-vegetation models, which explicitly resolve turbulent wind fields interacting with canopy elements, have provided deeper insights into the critical role of coherent turbulent structures in crown fire spread rate and spotting potential [34]. Despite substantial progress in fire danger research, a major challenge remains: the absence of a comprehensive and adaptable framework that systematically integrates insights from forestry and combustion science. To address this gap, the present study introduces the Potential Canopy Fire Danger Index (PCDI), designed to overcome the limitations of single-factor approaches and highly specialized simulations. By offering a more holistic and interpretable measure of crown fire danger, the PCDI advances the ability to evaluate and manage fire dangers in complex forest ecosystems. This novel approach provides a reliable and scientifically grounded framework for the precise assessment, prevention, and control of potential crown fire hazards.
Current research on crown fires has primarily concentrated on three key areas. First, in-depth investigations of fuel loads have facilitated the analysis of fire behavior characteristics and probabilities, with a particular focus on the mechanisms that trigger crown fire initiation and the factors governing fire spread dynamics [35]. Recent studies in Australian eucalypt forests have quantified the critical role of bark fuel loads and suspended ‘aerial fuels’ in sustaining intense crown fires through long-range spotting, a phenomenon less prominent in Northern Hemisphere conifer systems [36]. Second, several studies have sought to enhance model accuracy by comparing simulation outcomes with observed fire events, refining predictive methodologies for crown fire behavior [37,38]. Third, advanced statistical techniques, such as non-linear regression analysis, have been employed to model crown fire dynamics, providing both critical scientific insights for forest fire management and valuable data for related research disciplines [31,33,35]. Additionally, the integration of machine learning approaches has emerged as a promising tool for improving crown fire prediction, enabling more precise assessments of fire initiation and destructive potential. These advancements contribute to enhanced efficiency and accuracy in forest fire prevention and mitigation strategies [13,39]. Nevertheless, challenges persist, particularly the limited availability of high-quality field data detailing pre-fire canopy structure and fuel state at fine scales, uncertainty in model parameterization across diverse forest types (e.g., Siberian larch, Canadian spruce, and Australian eucalypt), and the difficulty of generalizing results across varying forest types and fire regimes. Validation and calibration of crown fire models remain heavily dependent on a small number of well-instrumented experimental burns or opportunistic wildfire observations, underscoring a persistent global data gap [6,18,34].
The specific objectives of this research are to (1) derive five key indicators—fuel vertical distribution continuity index (Ci), fuel load (Wi), fuel combustion heat value (Hi), surface fire rate of spread (Ri), and critical fireline intensity (Ii)—through a combination of sample plot investigations and controlled indoor combustion experiments, (2) develop a comprehensive PCDI model that integrates these indicators to provide an accurate representation of crown fire danger, and (3) conduct linear regression analyses to evaluate the relationship between the PCDI and various factors, thereby facilitating a more precise assessment of potential crown fire hazards. The purpose of this study is to develop and validate a PCDI for accurately assessing crown fire danger in the Da Xing’anling Mountains.

2. Materials and Methods

2.1. Overview of the Study Area

The study was conducted in forested mountains managed by the Genhe Forestry Bureau, located in the Da Xing’anling region of Inner Mongolia, China, at an average elevation of 848 m. This mountain range lies within the cold–temperate humid forest zone and is characterized by a continental monsoon climate. The mean annual temperature is –5.5 °C, with long, harsh winters, short summers, and transitional spring and autumn seasons. The official fire prevention period is divided into two phases: spring (March–May) and autumn (September–November) [40]. Historically, forest fires peak in May and November, coinciding with the driest periods. To ensure safety while collecting representative fuel data that reflect vegetation growth and accumulation, the survey was conducted between August and September, thereby avoiding peak fire danger months. The dominant vegetation consists of coniferous forests, primarily Larix gmelinii (Ruprecht, 1854), followed by Betula platyphylla (Sukaczev, 1911), Populus tremula (Linnaeus, 1753), and other species. The understory shrub layer includes Ledum palustre (Linnaeus, 1753), Rhododendron (Linnaeus, 1753), and tall Pinus pumila, among others.

2.2. Sample Survey

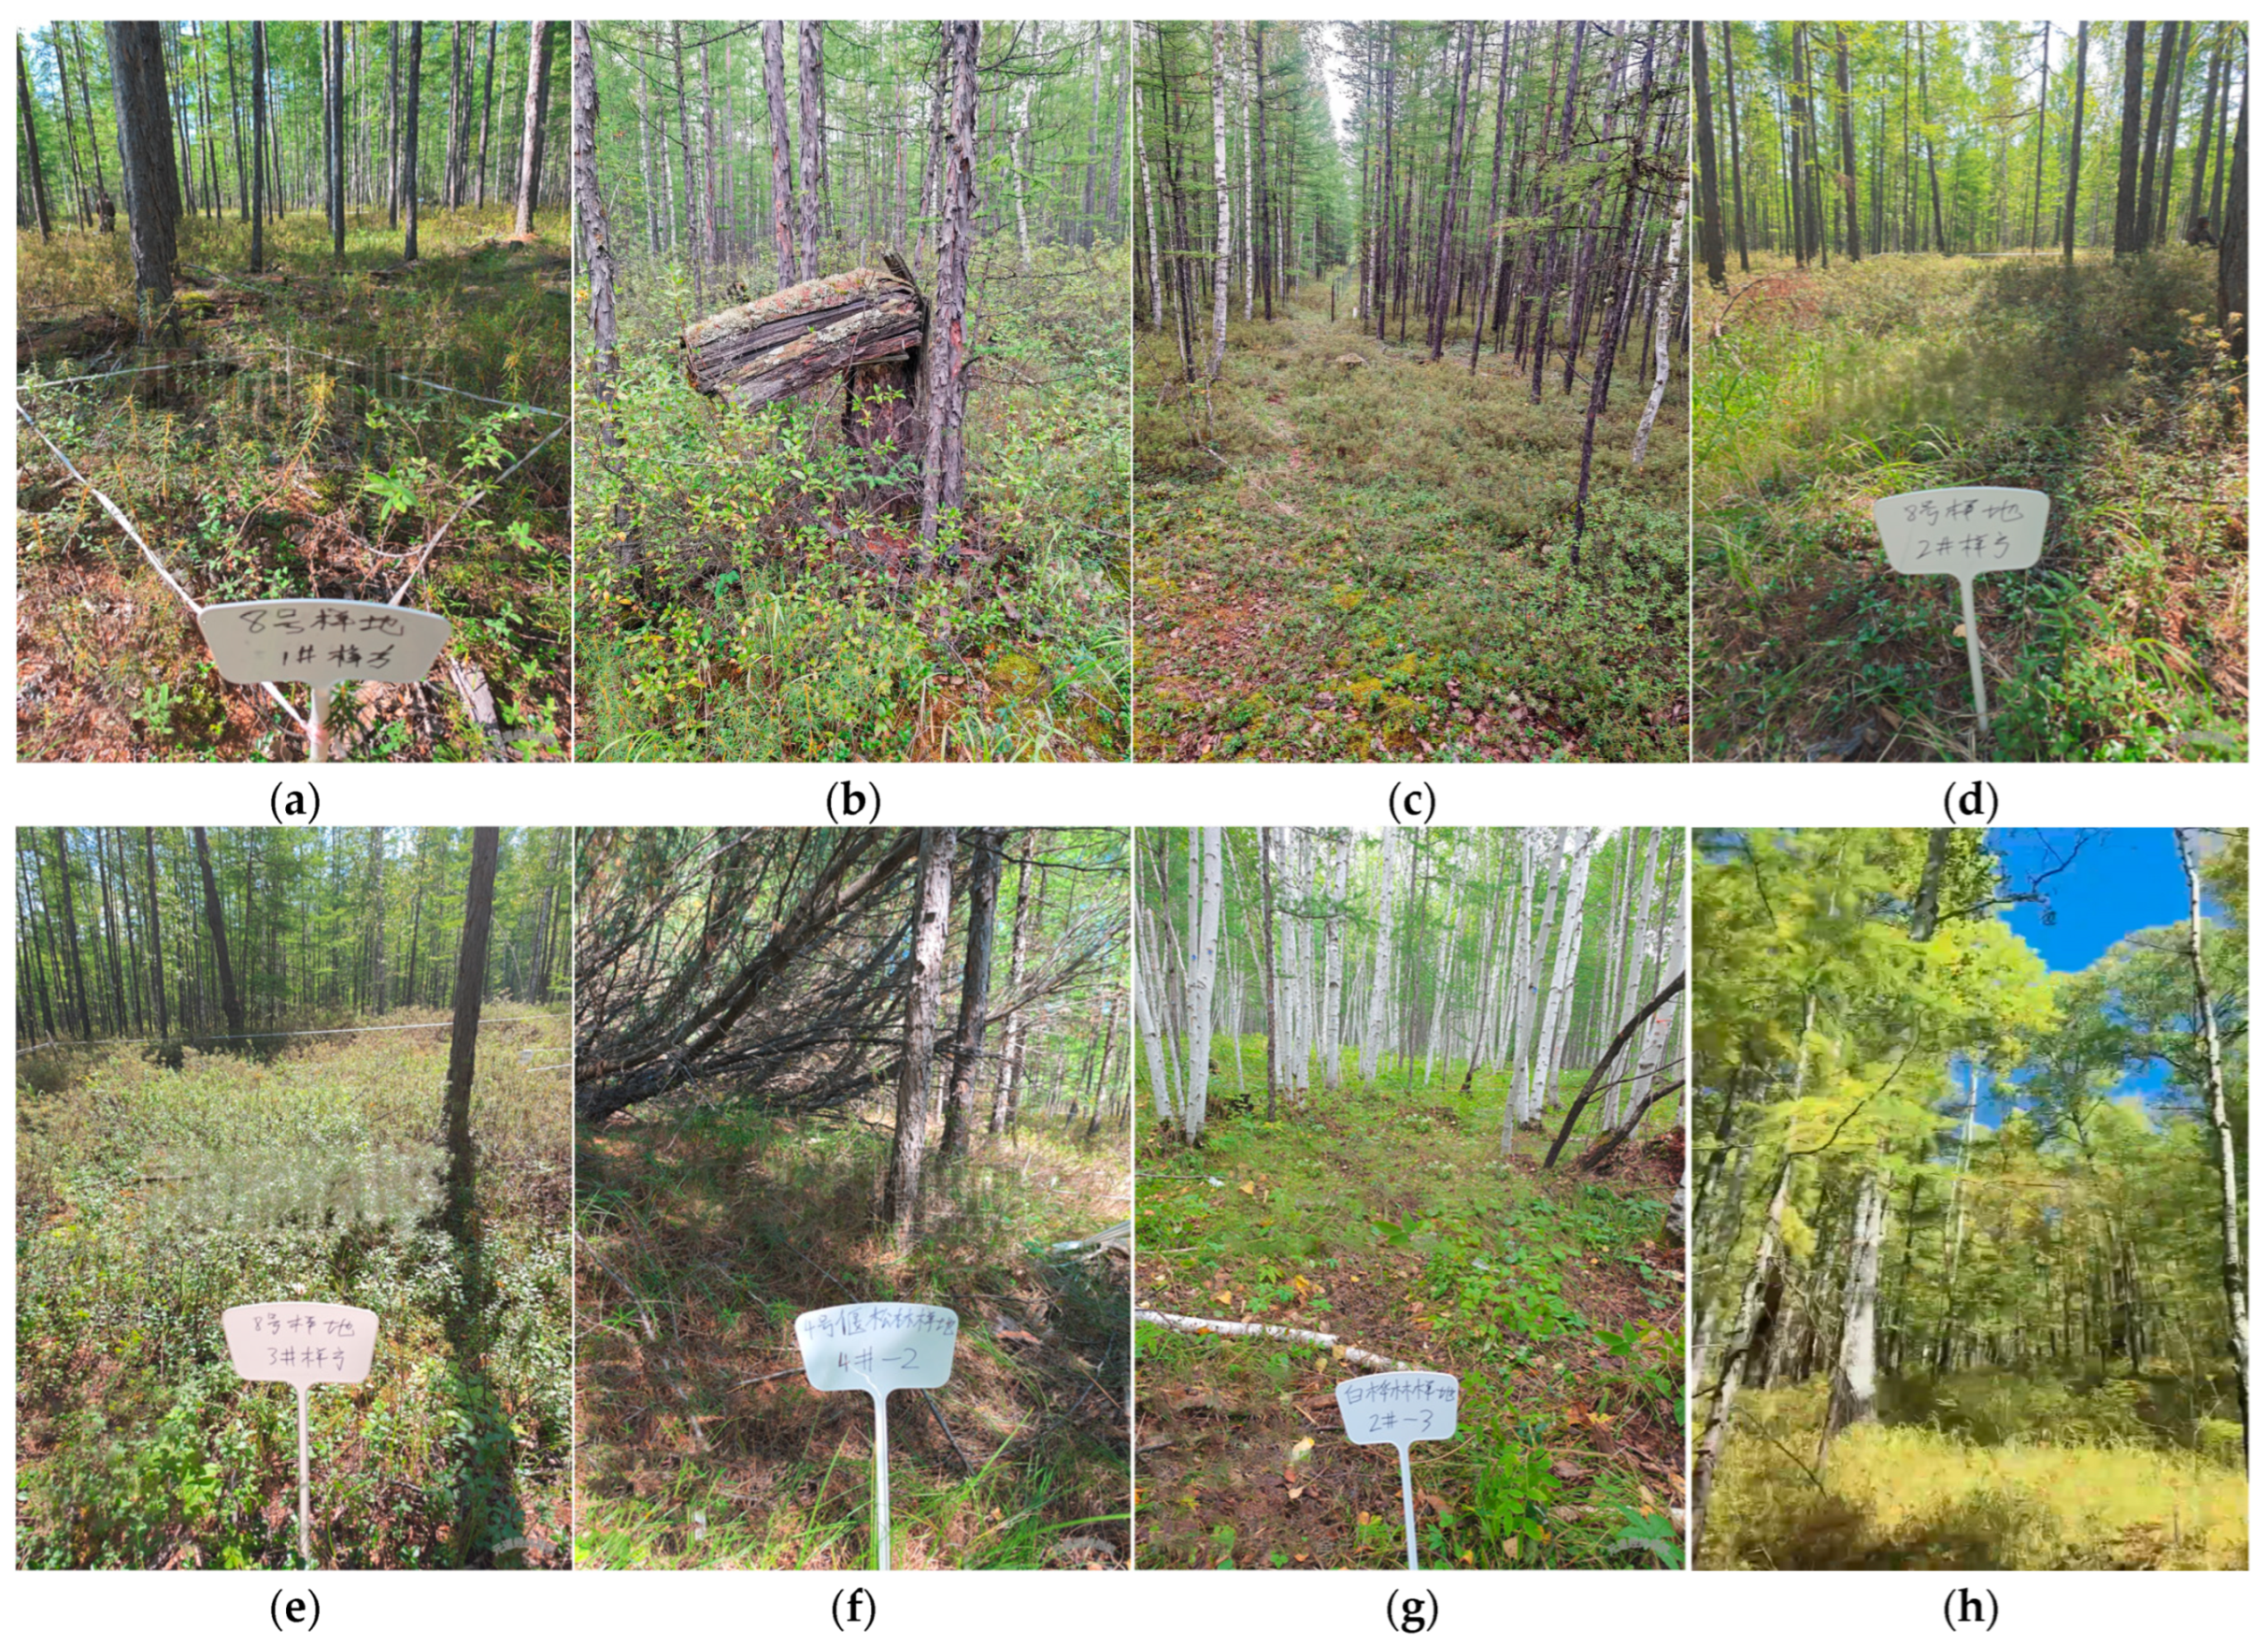
Field surveys were carried out between 20 August and 10 September 2024 at the National Field Scientific Observatory (NFSO) in Genhe. The study encompassed eight forest types: six larch-dominated stands of Larix gmelinii and two non-larch types. The six larch types were classified according to dominant understory vegetation: Ledum palustreL. gmelinii (Lp), RhododendronL. gmelinii (R), Moss (Bryophyta,1831)–L. gmelinii (M), Poaceae (Barnhart, 1895)–L. gmelinii (P), Betula fruticosa (Pallas, 1784)–L. gmelinii (Bf), and Pinus pumilaL. gmelinii (Pp). The two non-larch forest types were defined by the dominant broadleaf species: Betula platyphylla (BpS) and Populus tremula (PtL). All sampled stands were classified as middle- to young-aged forests. A total of 24 standard plots (3 per forest type), each measuring 20 × 20 m, were established in areas with relatively uniform canopy cover. For each plot, crown density, slope, and stand density were recorded to ensure comprehensive characterization (see Figure 1 and Figure 2 for locations and forest-type differences).
In total, 24 standard plots (20 m × 20 m each) were established in areas with uniform canopy cover, following national forest inventory guidelines. Within each standard plot, three circular subplots with a radius of 2.5 m were laid out to assess understory vegetation and surface fuel properties. Healthy, well-developed trees of major species were prioritized for selection after delineating the subplot boundaries. For each subplot, the diameter at breast height (DBH) of all trees was measured at 1.3 m above ground using a diameter tape, and the average DBH was calculated. Based on this value, standard trees representing the mean conditions of each plot were identified and marked to facilitate subsequent measurements and verification. From each of the 24 sample plots, one standard tree was selected, resulting in a total of 24 trees for canopy fuel sampling. Canopy fuels were collected using the standard branch method through destructive sampling, which involved felling the selected trees and dividing them into vertical segments from 0 to 3 m, with sampling conducted at 1 m intervals to represent different canopy layers. Branches were collected from the entire crown, and the total number of branches was recorded. To complement canopy sampling, shrub subplots (2 m × 2 m) were established along the diagonals of each standard plot to assess shrub species composition. Within each shrub subplot, herbaceous quadrats (1 m × 1 m) were placed at the vertices to investigate herbaceous plants, surface dead material, and litter. The litter was further classified into standard time-lag fuel categories of 1 h, 10 h, and 100 h fuels. Comprehensive data regarding survey sample plots and standard tree parameters are provided in Table 1.
The fuel samples collected from the eight forest types were subsequently processed. All samples were placed in a forced-air-drying oven and dried at 105 °C until a constant mass was achieved, ensuring the complete removal of moisture. The fresh and dry masses of each sample were recorded, and these values were used to calculate the relative moisture content (RMC) of the fuels [5] according to Formula (1):
R M C = ( m N m 1 ) ( m D m 2 ) ( m N m 1 ) × 100 %
where RMC represents the relative moisture content (%) of the fuel material, mN represents the total fresh mass of the fuel material and its envelope (kg), mD denotes the total dry mass of the fuel material and its envelope (kg), m1 represents the fresh mass of the envelope (kg), and m2 represents the dry mass of the envelope (kg).
Table 1 describes the different forest types as follows: In this study, eight forest types were classified according to dominant understory composition. Lp is characterized by a Ledum palustre understory in cold, moist habitats; R features dense Rhododendron shrubs; M is dominated by Moss layers; P has a grass-dominated understory; Bf is associated with Betula fruticosa shrubs; and Pp is notable for its dense Pinus pumila layer, which exhibits high vertical fuel continuity. The two non-larch forest types include BpS, birch forests with relatively low fuel loads, and PtL, aspen stands with a sparse understory and limited canopy fuel accumulation.

2.3. Research Methodology

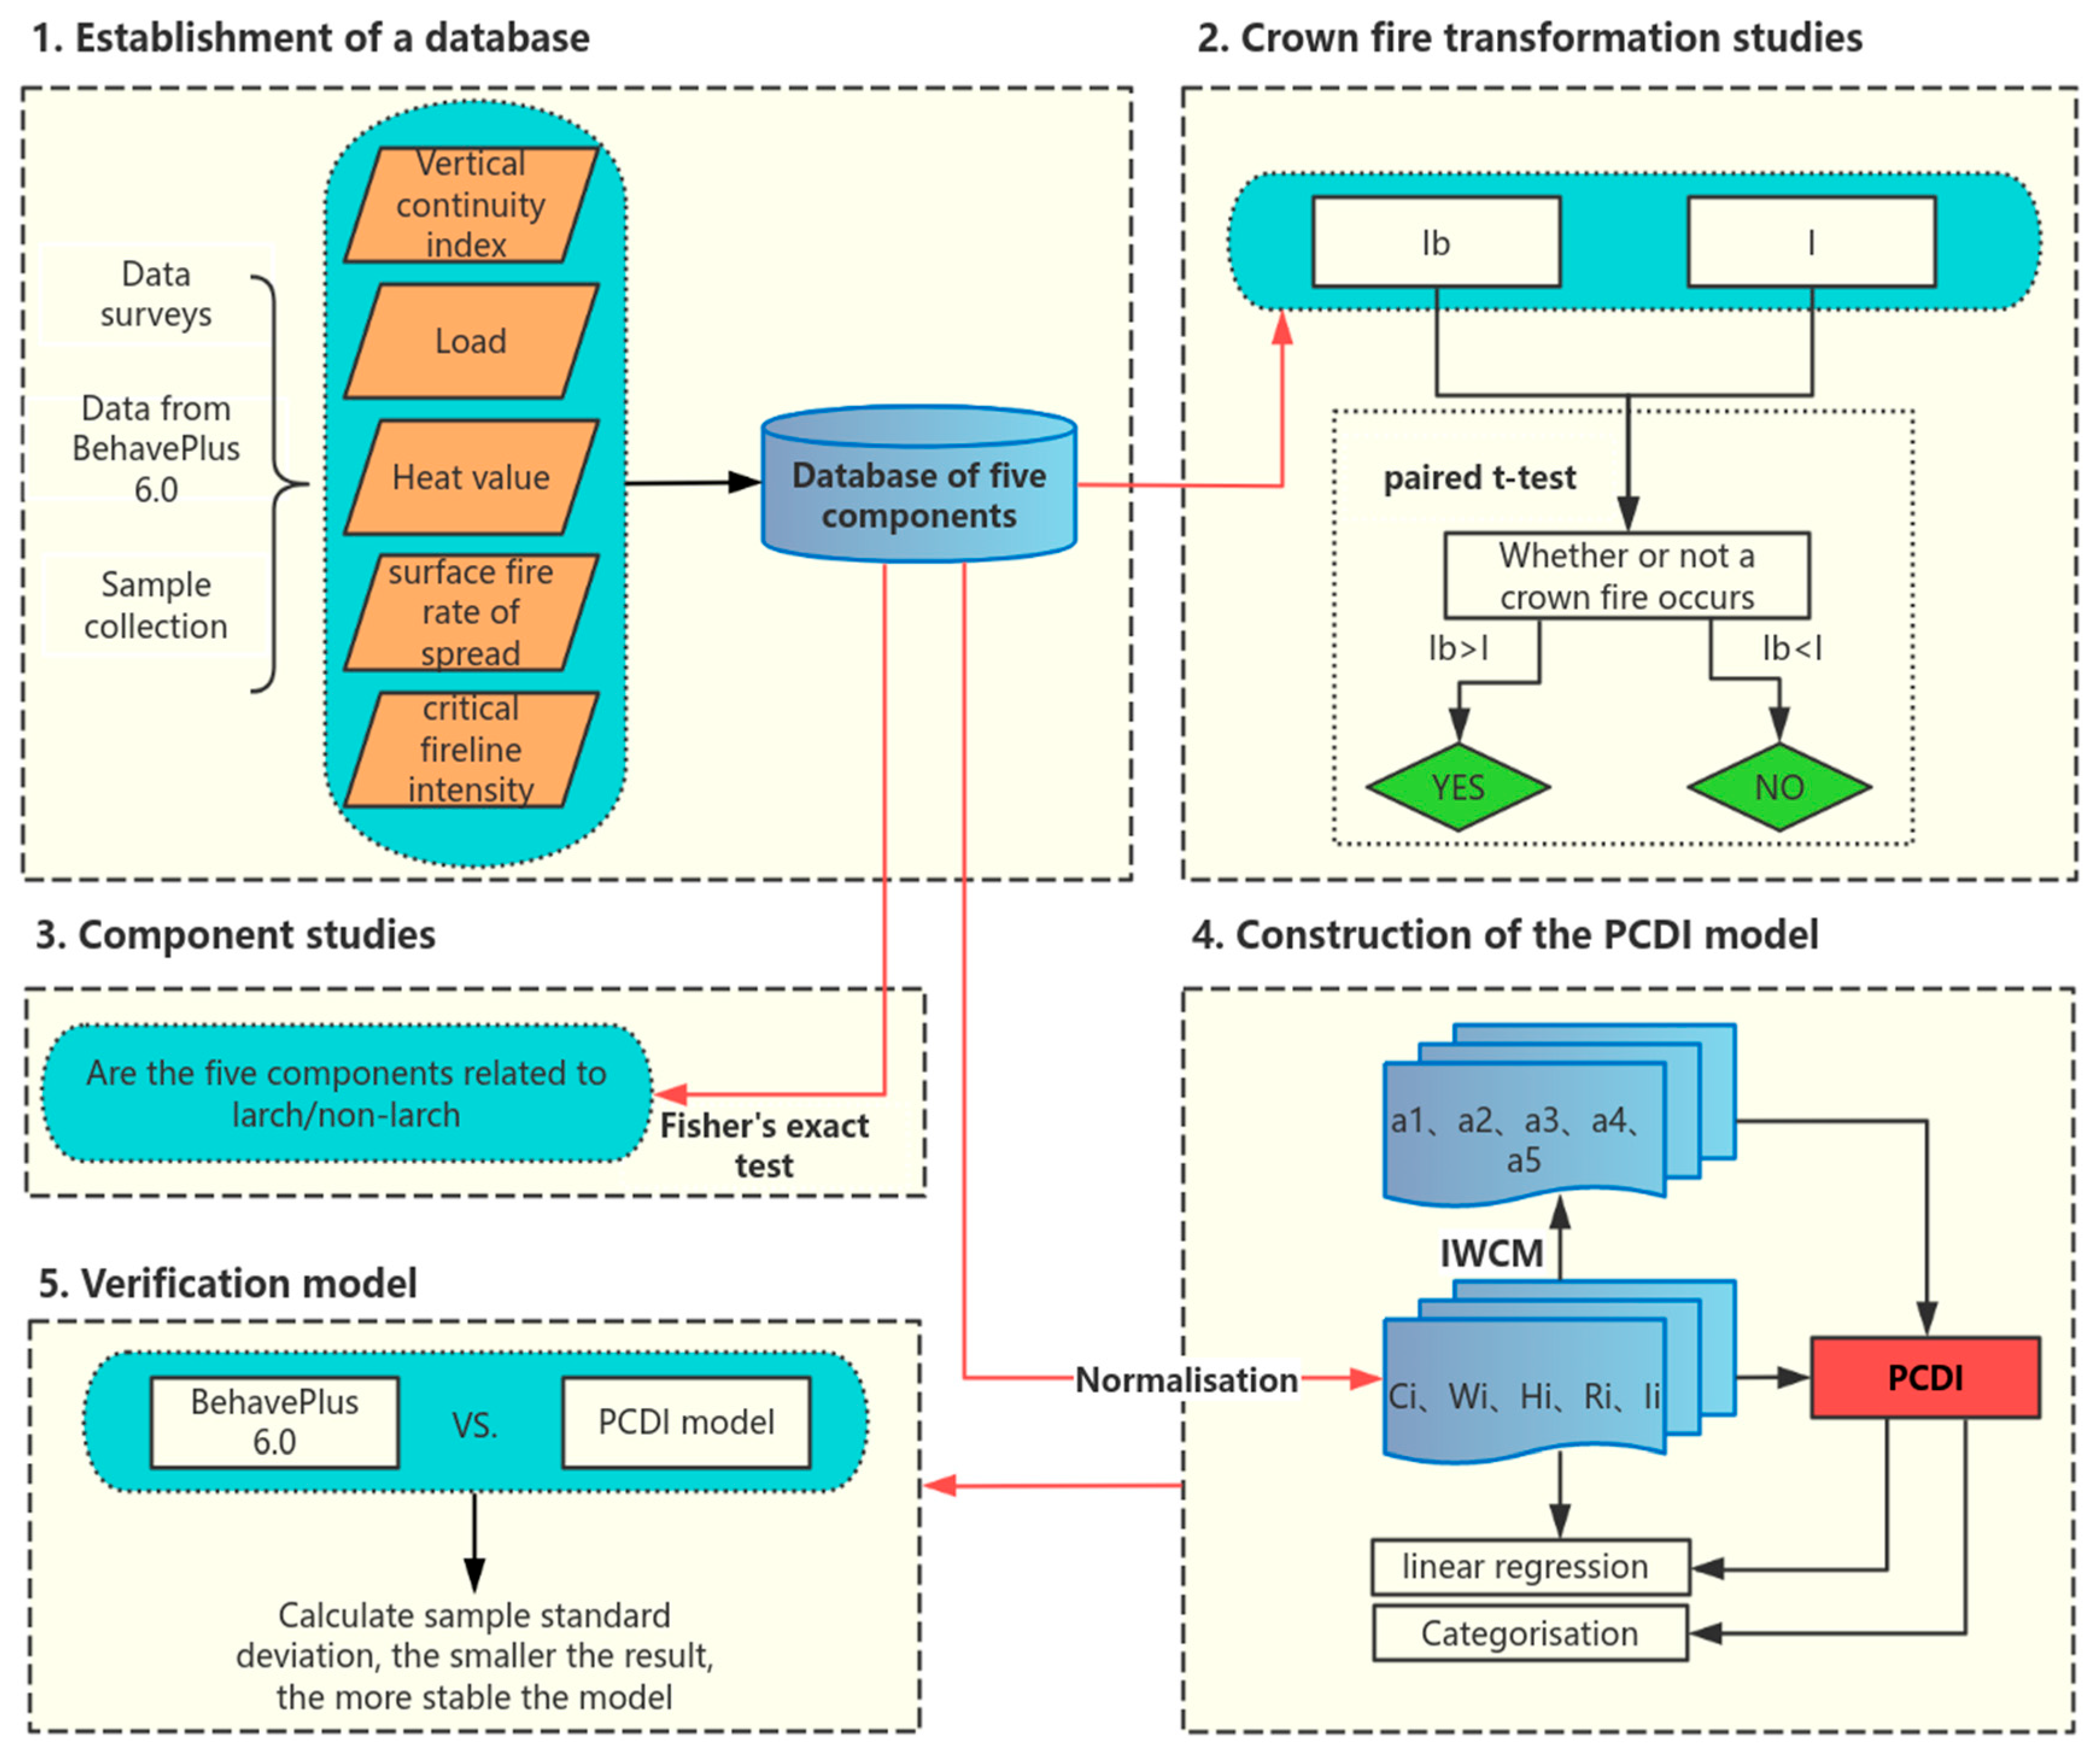
Figure 3 illustrates the overall research process for developing the PCDI. This study systematically integrated multiple critical factors, including fuel vertical continuity, fuel loading, heat value, and fire behavior in both surface and crown fires. These variables were normalized and weighted using the independent weight coefficient method, allowing for the quantitative assessment of crown fire occurrence probability and associated dangers. In addition, rigorous statistical analyses were performed to validate the robustness of the model.

2.3.1. Components

  • Vertical continuity index
The vertical continuity of fuels is primarily governed by height differentials among forest strata. When the height difference is significant, vertical continuity diminishes, resulting in a lower continuity index (C). Conversely, when the height difference is small, the vertical continuity is stronger, yielding a higher C value [41]. This study, conducted in the Da Xing’anling Mountains, aimed to evaluate vertical fuel continuity in stands with varying whole-branch heights. Given that tall shrubs in these mountains exhibit distinct under-branching heights, the study incorporated the continuity index (C) by analyzing tree height (H1), under-branch height (H2), shrub height (H3), shrub base height (H4), herbaceous height (H5), and the thickness of the leaf litter layer (H6). The vertical distribution continuity index was determined using the following Formulas (2)–(4):
C = 1 ( H 2 H 3 ) + ( H 4 H 5 ) H 1
Prerequisite for calculation of Formula (2): H2H3 and H4H5 and H5 > 0.
C = 1 ( H 2 H 3 ) H 1
Prerequisite for calculation of Formula (3): H2 > H3 > H5 > H4 or H2 >H3 > H5 and H4H6.
C = 1 ( H 2 H 5 ) H 1
Prerequisite for calculation of Formula (4): H2 > H5H3 and H5 > 0 or H4 > H2 > H5 > 0.
b.
Fuel Load
Fuel load plays a fundamental role in forest fire behavior, influencing both fire intensity and spread. Fuel accumulation is governed by vegetation type, growth stage, and topographical conditions [42]. The study area consists of densely forested, middle- to young-aged stands with minimal human disturbance. At the time of the survey, autumn had not yet commenced, and foliar senescence was not observed, resulting in relatively high live fuel loads. Moreover, long-term accumulation of withered plant material has led to substantial organic matter buildup, increasing surface fuel availability and intensifying fire danger. The fuel load (W) was calculated using Formula (5):
W = ( W g W 1 ) W S W X W 2
where W represents the load of the fuel sample (kg/m2), Wg denotes the weight of the sample and envelope after drying (kg), WX denotes the weight of the sample and envelope before drying (kg), WS is the wet weight of all fuels per unit area (kg/m2), W1 is the weight of the envelope after drying (kg), and W2 is the weight of the envelope before drying (kg).
c.
Heat Value
The heat value of fuels determines the total thermal energy released during combustion and directly influences fire spread, intensity, and burning duration [43]. To measure the heat values of fuel samples, the calorimetric oxygen bomb method was employed. In this analysis, eight forest fuel types were dried, crushed, and sieved using a 40-mesh sieve. A precise quantity (1 g) of sieved material was weighed using a JA11002 electronic balance and placed in a sealed oxygen bomb, which was then pressurized with oxygen and analyzed using an SJLRY-501T microcomputer-controlled calorimeter (Shanghai Jingke Scientific Instrument Co., Ltd., Shanghai, China), with three measurements per sample. To enhance data reliability, heat values from samples collected at the same location or in the same batch were averaged.
d.
Surface Fire Behavior
The fire spread rate is defined as the velocity at which a forest fire propagates across the fuel surface or through the air, under specified environmental conditions [44]. Key determinants of fire spread rate include wind speed, fuel bed thickness, and fuel load. Due to relatively stable wind conditions during the study, an annual average wind speed of 0.8 m/s, recorded in Genhe City, was adopted for the calculations. The surface fire spread rate (R0) was determined using the Rothermel Formula (Formula (6)) [45].
R 0 = I R ζ ρ b ε Q i g
where R0 is the surface fire spread rate (m/s), IR is the flame zone reaction intensity (W/m2), ζ is the ratio of propagation flux to reaction intensity (dimensionless), ρb is the drying bulk density (kg/m3), ε is the effective heat coefficient (dimensionless), and Qig is the heat of ignition (kJ/kg). Some other factors needed in the calculation process are the following: surface area to volume ratio (taken from the average value of the BehavePlus 6.0 (USDA Forest Service, Rocky Mountain Research Station, Missoula, MT, USA) surface fire-type parameter table), fuel layer depth (using the average value of surface dead leaf layer thickness), moisture content (fuel moisture content was significantly increased due to rain, using the average relative moisture content of each forest type divided by 1.5), dead fuel moisture of extinction (using the average 40 per cent), drying particle density (taken as 512.59 kg/m3), effective mineral content (taken as 0.01), total mineral content (taken as 0.0555), and low heat (taken as 18,608 kJ/kg) [45].
Since direct experimental measurements of fire spread velocity were not conducted, wind speed at mid-flame height could not be determined. Instead, Wang Zhengfei correction (Formula (7)) was applied to account for wind and slope effects [46]:
R = R 0 K W cos θ
where R is the corrected surface fire spread rate (m/s), KW is the wind speed correction factor (taken as 1.2), and θ is the average slope of the ground for each forest type.
To evaluate surface fireline intensity, Byram’s Formula (Formula (8)) was applied [47]:
I b = W H R
where Ib is the surface fireline intensity (kJ/m/s), W is the effective fuel load (kg/m2), and H is the heat value of fuels (kJ/kg).
e.
Crown Fire Behavior
The critical fireline intensity required for crown fire initiation is governed by crown base height and foliage moisture content. A crown fire occurs when the surface fireline intensity exceeds this threshold. This relationship is shown in the Van Wagner Formula (Formula (9)) [10]:
I = [ 0.010 C B H ( 460 + 25.9 M ) ] 3 2
where I is the critical fireline intensity (kJ/m/s) for a crown fire to occur, 0.010 is an empirical constant for a complex dimension, M is the foliage moisture (assumed to be 100%), and CBH is the crown base height (measured as first live branch height, m). That is, a canopy fire occurs when IbI and does not occur when the reverse obtains.

2.3.2. PCDI Model

The PCDI serves as a critical metric for assessing both the probability and severity of forest crown fire occurrences. This index provides a quantitative framework to evaluate fire danger by integrating five key components: C, W, H, R, and I. These variables were normalized consistently across all 24 sample plots using the same procedure, ensuring comparability among indices. The weight values (a1a5) for the five components were determined using the Independence Weight Coefficient Method (IWCM), enabling an objective evaluation of their relative contributions to crown fire danger. Based on this methodology, the PCDI model was constructed as Formula (10):
P C D I = a 1 C i + a 2 W i + a 3 H i + a 4 R i + a 5 I i
where i represents the sample plot number, ranging from 1 to 24. Ci, Wi, Hi, Ri, and Ii, are the normalized values of their respective variables. The PCDI ranges from 0 to 1, where values approaching 1 indicate a higher probability of crown fire occurrence, with an associated increase in potential fire hazard, whereas values closer to 0 suggest lower fire danger and reduced fire severity.

2.3.3. Validation Model

BehavePlus 6.0 applies a set of coupled, empirically based fire behavior Formulas—principally the Rothermel surface fire spread model, Byram’s fireline intensity, and Van Wagner’s crown fire initiation thresholds—to compute rate of spread, intensity, flame length, and crown fire transition from user-specified inputs of fuels, moisture, wind, and slope. Based on the PCDI values and crown fire transition ratios calculated with BehavePlus 6.0 (input data summarized in Table 2 and Table 3) and considering the sample standard deviations, the performance of the PCDI model was evaluated. The simulation setup was as follows: (1) fuel parameters were entered using custom fuel modeling; (2) the surface area-to-volume ratio (SA/V) followed the preset model TU3, representing moderate load conditions in humid timber–grass–shrub fuel environments, corresponding to fuel model type D; (3) surface fuel loads were set to the average values obtained from field surveys for each forest type; (4) fuel bed depth was set to the mean thickness of the decomposition layer; (5) dead fuel moisture of extinction was fixed at 40%; (6) surface fuel heat content was set to the average measured value for each forest type; (7) canopy base height was defined as the height of the first branch; (8) foliar moisture content was assumed to be 100%; (9) wind speed was set to the local mean annual value of 0.8 m/s in Genhe; (10) the wind adjustment factor was set to 0.4, based on TU3; (11) slope steepness was represented by the mean slope measured for each forest type; and (12) moisture conditions were modeled under Low, Mid, and High scenarios.

2.3.4. Statistical Analysis

A comprehensive statistical analysis was conducted using data from the 24 sample plots to evaluate the five key components influencing crown fire danger. One-sample t-tests were performed to analyze the index, fuel load, and heat value, with hypothesized values set at 1, 0, and 19,000, respectively. Since both the index and PCDI deviated from a Gaussian distribution, Spearman’s rank correlation matrix was constructed to examine their relationships with relevant factors. To assess fuel load variations across different forest types and vertical strata, bar charts were generated, depicting fuel distribution from the ground surface to the canopy. Heat maps were utilized to visualize the spatial and compositional variations in heat values among different forest and fuel types. The ROS was statistically represented based on empirical calculations, while the parameters Ib and I were evaluated via paired t-tests to compare correlations and determine the potential for crown fire occurrence in eight forest types. Due to the total sample number being fewer than 40, Fisher’s exact test was applied to explore the statistical association between the five fire danger components and the distinction between larch-dominated and non-larch forests. Following the development of the PCDI model, a linear regression analysis was conducted to assess the relationships between PCDI and the five contributing factors, allowing for a clearer understanding of their relative influence on crown fire danger. To facilitate classification and interpretation, a bubble diagram was constructed, summarizing and categorizing forest types based on PCDI values. The classification criteria used for evaluating crown fire danger levels are outlined in Table 4. All statistical analyses and visualizations were performed using GraphPad Prism version 10.1.2 (GraphPad Software, LLC, San Diego, CA, USA).

3. Results

3.1. Component Results

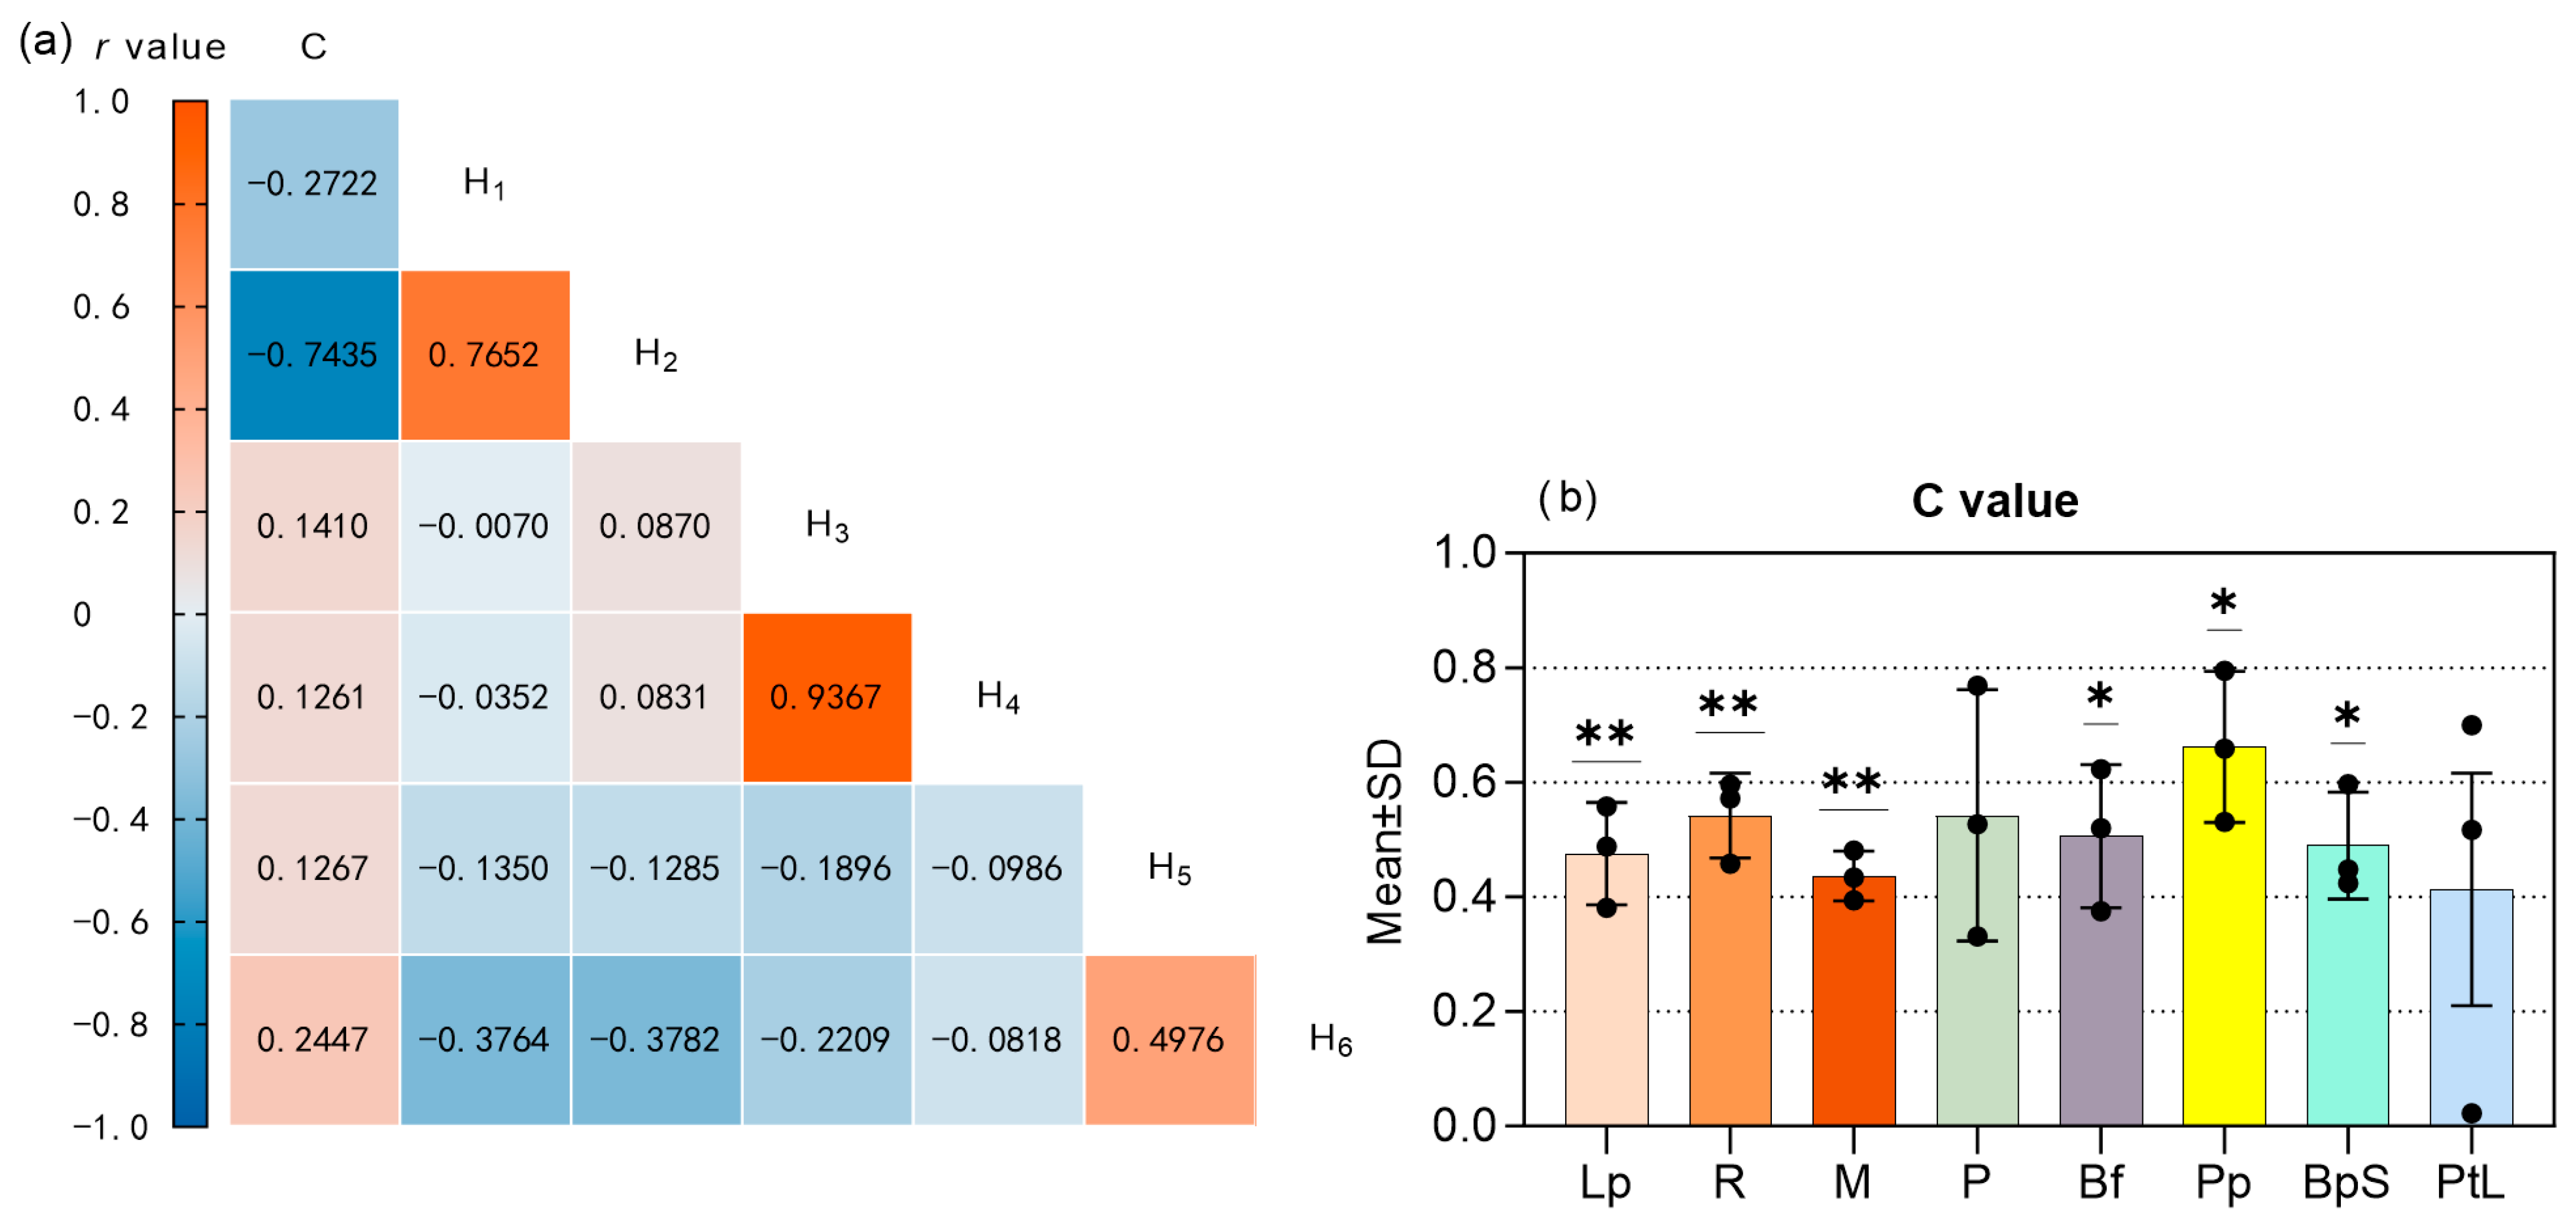
Figure 4 presents the analysis of vertical continuity. Figure 4a shows the correlation matrix for the continuity index (C) and structural variables (H1H6), where color intensity indicates the strength and direction of the correlation. A strong negative correlation was observed between C and H2 (r = –0.7435), indicating that greater first-branch height reduces vertical fuel continuity. In contrast, H2 and H1 were positively correlated (r = 0.7652), while H3 and H4 exhibited an almost linear relationship (r = 0.9367). H5 and H6 displayed a moderate positive correlation (r = 0.4976). Figure 4b shows the distribution of C values across forest types (means ± SDs). Lp, R, and M exhibited stable C values between 0.4 and 0.6 with highly significant differences (p < 0.01), while Bf, Pp, and BpS showed significance at p < 0.05. P and PtL displayed wide variability (0.0–0.8) without significant differences. These results underscore both the structural drivers (Figure 4a) and forest-type-specific variation (Figure 4b) in vertical fuel continuity.
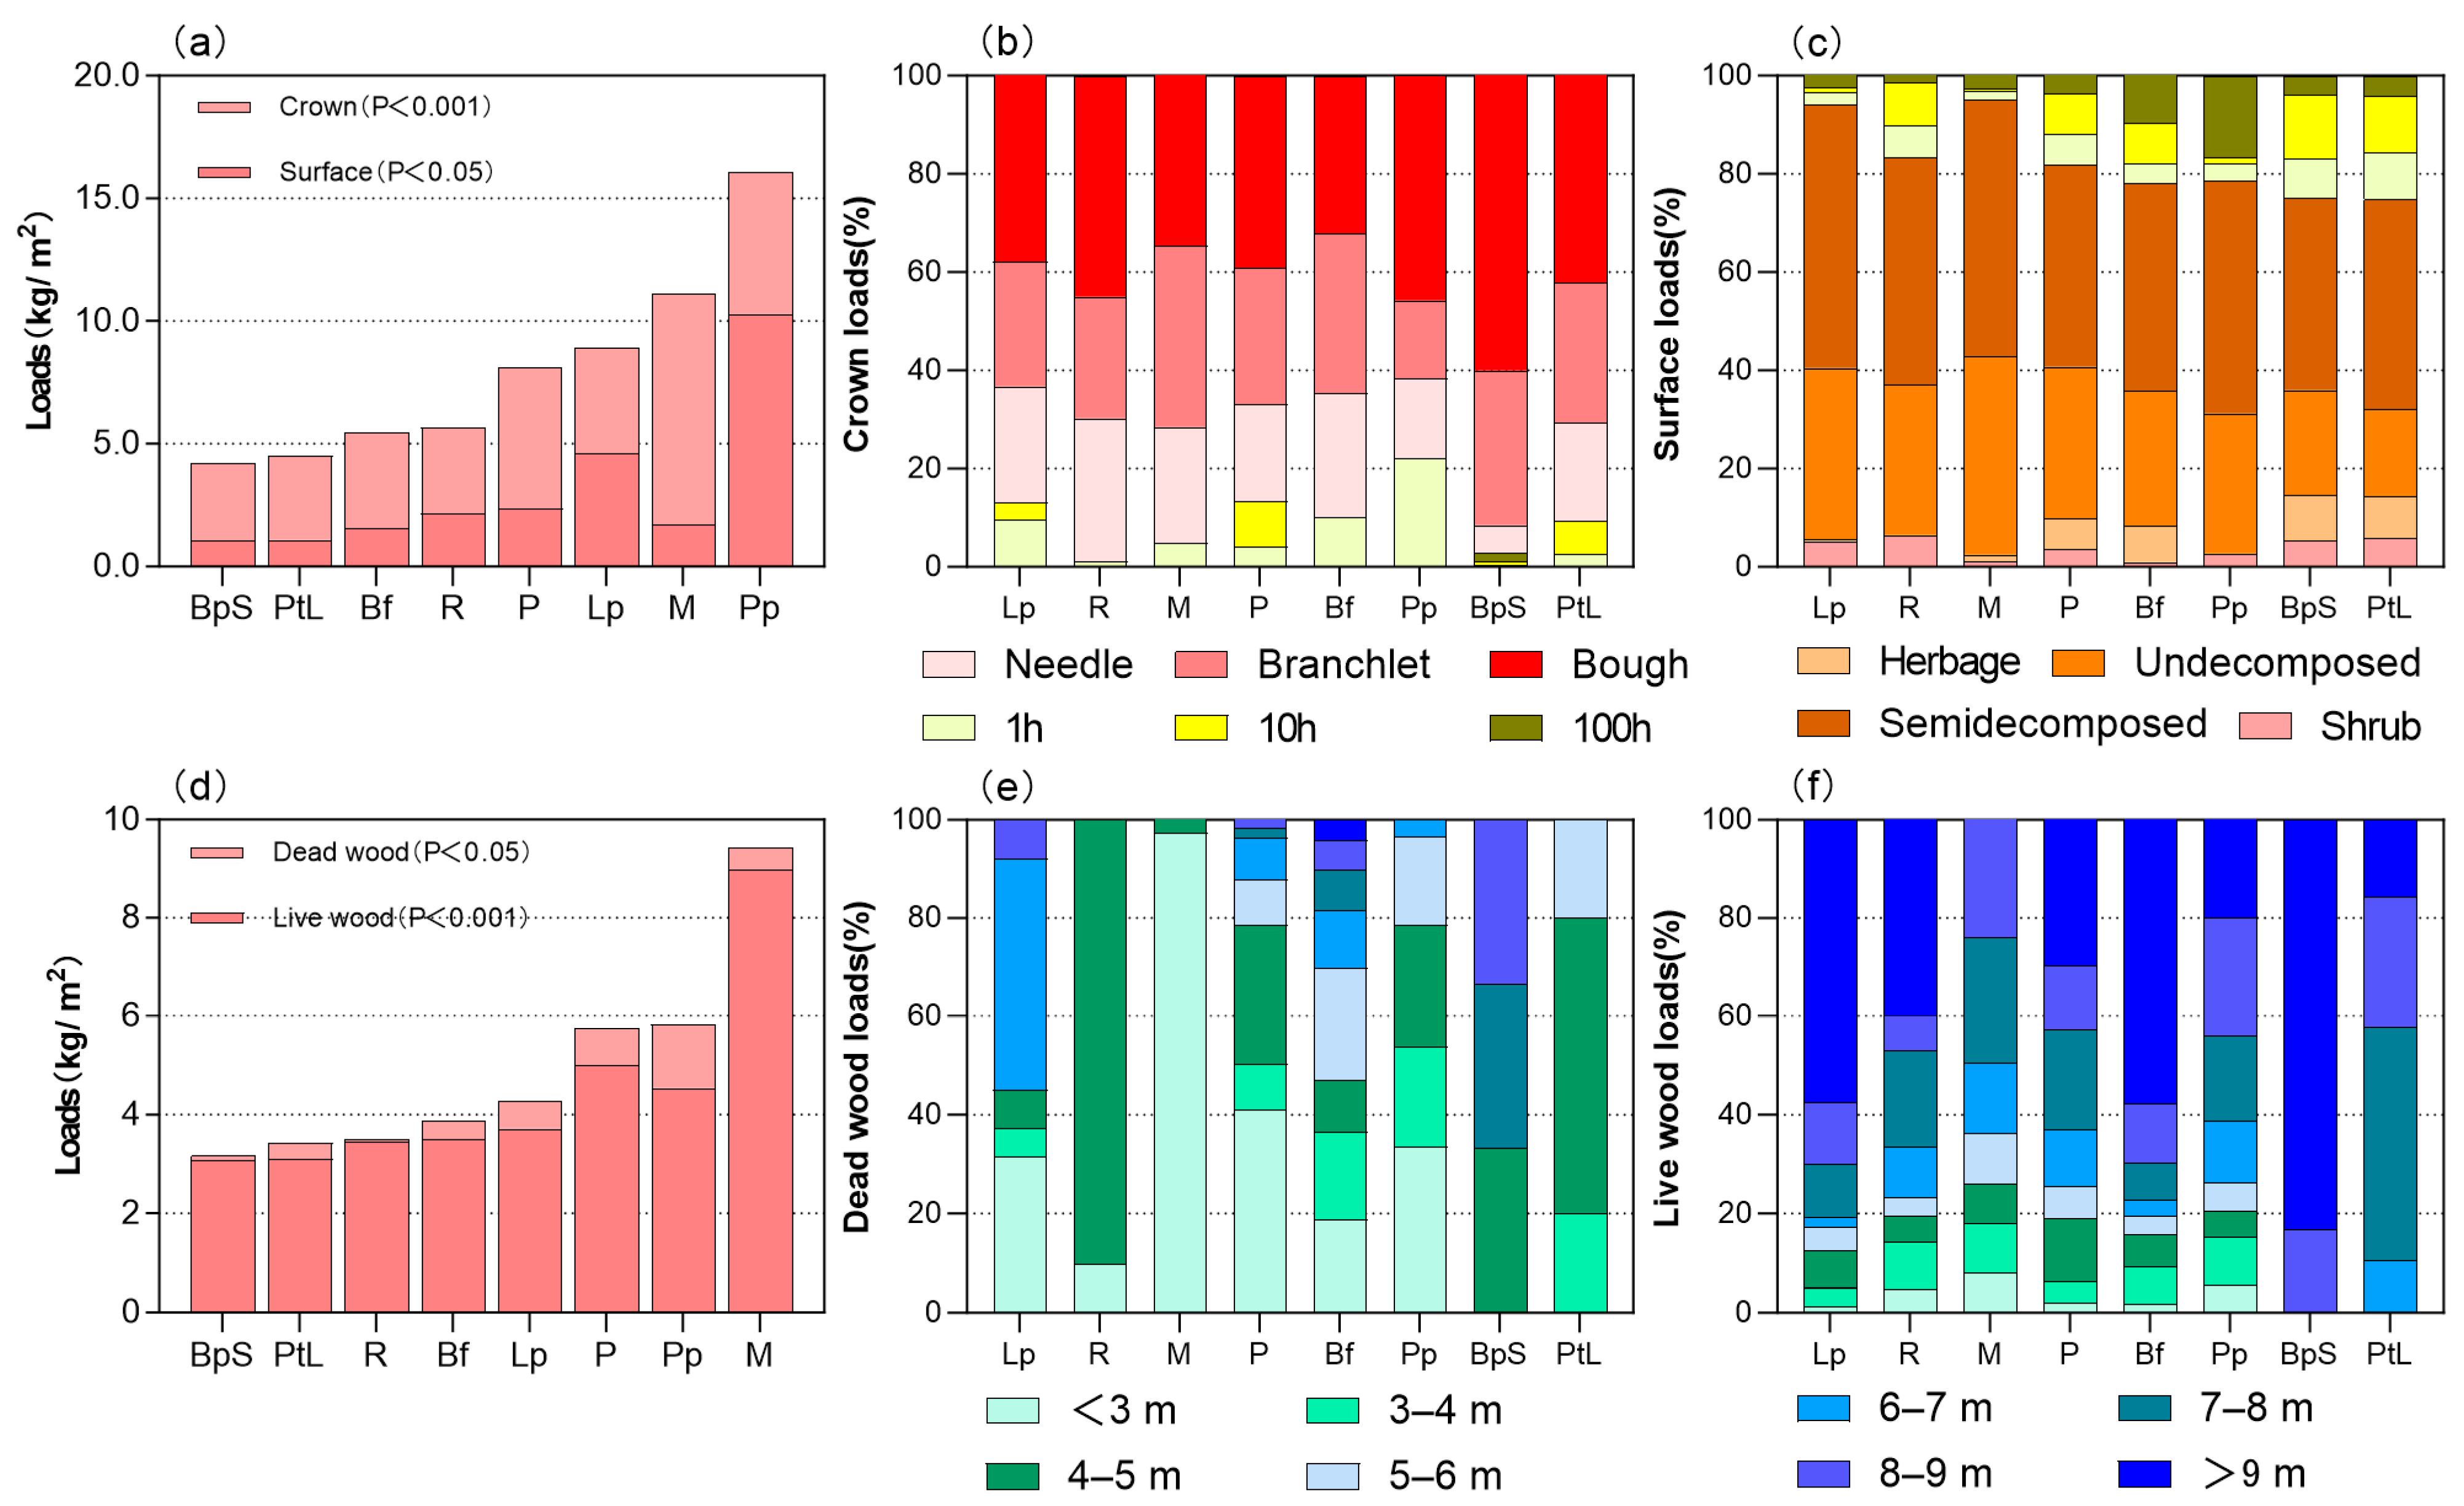
Analysis of fuel load distribution indicated that Pp and M exhibited the highest loading, while BpS and PtL exhibited the lowest. The statistical significance of crown loading (p < 0.001) was greater than that of surface loading (p < 0.05), suggesting that crown structure plays a more significant role in fuel accumulation than surface structure. Across different stand types, needles, branchlets, and boughs were the dominant components of crown fuel, contributing 78%–99% of the total crown load. For surface fuels, undecomposed and semi-decomposed materials were the primary constituents, accounting for 60%–92% of the total surface load. These findings indicate that crown and surface fuel contributions are closely linked to vegetation growth stage and decomposition rate. Among all components, M recorded the highest live wood loading, whereas BpS and PtL exhibited the lowest. Additionally, the significance of live wood loads (p < 0.001) exceeded that of dead wood loads (p < 0.05), implying that live wood has a greater impact on crown loading. Further analysis of vertical fuel distribution showed that dead wood was primarily concentrated below 5 m, accounting for 45%–100% of total dead wood, whereas live wood was predominantly found above 6 m, ranging from 64% to 100% of total crown load. A high degree of mixing between dead and live wood was observed in the 5–6 m range, as shown in Figure 5a–f.
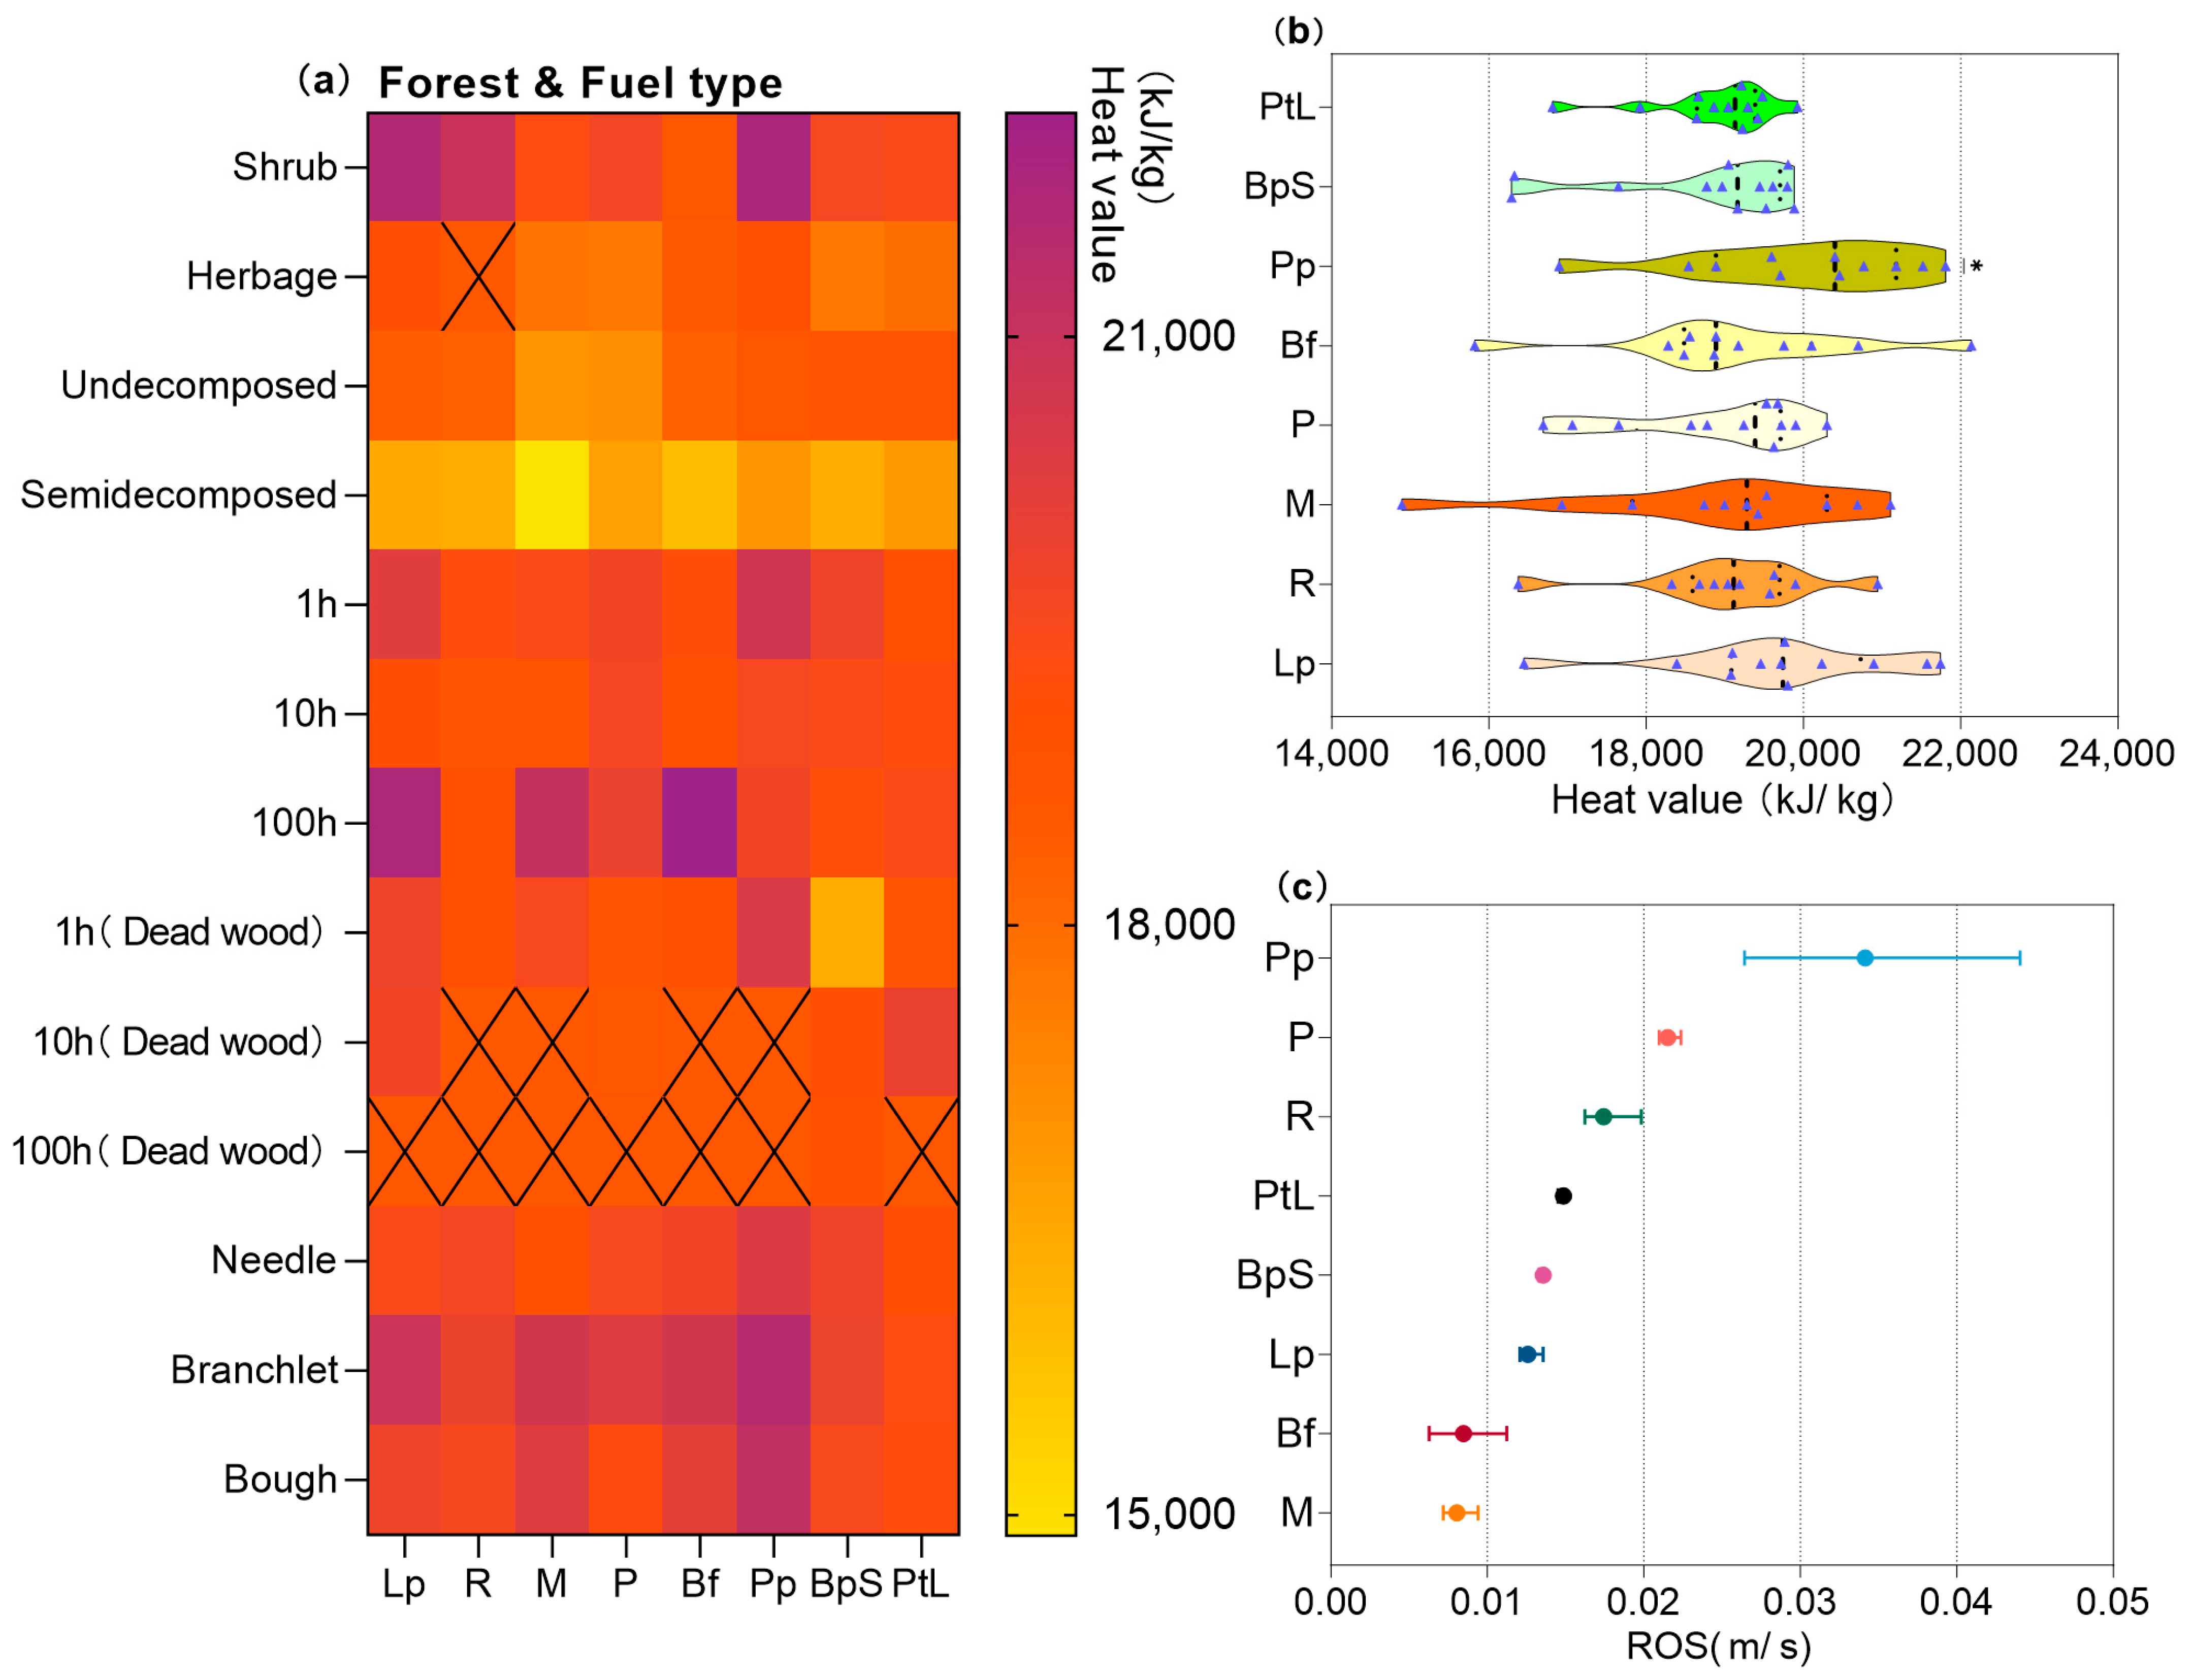
The analysis of heat values across different fuel types indicated that herbaceous, undecomposed, and semi-decomposed fuels exhibited lower heat values, typically below 19,000 kJ/kg for herbaceous and undecomposed fuels and around or below 17,000 kJ/kg for semi-decomposed fuels. In contrast, needles, branchlets, and boughs within the crown displayed higher heat values, generally ranging from 18,000 to 20,000 kJ/kg. Notably, fuels with heat values exceeding 19,000 kJ/kg were present across all forest types, suggesting the potential to intensify fire propagation under favorable conditions. A comparative analysis of forest types showed that, apart from Pp (p < 0.05), heat values did not significantly deviate from 19,000 kJ/kg, with most values concentrated between 18,000 and 20,000 kJ/kg. This suggests that heat values in Pp are more variable and uncertain (Figure 6a,b).
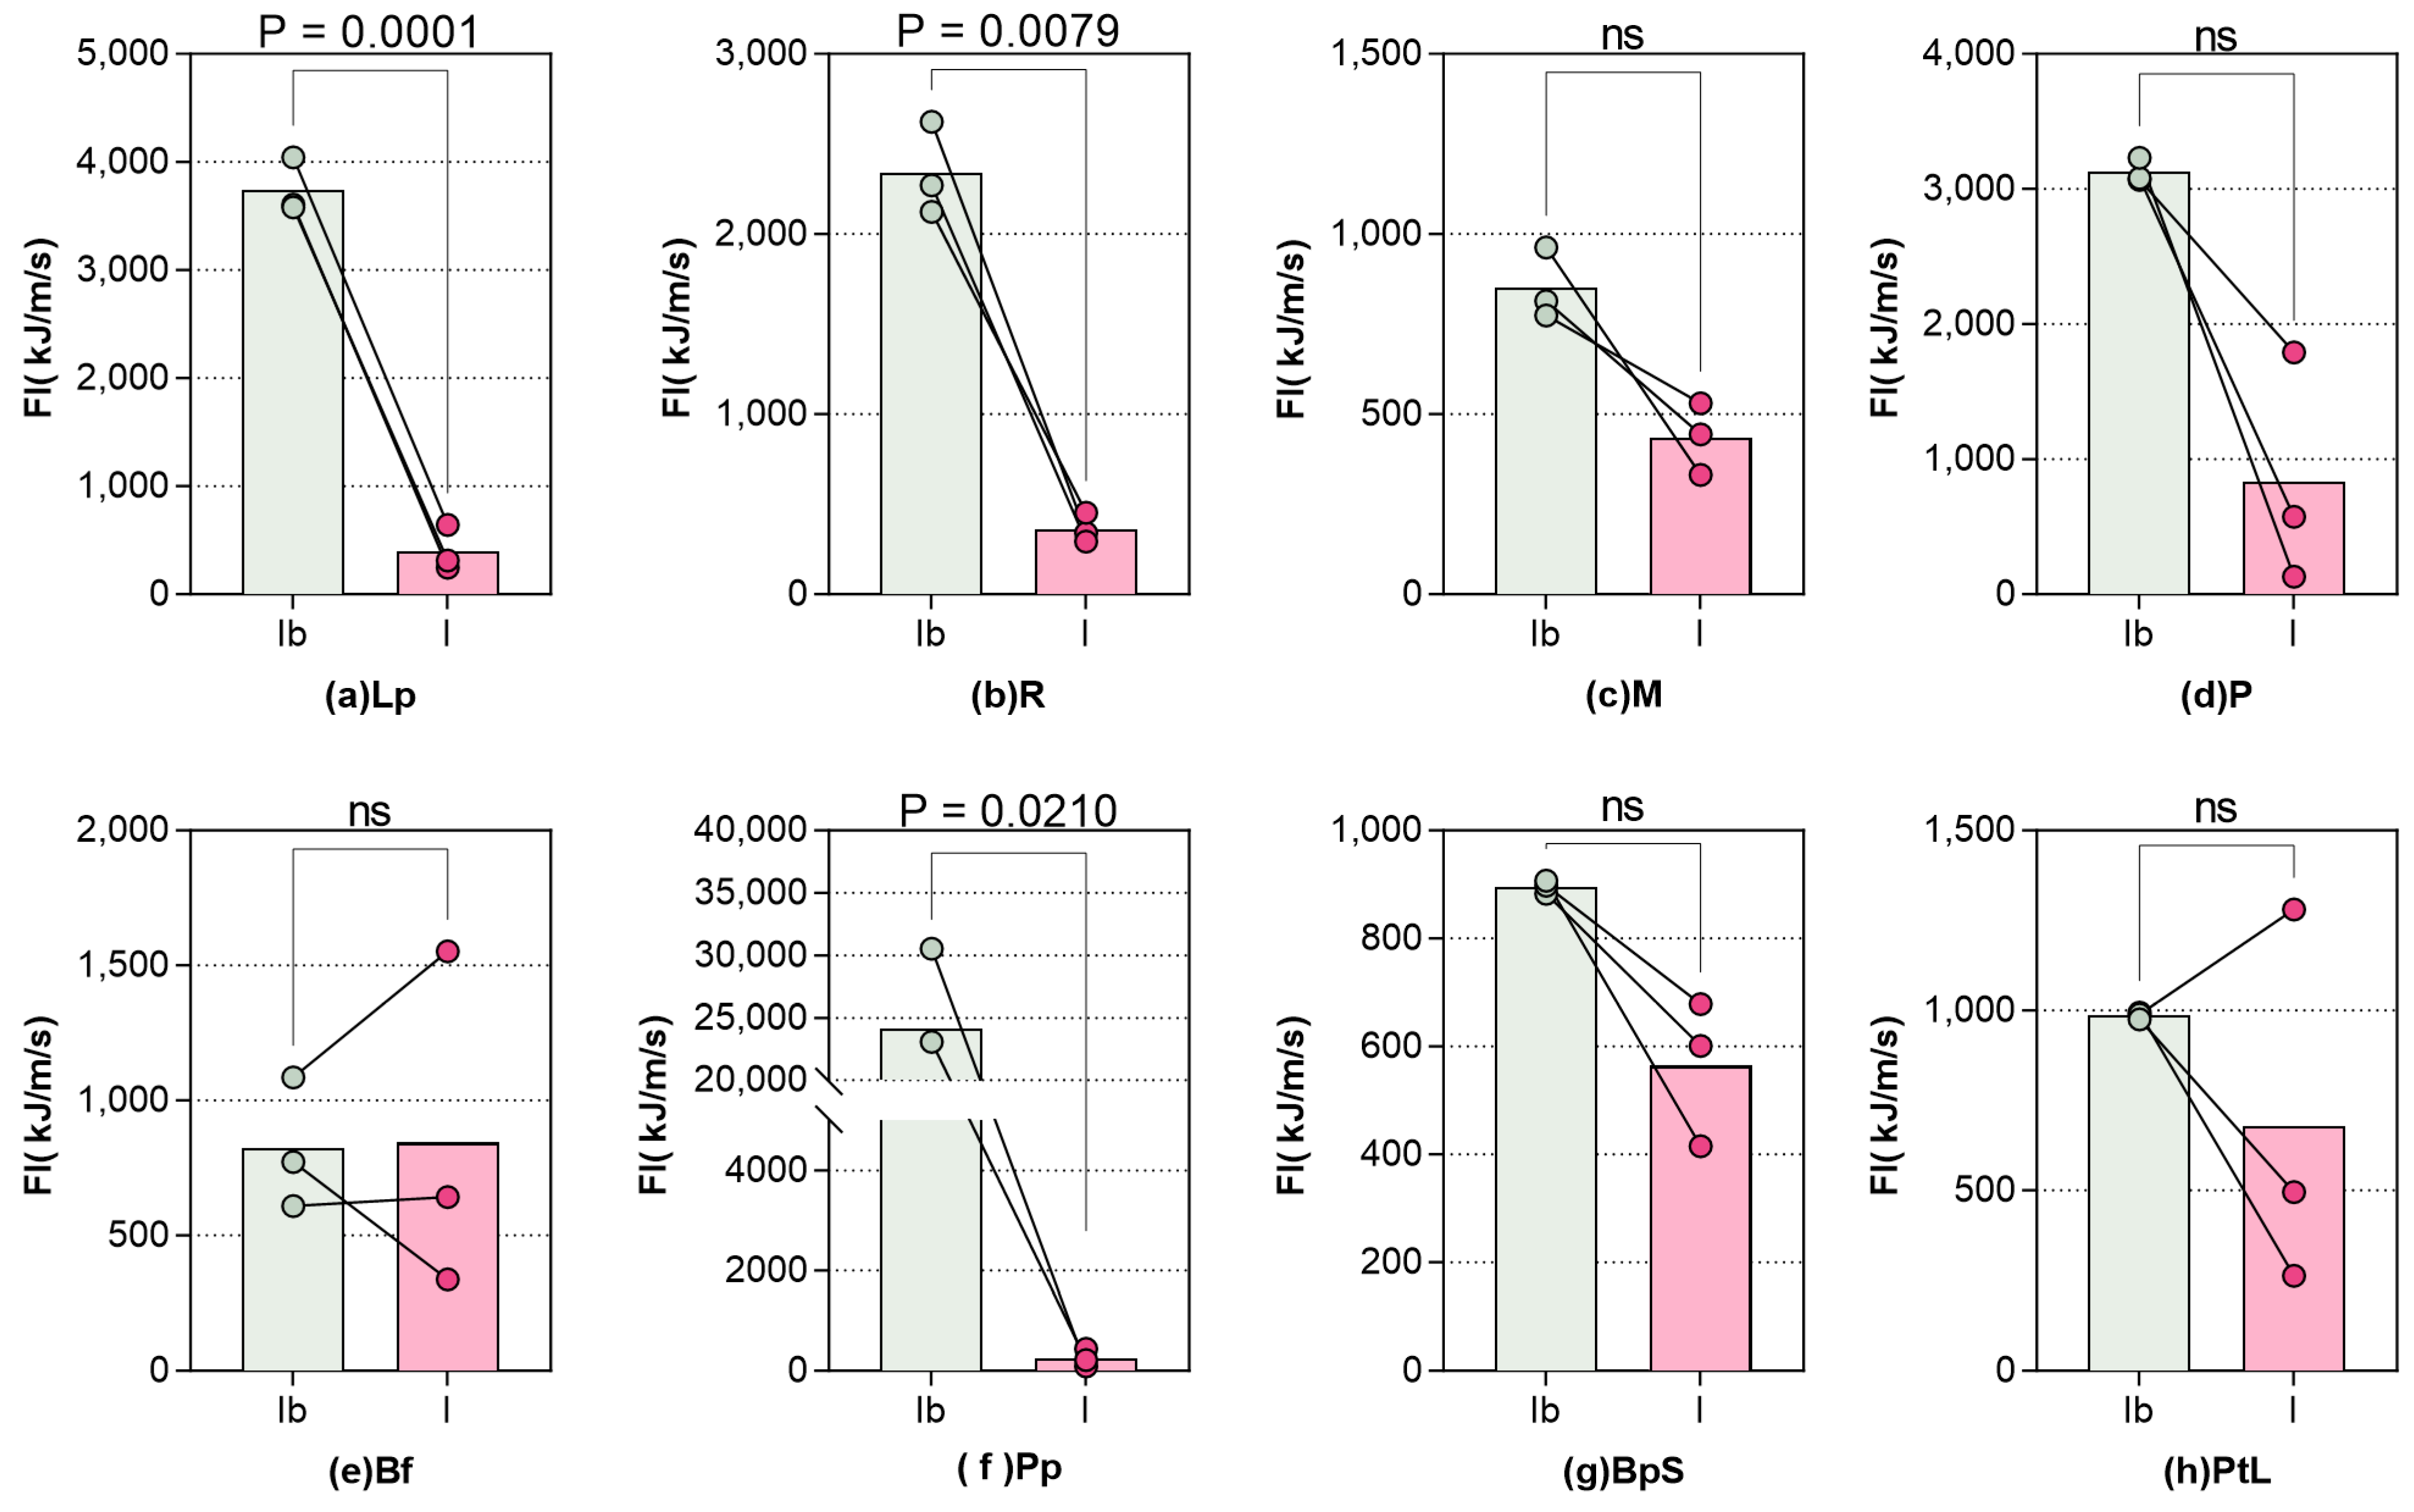
Regarding ROS, Pp exhibited greater variability, with spread rates ranging from 0.02 to 0.05 m/s, categorizing it within the middle-to-high speed class. In contrast, all other forest types maintained spread rates below 0.03 m/s, indicating greater stability and classification within the low-speed category (Figure 6c). This suggests that Pp is more prone to fire variability, whereas the other forest types exhibit more predictable spread rates. Among the eight forest types, Ib consistently exceeded I in all types except Bf and PtL, with statistically significant differences observed in Lp (p = 0.0001), R (p < 0.01), and Pp (p < 0.05). This implies that, while crown fire occurrence remains uncertain in Bf and PtL, all other forest types demonstrate consistent crown fire potential. Histogram comparisons suggest that the probability of crown fire occurrence follows the order: Pp > Lp > R > P > M > BpS > PtL > Bf (Figure 7). Furthermore, Fisher’s exact test showed that, when applying threshold values of 0.7, 5.0 kg/m2, 19,000 kJ/kg, 0.025 m/s, and 800 kJ/m/s to the five components, only fuel loading exhibited a statistically significant difference (p < 0.05) between larch and non-larch forests (Figure 8).

3.2. PCDI

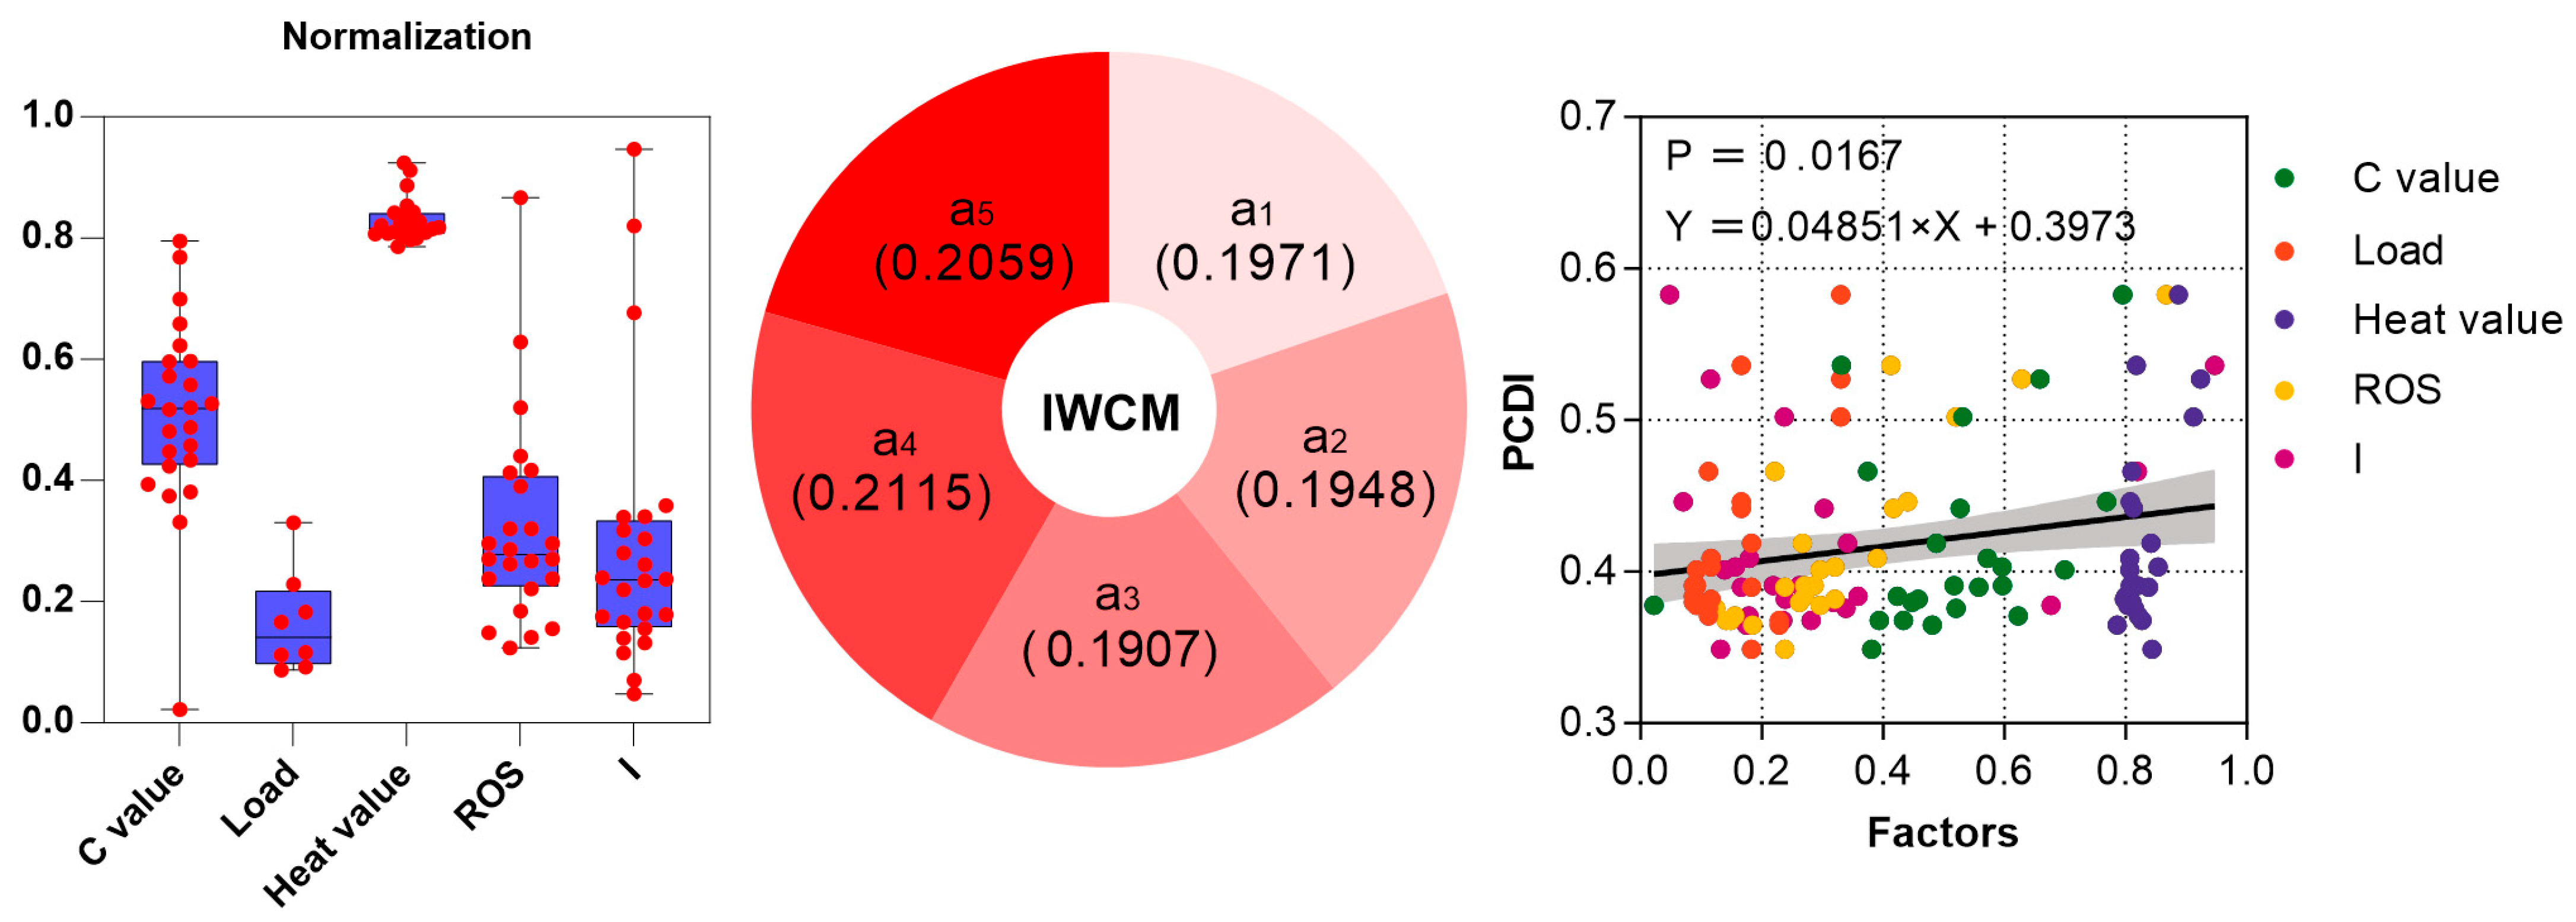
The normalized concentration distributions of the five components were as follows: index C ranged from 0.4 to 0.6 (mean = 0.519), loading varied from 0.1 to 0.2 (mean = 0.141), heat values spanned 0.8 to 0.85 (mean = 0.817), ROS ranged from 0.2 to 0.4 (mean = 0.279), and index I extended from 0.1 to 0.3 (mean = 0.238). Notably, heat values and fuel loading exhibited limited variability, whereas ROS and I displayed wider dispersion, indicating significant inter-sample differences. Pronounced outliers in C, ROS, and I suggested sample-specific anomalies, as depicted in Figure 9. Using the normalized data, the PCDI model was formulated as Formula (11):
P C D I = 0.1971 C i + 0.1948 W i + 0.1907 H i + 0.2115 R i + 0.2059 I i
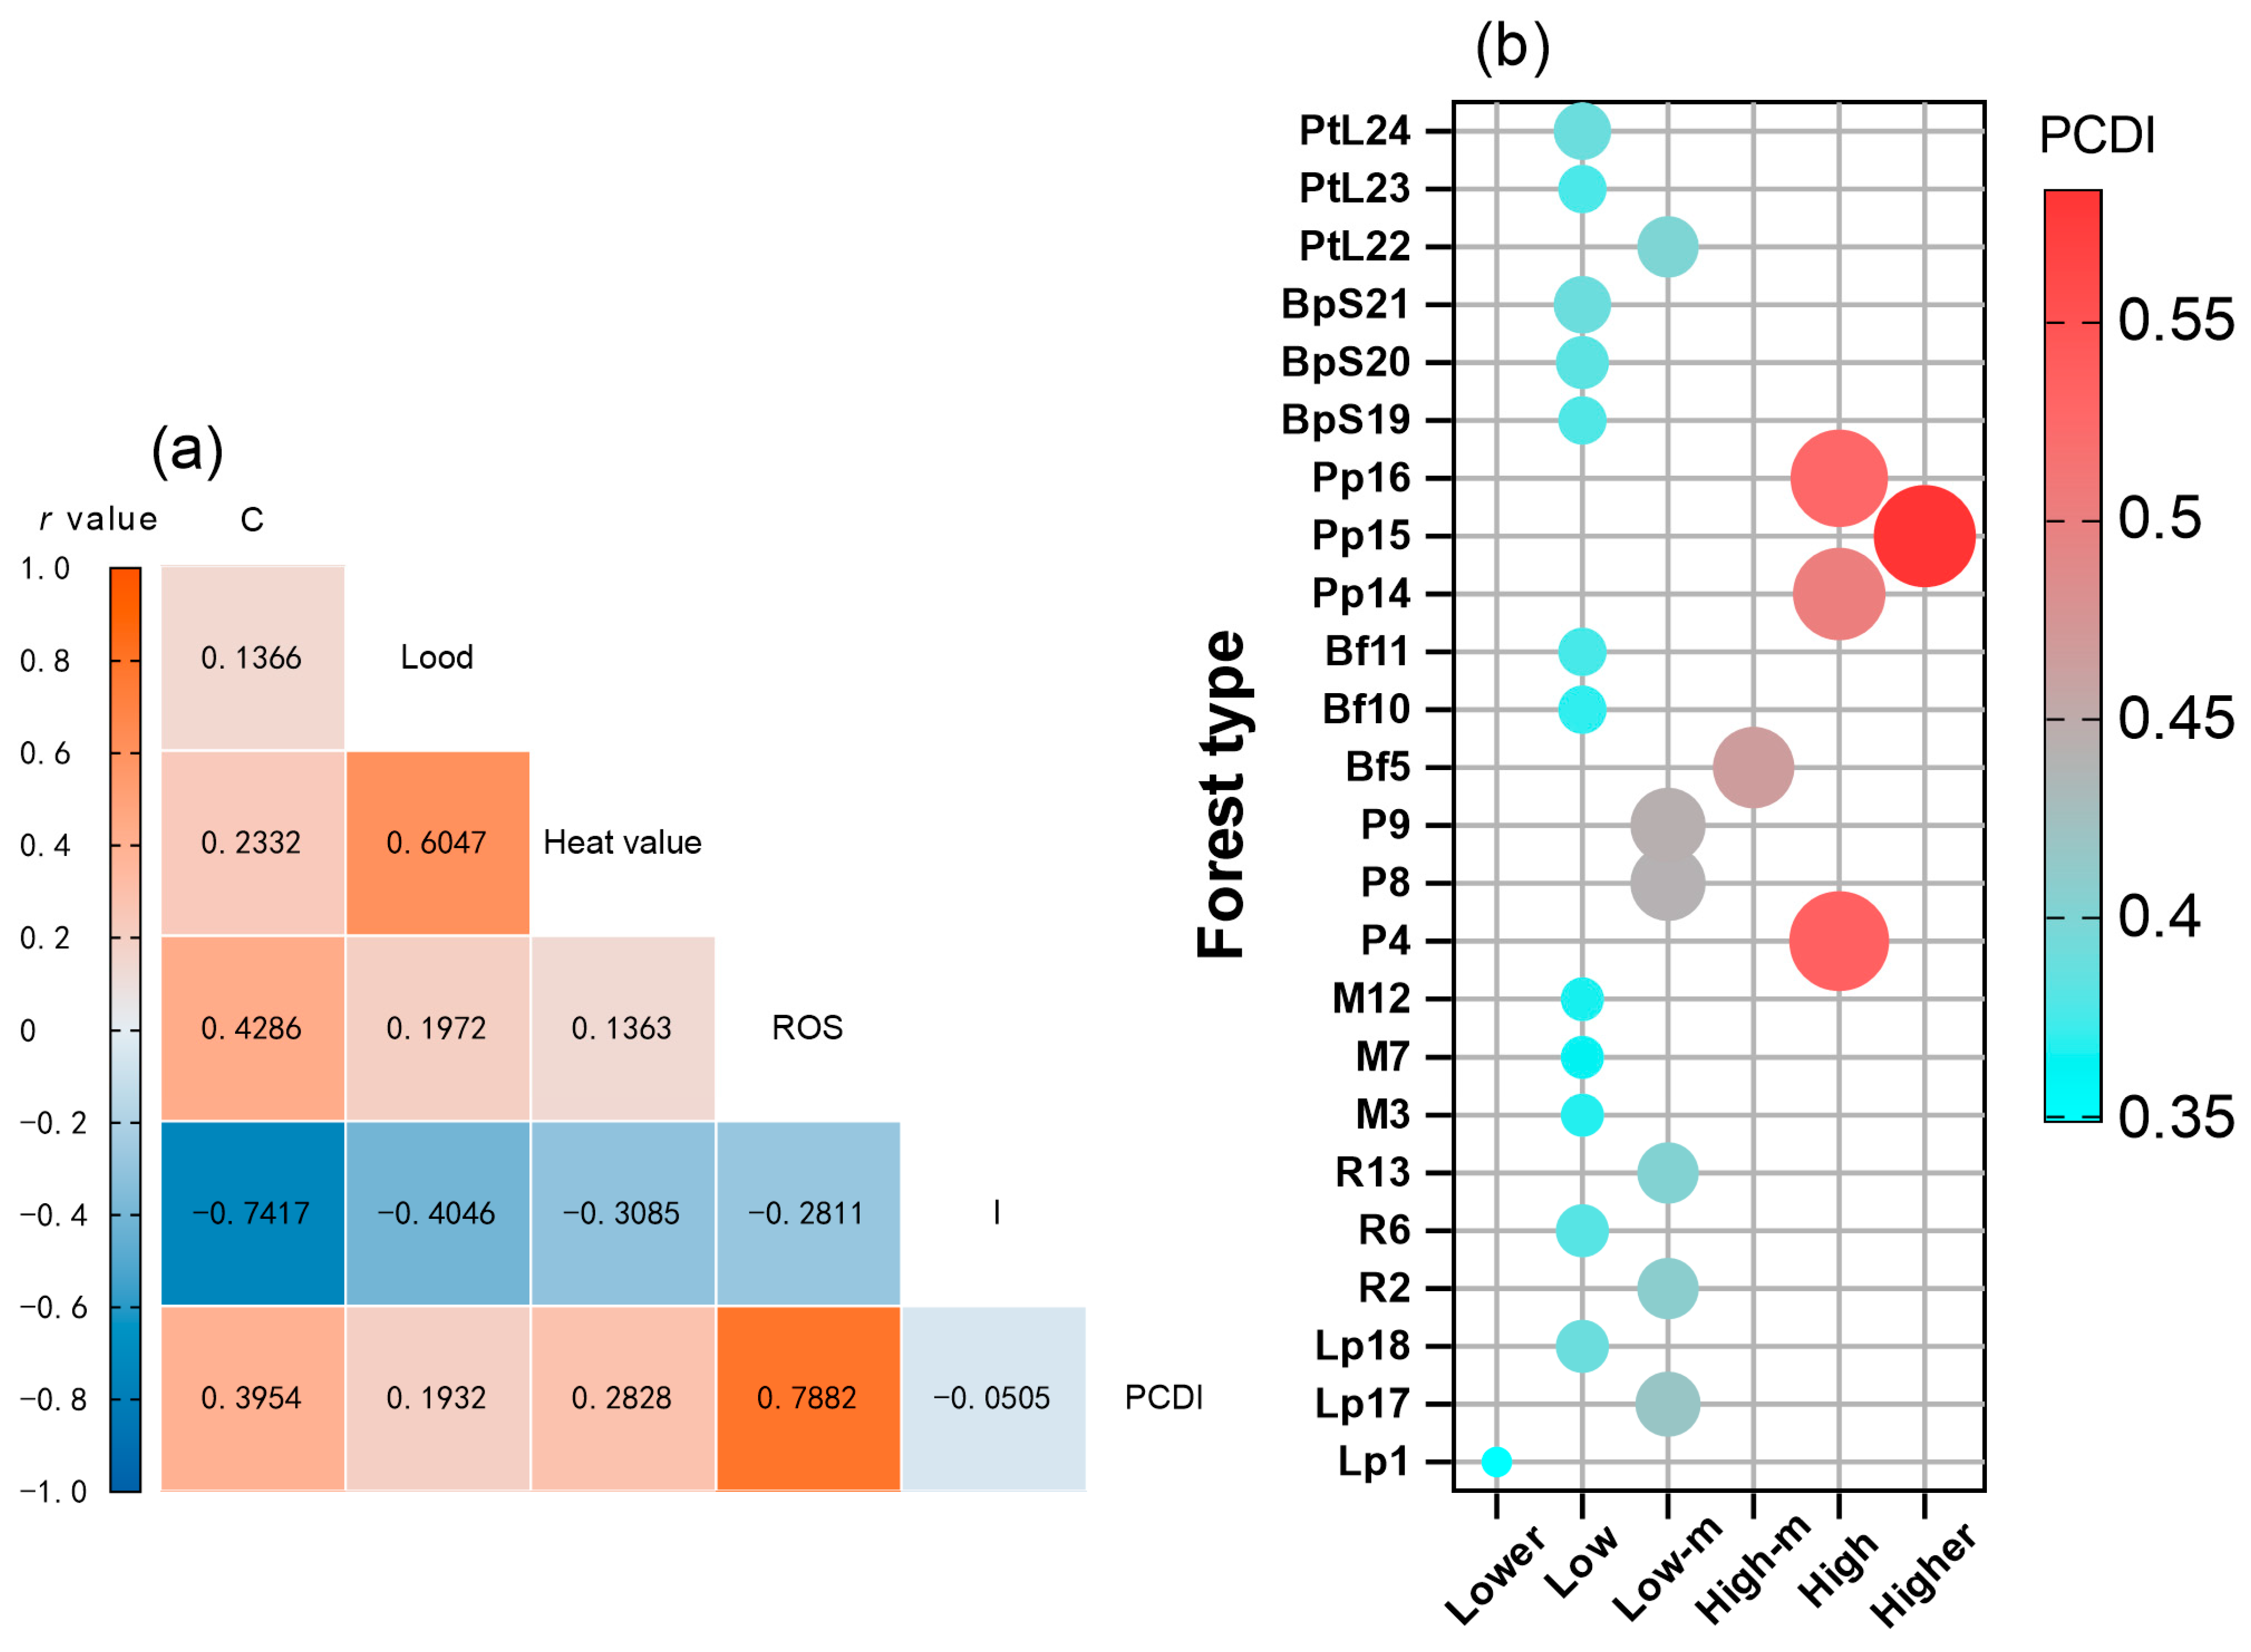
Also, in Figure 9, linear regression analysis indicated that the five components exerted a positive effect on PCDI, with a slope of 0.04851, and the model was found to be statistically significant (p < 0.05). The scatter plot revealed that color-coded data points were distributed within specific intervals along the X-axis—namely, load (0.0 < X < 0.2), ROS (0.2 < X < 0.4), I (0.0 < X < 0.4), C (0.4 < X < 0.6), and heat value (0.8 < X < 1.0)—while exhibiting distinct trends along the Y-axis. Although all factors demonstrated a positive correlation with PCDI, the magnitude of their individual influences varied. The dispersion of data points and the moderate slope of the regression line suggest that, despite statistical significance, the overall effect of these factors on PCDI remains relatively modest. Furthermore, the correlation matrix presented in Figure 10a revealed a significant positive correlation between heat value and fuel load (r = 0.6047), while index C and ROS exhibited a moderate positive correlation (r = 0.4286). In contrast, index I was negatively correlated with all the other factors, with the strongest negative correlations observed between index C (r = −0.7417) and fuel load (r = −0.4046). Additionally, PCDI was significantly positively correlated with ROS (r = 0.7882) and displayed a marked positive correlation with index C (r = 0.3954).
Finally, grouping statistics were calculated (Figure 10b). The analysis revealed that the majority of sample plots (75.00%) exhibited PCDI values within the low to low–middle range, encompassing nearly all forest types. In contrast, a smaller proportion of plots fell into the lower (4.17%), high–middle (4.17%), high (12.50%), and higher (4.17%) PCDI levels, with the affected forest types including Lp, P, Bf, and Pp. Notably, Pp displayed significantly higher PCDI values compared to other forest types, suggesting an elevated danger of crown fire occurrence in this forest type. Overall, based on PCDI rankings, the eight forest types can be arranged in descending order as follows: Pp > P > Bf > R ≈ Lp ≈ BpS ≈ PtL > M.

3.3. Model Comparison

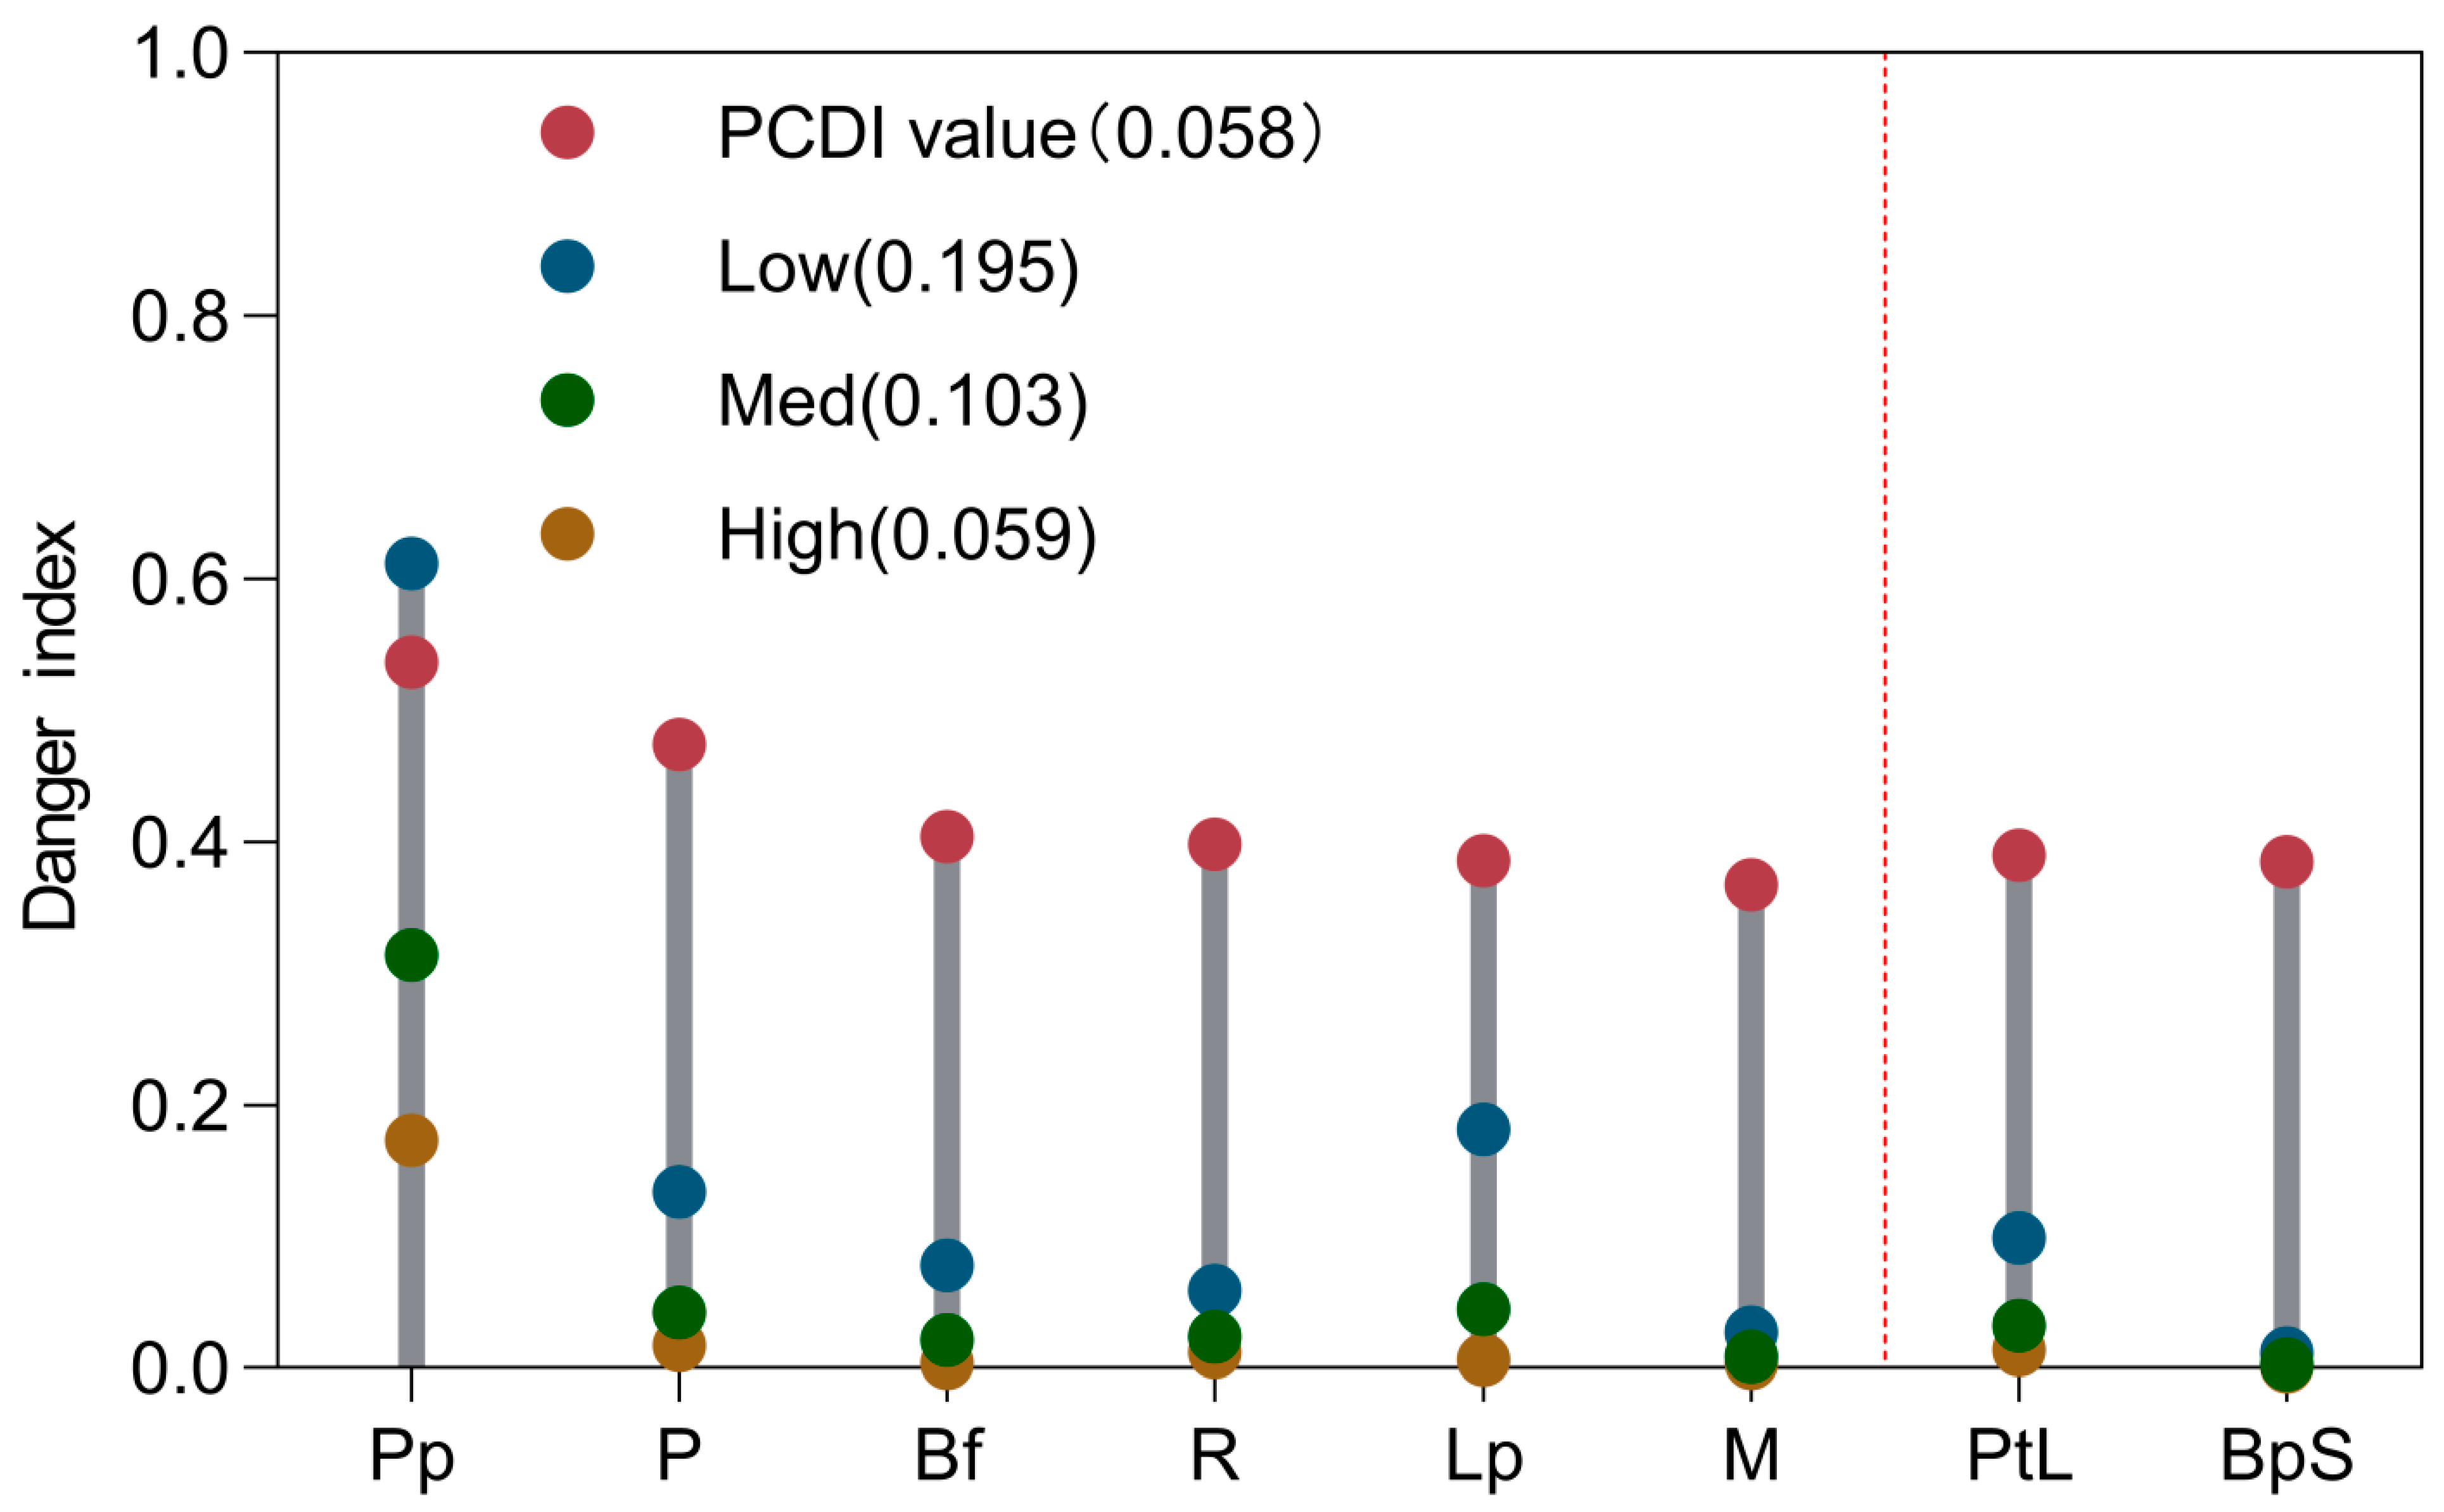
Model validation showed that the PCDI model had the lowest sample standard deviation (0.058) compared with the three moisture scenarios (High, Mid, and Low), indicating the highest stability. In contrast, the stability of the three moisture scenarios decreased in the order High > Mid > Low, reflecting a positive correlation with moisture availability. Overall, the trends of the three scenarios were broadly consistent with those of the PCDI model, confirming that the PCDI design is robust and reasonable (Figure 11).

4. Discussion

4.1. Danger of Crown Fire

The results indicate that P. pumila exhibits a significantly higher danger of crown fire compared to other forest types, while the fire danger levels among the remaining forest types do not differ markedly. This disparity appears to be attributable to distinct differences in five key fire-related characteristics between P. pumila and other forest types. Specifically, P. pumila thrives in cold–temperate environments, demonstrates remarkable cold-hardiness, and typically forms a low, dense shrub layer that intermingles with a herbaceous layer, creating a highly vertically structured vegetation complex. This structural configuration facilitates rapid upward fire propagation, enabling surface fires to quickly transfer from the shrub and herb layers to the crown, thereby accelerating the rate of fire spread [48]. Furthermore, the branches and foliage in the P. pumila shrub layer are notably dry and have a high oil content, significantly enhancing their flammability and thereby increasing both fire intensity and overall fire hazard [49]. Similar phenomena have been observed in Mediterranean pine and Australian eucalypt systems, where volatile-rich fuels accelerate the transition from surface to crown fire, highlighting the broader applicability of these mechanisms beyond Northeast Asia [36,37]. As a result, P. pumila exhibits markedly higher vertical fuel continuity and an elevated danger of crown fire initiation relative to other forest types. Additionally, the fuel load in P. pumila forests is predominantly concentrated in the crown, and the high calorific value of its live wood contributes to rapid and intense combustion [50]. This pattern aligns with reports from Canadian boreal forests, where crown-dominated fuel distributions similarly enhance combustion potential and complicate suppression efforts [7]. Moreover, the relatively low critical fireline intensity associated with this forest type suggests that even a low-intensity surface fire may be sufficient to initiate a crown fire. By contrast, other forest types, which exhibit lower fuel loading and reduced vertical continuity, are considerably less susceptible to crown fire initiation [41].
Overall, the crown fire danger in L. gmelinii forests is predominantly low to low–moderate, a condition closely associated with the integrated effects of the five key fire-related components examined [51]. The mean values of the vertical continuity index, ranging between 0.4 and 0.6, indicate that vegetation layer connectivity in the study area is relatively limited, thereby hindering the transition from surface fires to crown fires [52]. Additionally, the relatively low fuel loads and scattered fuel distribution across both surface and crown layers further constrain fire intensity and spatial extent [53]. Moreover, in some sample plots, the surface fireline intensity was below the critical threshold, reducing the likelihood of crown fire initiation. Although PCDI values in some P. pumila forest types reached high-danger levels, the limited distribution of this species did not significantly impact the overall fire danger assessment. Compared to other mountains, the moist climatic conditions and diverse forest composition of the Da Xing’anling area contribute to an overall crown fire danger that remains markedly lower than the global average [54]. This finding resonates with studies in Mediterranean and North American forests, where drier climates and more homogeneous stands tend to result in substantially higher crown fire activity under comparable conditions [29,35]. However, it is important to recognize that the fire behavior of L. gmelinii may undergo substantial changes in the future due to climate change and increasing forest disturbances. Similar warnings have been raised for Siberian larch forests and Alaskan boreal systems, where permafrost degradation and altered moisture regimes are expected to significantly increase crown fire frequency [55,56].
The linear regression analysis revealed that the spatial distribution of the five fire-related components exhibited variation in mountainous regions, with notable differences in their areas of concentration. This spatial heterogeneity directly influenced the outcomes of the PCDI model, emphasizing that fire danger assessments should account for site-specific characteristics. Such spatial heterogeneity has also been emphasized in European studies, where crown fire prediction models are increasingly adapted to local stand structures to improve reliability [26,29]. Consequently, when evaluating fire danger across different fire-prone areas, it is feasible to use a single component in conjunction with linear regression to estimate the PCDI index, significantly enhancing the efficiency of crown fire danger prediction [57]. Additionally, Fisher’s exact test identified significant differences in combustible fuel loads between larch and non-larch forest types, corroborating previous findings reported by He [58]. Larch forests are characterized by higher crown densities, greater leaf wax contents, and slower leaf decomposition rates, resulting in substantially higher surface and crown fuel loads compared to non-larch forests. Furthermore, larch forests exhibit greater water storage capacity, an adaptive trait that facilitates the prolonged accumulation of apoplastic litter. The high crown density in larch forests further inhibits the decomposition of herbaceous vegetation, leading to greater fuel accumulation. Comparable processes have been reported in Turkish and Portuguese pine forests, where needle waxes and delayed decomposition also enhance long-term fuel buildup [29,31]. In contrast, non-larch forests have lower fuel loading, largely due to their sparser crowns, tougher foliage, and accelerated decomposition rates [59].

4.2. Modelling Feasibility

The PCDI model represents a significant methodological advancement by integrating key fire behavior factors, such as vertical fuel continuity and the rate of surface fire spread, thereby overcoming the limitations of single-variable or static models. Similar integrative approaches have also been explored in Mediterranean regions and North American boreal forests, where fuel structure heterogeneity critically affects crown fire potential [35,37]. This integration enhances the model’s applicability to cold–temperate forests, such as those in the Da Xing’anling Mountains, where dense shrub populations contribute to fire danger [40]. By analogy, the model’s structure allows for transferability to other cold–temperate and boreal systems, including Siberian larch forests and Canadian conifer stands, where similar ladder-fuel dynamics have been reported [7,33]. Consequently, the PCDI model provides a novel framework for crown fire danger assessments in similar ecological zones worldwide. However, further validation in mountainous areas is required to refine and optimize its predictive accuracy. The normalization process and weight allocation methods employed in this model effectively mitigate inter-component correlations, thereby improving the accuracy of fire danger assessments. Comparable weighting and normalization strategies have been successfully applied in European fire danger models, highlighting the generalizability of such statistical approaches [35,39]. The model’s applicability is particularly strong in young and middle-aged forest stands, as it specifically addresses fire danger variations within these forest types, without extending to other forest age classes. Notably, the concentrated distribution of vertical continuity indices and fuel loading suggests minimal variability among sub-sites, which enhances the model’s predictive reliability [41,42]. In contrast, the greater variability observed in surface fire rate of spread and critical fireline intensity may limit the model’s applicability in certain fire-prone mountains [10]. This variability is consistent with findings from Mediterranean and Australian ecosystems, where wind-driven fire spread produces highly heterogeneous fire behavior even within short spatial scales [11,37]. The practical utility of the PCDI model for L. gmelinii forests is particularly evident in its role in fire danger zoning and management planning. For example, an analysis of PCDI values within the study area clearly identified high-danger zones—such as P. pumila stands—which should receive prioritized fire prevention efforts. In contrast, low-danger zones—such as Moss-dominated stands—may require less intensive fire management, thereby optimizing resource allocation and conservation costs [55,56]. In conclusion, compared to the traditional Rothermel model in BehavePlus 6.0, the PCDI model is not only more stable and provides a quantitative assessment of crown fire danger, particularly in mountains dominated by P. pumila, but also enables precise delineation of high-danger zones. This advantage parallels improvements observed when region-specific indices were integrated into existing fire simulation systems in North America and Europe, where the combination of local data with generalized frameworks improved predictive accuracy [8,26]. This capability offers a robust scientific foundation for forest fire management, particularly in complex fire-prone environments, while surpassing the limitations of traditional models. These findings underscore the PCDI model’s suitability for crown fire danger assessment in cold–temperate forests, particularly in fire-prone ecosystems like the Da Xing’anling Mountains.

4.3. Limitations and Future Research

In this study, the annual mean wind speed of Genhe City (0.8 m/s) was adopted as a model parameter. However, this assumption may have constrained the model’s ability to accurately simulate fire behavior. Wind speed is a critical determinant of surface fire spread rates, yet an annual average value does not adequately capture the seasonal and instantaneous variations observed under extreme meteorological conditions. Similar concerns have been reported in Mediterranean and North American ecosystems, where reliance on averaged meteorological inputs often led to underestimation of extreme fire spread potential [29,37]. During fire-prone periods, such as spring and autumn, wind speeds can substantially exceed the annual mean, potentially leading to an underestimation of crown fire danger. Furthermore, terrain complexity plays a crucial role in fire propagation dynamics. The Da Xing’anling Mountains are characterized by steep slopes and interlocking valleys, which induce considerable local variations in wind velocity—accelerating winds in valleys while diminishing them on flatter terrain. Neglecting these topographic influences may lead to either an underestimation or overestimation of fire spread rates and danger [60]. Comparable topographic effects have also been highlighted in Portugal, Canada, and Australia, where valley wind accelerations significantly altered crown fire thresholds [29,34]. To overcome these limitations, future research should focus on optimizing the PCDI model’s parameter settings. One potential approach is to incorporate dynamic wind speed parameters, such as seasonal variations or real-time meteorological measurements, to more accurately reflect fire conditions [61]. This direction aligns with international advancements where fire danger systems in Canada and the Mediterranean increasingly integrate real-time climatic drivers into prediction models [26,27]. Additionally, extending sample collection to include multiple seasons, particularly high-fire-danger periods such as spring and autumn, will capture broader climatic variability [62]. The development of dynamic fire danger models that integrate real-time climatic data (e.g., local wind speeds) as input parameters could significantly enhance the models’ predictive accuracy [63]. Furthermore, incorporating terrain data, such as slope and exposure indices derived from digital elevation models (DEMs), can further quantify topographic influences on fire spread [64]. Ultimately, merging real-time wind monitoring and topographic datasets will establish a fire simulation methodology optimized for dynamic climate–topography interactions [63].
The high danger of P. pumila is emphasized, as is the need for targeted fire management strategies for P. pumila, such as nursery thinning and the removal of surface and crown fuels, to reduce crown fire dangers. Comparable shrub-dominated systems in Siberia and Alaska have shown that species with high vertical fuel continuity pose disproportionate risks, underscoring the need for tailored management [36,54]. Furthermore, long-term monitoring of complex and variable future fire occurrences and the development of effective management strategies to mitigate future fire hazards is important.

5. Conclusions

This study developed a PCDI that integrates five components—vertical fuel continuity (C), fuel load (W), heat value (H), surface fire spread rate (R), and critical fireline intensity (I)—based on data from 24 plots representing eight forest types in the Da Xing’anling Mountains. The index was normalized and weighted to provide a consistent measure of crown fire danger across sites.
(1) Pinus pumila exhibits the highest crown fire hazard, while most other forest types fall within the low to low–middle range. P. pumila stands should therefore be prioritized for prevention and treatment, as they represent the principal high-danger zones in the landscape.
(2) Surface fire spread rate (R) and vertical fuel continuity (C) are the primary drivers of PCDI, followed by fuel load and heat value; critical fireline intensity has the least influence. Management should emphasize disrupting vertical fuel ladders and reducing surface spread potential through practices such as thinning, ladder-fuel removal, and surface fuel reduction.
(3) The PCDI model demonstrates high stability and strong agreement with BehavePlus 6.0-based checks, showing the lowest sample SD (0.058) among the tested scenarios. PCDI is thus a reliable tool for comparative danger screening and serves as a practical complement to simulation models when rapid, plot-scale assessments are required.
(4) The model is particularly applicable to young and middle-aged Larix gmelinii stands and is suitable for zoning and management planning in cold–temperate forests with similar structures. PCDI outputs can guide spatial prioritization and support the design of tailored prevention strategies in analogous ecosystems.
(5) Approximately 75% of plots fall within low to low–middle PCDI classes, while P. pumila stands are consistent outliers at higher danger levels, shaping the overall hazard pattern. Resources should be allocated efficiently, with cost-effective maintenance for widespread low-danger types and intensive treatments in localized P. pumila hotspots.
(6) The use of annual mean wind speed, without explicit modeling of fine-scale topographic wind effects, may lead to under or overestimation of danger under peak conditions. Future research should incorporate dynamic wind fields and terrain metrics (e.g., DEM-derived exposure) and extend sampling across seasons to refine predictions.
Overall conclusion: The PCDI provides a quantitative and transferable framework for assessing crown fire danger, enabling targeted prevention, control, and management where they will yield the greatest benefit—particularly in P. pumila stands within the cold–temperate forests of the Da Xing’anling region.

Author Contributions

B.Y.: Funding acquisition; Conceptualization; Project administration; Supervision; Investigation. T.H.: Methodology; Writing—original draft; Data curation; Formal analysis; Investigation. S.S.: Data curation; Formal analysis; Investigation. J.L. and S.Y.: Formal analysis. A.L.: Resources; Supervision; Writing—review and editing. All authors have read and agreed to the published version of the manuscript.

Funding

This research was funded by the Natural Science Foundation of the Inner Mongolia Autonomous Region (Natural Science Foundation of the Inner Mongolia Autonomous Region, Grant No. 2024MS03078), Inner Mongolia Autonomous Region Science and Technology Program (Department of Science and Technology of the Inner Mongolia Autonomous Region, Grant No. 2023YFSH0018), Program for improving the Scientific Research Ability of Youth Teachers of the Inner Mongolia Agricultural University (Inner Mongolia Agricultural University, Grant No. BR230104), and the high-level/excellent doctoral talents introduction scientific research start-up project of the Inner Mongolia Agricultural University (Inner Mongolia Agricultural University, Grant No. NDYB2021-7).

Data Availability Statement

Dataset available on request from the authors.

Acknowledgments

The authors would like to thank the National Field Scientific Observation and Research Station of Greater Khingan Forest Ecosystem Genhe 022350, for their valuable support and assistance during this study.

Conflicts of Interest

The authors declare no conflict of interest.

References

  1. Magalhes, N.; Evangelista, H.; Gonalves, S.J.; Alencar, A.S.; Santos, E.A.D.; Cataldo, M.; Mcconnell, J.R.; Silveira, R.S.; Mayewski, P.A.; Potocki, M. Seasonal changes in black carbon footprint on the Antarctic Peninsula due to rising shipborne tourism and forest fires. Sci. Adv. 2024, 10, eadp1682. [Google Scholar] [CrossRef]
  2. Jones, M.W.; Veraverbeke, S.; Andela, N.; Doerr, S.H.; Kolden, C.; Mataveli, G.; Pettinari, M.L.; Le Quéré, C.; Rosan, T.M.; van der Werf, G.R.; et al. Global rise in forest fire emissions linked to climate change in the extratropics. Science 2024, 386, eadl5889. [Google Scholar] [CrossRef] [PubMed]
  3. Naderpour, M.; Rizeei, H.M.; Ramezani, F. Forest fire risk prediction: A spatial deep neural network-based framework. Remote Sens. 2021, 13, 2513. [Google Scholar] [CrossRef]
  4. Quan, X.; Wang, W.; Xie, Q.; He, B.; Resco de Dios, V.; Yebra, M.; Jiao, M.; Chen, R. Improving wildfire occurrence modelling by integrating time-series features of weather and fuel moisture content. Environ. Model. Softw. 2023, 170, 105840. [Google Scholar] [CrossRef]
  5. Mišić, N.; Protić, M.; Cerdà, A.; Raos, M.; Blagojević, M. Transition from surface to crown fires: Effects of moisture content. Fire Technol. 2024, 60, 669–700. [Google Scholar] [CrossRef]
  6. Grishin, A.M. Mathematical Modeling of Forest Fires and New Methods of Fighting Them; Publishing House of the Tomsk State University: Tomsk, Russia, 1997. [Google Scholar]
  7. de Groot, W.J.; Hanes, C.C.; Wang, Y. Crown fuel consumption in Canadian boreal forest fires. Int. J. Wildland Fire 2022, 31, 255–276. [Google Scholar] [CrossRef]
  8. Finney, M.A. FARSITE: Fire Area Simulator—Model Development and Evaluation; U.S. Department of Agriculture, Forest Service, Rocky Mountain Research Station: Fort Collins, CO, USA, 1998. [CrossRef]
  9. Tymstra, C.; Bryce, R.W.; Wotton, B.M.; Taylor, S.W.; Armitage, O.B. Development and Structure of Prometheus: The Canadian Wildland Fire Growth Simulation Model. Natural Resources Canada, Canadian Forest Service, Northern Forestry Centre, Edmonton, Alberta. Information Report NOR-X-417. 102p. 2010. Available online: https://ostrnrcan-dostrncan.canada.ca/handle/1845/247413 (accessed on 10 July 2025).
  10. Wagner, C.E. Conditions for the start and spread of crown fire. Rev. Can. Rech. For. 1977, 7, 23–34. [Google Scholar] [CrossRef]
  11. Alexandridis, A.; Vakalis, D.; Siettos, C.I.; Bafas, G.V. A Cellular Automata Model for Forest Fire Spread Prediction: The Case of the Wildfire That Swept Through Spetses Island in 1990. Appl. Math. Comput. 2008, 204, 191–201. [Google Scholar] [CrossRef]
  12. Sullivan, A.L. Wildland Surface Fire Spread Modelling, 1990–2007. 3: Simulation and Mathematical Analogue Models. Int. J. Wildland Fire 2009, 18, 387–403. [Google Scholar] [CrossRef]
  13. Chen, R.; He, B.; Li, Y.; Zhang, Y.; Liao, Z.; Fan, C.; Yin, J.; Zhang, H. Incorporating fire spread simulation and machine learning algorithms to estimate crown fire potential for pine forests in Sichuan, China. Int. J. Appl. Earth Obs. Geoinf. 2024, 132, 104080. [Google Scholar] [CrossRef]
  14. Gao, M.; Chen, S.; Suo, A.; Chen, F.; Liu, X. Response of fuel characteristics, potential fire behavior, and understory vegetation diversity to thinning in Platycladus orientalis forest in Beijing, China. Forests 2024, 15, 1667. [Google Scholar] [CrossRef]
  15. Tenny, J.T.; Sankey, T.T.; Munson, S.M.; Meador, A.J.S.; Goetz, S.J. Canopy and Surface Fuels Measurement Using Terrestrial Lidar Single-Scan Approach in the Mogollon Highlands of Arizona. Int. J. Wildland Fire 2025, 34, WF24221. [Google Scholar] [CrossRef]
  16. Shin, P.; Sankey, T.; Moore, M.M.; Thode, A.E. Evaluating Unmanned Aerial Vehicle Images for Estimating Forest Canopy Fuels in a Ponderosa Pine Stand. Remote Sens. 2018, 10, 1266. [Google Scholar] [CrossRef]
  17. Guo, H.; Gao, Y.; Ye, Z.; Yang, Z.; Zhang, Y.; Lei, Z.; Sun, A. Experimental Investigation of Fire Behaviours and Heat Transfer in Single Cypress Tree Crown Fires. Int. J. Wildland Fire 2025, 34, WF24030. [Google Scholar] [CrossRef]
  18. Marino, E.; Hernando, C.; Madrigal, J.; Guijarro, M.; Díez, C. Short-term effect of fuel treatments on fire behaviour in a mixed heathland: A comparative assessment in an outdoor wind tunnel. Int. J. Wildland Fire 2014, 23, 1002–1013. [Google Scholar] [CrossRef]
  19. Xu, H.; Chen, J.; He, G.; Lin, Z.; Bai, Y.; Ren, M.; Zhang, H.; Yin, H.; Liu, F. Immediate assessment of forest fire using a novel vegetation index and machine learning based on multi-platform, high temporal resolution remote sensing images. Int. J. Appl. Earth Obs. Geoinf. 2024, 134, 104210. [Google Scholar] [CrossRef]
  20. Szpakowski, D.M.; Jensen, J.R. A Review of the Applications of Remote Sensing in Fire Ecology. Remote Sens. 2019, 11, 2638. [Google Scholar] [CrossRef]
  21. Filipponi, F. Exploitation of Sentinel-2 Time Series to Map Burned Areas at the National Level: A Case Study on the 2017 Italy Wildfires. Remote Sens. 2019, 11, 622. [Google Scholar] [CrossRef]
  22. Lyell, C.S.; Nattala, U.; Keeble, T.; Vella, E.M.; Joshi, R.C.; Joukhadar, Z.; Garber, J.; Mutch, S.J.; Gazzard, T.; Duff, T.; et al. Forecasting dead fuel moisture content below forest canopies—A seven-day forecasting system. Agric. For. Meteorol. 2024, 358, 110217. [Google Scholar] [CrossRef]
  23. Hou, X.; Wu, Z.; Zhu, S.; Li, Z.; Li, S. Comparative analysis of machine learning-based predictive models for fine dead fuel moisture of subtropical forest in China. Forests 2024, 15, 736. [Google Scholar] [CrossRef]
  24. Xu, H.; Zlatanova, S.; Liang, R.; Canbulat, I. Generative AI as a Pillar for Predicting 2D and 3D Wildfire Spread: Beyond Physics-Based Models and Traditional Deep Learning. Fire 2025, 8, 293. [Google Scholar] [CrossRef]
  25. Yang, J.; Jiang, H.; Wang, S.; Ma, X. A Multi-Scale Deep Learning Algorithm for Enhanced Forest Fire Danger Prediction Using Remote Sensing Images. Forests 2024, 15, 1581. [Google Scholar] [CrossRef]
  26. Castle, D.; Mell, W.; Miller, F.J. Examination of the Wildland-Urban Interface Fire Dynamics Simulator in Modeling of Laboratory-Scale Surface-to-Crown Fire Transition. Available online: https://www.academia.edu/download/32039588/Castle_LabCrwnFireIniti_June2013USNatCombMtng070FR-0300.pdf (accessed on 10 July 2025).
  27. Modarres, M. Experimental and Numerical Analysis of Fire Behaviour in Typical Fuels at the Wildland-Urban Interface. Ph.D. Thesis, University of Coimbra, Coimbra, Portugal, 2025. Available online: https://estudogeral.uc.pt/handle/10316/118566 (accessed on 10 July 2025).
  28. Da Ponte, E.; Costafreda-Aumedes, S.; Vega-Garcia, C. Lessons learned from arson wildfire incidence in reforestations and natural stands in Spain. Forests 2019, 10, 229. [Google Scholar] [CrossRef]
  29. Fernandes, P.; Loureiro, C.; Botelho, H. Fire behaviour and severity in a maritime pine stand under differing fuel conditions. Ann. For. Sci. 2004, 61, 537–544. [Google Scholar] [CrossRef]
  30. Robert, D.F. Department of Applied Physics and Applied Mathematics, Columbia University, NASA Goddard Institute for Space Studies. Evaluation of Global Fire Weather Database Reanalysis and Short-Term Forecast Products. Nat. Hazards Earth Syst. Sci. 2020, 20, 1123–1147. [Google Scholar] [CrossRef]
  31. Kucuk, O.; Goltas, M.; Demirel, T.; Mitsopoulos, I.; Bilgili, E. Predicting Canopy Fuel Characteristics in Pinus brutia Ten., Pinus nigra Arnold and Pinus pinaster Ait. Forests from Stand Variables in North-Western Turkey. Environ. Eng. Manag. J. 2021, 20, 207–219. [Google Scholar] [CrossRef]
  32. Cruz, M.G.; Alexander, M.E. The 10% Wind Speed Rule of Thumb for Estimating a Wildfire’s Forward Rate of Spread in Forests and Shrublands. Ann. For. Sci. 2019, 76, 44. [Google Scholar] [CrossRef]
  33. Loboda, E.; Kasymov, D.; Agafontsev, M.; Reyno, V.; Lutsenko, A.; Staroseltseva, A.; Perminov, V.; Martynov, P.; Loboda, Y.; Orlov, K. Crown fire modeling and its effect on atmospheric characteristics. Atmosphere 2022, 13, 1982. [Google Scholar] [CrossRef]
  34. Morvan, D. Physical phenomena and length scales governing the behaviour of wildfires: A case for physical modelling. Fire Technol. 2011, 47, 437–460. [Google Scholar] [CrossRef]
  35. Conrad, E.; Jolly, W.M.; Brown, T.; Hillman, S. Branching out: Species-Specific Canopy Architecture Limits Live Crown Fuel Consumption in Intermountain West USA Conifers. Fire Ecol. 2024, 20, 28. [Google Scholar] [CrossRef]
  36. Cruz, M.G.; Sullivan, A.L.; Gould, J.S.; Sims, N.C.; Bannister, A.J.; Hollis, J.J.; Hurley, R.J. Anatomy of a Catastrophic Wildfire: The Black Saturday Kilmore East Fire in Victoria, Australia. For. Ecol. Manag. 2012, 284, 269–285. [Google Scholar] [CrossRef]
  37. Salis, M.; Arca, B.; Alcasena, F.; Arianoutsou, M.; Bacciu, V.; Duce, P.; Duguy, B.; Koutsias, N.; Mallinis, G.; Mitsopoulos, I.; et al. Predicting wildfire spread and behaviour in Mediterranean landscapes. Int. J. Wildland Fire 2016, 25, 1015–1032. [Google Scholar] [CrossRef]
  38. Pierce, A.D.; McDaniel, S.; Wasser, M.; Ainsworth, A.; Litton, C.M.; Giardina, C.P.; Cordell, S. Using a prescribed fire to test custom and standard fuel models for fire behaviour prediction in a non-native, grass-invaded tropical dry shrubland. Appl. Veg. Sci. 2014, 17, 700–710. [Google Scholar] [CrossRef]
  39. De Luca, G.; Modica, G.; Silva, J.M.N.; Praticò, S.; Pereira, J.M.C. Assessing Tree Crown Fire Damage Integrating Linear Spectral Mixture Analysis and Supervised Machine Learning on Sentinel-2 Imagery. Int. J. Digit. Earth 2023, 16, 3162–3198. [Google Scholar] [CrossRef]
  40. Zhou, Q.; Zhang, H.; Wu, Z. Effects of Forest Fire Prevention Policies on Probability and Drivers of Forest Fires in the Boreal Forests of China during Different Periods. Remote Sens. 2022, 14, 5724. [Google Scholar] [CrossRef]
  41. Porto, M.; Correia, O.; Beja, P. Modelling Fuel Succession in Mediterranean Cork Oak Forests along a 70-Year Chronosequence. Forest Ecol. Manag. 2013, 302, 221–230. [Google Scholar] [CrossRef]
  42. Lee, S.; Lee, Y.; Ryu, J.; Kwon, C.; Seo, K.; Kim, S. Prediction of Wildfire Fuel Load for Pinus densiflora Stands in South Korea Based on the Forest-Growth Model. Forests 2022, 13, 1372. [Google Scholar] [CrossRef]
  43. Agbeshie, A.A.; Abugre, S.; Atta Darkwa, T.; Awuah, R. A Review of the Effects of Forest Fire on Soil Properties. J. For. Res. 2022, 33, 1419–1441. [Google Scholar] [CrossRef]
  44. Zhang, G. A Case Study on the Integration of Remote Sensing for Predicting Complicated Forest Fire Spread. Remote Sens. 2024, 16, 3969. [Google Scholar] [CrossRef]
  45. Rothermel, R.C. A Mathematical Model for Predicting Fire Spread in Wild Land Fuels; US Department of Agriculture, Intermountain Forest & Range Experiment Station: Ogden, UT, USA, 1972. [Google Scholar]
  46. Wang, Z.F. Estimation method of initial spread velocity of mountain fire. Mount. Res. 1983, 1, 42–51. [Google Scholar]
  47. Byram, G.M. Combustion of forest fuels. In Forest Fire: Control and Use; Davis, K.P., Ed.; McGraw-Hill: New York, NY, USA, 1959; pp. 61–89. [Google Scholar]
  48. Aini, A.; Jolly, W.M.; Brown, T.P.; Hillman, S.C. Modelling Fire Hazard in the Southern Mediterranean Fire Rim (Bejaia Region, Northern Algeria). Environ. Monit. Assess. 2019, 191, 747. [Google Scholar] [CrossRef]
  49. Zhao, F.-J.; Shu, L.-F.; Wang, Q.-H.; Wang, M.-Y.; Tian, X.-R. Emissions of volatile organic compounds from heated needles and twigs of Pinus pumila. J. For. Res. 2011, 22, 243–248. [Google Scholar] [CrossRef]
  50. Wang, S.; Zheng, X.; Du, Y.; Zhang, G.; Wang, Q.; Han, D.; Zhang, J. Estimation of Short-Term Vegetation Recovery in Post-Fire Siberian Dwarf Pine (Pinus pumila) Shrublands Based on Sentinel-2 Data. Fire 2025, 8, 47. [Google Scholar] [CrossRef]
  51. Kharuk, V.I.; Dvinskaya, M.L.; Ranson, K.J. Fire return intervals within the northern boundary of the larch forest in Central Siberia. Int. J. Wildland Fire 2013, 22, 251–257. [Google Scholar] [CrossRef]
  52. Alexander, H.D.; Natali, S.M.; Loranty, M.M.; Ludwig, S.M.; Spektor, V.V.; Davydov, S.; Zimov, N.; Trujillo, I.; Mack, M.C. Impacts of Increased Soil Burn Severity on Larch Forest Regeneration on Permafrost Soils of Far Northeastern Siberia. Forest Ecol. Manag. 2018, 417, 144–153. [Google Scholar] [CrossRef]
  53. Kharuk, V.I.; Shvetsov, E.G.; Buryak, L.V.; Golyukov, A.S.; Dvinskaya, M.L.; Petrov, I.A. Wildfires in the Larch Range within Permafrost, Siberia. Fire 2023, 6, 301. [Google Scholar] [CrossRef]
  54. Kharuk, V.I.; Ponomarev, E.I.; Ivanova, G.A.; Dvinskaya, M.L.; Coogan, S.C.P.; Flannigan, M.D. Wildfires in the Siberian Taiga. Ambio 2021, 50, 1953–1974. [Google Scholar] [CrossRef]
  55. Ramírez, J.; Mendes, M.; Monedero, S. Enhanced Forest Fire Risk Assessment through the Use of Fire Simulation Models. J. For. Ecol. Manag. 2015, 349, 32–41. [Google Scholar]
  56. Shi, C.; Zhang, F. A Forest Fire Susceptibility Modeling Approach Based on Integration Machine Learning Algorithm. Forests 2023, 14, 1506. [Google Scholar] [CrossRef]
  57. Botequim, B.; Fernandes, P.M.; Garcia-Gonzalo, J.; Silva, A.; Borges, J.G. Coupling Fire Behaviour Modelling and Stand Characteristics to Assess and Mitigate Fire Hazard in a Maritime Pine Landscape in Portugal. Eur. J. For. Res. 2017, 136, 527–542. [Google Scholar] [CrossRef]
  58. Han, H.; Yu, C.; Liu, Z.; Xiong, Z.; Zhao, L. Evaluations on the Consequences of Fire Suppression and the Ecological Effects of Fuel Treatment Scenarios in a Boreal Forest of the Great Xing’an Mountains, China. Forests 2023, 14, 85. [Google Scholar] [CrossRef]
  59. Changfeng, Y.; Yulong, Z.; Jiahui, W.; Yating, T. Modeling and Evaluation of Causal Factors in Emergency Responses to Fire Accidents Involving Oil Storage Systems. Sci. Rep. 2021, 11, 19018. [Google Scholar] [CrossRef]
  60. Gupta, S.K.; Kanga, S.; Gowhar, M.; Kumar, P.; Kumar, S. The Impact of Hydro-Meteorological Drivers on Forest Fires in Simlipal, India. Appl. Climatol. 2023, 153, 675–695. [Google Scholar] [CrossRef]
  61. Jellouli, O.; Bernoussi, A.; Amharref, M.; Ouardouz, M. Modeling of Wind Flow and Its Impact on Forest Fire Spread: Cellular Automata Approach; Springer International Publishing: Berlin/Heidelberg, Germany, 2016; pp. 269–279. [Google Scholar] [CrossRef]
  62. Kolaitis, D.I.; Pallikarakis, C.; Founti, M. Comparative Assessment of Wildland Fire Rate of Spread Models: Effects of Wind Velocity. Fire 2023, 6, 188. [Google Scholar] [CrossRef]
  63. Dastour, H.; Bhuian, H.; Ahmed, M.R.; Hassan, Q.K. Active Fire Clustering and Spatiotemporal Dynamic Models for Forest Fire Management. Fire 2024, 7, 355. [Google Scholar] [CrossRef]
  64. Homhuan, S.; Humhong, C. Development of Forest Fire Monitoring and Warning System for Agroforestry Areas in Uttaradit Province, Thailand. Earth Environ. Sci. 2020, 538, 012008. [Google Scholar] [CrossRef]
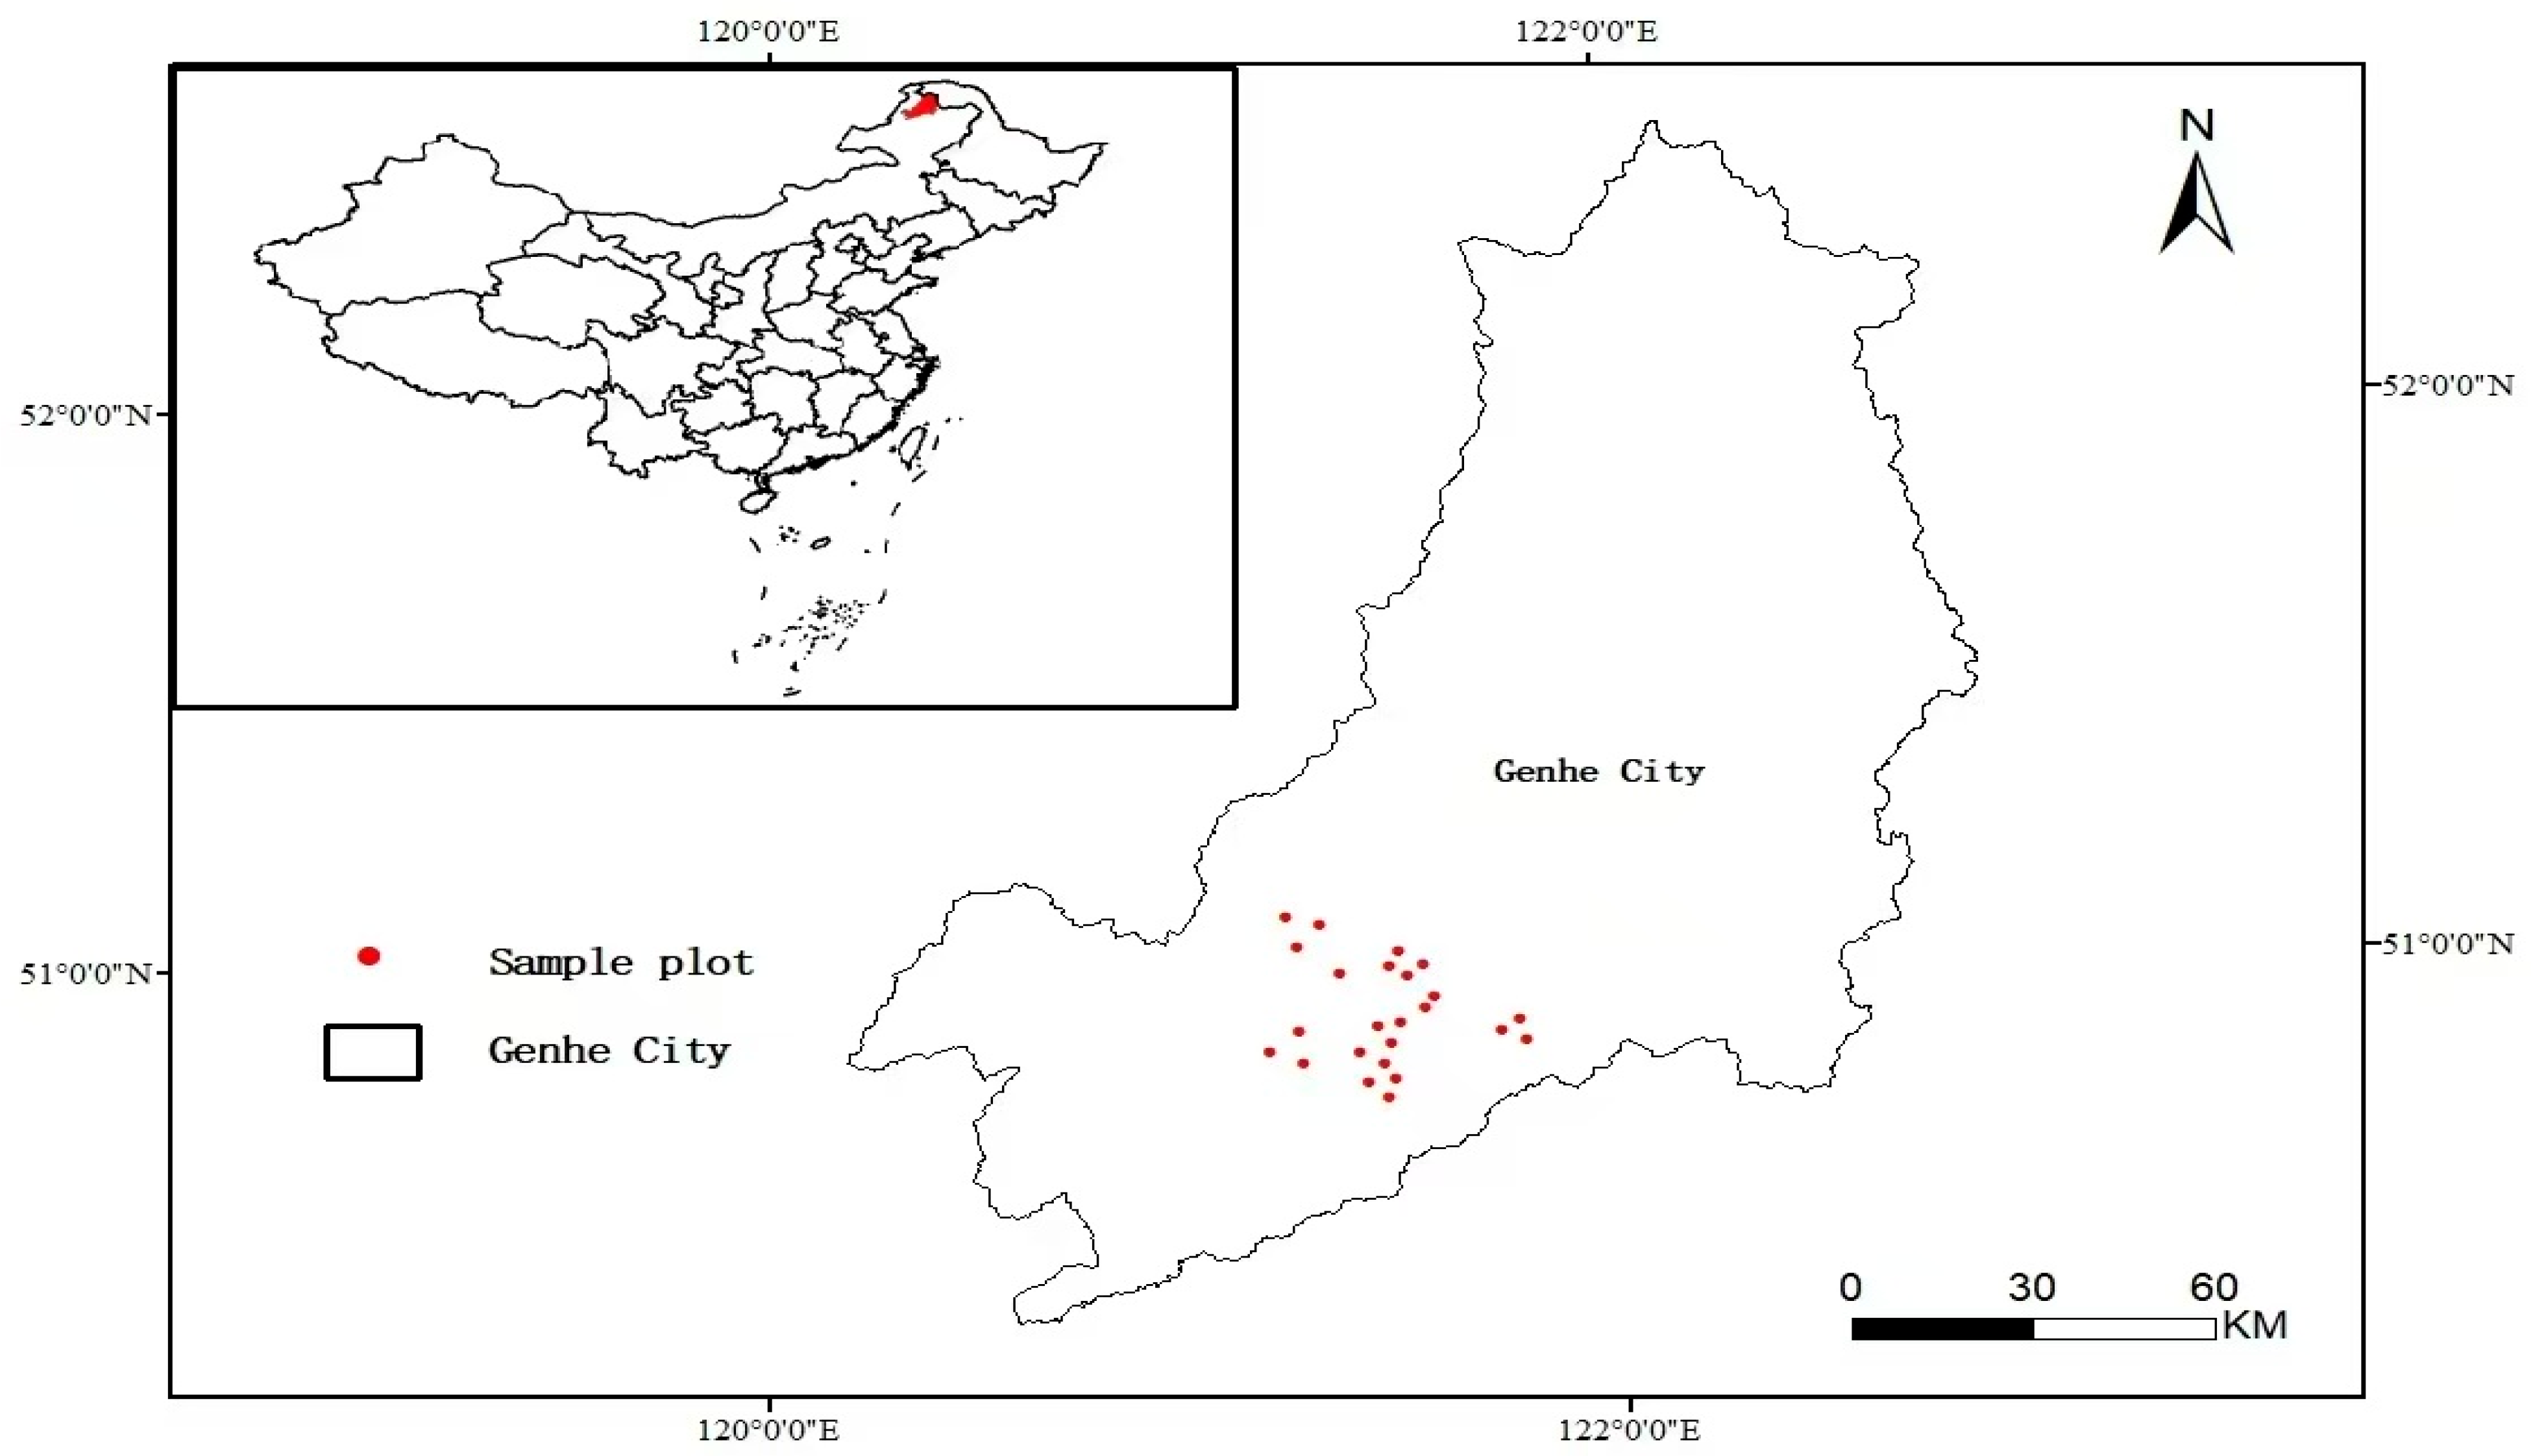
Figure 1. Survey sample locations. The 24 sample plots covered the mountains between 121°29′50″~121°76′32″E and 50°54′04″~51°12′11″N.
Forests 16 01449 g001
Figure 2. Photographs of the eight forest types in the Da Xing’anling Mountains (Inner Mongolia, China): Ledum palustre-L. gmelinii (a), Rhododendron-L. gmelinii (b), Moss-L. gmelinii (c), Poaceae-L. gmelinii (d), Betula fruticosa-L. gmelinii (e), Pinus pumila-L. gmelinii (f), Betula platyphylla (g), and Populus tremula (h).
Forests 16 01449 g002
Figure 3. Flow of the study.
Forests 16 01449 g003
Figure 4. Correlation matrix of the continuity index (C) (a) and the variability of index C in different forest types (b). Absence of * indicates no significant difference; * indicates a significant difference at p < 0.05; ** indicates a significant difference at p < 0.01.
Forests 16 01449 g004
Figure 5. Vertical distribution of fuel loads on the surface and crown (a), percentage distribution of fuel loads on the crown (b), percentage distribution of fuel loads on the surface (c), vertical distribution of dead and live wood in the crown (d), percentage of dead wood at different heights (e), percentage of live wood at different heights (f). In addition, (b,c) use the same color legend, while (e,f) use another one.
Forests 16 01449 g005
Figure 6. Heat values across fuel types (a), overall heat values of forest types (b), and ROS fluctuations (c). For (b), absence of * indicates no significant difference; * indicates a significant difference at p < 0.05.
Forests 16 01449 g006
Figure 7. Analysis of variance between Ib and I. The eight subgraphs represent eight forest types respectively.
Forests 16 01449 g007
Figure 8. Relationships between fire danger components and forest types. Five components are displayed: (a) fuel vertical distribution continuity index, (b) fuel load, (c) fuel combustion heat value, (d) surface fire rate of spread, and (e) critical fireline intensity.
Forests 16 01449 g008
Figure 9. Normalization and linear regression results.
Forests 16 01449 g009
Figure 10. Correlation matrix of the five components of the PCDI model (a) and danger classification of all sample plots (b).
Forests 16 01449 g010
Figure 11. Summary of results and performance comparison of PCDI model and BehavePlus 6.0; the numbers in the legend indicate the sample standard deviations.
Forests 16 01449 g011
Table 1. Sample plots for the forest fuel survey in Genhe forest area.
Forest TypeSample NumberCrown Length (m)Diameter at Breast Height
(cm)
Tree Height
(m)
Crown Width
(m)
Dead Wood Height
(m)
Live
Wood Height
(m)
Slope
(°)
Lp1/17/185.939.069.902.221.562.3115
R2/6/134.837.149.172.013.445.1912
M3/7/123.537.578.871.902.363.9718
P4/8/96.338.8313.871.783.437.7120
Bf5/10/116.839.2314.821.773.007.3727
Pp14/15/165.338.068.911.660.903.4717
BpS19/20/21~8.5311.362.17~6.3410
PtL22/23/24~9.9711.262.663.838.7630
Table 2. BehavePlus 6.0 input parameter table.
BehavePlus Input Parameter Table8 Species of Forest Types
LpRMPBfPpBpSPtL
Fuel Parameter Initializationtu3
Fuel Model TypeD
1 h Fuel Load (kg/m2)0.108 0.139 0.033 0.147 0.060 0.356 0.086 0.102
10 h Fuel Load (kg/m2)0.050 0.187 0.006 0.195 0.129 0.137 0.134 0.125
100 h Fuel Load (kg/m2)0.111 0.032 0.045 0.085 0.150 1.694 0.042 0.045
Live Herbaceous Fuel Load (kg/m2)0.015 0.070 0.023 0.147 0.113 0.004 0.096 0.093
Live Woody Fuel Load (kg/m2)0.241 0.138 0.018 0.087 0.015 0.271 0.056 0.062
1 h Fuel SA/V
(cm2/cm3)
59.06
Live Herbaceous Fuel SA/V (cm2/cm3)52.49
Live Woody Fuel SA/V (cm2/cm3)45.93
Fuel Bed Depth (cm)13.67 11.89 13.44 14.67 11.08 18.67 8.89 9.56
Dead Fuel Moisture of Extinction (%)40
Dead Fuel Heat Content (kJ/kg)19,181.13 18,285.41 18,215.94 18,598.36 18,859.66 19,100.45 18,693.59 18,594.07
Live Fuel Heat Content (kJ/kg)20,325.90 20,942.70 18,551.66 18,661.03 18,516.77 20,058.45 18,628.53 18,698.67
Canopy Base Height (m)1.56 3.44 2.36 3.43 3.00 0.90 6.34 3.83
Foliar Moisture (%)100
20 ft Wind Speed (m/s)0.8
Wind Adjustment Factor0.4
Slope Steepness (°)1512182027171030
Table 3. Moisture scenario.
Fuel TypeMoisture Scenario
LowMidHigh
1 h Fuel3%6%12%
10 h Fuel4%7%13%
100 h Fuel5%8%14%
Surface Live Herbaceous Fuel70%120%170%
Surface Live Woody Fuel70%120%170%
Table 4. Table of PCDI classification criteria.
Index RangeCrown Fire Danger Level
<0.35Lower
0.35–0.40Low
0.40–0.45Low–middle
0.45–0.50High–middle
0.50–0.55High
>0.55Higher
Disclaimer/Publisher’s Note: The statements, opinions and data contained in all publications are solely those of the individual author(s) and contributor(s) and not of MDPI and/or the editor(s). MDPI and/or the editor(s) disclaim responsibility for any injury to people or property resulting from any ideas, methods, instructions or products referred to in the content.