Article

Phenolic Leaf Compounds in Ash Trees (Fraxinus excelsior L.) in the Context of Ash Dieback

1
Division Urban Plant Ecophysiology, Faculty of Life Sciences, Humboldt-Universität zu Berlin, Lentzeallee 55-57, 14195 Berlin, Germany
2
Department of Forest Ecology and Monitoring (LFE), State Forestry Institute Brandenburg, Alfred-Möller-Str. 1, 16225 Eberswalde, Germany
*
Author to whom correspondence should be addressed.
Forests 2025, 16(9), 1387; https://doi.org/10.3390/f16091387
Submission received: 27 July 2025 / Revised: 21 August 2025 / Accepted: 26 August 2025 / Published: 29 August 2025

Abstract

Most ash trees (Fraxinus excelsior) in Germany are infected with Hymenoscyphus fraxineus, the causative agent of ash dieback (ADB). This study investigates the phenolic content of ash leaves to evaluate their potential as indicators for monitoring ADB and to assess how this potential is affected by site and year. Fresh leaf samples were collected and immediately frozen from 14 forest plots across Germany over a period of up to four years. Phenolic compounds were quantified using both photometric assays and HPLC. The results reveal strong site-specific differences in both total phenolic content and individual phenolic profiles. Temporal differences between sampling years were less pronounced, but were frequently significant. In contrast, crown condition—a key indicator of ADB damage—had only a weak effect on phenolic content. This suggests that mature ash trees do not exhibit a clear phenol-based defence response to H. fraxineus under field conditions. Our findings underscore the complexity of phenolic dynamics in natural stands and demonstrate that no robust of phenolic biomarker for ADB could be identified in mature trees.

1. Introduction

The genus Fraxinus (Oleaceae) is known for its rich phenolic content, which has been utilised in traditional medicine in different parts of the world. This also applies to the Common Ash (Fraxinus excelsior L.), which is native to Europe and Asia. Extracts from its leaves and bark are valued for their diuretic, anti-inflammatory, and analgesic properties, attributed to their phenolic constituents and antioxidant capacity [1]. Fraxinus excelsior contains diverse phenolic compounds such as coumarins, flavonoids, and phenylethanoid glucosides, as well as phenolic secoiridoids, with organ-specific variations in compound profiles [2,3,4].
Phenolics are among the most diverse classes of plant secondary metabolites [5], known for their multifunctionality, especially as antioxidants [6,7,8,9]. They are frequently implicated in plant responses to abiotic stress and pathogen attack, particularly from fungal organisms [6,8]. Acting as constitutive or inducible defence compounds [7,10,11], phenolics may contribute to general or specific disease resistance [9,11] or serve as precursors for other defensive metabolites [6]. The production of these compounds is highly variable, influenced by intraspecific genetic differences and abiotic and biotic environmental factors [12]. Due to their antifungal properties [6,7], phenolic compounds may be involved in the defence of F. excelsior against ash dieback, a disease caused by Hymenoscyphus fraxineus (T. Kowalski) Baral, Queloz, Hosoya. The fungus typically infects trees via the leaves, and can spread through the petioles or lenticels into the shoot, causing necrosis and dieback [13,14,15,16]. Infections of the stem base have also been reported [17,18,19,20,21]. H. fraxineus is a member of the order Helotiales (class Leotiomycetes, Ascomycota) and a cryptic sister species of the native, non-pathogenic Hymenoscyphus albidus. The pathogen originates from East Asia, where it is associated with Fraxinus mandshurica, but causes only minor damage to its native host. After its introduction to Europe in the early 1990s, it spread rapidly across the continent, and has since become the most serious threat to the survival of common ash (F. excelsior) in Europe [22,23,24,25]. Despite widespread infection across Europe, certain genotypes exhibit reduced susceptibility [26,27].
Although ash trees are rich in phenolic compounds, it remains unclear to what extent these metabolites are affected by H. fraxineus infection or whether they contribute to defence. To date, neither the biochemical mechanisms of infection nor the metabolic basis of potential resistance have been fully elucidated [28], which hampers efforts to identify and propagate resistant genotypes.
Several studies have identified potential candidate metabolites—both positively and negatively correlated with ash dieback susceptibility—including phenolic compounds [4,9,29,30,31,32]. Sidda et al. [32], for instance, proposed specific secoiridoids, such as P2/N2 methylglucooleoside or its isomer, rather than total compound groups, as potential biomarkers for susceptibility or tolerance. Nemesio-Gorriz et al. [4] examined the fungistatic properties of coumarins against H. fraxineus at physiologically relevant concentrations. In contrast, total polyphenolic content has also used as a marker of biological activity [8]. For example, in various plant species, total phenolic content has also been used as a general indicator of antioxidant capacity and defence activity against biotic stress, and it may also respond to microbial interactions in ash, e.g., [9,33,34,35]. However, many of these studies were conducted under controlled conditions, limiting their applicability or relevance for natural forest ecosystems. The need to transfer and test these findings under real-world conditions in mature forest stands has become increasingly evident.
In Germany, efforts to preserve F. excelsior as a native forest species have recently ben coordinated by the research network FraxForFuture [22]. As part of this initiative, 14 intensive monitoring plots (Intensivbeobachtungsflächen, IBF) were established in natural ash stands of across various federal states in Germany [22]. Tree health was assessed using a standardised damage scoring system developed by the research network [36,37].
In this study, we analysed variability in the phenolic compound contents of leaves from ash trees that differed in their degree of infestation. Samples were collected from the monitoring plots in up to four consecutive years (2019–2022). Depending on the analytical objectives, two complementary methods were applied: (1) Photometric determination of phenolic groups was used for a general vitality monitoring and included Folin-positive compounds (total phenols), vanillin-positive compounds, procyanidins, and ortho-dihydroxyphenols. (2) High-performance liquid chromatography (HPLC) was used to analyse individual low-molecular-weight phenolic compounds, such as phenolic acids, coumarins, and flavonoids [38]. Due to methodological constraints, highly polymerised phenolic compounds (e.g., lignins, lignans, and tannins) [7] were not targeted.
While photometric analysis of phenolic groups offers a faster and more practical approach for large-scale monitoring, individual phenolic profiling via HPLC provides detailed insights into compound-specific roles and behaviours. Identifying specific chemicals contributes to a better understanding of the biochemical interactions between Fraxinus excelsior and the ash dieback pathogen, Hymenoscyphus fraxineus. Therefore, if individual compounds prove to be relevant markers of susceptibility or resistance, HPLC analysis should also be considered as a valuable tool for monitoring.
The objectives of this study are as follows:
  • To determine the variation in foliar phenolic content in mature ash trees (in response to ash dieback).
  • To analyse how phenolic content varies with disease severity, year, and site.
  • To evaluate the suitability of different monitoring methods (photometric determination of groups or HPLC for individual phenols) for assessing ADB.

2. Materials and Methods

2.1. Monitoring Sites and Scoring

As part of the FraxForFuture project, we established 14 intensive monitoring plots (IBF) in nine federal states in Germany (Figure 1). During the vegetation period, all mature ashes (Fraxinus excelsior L.)were assessed in the summer of 2020 (MV1, Mecklenburg Western Pomerania; BB1, Brandenburg; SN1, Saxony; TH1, Thuringia; BY1 and BY2, Bavaria only), 2021 (all ashes, except at BW2, Baden-Württemberg), and 2022 (all ash trees). Langer et al. [22] characterised the plots in detail.
The crown damage of ash trees was classified according to the standardised summer assessment key [37]. The assessments focused on crown condition. In addition to defoliation, attention was paid to the condition of the light crown. This assessment is divided into seven levels of crown damage class (CDC). CDC 0 represents fully healthy trees with no typical ash dieback symptoms and a leaf loss of 0%–10%. CDC 1 describes trees with slightly reduced foliage due to ash dieback, without any dead shoot tips visible in the upper crown, and a leaf loss of 11%–25%. CDC 2 corresponds to trees with sparse foliage and initial typical ash dieback symptoms in the crown’s periphery, including browned dead shoot tips, and a leaf loss of 26%–60%. CDC 3 indicates more strongly thinned crowns from the outside, with possibly patchy remaining foliage at the shoot tips, numerous dead branches, and typical ash dieback symptoms, with a leaf loss of 61%–75%. CDC 4 denotes trees showing “dieback” progressing from the outside inward, with only the inner crown retaining patchy foliage, many dead branches, additional ash dieback symptoms, some still-foliated branches partially dead, and overall a dying tree, with a leaf loss of 76%–99%. Levels 5 and 6 summarise all dead trees, where 5 includes standing dead trees and 6 includes fallen trees. However, these two groups are not included in this analysis, as we collected the leaf material exclusively from living ash trees. Peters et al. [36,37] provide more detailed information on the performance of the assessments and the CDCs. It was possible to transfer the results obtained from assessments conducted prior to the development of the scoring key to the standardised key.

2.2. Sampling and Sample Handling

We collected leaf samples of monitored trees between mid-July and mid-August. When selecting the trees, we ensured an even distribution of the assessment levels as much as possible. Wherever possible, we sampled the same ash trees in subsequent years. Permission for sampling was granted by the respective forest administrations; no additional permits were required. Table 1 provides an overview of the number of samples analysed for each IBF for all years of investigation.
We harvested leaf material mainly by shooting branches with a modified shotgun. Sampling in Bavaria (BY1, BY2, BY3) was conducted using a cherry picker throughout. In 2021, the leaves were harvested at IBF SN1 by slinging and at plot MV1 by climbers. We collected leaf material only from the sunlit canopy. From each branch, a mixed sample of leaves was taken to ensure a representative sample, rather than only the oldest or youngest leaves. The number of leaves per branch varied depending on the dry weight required for the analyses. Collected leaves were immediately transferred to 50 mL tubes and stored on dry ice during sampling. They were stored at −80 °C until further use at the laboratory.

2.3. Lyophilisation and Weighing

For the analyses, the material was shock-frozen in steel containers with steel balls in liquid nitrogen and ground in a laboratory ball mill (MM 200, Retsch, Haan, Germany) for 3 min at 20 rps (revolutions per second). We transferred the powder to a non-sealing Petri dish (diameter 3.5 cm) and lyophilised it for 48 h (DW-10N Desktop Freeze Dryer, Drawell, Shanghai, China). We stored the lyophilised powder in a desiccator with a drying agent under vacuum at −20 °C until analysis. The sample material required for HPLC was transferred from the State Forestry Institute Brandenburg to the Humboldt-Universität zu Berlin in a cool box and stored at −20 °C until analysis. For analysis, we brought the material to room temperature in the desiccator, which we opened shortly before weighing.
For all photometric investigations, 30 ± 0.3 mg were weighed into 2.0 mL reaction vessels and stored at −20 °C until analysis. For HPLC analysis, 20 ± 0.2 mg were weighed into reaction vessels and stored at room temperature in a desiccator before extraction. The exact weightings were used for further calculations.

2.4. Methanolic Extraction of Lyophilised Samples for Photometric Analysis

Following the method of Lunderstädt and Ahlers [39], we performed an aqueous-methanolic extraction of the lyophilised material to determine the phenolic components, which were measured with a photometer.
For this, the lyophilised material (30 mg) was mixed with 1.0 mL of 50% (v/v) methanol and extracted at 60 °C by shaking at 1400 rpm (revolutions per minute) in a Thermomixer (ThermoMixer C, Eppendorf, Hamburg, Germany) for 20 min. Immediately afterward, we centrifuged the sample at 14,000 rpm and room temperature for five minutes and then collected the supernatant. The supernatant was filtered through a Pasteur pipette (150 mm) filled with half a glass fibre filter (diameter 24 mm, Filter Discs Grade 132, Sartorius, Göttingen, Germany) into a test tube. This process was repeated—adding methanol until filtration—three times with lyophilisate. We thoroughly mixed the combined total extract by shaking in a hand shaker, and we determined the total volume. The remaining extract was stored at −80 °C for further use. The extraction factor (f) was calculated as the ratio of total extract volume [mL] to sample weight [mg], which is essential for subsequent analyses. The dilution factor (F) was used for calculating concentrations of the extracted compounds and was determined as the ratio of total volume of the assay [mL] to the volume of methanolic extract used [mL] (1).
F = t o t a l   v o l u m e   o f   t h e   a s s a y   [ µ L ] u s e d   m e t h a n o l i c   e x t r a c t   q u a n t i t y   [ µ L ]

2.5. Analysis of Phenols

2.5.1. Total Phenolic Content (Folin-Positive Compounds, TPH)

We modified the method described by Swain and Hillis [40] for the determination of total phenols. In total, 100 µL of the methanolic extract was mixed with 2.75 mL di-deionised water. In total, 2.0 mL of 2% (w/v) sodium carbonate in 0.1 M sodium hydroxide and 100 µL Folin–Ciocalteu reagent were added. For the blank, 100 µL methanol (50% v/v) was used. We vigorously shook the mixture with a rotary shaker and placed it in a darkened water bath at 60 °C for 10 min. After cooling it to room temperature, we measured the absorbance at 750 nm (A750) on the spectrophotometer against the blank value. We therefore used a catechin solution of 50 mg catechin dissolved in 2 mL absolute ethanol and topped up to 10 mL with di-deionised water. The resulting unit from the calculations is µmol per mg DM (dry mass).
We determined the content of Folin-positive compounds using a calibration curve based on a linear relationship (2):
c µ m o l / g D M = A 750 n × m × f × F
n—x-intercept.
m—slope.
For TPH, F was calculated as shown in Equation (3):
F = 4.95 mL ⁄ 0.1 mL = 49.5

2.5.2. Vanillin-Positive Compounds (VAN)

The determination of vanillin-positive compounds, as described by Broadhurst and Jones [41], was modified. In total, 100 µL of the methanolic extract was mixed with 2.0 mL of 4% vanillin solution (10 g vanillin in 250 mL pure methanol) and 1 mL concentrated hydrochloric acid (fuming). For the blank value, we used 100 µL methanol (50% v/v) instead of the extract. The reaction took place for 10 min at 30 °C in a darkened water bath. We then measured the absorbance at 500 nm (A500). The catechin solution used for the total phenols served as the basis for the calibration curve (1, 2, 4). The resulting unit from the calculations is µmol per g DM.
F = 3.1 mL ⁄ 0.1 mL = 31

2.5.3. Procyanidins (PC)

We modified the determination of procyanidins as described by Stafford and Cheng [42]. For the quantification of procyanidins, 200 µL of the methanolic extract was pipetted into a test tube and air-dried. We dissolved the residue in 2.0 mL of 5% hydrochloric acid (10 mL concentrated HCl in 190 mL n-butanol) for 30 min at room temperature while shaking it (420 rpm). The reaction occurred at 95 °C for 30 min in a water bath. We shook the mixture again for 30 min at room temperature and 420 rpm. The absorbance was measured at 550 nm (A550).
The phenolic content was determined using a calibration curve (1, 2, 5). The resulting unit from the calculations is µmol per g DM.
F = 2.0 mL ⁄ 0.2 mL = 10

2.5.4. Ortho-Dihydroxyphenols (ODHP)

The determination of ortho-dihydroxyphenols, as described by Arnow [43], was modified. We prepared Arnow’s reagent by dissolving 25 g sodium nitrite and 25 g sodium molybdate in di-deionised water for a final volume of 250 mL. In total, 100 µL of the methanolic extract was mixed with 250 µL of 0.5 M hydrochloric acid (5 mL concentrated HCl in 95 mL di-deionised water), 250 µL Arnow’s reagent, and 500 µL 1 M sodium hydroxide (8 g NaOH in 200 mL di-deionised water). For the blank value, we used 100 µL methanol (50% v/v) instead of the extract. The absorbance was measured at 520 nm (A520) within 10 min. For the calibration solution, 20 mg chlorogenic acid was dissolved in 20 mL di-deionised water.
We determined the phenolic content using a calibration curve (1, 2, 6). The resulting unit from the calculations is µmol per g DM.
F = 1.1 mL ⁄ 0.1 mL = 11
To monitor analytical consistency over time, we included internal reference samples in all photometric measurements. These samples were derived from the homogenised material of selected trees and were processed alongside experimental samples across all assays. When necessary, newly prepared reference samples were run in parallel with the previous ones to ensure continuity.

2.5.5. Individual Phenolic Compounds (HPLC Analysis)

Phenolic compounds were extracted as described by Förster et al. [44]. In brief, we extracted 20 mg powdered leaf material with 300 µL of 70% methanol (pH 4, acetic acid) in an ultrasonic bath on ice for 15 min. In total, 100 µL of 4-methoxycinnamic acid (1 mM) as internal standard was added at the first extraction step. After centrifugation at 10,000 rpm at 4 °C for five minutes and the collection of the supernatant, the pellet was reextracted twice with 300 µL 70% methanol. We combined and concentrated the supernatants by a vacuum concentrator. The samples were redissolved in 50% methanol, filled up to 1 mL, filtered (0.22 µm), transferred to HPLC vials, and stored at −20 °C before analysis.
We carried out the qualitative and quantitative analysis of phenolic compounds using HPLC at 290 nm (Ultimate 3000 equipped with an autosampler WPS-3000TR, pump LPG-3400RS, column compartment TCC-3000RS, diode array detector DAD-3000RS, Thermo Scientific, Dreieich, Germany; for HPLC conditions, see [44]). Selected samples were analysed using HPLC-MS, the same HPLC system coupled to a Thermo Scientific LXQ ESI-Ion Trap mass spectrometer (Thermo Scientific, Dreieich, Germany). We performed MS/MS in the negative ionisation mode and recorded mass spectra in the range from m/z 140–2000. Instrument control and data processing were performed with Thermo Xcalibur Version 2.2 SP1.48. Compound identification was based on specific UV-spectra, retention time, MS-fragmentation pattern, and, if available, comparison to reference compounds. We calculated amounts of compounds [mg/g DM] based on their peak area in relation to the internal standard. The following standard compounds were available and were used for quantification of response factors (RFs), correcting for absorbance difference: chlorogenic acid (RF 2.19), 8-hydroxypinoresinol-4-glucoside (RF 5.44), isoquercetin (RF 2.97), kaempferol-3-glucoside (RF 2.82), kaempferol-3-rutinoside (RF 2.07), ligstroside (RF 26.92), neochlorogenic acid (RF 2.0), oleuropein (RF 10.24), pinoresinol-4-glucoside (6.71), rutin (RF 2.25), and verbascoside (RF 1.38). For unidentified compounds, or if no standard was available, we set the RF as 1. Some minor phenols were not calculated for each sampling year due to detection difficulties.

2.6. Data Processing and Evaluation

2.6.1. Calculation of Phenolic Groups

To compare the phenolic groups with the individual phenolic compounds measured using HPLC, the contents of the groups were determined using the molar masses of catechin (290.26 g/mol; TPH, VAN, PC) and chlorogenic acid (354.31 g/mol; ODHP), as shown in Equation (7).
w m g / g   D M = c µ m o l / g   D M × M [ g / m o l ] × 10 3

2.6.2. Data Integration and Statistical Analyses

The dataset consists of results from phenolic groups and individual phenolic compounds, as well as monitoring data. We computed statistical calculations with SPSS version 25.0 and 29.0 (correlations, pairwise comparisons, Kruskal–Wallis test, and Dunn-Bonferroni test) and SAS 9.4 (three-way ANOVA on ranks for main and interaction effects). The correlation of phenolic groups and individual phenolic compounds was calculated using the full database, spanning all years and monitoring plots, while a three-way ANOVA was performed on data from 2020 to 2022 across all plots.
We conducted a correlation analysis of phenolic parameters with Spearman’s rank correlation coefficient. Measurements of the effect size for main and interaction effects are represented by semi-partial omega-squared. Particular comparisons of monitoring plots, sampling years, and CDCs were carried out on selected datasets from the database to exclude the factors location and year, respectively. We conducted a comparison of monitoring plots on data from 2021, as this was the most comprehensive dataset available for analysis. For the comparisons of sampling years and damage scores, respectively, we selected monitoring plot BB1 because the largest dataset was available for this plot (Table 1). Tests for significance between different monitoring plots, sampling years, and damage scores were performed using a nonparametric Kruskal–Wallis test with Bonferroni correction.
We generated heat maps using MetaboAnalyst 6.0. Data were normalised by mean-centering and dividing by the standard deviation of each variable. For an illustration of the comparison of years, as well as of damage scores, we selected only the variables with data available in all four years.

3. Results

3.1. General Overview of Phenolic Contents

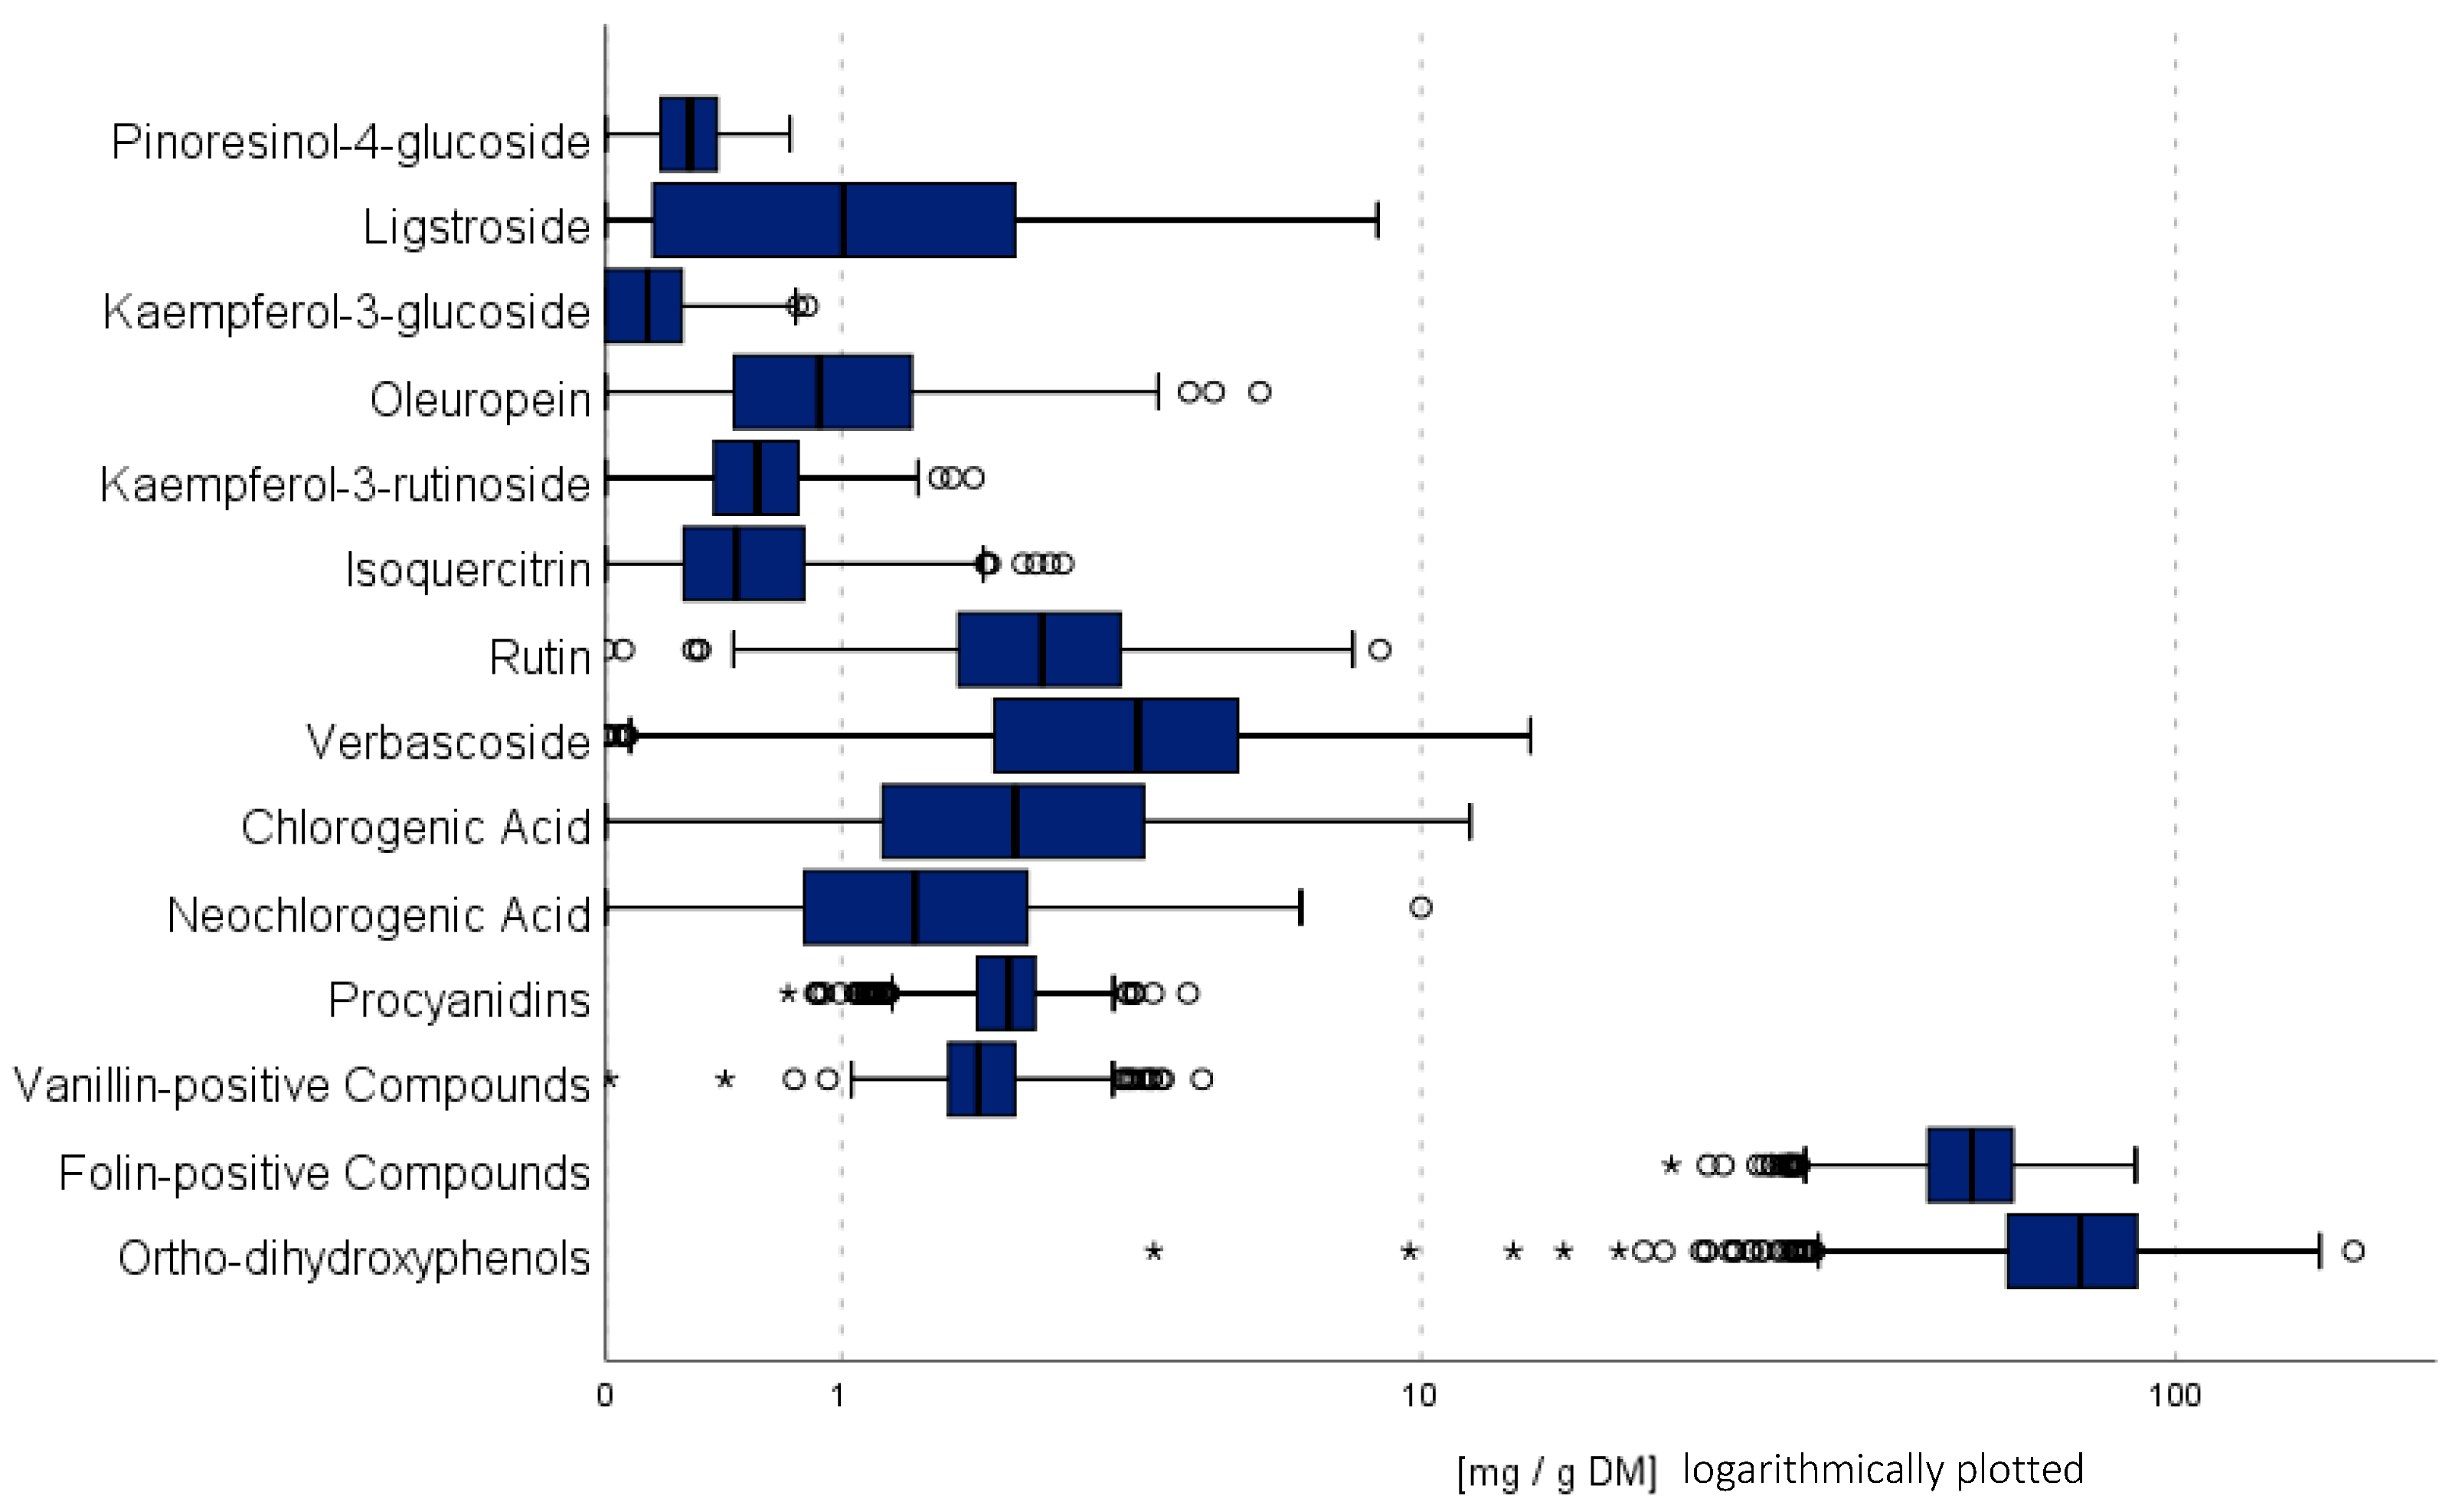
We analysed 860 samples per phenolic group in this study. The number of samples for the individual phenolic compounds was mostly lower than for the groups (see Table 1). To aid the interpretation of the results, Figure 2 provides an overview of the content distribution using box plots. Both phenolic groups and individual phenolic compounds identified using HPLC were considered. Only for this overall comparison, phenolic groups were converted from µmol g−1 DM to mg g−1 DM using the molecular weights of the respective calibration standards, as described in the Materials and Methods section.
Ortho-dihydroxyphenols (ODHP) were found in a very wide content range, with a minimum of 4.01 mg/g DM and a maximum of 169.39 mg/g DM. The average content was 75.36 mg/g DM. Folin-positive compounds (TPH) ranged from 21.94 to 88.80 mg/g DM, with a mean of 54.62 mg/g DM, which was lower than the mean of ODHP content. In contrast, the procyanidins (PC) and vanillin-positive compounds (VAN) showed contents only slightly above the detection limit. Contents of ODHP and TPH were approximately ten times higher than those of all other quantified phenolic compounds. The minimum contents of VAN and PC were 0.01 mg/g DM and 0.71 mg/g DM, respectively. Their maximum contents were 4.77 mg/g DM (VAN) and 4.54 mg/g DM (PC), while average values were 2.07 mg/g DM for VAN and 2.26 mg/g DM for PC. The contents of phenolic groups were less precise than those of individual phenolic compounds, as group values were calculated based on a single reference standard.
HPLC analysis identified phenolic compounds from different structural groups (Figure S1 in Supplementary Materials). From the group of flavonoids, quercetin and kaempferol derivatives were detected. Among them, rutin showed the highest content (up to 8.7 mg/g DM, mean value 2.7 mg/g DM). Isoquercitrin reached up to 2.8 mg/g DM (mean 0.6 mg/g DM), kaempferol-3-rutinoside up to 1.9 mg/g DM (mean 0.9 mg/g DM), and kaempferol-3-glucoside up to 0.8 mg/g DM (mean 0.2 mg/g DM). Two lignans were identified in the leaves, pinoresinol-4-glucoside and 8-hydroxypinoresinol-glucoside, with maximum contents of 0.7 and 0.5 mg/g DM and mean values of 0.3 and 0.2 mg/g DM, respectively. Among the phenolic acids, chlorogenic and neochlorogenic acid were found, with maximum contents of 11.7 and 10.0 mg/g DM and mean values of 2.7 and 1.7 mg/g DM, respectively. Cryptochlorogenic acid was also detected in some samples, but could not be quantified consistently due to its similar retention time to neochlorogenic acid. The highest content among all of the identified metabolites was found for verbascoside, a phenylethanoid glycoside, with a maximum of 14.1 mg/g DM and a mean of 3.9 mg/g DM. Additionally, two secoiridoid glycosides were detected, ligstroside and oleuropein, with maximum contents of 8.7 and 5.8 mg/g DM, respectively. In addition to these compounds, several peaks could not be clearly identified, and, therefore, they are referred to as ‘unknown’ in the following sections.

3.2. Variability of Phenolic Groups

We were able to examine general trends or correlations between phenolic content and CDC, which could also be analysed by year and plot.
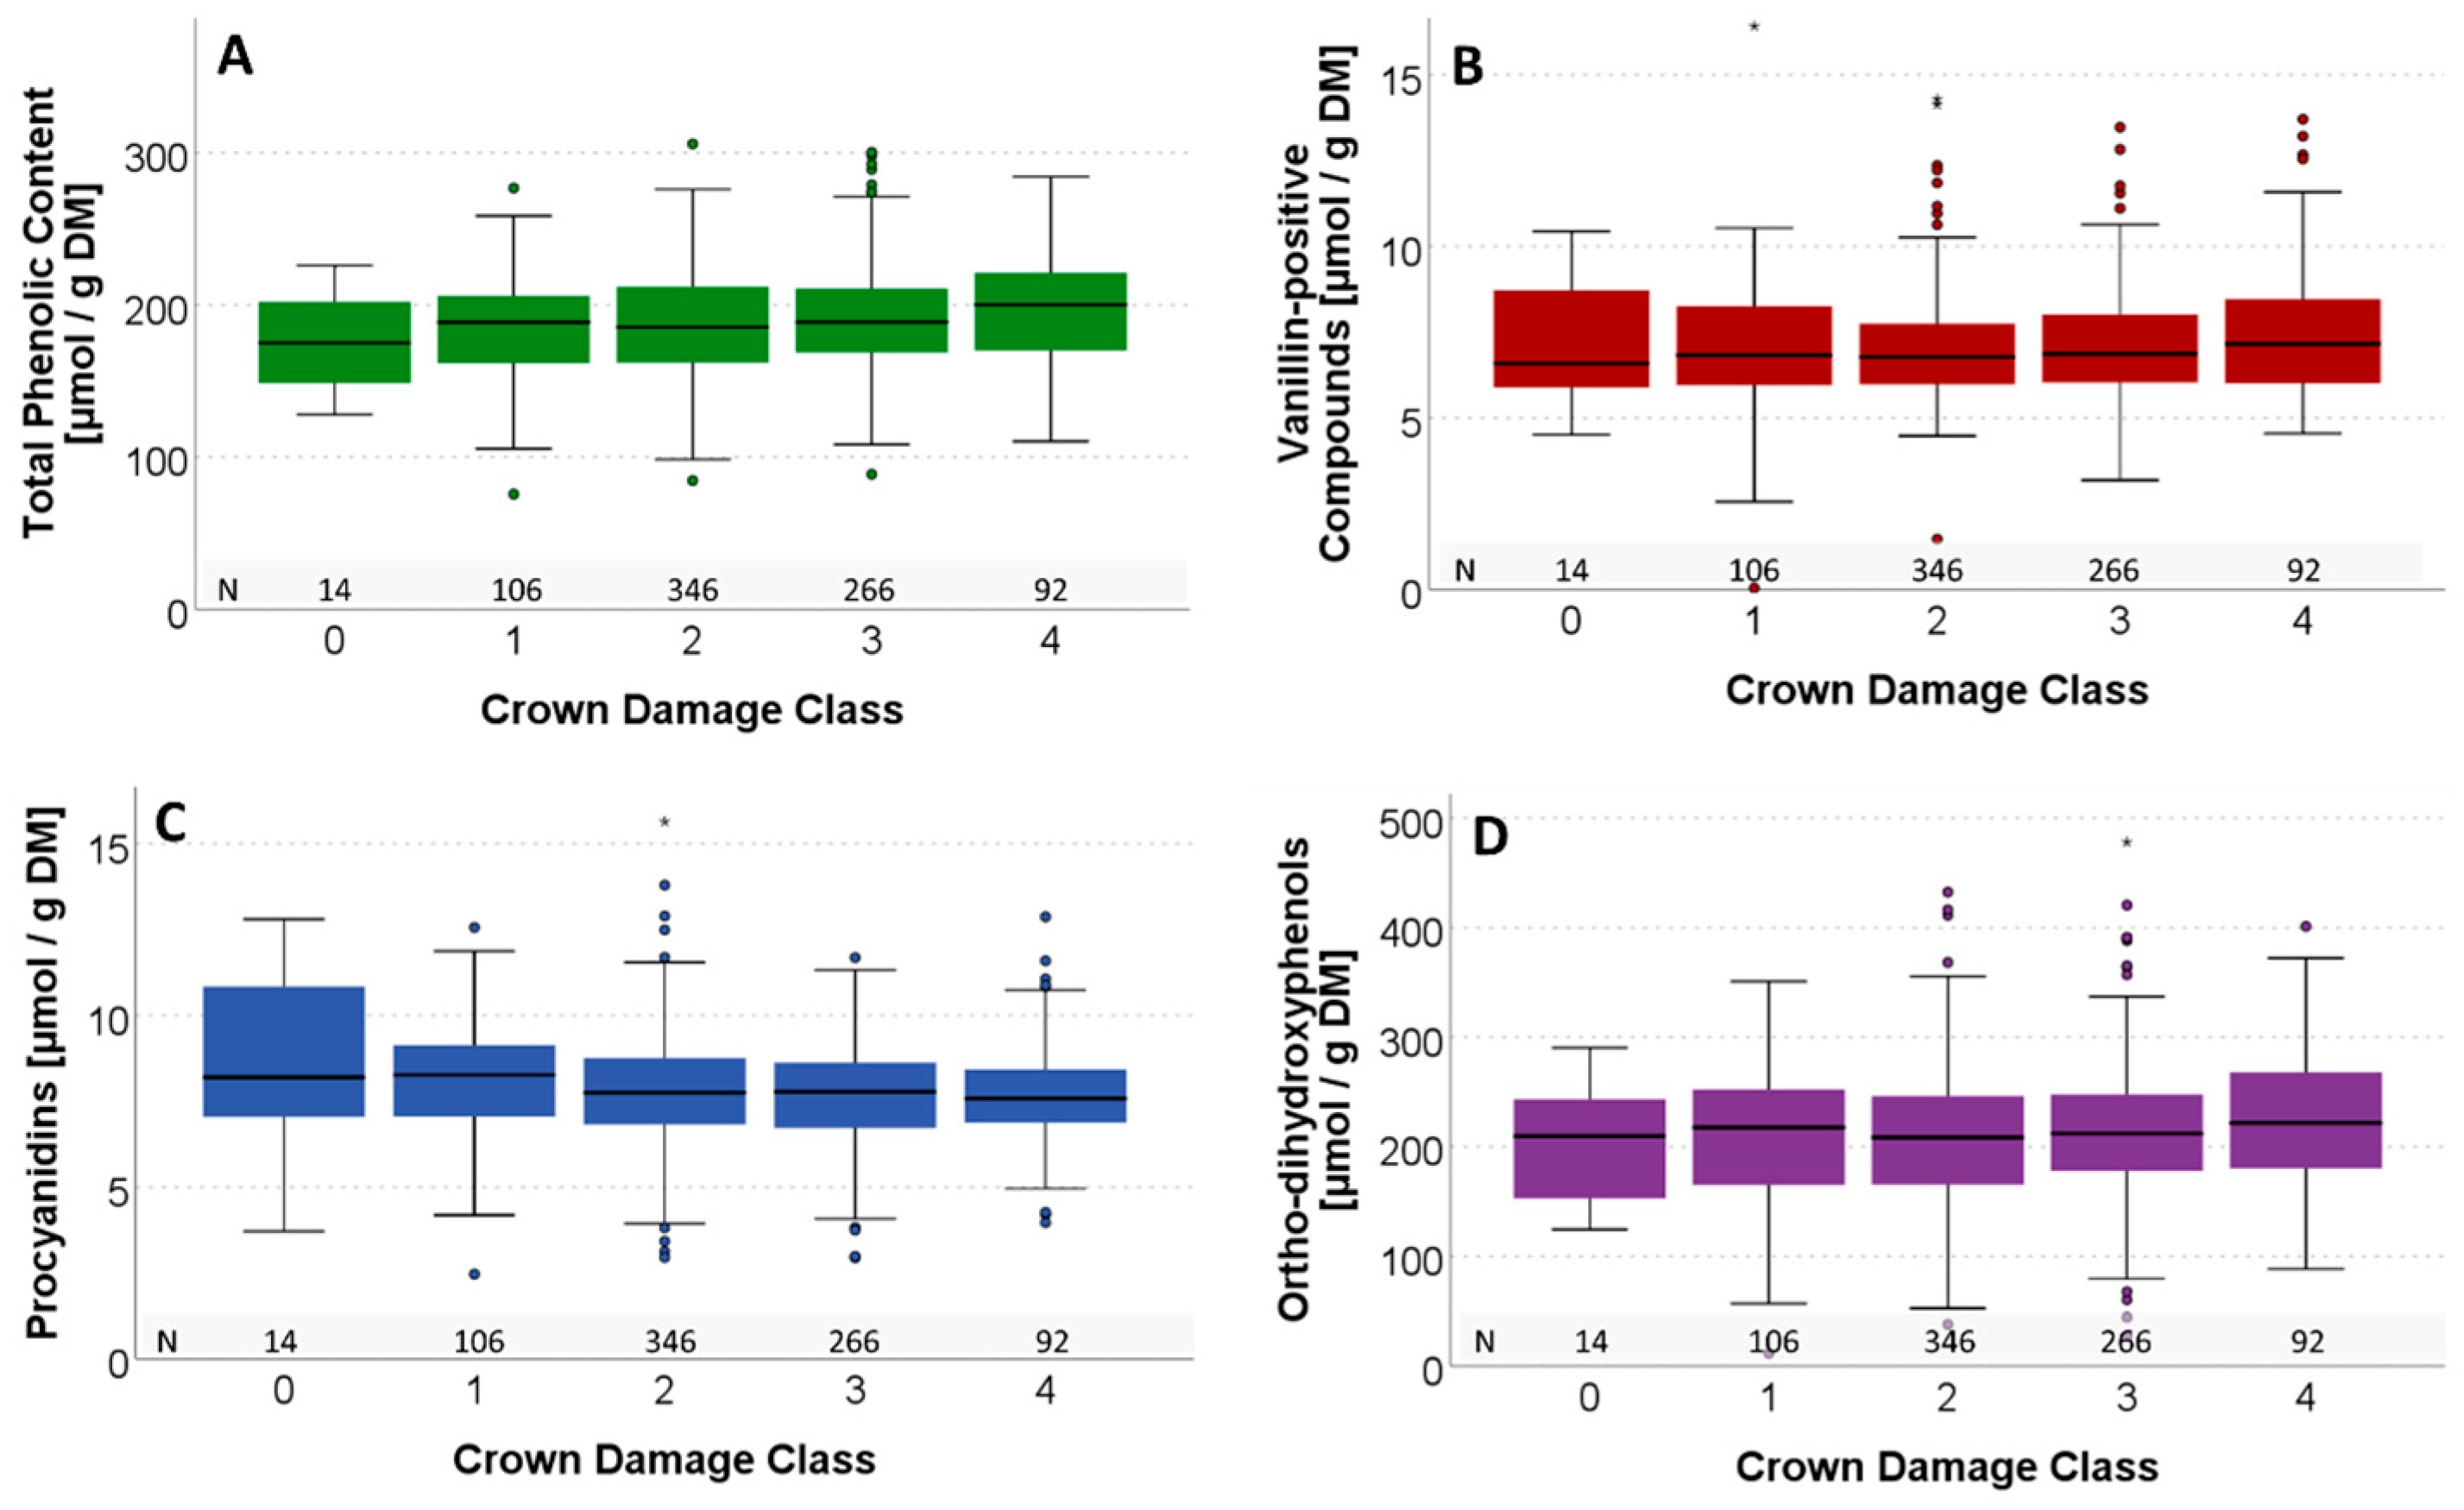
Figure 3 illustrates the distribution of the contents of the various phenolic groups in the five CDCs across all years and sites. No clear differences between the crown levels were detected (TPH p = 0.070; VAN p = 0.464; PC p = 0.057; ODHP p = 0.401). TPH and ODHP displayed a slight upward trend, while PC exhibited a slight downward trend. Data for individual years and sites can are provided in Figures S2 and S3 in Supplementary Materials.
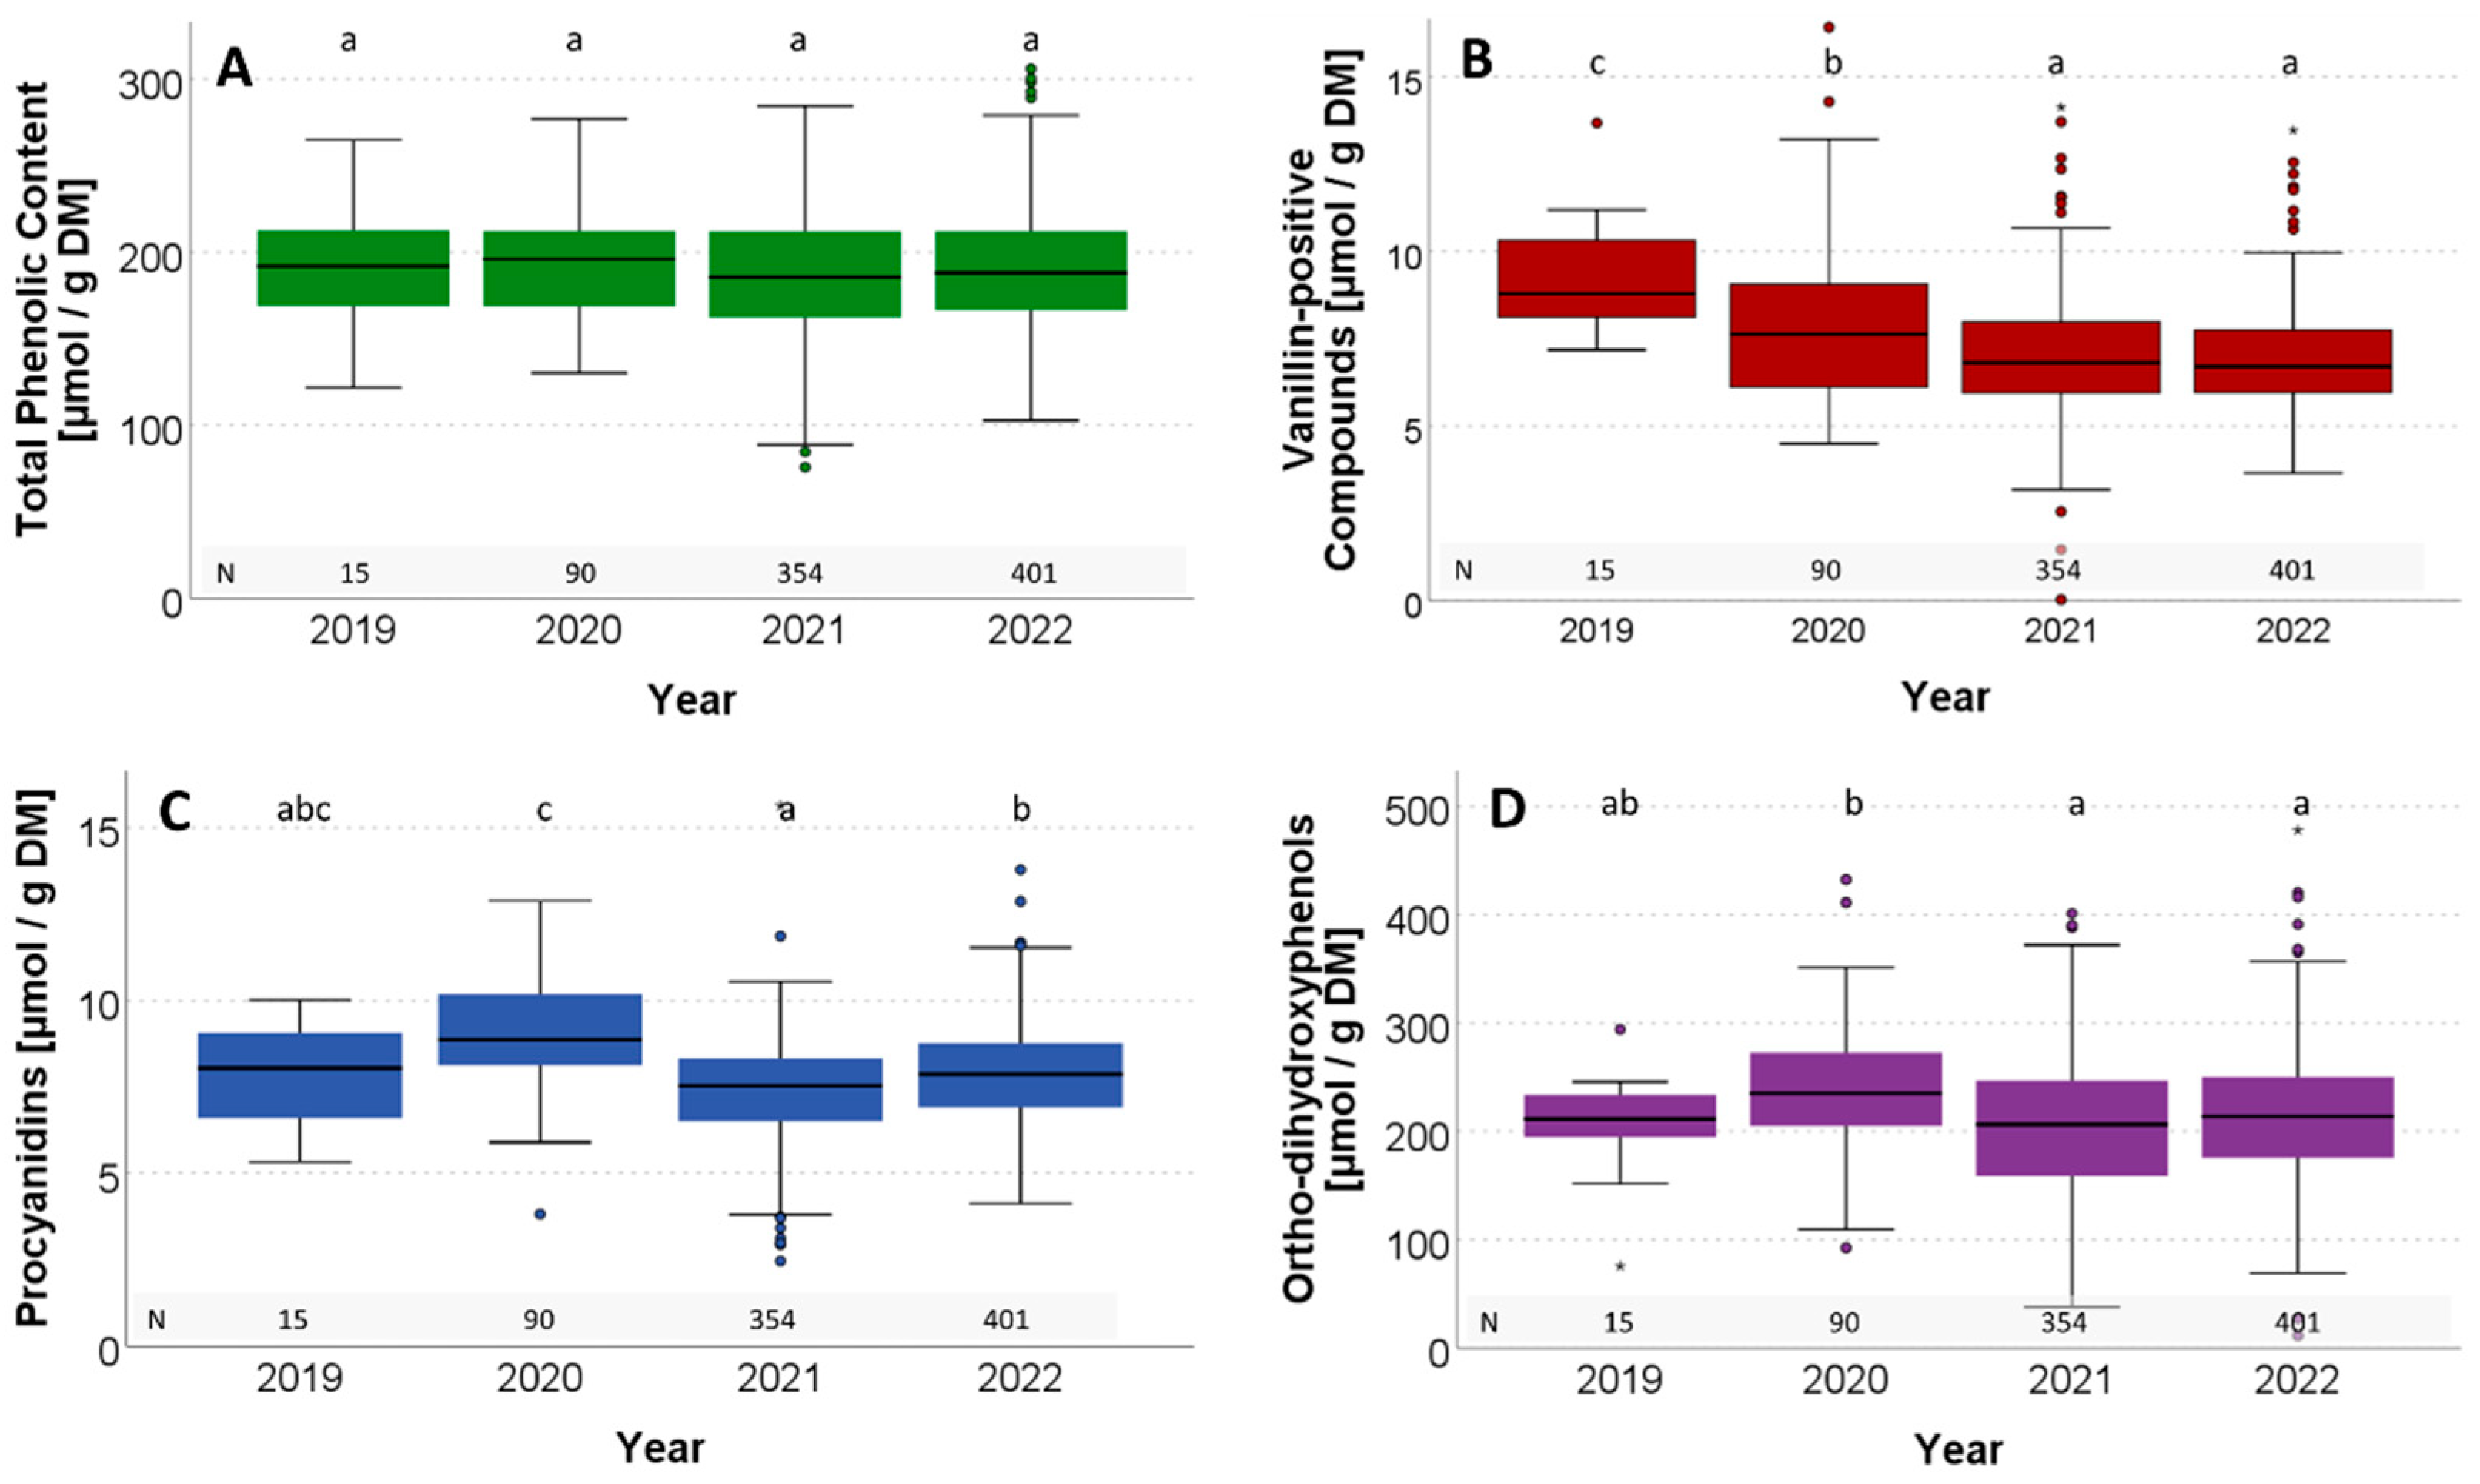
A comparison of the phenolic content across the four consecutive observation years showed compound-specific variation (Figure 4). It is important to note that only the Brandenburg plot was included in the 2019 sampling. TPH remained largely stable across years. VAN declined continuously, although no significant drop was observed between 2021 and 2022. PC contents in 2019 were comparable to other years, but highly significant shifts (p < 0.001) occurred in the subsequent periods. ODHP peaked in 2020, with contents in 2021 and 2022 significantly lower than in that year.
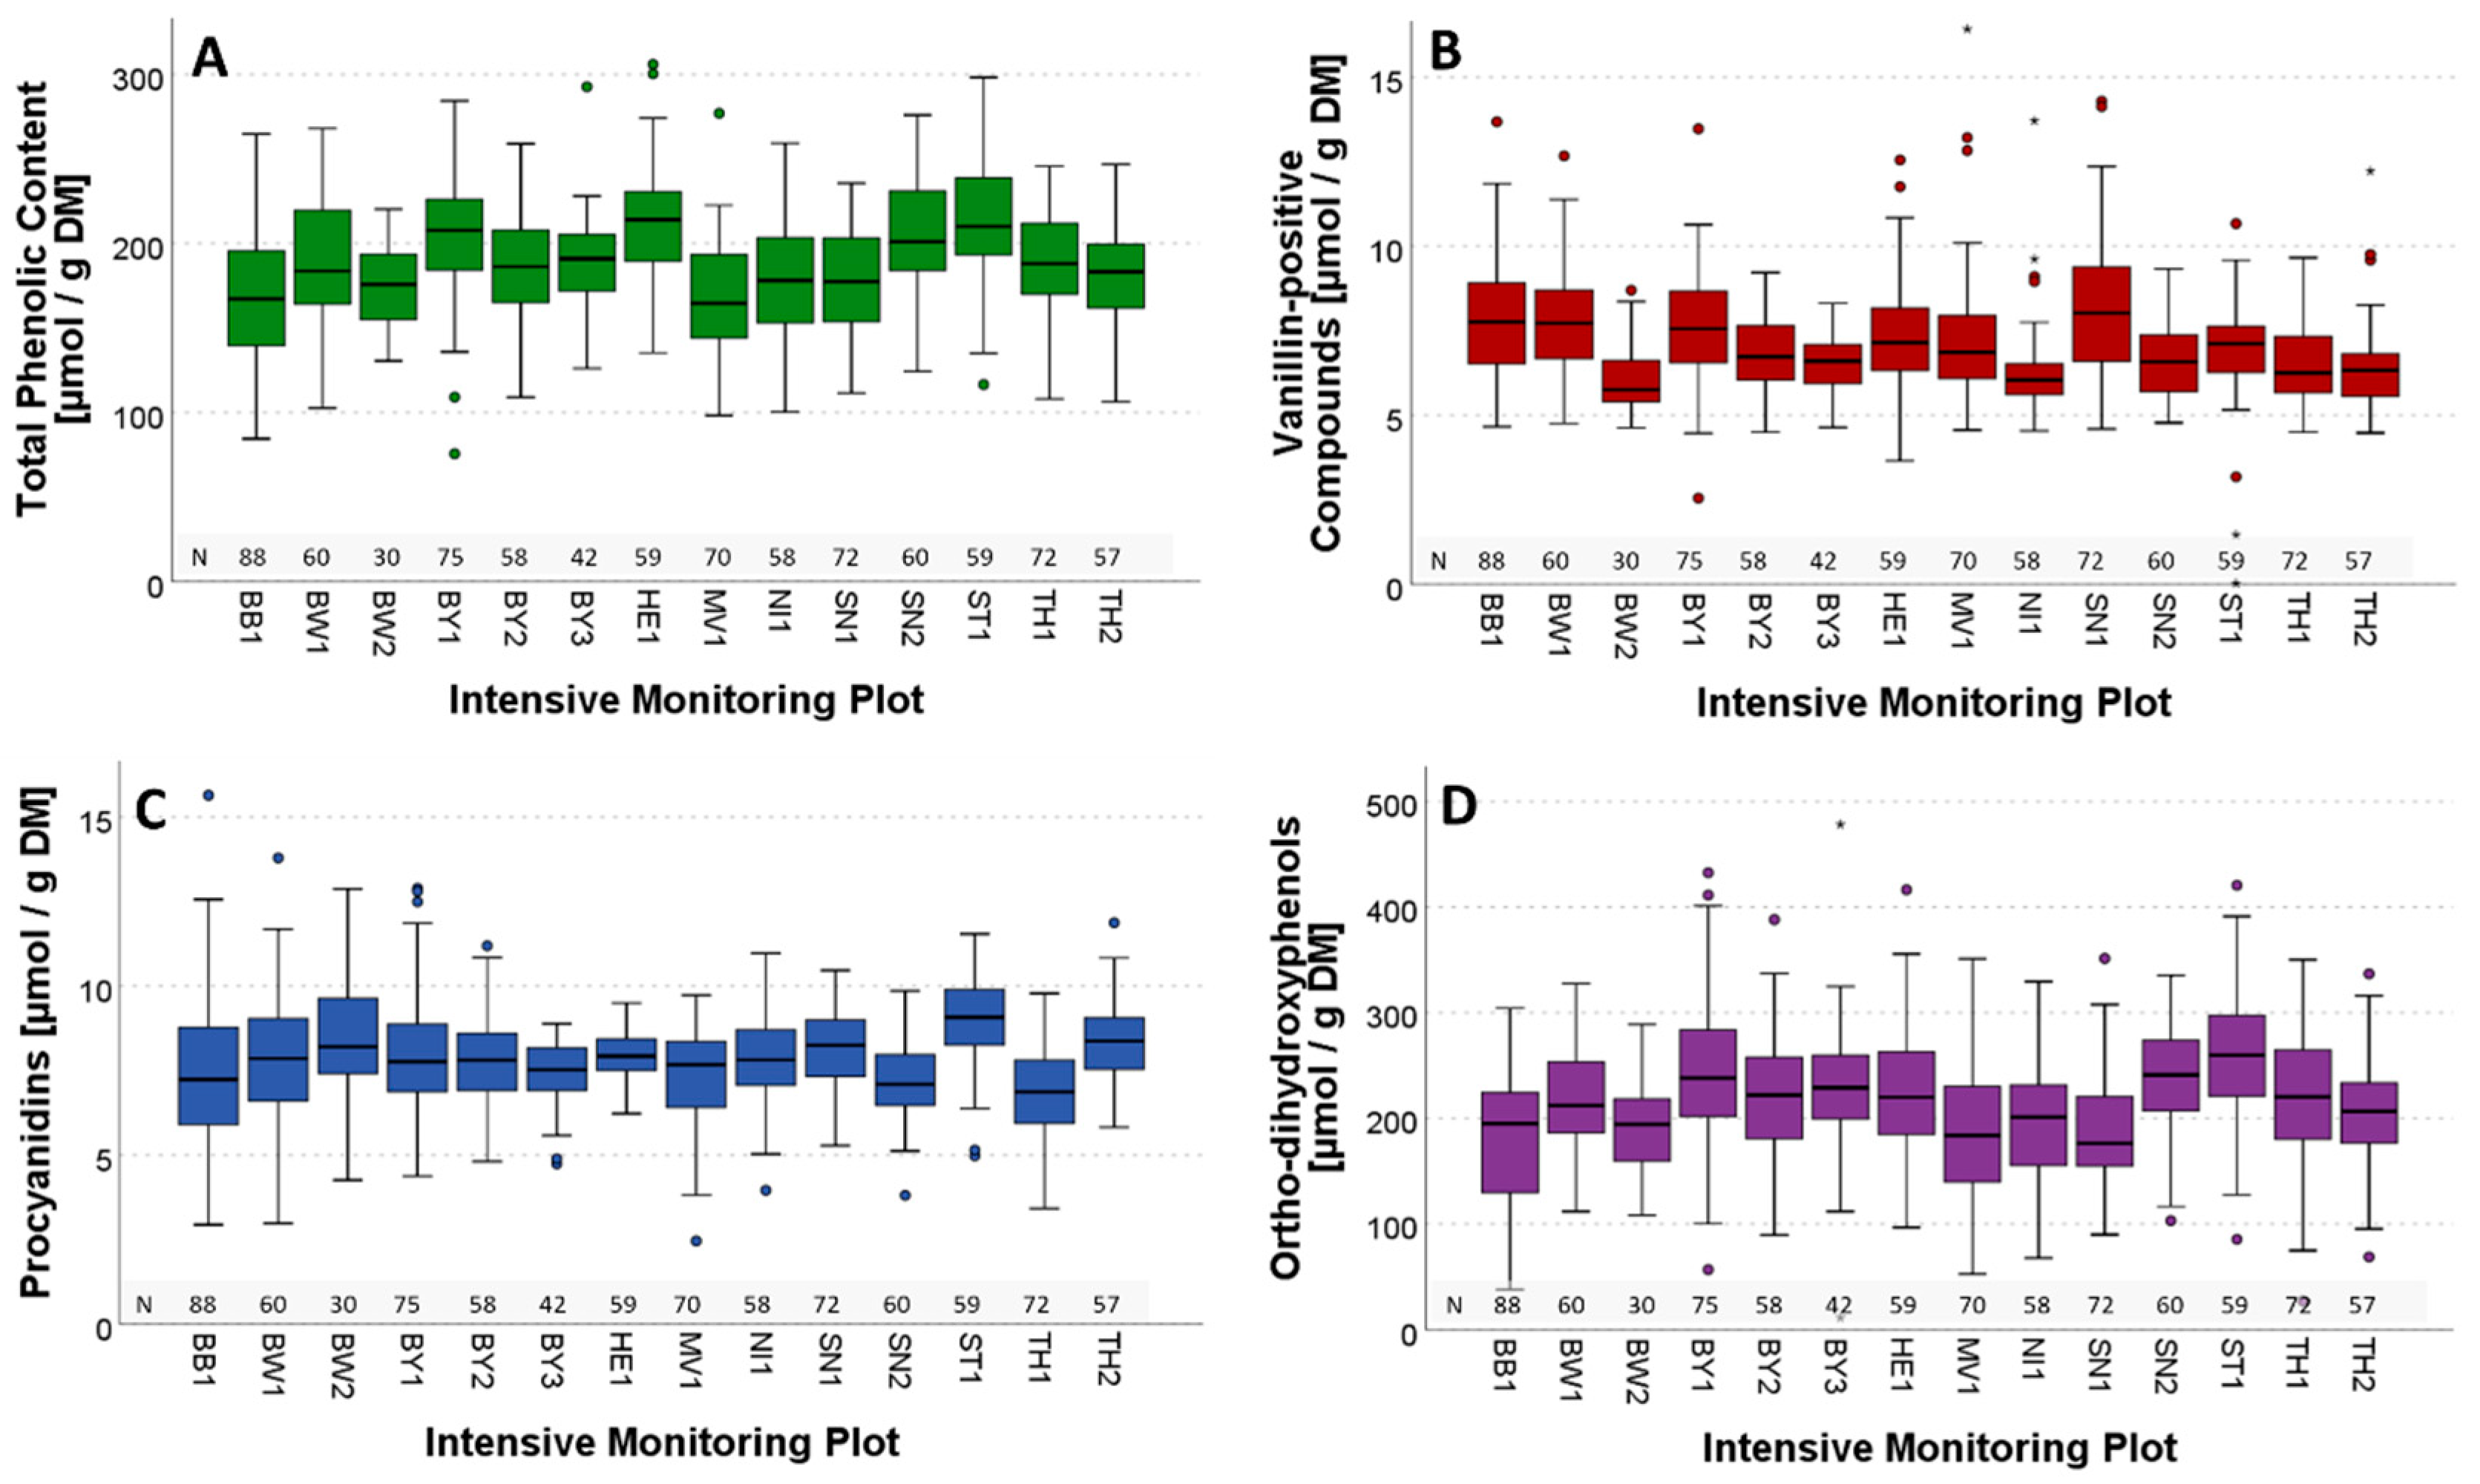
Figure 5 provides an overview of the influence of location on phenolic group contents. Significant differences are not labelled in Figure 5 for clarity. The plots with significant differences are shown in Tables S1–S4 in Supplementary Materials. The results varied across phenolic groups, although TPH and ODHP displayed very similar overall trends. For TPH, 32 pairwise comparisons revealed strong contrasts between sites. Plots ST1 and HE1 differed the most, with ash trees (Fraxinus excelsior L.) having significantly higher phenolic contents than trees in nine other plots. The mean values of ashes at ST1 and HE1 were 213.4 and 213.3 µmol/g DM, respectively. In contrast, ashes at MV1 and BB1 had contents of 167.6 and 168.1 µmol/g DM, respectively. The TPH content of ashes at BY3 was in the mid-range (mean value 190.5 µmol/g DM), meaning that this plot did not differ from any other. A total of 30 significant differences were observed in VAN contents. Here, SN1 had significantly higher contents (mean value 8.2 µmol/g DM) than eight other plots. BY2 and ST1 only differed from NI1. Ashes at NI1 had the lowest VAN content with a mean value of 6.3 µmol/g DM. The site effect was weaker for PC (20 contrasts). ST1 displayed the highest contents (mean value 9.0 µmol/g DM), exceeding those at ten other sites. In contrast, ash trees at the TH1 plot exhibited the lowest content (mean value 6.9 µmol/g DM), significantly below seven other sites. ODHP differed in 27 pairwise comparisons. Once again, ashes at ST1 stood out with the highest contents, with a mean value of 263.5 µmol/g DM, and differed from nine other plots. The examples demonstrate the influence of location on the composition of the phenolic groups.

3.3. Correlation of Phenolic Groups and Individual Phenolic Compounds

The question arose as to whether the phenolic groups were suitable for monitoring ADB. A comparison with the individual phenolic compounds analysed using HPLC was therefore deemed appropriate. As a first step, we identified which individual phenolic compounds were correlated with the phenolic groups.
We conducted a correlation analysis between all phenolic groups and individual metabolites. The ten highest correlations per parameter are illustrated in Table 2. TPH and ODHP were found to be highly correlated with each other. Among the individual phenolic compounds, TPH showed the strongest correlations (all ρ > 0.5) with chlorogenic acid, rutin, isoquercitrin, unknown-623, verbascoside, kaempferol-3-rutinoside, unknown-17, unknown-01, and unknown-371. Similarly, ODHP exhibited high correlations (ρ > 0.5) with verbascoside, chlorogenic acid, unknown-623, unknown-731, rutin, unknown-371-01, unknown-02, unknown-04, and unknown-17. In contrast, PC and VAN showed weaker associations, with correlation coefficients below 0.5 and 0.4, respectively. PC displayed its highest correlation with verbascoside. The strongest correlation observed for VAN was with rutin (correlation coefficient: 0.347).

3.4. Analysis of Main and Interaction Effects of Location, Year, and Damage Score

3.4.1. Overall Analysis

We analysed the influence of the recorded parameters (location, year, and CDC) on all phenolic groups and individual phenolic compounds to determine which had the strongest effect on each compound. Since the phenolic groups were analysed collectively and no post hoc tests were performed, the results may differ from those in Section 3.2. Nevertheless, this approach allowed us to identify the variables with the strongest influence on the phenolic compounds.
The results of the analysis are summarised in Table 3. For more than half of the parameters, location had the strongest effect. For example, location explained up to 12.6% of the variance in unknown-04 and 25.2% in unknown-14, both with p < 0.001 (the latter was observed only in 2021).
Some phenolics were primarily influenced by year (Kaempferol-3-glucoside 5.8%, Ligstroside 6.8%, unknown-13 6.2%, unknown-15 10.4%, and unknown-371-03 8.5%, all p < 0.001). Several phenolics showed the strongest effects from the interaction between location and year, with the highest impact observed for unknown-12 (13.7%, p < 0.001). The effects of location (L), year (Y), and their interaction (L x Y) were significant for most parameters: L in 35, Y in 26, and L x Y in 31 out of 36 cases. CDC had a significant effect on only six parameters (unknown-15, -16, -342, -371-01, -371-03, and -731). In contrast, ten parameters showed negative effect sizes, indicating no meaningful impact. A significant interaction between L and CDC was found for six phenolics (TPH, ODHP, unknown-01, -04, aesculin-like, and unknown-371-03), although these effects were smaller than the individual effect of location. Y × CDC interactions were significant for two phenolics: ODHP (with a slightly stronger effect than year alone) and unknown-551 (with a weaker effect than either year or CDC alone). Their three-way interaction (location × year × CDC) was significant for two phenolics (TPH and unknown-719), but the effect sizes were again much smaller than those of the main effects. For unknown-755, none of the factors had a significant effect.

3.4.2. Comparison of Monitoring Plots

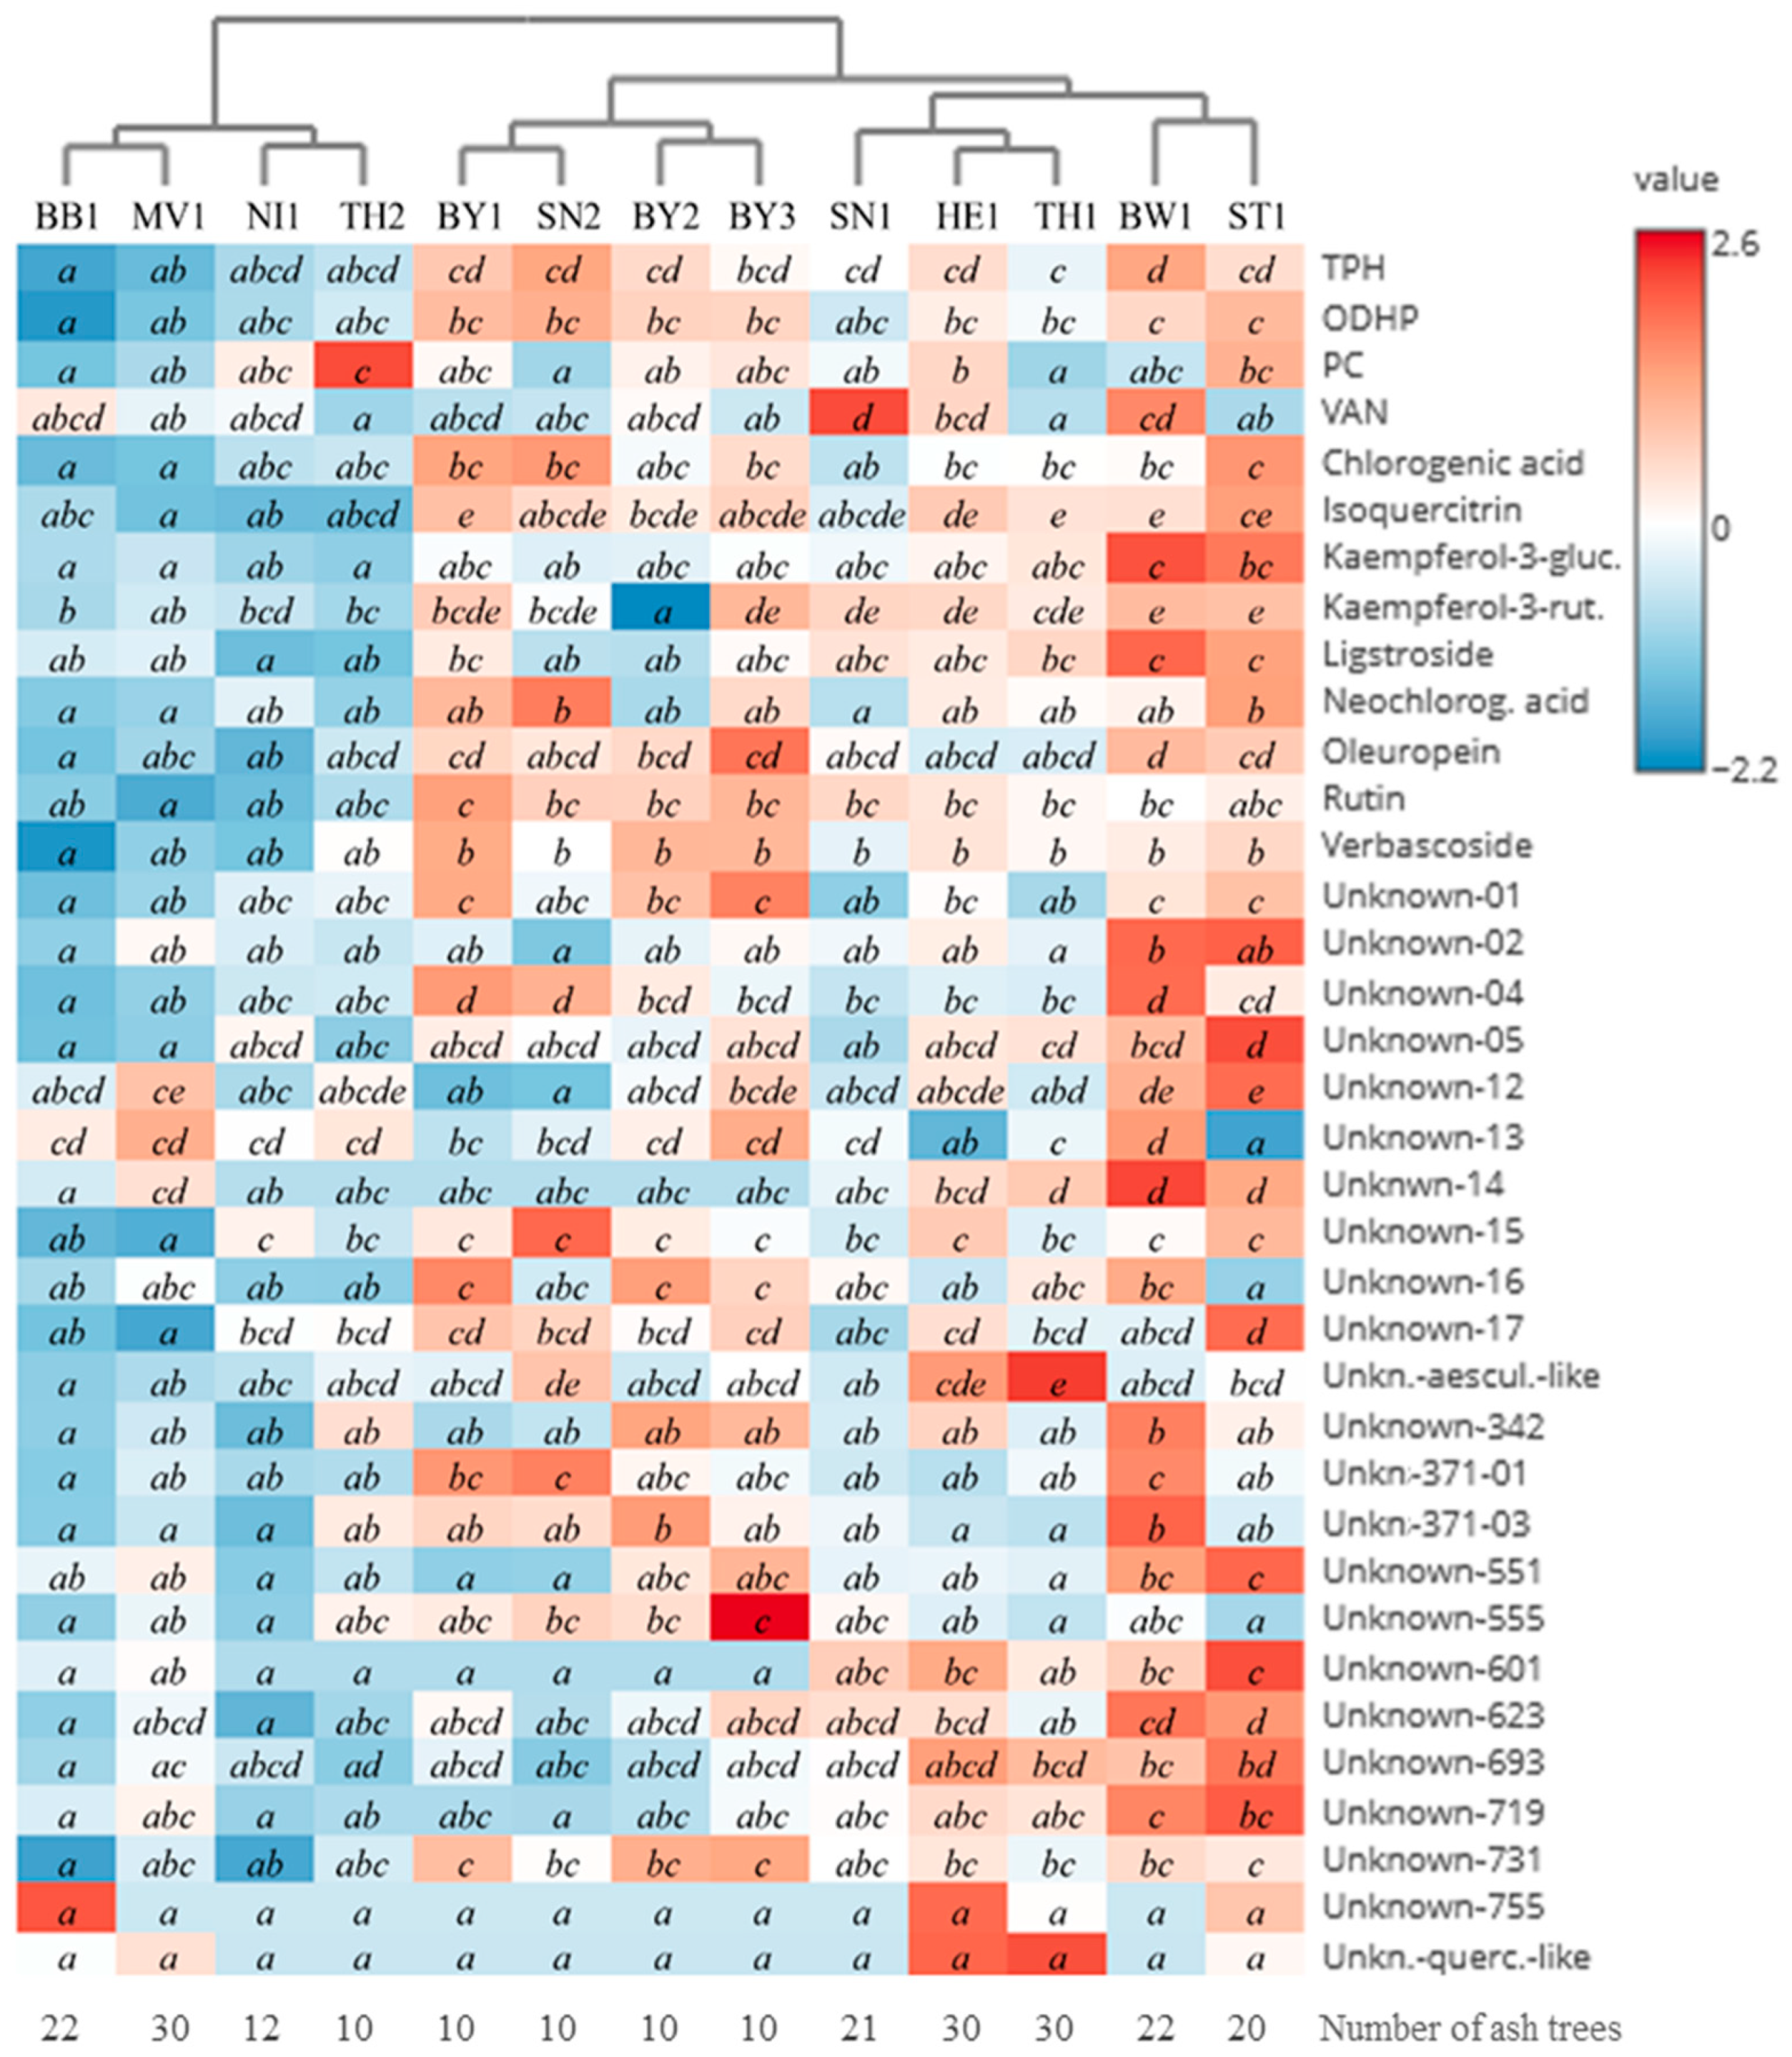
It is evident that the location and the sampling year had a considerable impact on the phenolic content. Therefore, a more detailed examination of the data was warranted. As a result, we focused in particular on the data from 2021. We chose this year because it provided the most comprehensive dataset for individual phenolic compounds. In 2021, data were available from 13 plots (all except BW2). All parameters—except unknown-quercetin-like and unknown-755—showed significant differences between at least two plots (Figure 6). Moreover, most monitoring plots differed significantly in at least one parameter. No significant differences were observed for the comparisons of NI1 and TH2/SN1 or between BY1 and BY3/SN2.
Clustering of the monitoring plots (Figure 6) revealed that ash trees at BB1, MV1, NI1, and TH2 differed somewhat from the remaining nine plots. These four plots tended to exhibit lower contents of several individual phenolic compounds and phenolic groups. The phenolic groups TPH and ODHP were among those with lower contents. PC and VAN showed differing patterns: TH2 had the highest PC content, whereas BB1 showed above-average VAN content. A similar clustering of BB1, MV1, NI1, and TH2 was also observed for individual phenolic compounds, although deviations occurred depending on specific compounds and plots. Leaves from trees at BW1 and ST1 contained particularly high contents of several phenolics. However, as with the other plots, these trends did not apply to all parameters.

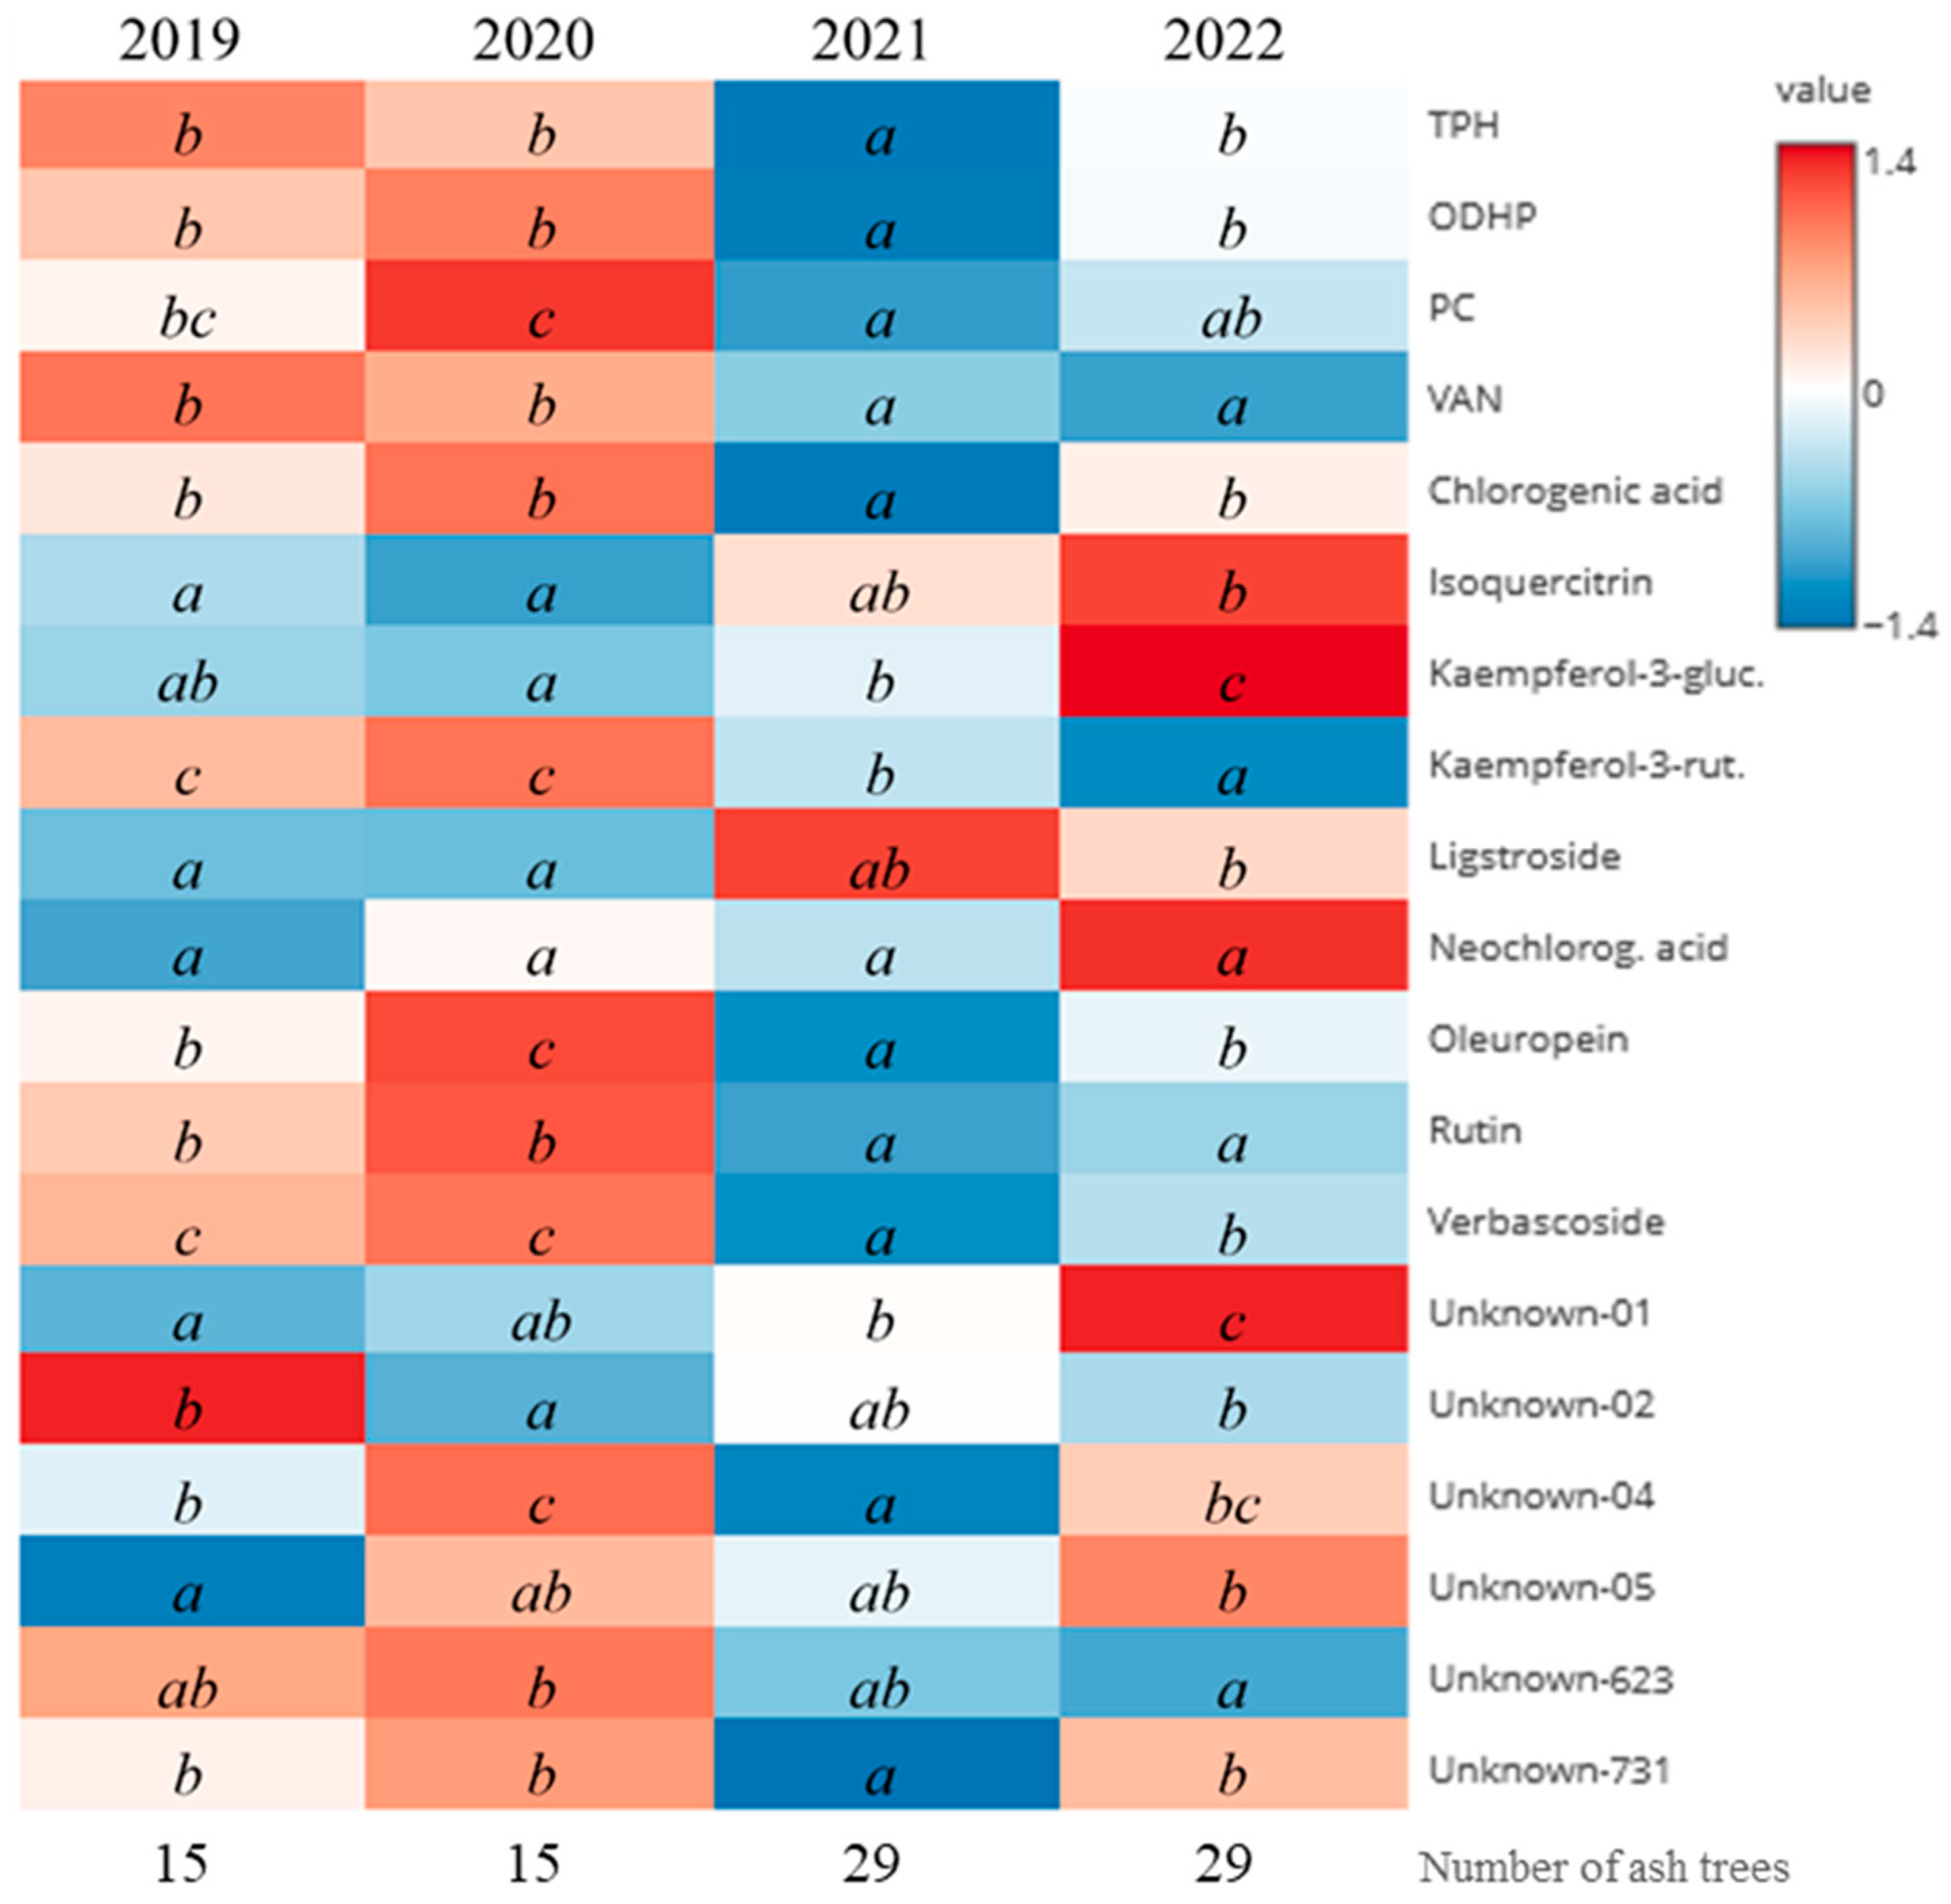
3.4.3. Comparison of Monitoring Years

Phenolic groups and a selection of individual compounds (for which data were available across all years) were analysed from monitoring plot BB1 for the years 2019–2022 to assess the effect of sampling year (Figure 7). All phenolic compounds, except neochlorogenic acid, showed significant differences between at least two years (Figure 7). The fewest differences were observed between 2019 and 2020, with only unknown-02, unknown-04, and oleuropein differing significantly between these years. Only 15 ash trees were sampled in those two years, compared to 30 and 29 in 2021 and 2022, respectively. Most differences were detected between 2019 and 2021 and between 2020 and 2021. In total, 10 out of 19 examined parameters showed their highest contents in 2020, while half had the lowest content in 2021. None of the phenolics differed significantly across all four years, but verbascoside showed no significant difference, except between 2019 and 2020. Overall, the variation in phenolic content across years strongly depended on the specific compound. A group of four compounds (TPH, ODHP, chlorogenic acid, and unknown-731) followed the same trend, with the lowest values measured in 2021. Values from 2021 differed significantly from those of the other three years, which did not differ significantly among themselves (2021: pattern a; 2019, 2020, and 2022: pattern b).

4. Discussion

4.1. Correlation of Phenolic Groups with ADB Damage Scoring

The analysis of the four phenolic groups measured photometrically (TPH, ODHP, PC, VAN) revealed no consistent or significant correlation with crown condition across all sites and years of investigation (Figure 3). A more differentiated examination by year and location, however, showed that interannual variation (Figure 4) and site-specific conditions (Figure 5) had a considerably stronger influence on phenolic contents than the damage class itself. Specifically, none of the phenolic groups showed significant differences between crown damage classes, while interannual comparisons revealed differences for ODHP, VAN, and PC (p < 0.05), and location effects accounted for up to 32 significant pairwise differences in TPH or 27 in ODHP (Tables S1–S4).
Due to the marked year effects, we additionally compiled and analysed weather data for the vegetation period prior to sampling (from March to July) for the years 2020 and 2021, obtained from the Deutscher Wetterdienst [45,46], focusing on precipitation and temperature (see Supplementary Material Figure S5). This comparison showed that 2020 was drier at nearly all sites and warmer than 2021, except at BB1 and MV1. Furthermore, the site SN2 was consistently colder than all other locations in both years, indicating possible microclimatic anomalies.
These climatic differences are relevant from a physiological perspective, as plants can respond to temperature and water stress by altering phenolic synthesis, especially through regulatory mechanisms within the phenylpropanoid pathway [8,38].
Significant differences in phenolic content were also observed between sites, particularly for TPH and ODHP. The plot ST1 exhibited the highest content, whereas BB1 and MV1 consistently showed lower contents. These differences are likely attributable to site-specific factors, such as soil properties, light availability, topography, or interspecific competition. An attempt was made to classify the plots based on similarities in phenol production; however, the complexity and scope of the available data exceeded the limits of this study. A meaningful physiological interpretation would require an interdisciplinary approach, incorporating expertise in soil science, genetics, and pathology, which could not be achieved within the present framework.
The phenolic contents observed fall within the range reported in previous studies on ash trees (Fraxinus excelsior L.) (cf. [47] cited in [2]). In particular, TPH and ODHP contents were within a range suitable for reliable photometric measurement. In contrast, VAN and PC contents were very low, and thus were particularly susceptible to measurement uncertainty.
Taken together, these findings underscore that the use of phenolic groups as indicators of ash dieback is highly confounded by environmental and site-related factors, making standardised interpretation across years and regions highly challenging. In the following section, we examine whether the quantification of individual phenolic compounds via HPLC differs systematically from group-level measurements, and whether this approach offers greater potential for monitoring purposes.

4.2. Comparison of Analytical Methods

The comparison of the applied analytical methods, including photometric determination and HPLC, revealed varying results depending on the specific parameters. Some phenolic parameters exhibited high correlations, reflecting similar trends across monitoring sites, years, and crown damage classes. For instance, the photometric methods for measuring TPH and ODHP were closely correlated (Table 2). This correlation suggests a significant overlap between the phenols detected by these two methods, possibly indicating different combinations of individual phenols within these groups—including phenols we did not measure by HPLC. The ODHP parameter measures compounds with a phenolic ring bearing two hydroxyl groups in ortho-position. Chlorogenic and neochlorogenic acid, isoquercitrin, rutin, verbascoside, and oleuropein belong to this group. Chlorogenic acid, verbascoside, and rutin showed strong correlations (between 0.575 and 0.770) with ODHP and TPH, indicating their significant influence on the values of these parameters, even if the content of the groups is ten times higher.
Conversely, PC and VAN exhibited a limited correlation with other parameters and with each other. Procyanidins are a group of oligomeric or polymeric flavan-3-ols derived from catechin or epicatechin units [48]. Although PC were detected using the butanol-HCL assay, no corresponding flavan-3-ols were identified in the HPLC profiles. This suggests that the detected PC represent higher polymeric forms that are not detected by the HPLC method used, which primarily resolves monomeric to trimeric phenolic compounds. It remains unclear whether this limitation is due to the large or heterogeneous size of the molecules, the poor solubility of certain phenolics in the chosen solvent, or the sensitivity of the detectors used. However, highly polymerized substances are generally poorly represented by HPLC methods of this type. Similarly, vanillin-positive compounds, which include condensed tannins and related phenolic oligomers, showed no clear correspondence to any individual HPLC compounds. This is consistent with the mode of detection of the vanillin assay, which targets reactive phenolic structures in acidic conditions without identifying distinct molecular species [41]. As a group-specific and colorimetric method, it provides an estimate of vanillin-reactive phenolics rather than compound-specific contents. The low overall contents of both PC and VAN are therefore not necessarily inconsistent with known high tannin concentrations in tree bark and leaves of trees [7], but may rather reflect analytical limitations or other influencing factors (discussed in Section 4.5, Further Possible Influencing Factors). While tannins are recognised as defence-related metabolites in many plant species [8], their detectability in the analysed material appears to be limited.

4.3. Differences in Crown Damage Classes

The overall analysis (Table 3) revealed that the CDC significantly influenced only six phenolic parameters, whereas the effects of location and year were considerably more pronounced. Variations in phenolic contents between CDCs differed across years and monitoring plots, but, due to an unequal sample distribution and small sample size, no reliable correlations could be established within individual sites or years. The dominant influence of site and year complicates the identification of clear biochemical indicators for ADB. Despite the relatively low correlation between CDC and phenolic content, the six individual phenolic compounds (unknown-15, unknown-16, unknown-342, unknown-371-01, unknown-371-03, and unknown-731) warrant further investigation to determine whether the synthesis is a specific response to infection with H. fraxineus or merely coincidental.
However, averaging data across years or sites can be problematic, particularly in light of the pronounced effects of year and location. While the development of CDC reflects the gradual decline of ash tree health, this trend is not uniform across all monitoring plots. Fuchs et al. [49], who assessed the entire ash population on each plot, reported no significant deterioration in crown condition among the surviving trees during the study period. In contrast, our subset of trees selected for biochemical analysis exhibited a clear year-to-year decline in crown condition (p < 0.001; Kruskal–Wallis and Mann–Whitney U tests; Supplementary Materials Figure S4). Although the selection aimed to be representative, our limited sample size did not reflect the broader trends observed across entire plots.
In addition to the difficulties of interpretation, the practical limitations of our study design may have led to the lack of correlation between phenolic content and CDC. One potential limitation is the sampling method: leaves were randomly collected from the sunlit canopy, and the results of the analysis were extrapolated to represent the whole tree. Secondary metabolites can be induced both locally and systemically during infection [6,12]. For example, Babenko et al. [50] reported local phenolic accumulation in the area of the fungal mycelium in wheat. If the phenolics that are important for defence are only induced locally, our method does not capture this. However, selecting visibly infected leaves to detect defence-related phenolics makes little sense in a monitoring context. If symptoms are already visible, there is no need for biochemical analysis to confirm infection. For monitoring purposes, phenolic markers are only useful if they can detect infections before symptoms appear and are present throughout the tree. In parallel with this study, we carried out analyses on young ash trees from an infection trial, which showed no differences between local and systemic responses in terms of phenolic content, but these findings are only indicative due to the small sample size.
It is unlikely that the timing of the sampling was unfavourable. The end of July to the beginning of August is the core period of the possible defence response. After an infection or when the fungus spreads further in an ash tree, this is the time when the strongest defence reactions should be observed [51]. However, it cannot excluded that previous contact of the ash tree with H. fraxineus influences the phenolic profile. For example, abiotic stressors are known to enhance plant resistance to subsequent stress [52].
Furthermore, very few trees showed no signs of ADB, making the control group too small (maximum of 14 trees over all years and plots). When assessing the relationship between the degree of damage by ash dieback disease and the content of phenolics, the lack of trees without disease symptoms impedes the comparison between damaged and healthy trees. Reliable conclusions on the phenolic content of undamaged trees within populations are therefore difficult to draw.
Despite these complexities, there was a general tendency for ODHP and TPH contents to increase with increasing CDC, although not significantly. This observation leads us to hypothesise that trees upregulate certain phenolics, which were not detected by HPLC, as defensive compounds in response to infection by H. fraxineus. It is possible that the recording of additional individual phenols or an adjustment of the sampling will have yielded outcomes that are more favourable. For example, separate analyses of different shoots from the same tree, or, in the case of the ADB, a different sampling time, might provide better information. Moreover, experimental studies under controlled conditions would be required to support or refute this hypothesis.

4.4. Influence of Site and Year

Analysis of main and interaction effects for leaf samples from different monitoring sites and years revealed a strong influence of the location (monitoring site). This influence was significant for most phenolics, affecting both the main and interaction effects with the year (Table 3). Depending on the specific parameter and particular plots compared, deviations among monitoring sites were evident. Notably, NI1, TH2, BB1, and MV1 clustered together, showing overall lower phenolic contents compared to other plots. In contrast, ST1 and BW1 exhibited particularly high contents of several phenolics. The impact of location on phenolic content, influenced by factors such as temperature, UV, solar radiation, precipitation, and humidity, is well documented [53,54,55,56,57]. For example, increased UV radiation increases the synthesis of flavonoids [53,54]. For other parameters, such as temperature and humidity, the relationships are less consistent and are often dependent on the individual phenols [54,56,57]. Given the diverse site characteristics of the monitoring plots across Germany [22], it is unsurprising that our data confirm these influences. The particularly high phenol levels observed at BB1 in 2020 (Figure 7) may reflect increased environmental stress during that dry and hot year, which likely triggered enhanced an secondary metabolism independently of ash dieback severity. In contrast, 2021 was an unusually wet growing season with higher precipitation, resulting in reduced drought stress and, consequently, lower production of defence compounds such as phenols. This difference in climatic conditions likely explains the significantly lower phenol levels observed in 2021 compared to 2020 (Figure 7).
Sidda et al. [32] also observed differences in leaf secoiridoid glycosides between tolerant and susceptible ash trees, but the secoiridoid glycosides we identified, oleuropein and ligstroside, were not among the distinguishing compounds. Notably, phenolic compounds differed between British and Danish trees in the publication by Sidda et al. [32], with British trees showing higher contents of certain metabolites in tolerant individuals. This geographic variation aligns with our findings about the influence of monitoring sites. Additionally, variations in infectious pressure across locations might also affect phenolic content [58]. Furthermore, symbioses could play a role in the resistance of ash trees. Burghard et al. [59] demonstrated that the microbiome—which may differ considerably between the investigated sites—may play a crucial role in the resistance of ash trees, as well as endophytes [9].
Yearly effects also had a significant impact on phenolic contents. Variations across years were observed as being in line with findings from other studies [56,60,61], which linked phenolic content to climatic variations such as irrigation, humidity, temperature, and solar radiation [12,56]. Different behaviours among phenolics were noted, consistent with our results (for example Figure 4). For instance, while TPH content showed no significant differences between study years, VAN content decreased significantly over the initial study period. PC content exhibited highly significant differences among most years, and ODHP content was notably higher in 2020. Contents were mostly highest in 2020 and lowest in 2021, which correlates with the extreme heat and drought of 2020, despite regional variations. The year 2020 was drier than 2021 in all areas, and, with the exception of BB1 and MV1, was also warmer (Figure S5 in Supplementary Materials). By far the coldest area (average temperature from March to July) was SN2 with 8.8 °C in 2020 and 8.2 °C in 2021, while all other areas ranged between 11.5 °C and 14.2 °C. Precipitation varied between 29 mm (BB1) and 93 mm (BY3) in 2020 and between 42.6 mm (ST1) and 105 mm (BY3) in 2021. These annual changes in environmental conditions likely contributed to the observed variations in phenolic content, suggesting that phenols are at least partly induced in response to environmental changes.

4.5. Further Possible Influencing Factors

We used CDC as a proxy for disease severity. However, our results show no consistent correlation between CDC and phenolic content under natural conditions. This suggests that phenolic variation is driven by other factors such as site-specific stressors (e.g., drought stress or herbivory) and genetic differences rather than ADB alone. Previous studies in other plant species have shown that genotypic effects can outweigh those of location and year [56,60]. According to unpublished results by Karuna Shrestha [62], three genetic clusters were identified among eight of the fourteen monitoring sites. Notably, ST1 and some trees from BB1 belonged to gene pools that differed from most other sites. This is of interest because ST1, which had notably high phenolic contents, and BB1, which had particularly low phenolic contents, may reflect substantial genetic influences. The challenge of distinguishing genetic from location effects is supported by the existing literature and underscore the complexity of linking genetic variation, phenolic content, and resistance due to differences in physiological adaptation and pathogen–tree interactions [6]. Moreover, tolerance to ash dieback may be a quantitative trait [63], suggesting that different genotypes may use diverse resistance mechanisms [29]. This complexity may partly explain the difficulty in establishing clear correlations between secondary metabolism, in particular phenolics, and crown damage due to ash dieback.
Furthermore, as secondary metabolites can be multifunctional [64], influences by diverse biotic and abiotic factors are conceivable, the complexity of which could not be examined here. For example, detailed data was available on the soils of all IBFs and on the genotypes of many ash trees, but we could not involve it in our analysis.
Despite widespread ash tree deterioration across Europe, some trees remain healthy and resilient [26,27,65,66]. The potential for phenolic compounds in F. excelsior to offer resistance to ash dieback has been a topic of interest within the research community. Many studies on ADB are concerned with differentiating tolerant and susceptible ash and are conducted under controlled conditions [4,9,29,31,32]. However, such results are not always directly transferable to in vivo conditions, as secondary metabolites can vary greatly within a species, and their concentrations can change under different conditions [5,6,12]. This can lead to overestimated conclusions about the importance of phenolics under a particular stress, such as a pathogenic fungus, especially in short-term experiments under controlled conditions [12]. This limitation of previous studies must be considered when interpreting the relevance of their findings for this study. For example, Sollars et al. [30] found higher contents of leaf iridoid glycosides in highly susceptible trees. Although our study identifies iridoid glycosides like oleuropein and ligstroside, these were not the same compounds highlighted by Sollars et al. [30]. As they analysed samples from young grafted trees in a greenhouse, comparison with our study regarding samples from mature trees under various infection pressures is difficult. Their findings might more indicate constitutive traits; our observations could indicate constitutive as well as induced traits. Studies of secondary metabolites in trees are too rarely conducted under natural conditions in long-term studies [5]. The role of constitutive phenols in fungal infections remains inconclusive, as there is a lack of long-term field studies that can confirm this connection [6].
The phenolics analysed in our study represent only a part of secondary metabolism, and sampling was limited to leaves. Since H. fraxineus infects through leaves but can also penetrate shoots or stems, defensive mechanisms in other tree parts might be relevant. Other authors studied bark metabolites associated with ash dieback disease [4,67]. In Nemesio-Gorriz’s et al. [4] greenhouse experiment, two coumarins, fraxetin and esculetin, were found in higher concentrations in the bark of shoots from young, low-susceptibility ash trees. The coumarins and the bark extract from the low-susceptibility ash trees inhibited the growth of H. fraxineus in an in vitro experiment. A total of 64 metabolites were associated with reduced or increased susceptibility in this study. Gossner et al. [67] investigated the relationship between ADB, the emerald ash borer, and selected secondary metabolites. They found that genotypes resistant to ADB were also less susceptible to emerald ash borer. Verbascosides were of particular interest because they were induced more strongly in the phloem of resistant ash trees than in susceptible ones when infected by the emerald ash borer. This suggests that certain phenolics may confer resistance to multiple pests and pathogens. Future studies should therefore examine the stem tissues more closely.
Relationships between secondary metabolites and ash dieback susceptibility are conceivable, but seem to comprise a diversity of compounds belonging to different compound groups and present in different compartments of trees. The survival of ash trees is dependent on their ability to adapt to the specific location, the level of infection pressure, and the prevailing environmental conditions. The results of our study support the hypothesis that plants, in this case ash trees in particular, have a variety of defence mechanisms of which the production of phenolics is only one aspect [29,68]. Moreover, pathogen-related factors add further complexity. H. fraxineus reproduces sexually and exhibits genetic variation; even within Europe, small differences in virulence among genotypes have been reported, while populations in the native Asian range harbour much greater diversity and, potentially, more aggressive strains. In addition, mature ash trees are often infected simultaneously by multiple genotypes, and interactions among these genotypes may influence both virulence and host responses [69]. Such pathogen diversity must therefore be considered when interpreting the role of secondary metabolites in disease resistance. Thus, host strategies, such as phenolic production, cannot be viewed in isolation, as their effectiveness is likely modulated by the genetic diversity and infection dynamics of the pathogen itself.
Nevertheless, long series of experiments conducted under natural conditions are essential to gain a deeper understanding of the actual significance of phenols under specific stress conditions.

5. Conclusions

In conclusion, the presented results demonstrate a high variability in phenolic contents, with strong effects from location and year. Although considerable variation in phenolic profiles was observed, no consistent response pattern to CDC emerged, indicating that these changes cannot be attributed specifically to ash dieback. The influence of ash dieback on phenolic contents was therefore weak and difficult to assess. Pronounced site-specific differences, with clearly distinguishable profiles in plots such as BB1 and MV1, suggest that the grouping or classification of sites may be a useful approach for future analyses, potentially reflecting underlying differences in genotype, soil properties, or local stressors. Furthermore, the high values of TPH and ODHP likely reflect a broader phenolic profile than that captured by the targeted individual compound analysis, as these photometric assays may include additional compounds or represent a summation of many individual phenols detected by HPLC. This discrepancy highlights the need for a better understanding of the composition of the compounds contributing to these group parameters. Analyses of individual phenolic compounds provided a more detailed insight into changes in the phenolic metabolism of ash (Fraxinus excelsior L.). However, no benefit was derived from the phenolic measurements carried out in the monitoring of ash in forest stands in the context of ADB. Our results paint a revealing picture of the complexity of biochemical reactions in mature ash stands, and highlight the necessity for investigations performed under field conditions. While phenolic compounds alone do not provide a reliable indication of ash dieback severity or tree defence status under field conditions, a multi-faceted monitoring approach integrating visual assessments (e.g., crown scoring, stem base inspection), targeted physiological measurements (such as chlorophyll content and water status), microbiome analyses, and genetic resistance markers may offer a more comprehensive understanding of tree health and stress response. Such integrative strategies are essential to detect not only disease symptoms, but also early defence reactions, thereby improving management and conservation efforts.

Supplementary Materials

The following supporting information can be downloaded at: https://www.mdpi.com/article/10.3390/f16091387/s1, Figure S1: Chemical structures of identified compounds from methanolic extracts of Fraxinus excelsior leaves. Figure S2: Overview of the distribution of scoring levels within the trees examined in the study sites in 2020, 2021 and 2022. Figure S3: Distribution of phenolic content (phenolic groups) in each year among the different crown damage classes. Figure S4: Distribution of crown damage classes of the analysed ash trees over all plots in the years 2020 to 2022. Figure S5: Weather data (mean values of precipitation and temperature) for the vegetation period before sampling (March to July) for the years 2020 and 2021 from the Deutschen Wetterdienst (DWD Climate Data Center (CDC)). Table S1: Overview of p-values between the monitoring plots for the total phenolic content. Table S2: Overview of p-values between the monitoring plots for the content of Vanillin-positive compounds. Table S3: Overview of p-values between the monitoring plots for the content of procyanidins. Table S4: Overview of p-values between the monitoring plots for the content of ortho-dihydroxy phenols.

Author Contributions

The concept for this publication was developed by R.K. and was revised by H.H. and A.P.; H.H. was responsible for sampling, sample preparation up to the stage of freeze-dried leaf material, photometric analyses, and the evaluation of these data at the State Forestry Institute Brandenburg, Department of Forest Ecology and Monitoring, Eberswalde. After freeze-drying, the samples were provided by the State Forestry Institute Brandenburg to the Humboldt-Universität zu Berlin for HPLC analyses; A.P. conducted the HPLC analyses at the Humboldt-Universität zu Berlin. The joint data were analysed as a team. While Angela Pilger drafted a preliminary version of this manuscript, H.H. led the revision process, which included restructuring, adding key sections, and expanding the content with support from A.P., R.K., and C.U. The final manuscript was prepared primarily by H.H. and A.P., with substantial contributions from all authors. All authors have read and agreed to the published version of the manuscript.

Funding

This research was funded by the Waldklimafonds (WKF) funded by the German Federal Ministry of Food and Agriculture (BMEL) and Federal Ministry for the Environment, Nature Conservation, Nuclear Safety, and Consumer Protection (BMUV) administrated by the Agency for Renewable Resources (FNR), grant number 2219WK20A4 (FraxMon, State Forestry Institute Brandenburg) and 2219WK21G4 (FraxGen, Humboldt-Universität zu Berlin).

Data Availability Statement

The data presented in this study are available on request from the corresponding author. The data is not publicly available, as no repository has been designated, but there are no restrictions on access to it.

Acknowledgments

The authors gratefully acknowledge Eric Frank, Wencke Schulze, Nadja Förster, and Matthias Zander for their technical and scientific support. We also thank the forest administrations of the study sites for their collaboration in establishing the research plots, for granting permission for monitoring and sampling, and for conducting the assessments on their respective plots. We are particularly grateful to University of Göttingen for providing samples from the infection trial and for sharing data, especially the information on genetic clusters.

Conflicts of Interest

The authors declare that they have no conflicts of interest. They only have non-financial research interests related directly or indirectly to this work as submitted for publication.

Abbreviations

The following abbreviations are used in this manuscript:
ADBash dieback
ANOVAanalysis of variance
CDCcrown damage class
DMdry mass
HPLChigh performance liquid chromatography
IBFintensive monitoring plot (Intensivbeobachtungsfläche)
IQRinterquartile range
Nnumber
ODHPortho-dihydroxyphenols
PCprocyanidins
pHpotential of hydrogen
RFresponse factor
TPHtotal phenols (folin-positive compounds)
UVultraviolet
v/vvolume per volume
VANvanillin-positive compounds

References

  1. Kostova, I.; Iossifova, T. Chemical Components of Fraxinus Species. Fitoterapia 2007, 78, 85–106. [Google Scholar] [CrossRef]
  2. Thomas, P.A. Biological Flora of the British Isles: Fraxinus Excelsior. J. Ecol. 2016, 104, 1158–1209. [Google Scholar] [CrossRef]
  3. Kiss, A.K.; Michalak, B.; Patyra, A.; Majdan, M. UHPLC-DAD-ESI-MS/MS and HPTLC Profiling of Ash Leaf Samples from Different Commercial and Natural Sources and Their in Vitro Effects on Mediators of Inflammation. Phytochem. Anal. 2020, 31, 57–67. [Google Scholar] [CrossRef]
  4. Nemesio-Gorriz, M.; Menezes, R.C.; Paetz, C.; Hammerbacher, A.; Steenackers, M.; Schamp, K.; Höfte, M.; Svatoš, A.; Gershenzon, J.; Douglas, G.C. Canditate Metabolites for Ash Dieback Tolerance in Fraxinus Excelsior. J. Exp. Bot. 2020, 71, 6074–6083. [Google Scholar] [CrossRef]
  5. Holopainen, J.K.; Virjamo, V.; Ghimire, R.P.; Blande, J.D.; Julkunen-Tiitto, R.; Kivimäenpää, M. Climate Change Effects on Secondary Compounds of Forest Trees in the Northern Hemisphere. Front. Plant Sci. 2018, 9, 1445. [Google Scholar] [CrossRef] [PubMed]
  6. Witzell, J.; Martín, J.A. Phenolic Metabolites in the Resistance of Northern Forest Trees to Pathogens—Past Experiences and Future Prospects. Can. J. For. Res. 2008, 38, 2711–2727. [Google Scholar] [CrossRef]
  7. Kumar, S.; Abedin, M.M.; Singh, A.K.; Das, S. Role of Phenolic Compounds in Plant-Defensive Mechanisms. In Plant Phenolics in Sustainable Agriculture; Lone, R., Shuab, R., Kamili, A.N., Eds.; Springer: Singapore, 2020; pp. 517–532. ISBN 9789811548895. [Google Scholar]
  8. Šamec, D.; Karalija, E.; Šola, I.; Vujčić Bok, V.; Salopek-Sondi, B. The Role of Polyphenols in Abiotic Stress Response: The Influence of Molecular Structure. Plants 2021, 10, 118. [Google Scholar] [CrossRef] [PubMed]
  9. Striganavičiūtė, G.; Žiauka, J.; Sirgedaitė-Šėžienė, V.; Vaitiekūnaitė, D. Priming of Resistance-Related Phenolics: A Study of Plant-Associated Bacteria and Hymenoscyphus Fraxineus. Microorganisms 2021, 9, 2504. [Google Scholar] [CrossRef]
  10. Nicholson, R.L.; Hammerschmidt, R. Phenolic Compounds and Their Role in Disease Resistance. Annu. Rev. Phytopathol. 1992, 30, 369–389. [Google Scholar] [CrossRef]
  11. Hulse, S.V.; Antonovics, J.; Hood, M.E.; Bruns, E.L. Specific Resistance Prevents the Evolution of General Resistance and Facilitates Disease Emergence. J. Evol. Biol. 2023, 36, 753–763. [Google Scholar] [CrossRef] [PubMed]
  12. Moore, B.D.; Andrew, R.L.; Külheim, C.; Foley, W.J. Explaining Intraspecific Diversity in Plant Secondary Metabolites in an Ecological Context. New Phytol. 2014, 201, 733–750. [Google Scholar] [CrossRef] [PubMed]
  13. Husson, C.; Caël, O.; Grandjean, J.P.; Nageleisen, L.M.; Marçais, B. Occurrence of Hymenoscyphus Pseudoalbidus on Infected Ash Logs. Plant Pathol. 2012, 61, 889–895. [Google Scholar] [CrossRef]
  14. Gross, A.; Holdenrieder, O.; Pautasso, M.; Queloz, V.; Sieber, T.N. Hymenoscyphus Pseudoalbidus, the Causal Agent of European Ash Dieback. Mol. Plant Pathol. 2014, 15, 5–21. [Google Scholar] [CrossRef]
  15. Gross, A.; Holdenrieder, O. Pathogenicity of Hymenoscyphus Fraxineus and Hymenoscyphus Albidus towards Fraxinus Mandshurica Var. Japonica. For. Pathol. 2015, 45, 172–174. [Google Scholar] [CrossRef]
  16. Haňáčková, Z.; Koukol, O.; Čmoková, A.; Zahradník, D.; Havrdová, L. Direct Evidence of Hymenoscyphus Fraxineus Infection Pathway through the Petiole-Shoot Junction. For. Pathol. 2017, 47, e12370. [Google Scholar] [CrossRef]
  17. Thomas, H.E. Studies on Armillaria Mellea (Vahl) Quel., Infection, Parasitism, and Host Resistance. J. Agric. Res. 1934, 48, 187. [Google Scholar]
  18. Guillaumin, J.J.; Rykowski, K. Studies of the infection of walnut (Juglans regia) by Armillaria mellea under controlled experimental conditions. Folia For. Pol. A (Leśnictwo) 1980, 24, 191–213. [Google Scholar]
  19. Rishbeth, J. Infection Cycle of Armillaria and Host Response. Eur. J. For. Pathol. 1985, 15, 332–341. [Google Scholar] [CrossRef]
  20. Meyn, R.; Langer, G.J.; Gross, A.; Langer, E.J. Fungal Colonization Patterns in Necrotic Rootstocks and Stem Bases of Dieback-Affected Fraxinus excelsior L. For. Pathol. 2019, 49, e12520. [Google Scholar] [CrossRef]
  21. Peters, S.; Gruschwitz, N.; Bien, S.; Fuchs, S.; Bubner, B.; Blunk, V.; Langer, G.J.; Langer, E.J. The Fungal Predominance in Stem Collar Necroses of Fraxinus Excelsior: A Study on Hymenoscyphus Fraxineus Multilocus Genotypes. J. Plant Dis. Prot. 2024, 13, 1341–1353. [Google Scholar] [CrossRef]
  22. Langer, G.J.; Fuchs, S.; Osewold, J.; Peters, S.; Schrewe, F.; Ridley, M.; Kätzel, R.; Bubner, B.; Grüner, J. FraxForFuture—Research on European Ash Dieback in Germany. J. Plant Dis. Prot. 2022, 129, 1285–1295. [Google Scholar] [CrossRef]
  23. Gross, A.; Hosoya, T.; Zhao, Y.J.; Baral, H.-O. Hymenoscyphus Linearis Sp Nov: Another Close Relative of the Ash Dieback Pathogen H. Fraxineus. Mycol. Prog. 2015, 14, 20. [Google Scholar] [CrossRef]
  24. Przybył, K. Fungi Associated with Necrotic Apical Parts of Fraxinus Excelsior Shoots. For. Pathol. 2002, 32, 387–394. [Google Scholar] [CrossRef]
  25. Kowalski, T. Chalara Fraxinea Sp. Nov. Associated with Dieback of Ash (Fraxinus Excelsior) in Poland. For. Pathol. 2006, 36, 264–270. [Google Scholar] [CrossRef]
  26. McKinney, L.V.; Nielsen, L.R.; Collinge, D.B.; Thomsen, I.M.; Hansen, J.K.; Kjær, E.D. The Ash Dieback Crisis: Genetic Variation in Resistance Can Prove a Long-term Solution. Plant Pathol. 2014, 63, 485–499. [Google Scholar] [CrossRef]
  27. Enderle, R.; Nakou, A.; Thomas, K.; Metzler, B. Susceptibility of Autochthonous German Fraxinus Excelsior Clones to Hymenoscyphus Pseudoalbidus Is Genetically Determined. Ann. For. Sci. 2015, 72, 183–193. [Google Scholar] [CrossRef]
  28. Enderle, R.; Stenlid, J.; Vasaitis, R. An Overview of Ash (Fraxinus Spp.) and the Ash Dieback Disease in Europe. CABI Rev. 2019, 14, 1–12. [Google Scholar] [CrossRef]
  29. Cleary, M.R.; Andersson, P.F.; Broberg, A.; Elfstrand, M.; Daniel, G.; Stenlid, J. Genotypes of Fraxinus Excelsior with Different Susceptibility to the Ash Dieback Pathogen Hymenoscyphus Pseudoalbidus and Their Response to the Phytotoxin Viridiol—A Metabolomic and Microscopic Study. Phytochemistry 2014, 102, 115–125. [Google Scholar] [CrossRef] [PubMed]
  30. Sollars, E.S.A.; Harper, A.L.; Kelly, L.J.; Sambles, C.M.; Ramirez-Gonzalez, R.H.; Swarbreck, D.; Kaithakottil, G.; Cooper, E.D.; Uauy, C.; Havlickova, L.; et al. Genome Sequence and Genetic Diversity of European Ash Trees. Nature 2017, 541, 212–216. [Google Scholar] [CrossRef]
  31. Villari, C.; Dowkiw, A.; Enderle, R.; Ghasemkhani, M.; Kirisits, T.; Kjær, E.D.; Marčiulynienė, D.; McKinney, L.V.; Metzler, B.; Muñoz, F.; et al. Advanced Spectroscopy-Based Phenotyping Offers a Potential Solution to the Ash Dieback Epidemic. Sci. Rep. 2018, 8, 17448. [Google Scholar] [CrossRef] [PubMed]
  32. Sidda, J.D.; Song, L.; Parker, J.L.; Studholme, D.J.; Sambles, C.; Grant, M. Diversity of Secoiridoid Glycosides in Leaves of UK and Danish Ash Provide New Insight for Ash Dieback Management. Sci. Rep. 2020, 10, 19566. [Google Scholar] [CrossRef]
  33. Grace, S.C. Phenolics as Antioxidants. In Antioxidants and Reactive Oxygen Species in Plants; Smirnoff, N., Ed.; Wiley: Hoboken, NJ, USA, 2005; pp. 141–168. ISBN 978-1-4051-2529-1. [Google Scholar]
  34. Tak, Y.; Kumar, M. Phenolics: A Key Defence Secondary Metabolite to Counter Biotic Stress. In Plant Phenolics in Sustainable Agriculture; Lone, R., Shuab, R., Kamili, A.N., Eds.; Springer: Singapore, 2020; pp. 309–329. ISBN 9789811548895. [Google Scholar]
  35. McPherson, B.A.; Mori, S.R.; Opiyo, S.O.; Conrad, A.O.; Wood, D.L.; Bonello, P. Association between Resistance to an Introduced Invasive Pathogen and Phenolic Compounds That May Serve as Biomarkers in Native Oaks. For. Ecol. Manag. 2014, 312, 154–160. [Google Scholar] [CrossRef]
  36. Peters, S.; Langer, G.; Kätzel, R. Bonitur Geschädigter Eschen Im Kontext Des Eschentriebsterbens. AFZ-DerWald 2021, 76, 28–31. [Google Scholar]
  37. Peters, S.; Langer, G.; Kätzel, R. Eschentriebsterben: Kriterien Zur Schadensbonitur an Eschen; Fachagentur Nachwachsende Rohstoffe eV (FNR): Gülzow-Prüzen, Germany, 2021.
  38. Cheynier, V.; Comte, G.; Davies, K.M.; Lattanzio, V.; Martens, S. Plant Phenolics: Recent Advances on Their Biosynthesis, Genetics, and Ecophysiology. Plant Physiol. Biochem. 2013, 72, 1–20. [Google Scholar] [CrossRef]
  39. Lunderstädt, J.; Ahlers, S. Zur Nahrungsqualität von Fichtennadeln Für Forstliche Schadinsekten. Z. Für Angew. Entomol. 1983, 95, 141–150. [Google Scholar] [CrossRef]
  40. Swain, T.; Hillis, W.E. The Phenolic Constituents of Prunus Domestica. I.—The Quantitative Analysis of Phenolic Constituents. J. Sci. Food Agric. 1959, 10, 63–68. [Google Scholar] [CrossRef]
  41. Broadhurst, R.B.; Jones, W.T. Analysis of Condensed Tannins Using Acidified Vanillin. J. Sci. Food Agric. 1978, 29, 788–794. [Google Scholar] [CrossRef]
  42. Stafford, H.A.; Cheng, T.-Y. The Procyanidins of Douglas Fir Seedlings, Callus and Cell Suspension Cultures Derived from Cotyledons. Phytochemistry 1980, 19, 131–135. [Google Scholar] [CrossRef]
  43. Arnow, L.E. Colorimetric Determination of the Components of 3, 4-Dihydroxyphenylalanine-Tyrosine Mixtures. J. Biol. Chem 1937, 118, 531–537. [Google Scholar] [CrossRef]
  44. Förster, N.; Dilling, S.; Ulrichs, C.; Huyskens-Keil, S. Nutritional Diversity in Leaves of Various Amaranth (Amaranthus spp.) Genotypes and Its Resilience to Drought Stress. J. Appl. Bot. Food Qual. 2023, 96, 1–10. [Google Scholar] [CrossRef]
  45. DWD Climate Data Center (CDC). Monatsmittel Der Stationsmessungen Der Lufttemperatur in 2 m Höhe in °C Für Deutschland, Version V21.3 2025. Available online: https://dwd-geoportal.de/products/OBS_DEU_P1M_T2M/ (accessed on 16 April 2025).
  46. DWD Climate Data Center (CDC). Rasterdaten Der Monatssumme Der Niederschlagshöhe Für Deutschland, Version V19.3 2025. Available online: https://dwd-geoportal.de/products/GRD_DEU_P1M_RR/ (accessed on 16 April 2025).
  47. Carnat, A.U.; Lamaison, J.L.; Duband, F. Contents of the Main Components in the Ash Leaves, Fraxinus excelsior L. Plantes Med. Phytother. 1990, 24, 145–151. [Google Scholar]
  48. Sticher, O. Phenolische Verbindungen. In Pharmakognosie–Phytopharmazie; Hänsel, R., Sticher, O., Eds.; Springer Medizin: Heidelberg, Germany, 2010; pp. 1053–1206. ISBN 978-3-642-00962-4. [Google Scholar]
  49. Fuchs, S.; Häuser, H.; Peters, S.; Knauf, L.; Rentschler, F.; Kahlenberg, G.; Kätzel, R.; Evers, J.; Paar, U.; Langer, G.J. Ash Dieback Assessments on Intensive Monitoring Plots in Germany: Influence of Stand, Site and Time on Disease Progression. J. Plant Dis. Prot. 2024, 131, 1355–1372. [Google Scholar] [CrossRef]
  50. Babenko, L.M.; Smirnov, O.E.; Romanenko, K.O.; Trunova, O.K.; Kosakivska, I.V. Phenolic Compounds in Plants: Biogenesis and Functions. Ukr. Biochem. J. 2019, 91, 5–18. [Google Scholar] [CrossRef]
  51. Hietala, A.M.; Timmermann, V.; BØrja, I.; Solheim, H. The Invasive Ash Dieback Pathogen Hymenoscyphus Pseudoalbidus Exerts Maximal Infection Pressure Prior to the Onset of Host Leaf Senescence. Fungal Ecol. 2013, 6, 302–308. [Google Scholar] [CrossRef]
  52. Garcia-Molina, A.; Pastor, V. Systemic Analysis of Metabolome Reconfiguration in Arabidopsis after Abiotic Stressors Uncovers Metabolites That Modulate Defense against Pathogens. Plant Commun. 2024, 5, 100645. [Google Scholar] [CrossRef] [PubMed]
  53. Barthod, S.; Cerovic, Z.; Epron, D. Can Dual Chlorophyll Fluorescence Excitation Be Used to Assess the Variation in the Content of UV-Absorbing Phenolic Compounds in Leaves of Temperate Tree Species along a Light Gradient? J. Exp. Bot. 2007, 58, 1753–1760. [Google Scholar] [CrossRef]
  54. Jaakola, L.; Hohtola, A. Effect of Latitude on Flavonoid Biosynthesis in Plants. Plant Cell Environ. 2010, 33, 1239–1247. [Google Scholar] [CrossRef]
  55. Yang, B.; Zheng, J.; Laaksonen, O.; Tahvonen, R.; Kallio, H. Effects of Latitude and Weather Conditions on Phenolic Compounds in Currant (Ribes spp.) Cultivars. J. Agric. Food Chem. 2013, 61, 3517–3532. [Google Scholar] [CrossRef]
  56. Vagiri, M.; Ekholm, A.; Öberg, E.; Johansson, E.; Andersson, S.C.; Rumpunen, K. Phenols and Ascorbic Acid in Black Currants (Ribes nigrum L.): Variation Due to Genotype, Location, and Year. J. Agric. Food Chem. 2013, 61, 9298–9306. [Google Scholar] [CrossRef]
  57. Marin, A.; Ferreres, F.; Barberá, G.G.; Gil, M.I. Weather Variability Influences Color and Phenolic Content of Pigmented Baby Leaf Lettuces throughout the Season. J. Agric. Food Chem. 2015, 63, 1673–1681. [Google Scholar] [CrossRef]
  58. Fachagentur Nachwachsende Rohstoffe e. V. (FNR). Schlussbericht zum Verbundvorhaben FraxMon; FNR: Gülzow, Germany, 2024; p. 66. Available online: https://www.fnr.de/fileadmin/projektdatenbank/2219WK20B4.pdf (accessed on 3 April 2025).
  59. Burghard, V.; Wende, S.; Schneck, V.; Ulrich, A. Inoculation of Fraxinus Excelsior Seedlings with Bacterial Strains to Enhance the Tolerance against Ash Dieback. J. Plant Dis. Prot. 2024, 132, 9. [Google Scholar] [CrossRef]
  60. Reddivari, L.; Hale, A.L.; Miller, J.C. Genotype, Location, and Year Influence Antioxidant Activity, Carotenoid Content, Phenolic Content, and Composition in Specialty Potatoes. J. Agric. Food Chem. 2007, 55, 8073–8079. [Google Scholar] [CrossRef]
  61. Brandolini, A.; Castoldi, P.; Plizzari, L.; Hidalgo, A. Phenolic Acids Composition, Total Polyphenols Content and Antioxidant Activity of Triticum Monococcum, Triticum Turgidum and Triticum Aestivum: A Two-Years Evaluation. J. Cereal Sci. 2013, 58, 123–131. [Google Scholar] [CrossRef]
  62. Budde, K. (University of Göttingen, Göttingen, Germany). Personal communication, 2023.
  63. Sambles, C.M.; Salmon, D.L.; Florance, H.; Howard, T.P.; Smirnoff, N.; Nielsen, L.R.; McKinney, L.V.; Kjær, E.D.; Buggs, R.J.A.; Studholme, D.J.; et al. Ash Leaf Metabolomes Reveal Differences between Trees Tolerant and Susceptible to Ash Dieback Disease. Sci. Data 2017, 4, 170190. [Google Scholar] [CrossRef]
  64. Erb, M.; Kliebenstein, D.J. Plant Secondary Metabolites as Defenses, Regulators, and Primary Metabolites: The Blurred Functional Trichotomy. Plant Physiol. 2020, 184, 39–52. [Google Scholar] [CrossRef]
  65. Havrdová, L.; Novotná, K.; Zahradník, D.; Buriánek, V.; Pešková, V.; Šrůtka, P.; Černý, K. Differences in Susceptibility to Ash Dieback in Czech Provenances of Fraxinus Excelsior. For. Pathol. 2016, 46, 281–288. [Google Scholar] [CrossRef]
  66. Muñoz, F.; Marçais, B.; Dufour, J.; Dowkiw, A. Rising Out of the Ashes: Additive Genetic Variation for Crown and Collar Resistance to Hymenoscyphus fraxineus in Fraxinus excelsior. Phytopathology 2016, 106, 1535–1543. [Google Scholar] [CrossRef]
  67. Gossner, M.M.; Perret-Gentil, A.; Britt, E.; Queloz, V.; Glauser, G.; Ladd, T.; Roe, A.D.; Cleary, M.; Liziniewicz, M.; Nielsen, L.R.; et al. A Glimmer of Hope—Ash Genotypes with Increased Resistance to Ash Dieback Pathogen Show Cross-resistance to Emerald Ash Borer. New Phytol. 2023, 240, 1219–1232. [Google Scholar] [CrossRef]
  68. Núñez-Farfán, J.; Fornoni, J.; Valverde, P.L. The Evolution of Resistance and Tolerance to Herbivores. Annu. Rev. Ecol. Evol. Syst. 2007, 38, 541–566. [Google Scholar] [CrossRef]
  69. Landolt, J.; Gross, A.; Holdenrieder, O.; Pautasso, M. Ash Dieback Due to Hymenoscyphus Fraxineus: What Can Be Learnt from Evolutionary Ecology? Plant Pathol. 2016, 65, 1056–1070. [Google Scholar] [CrossRef]
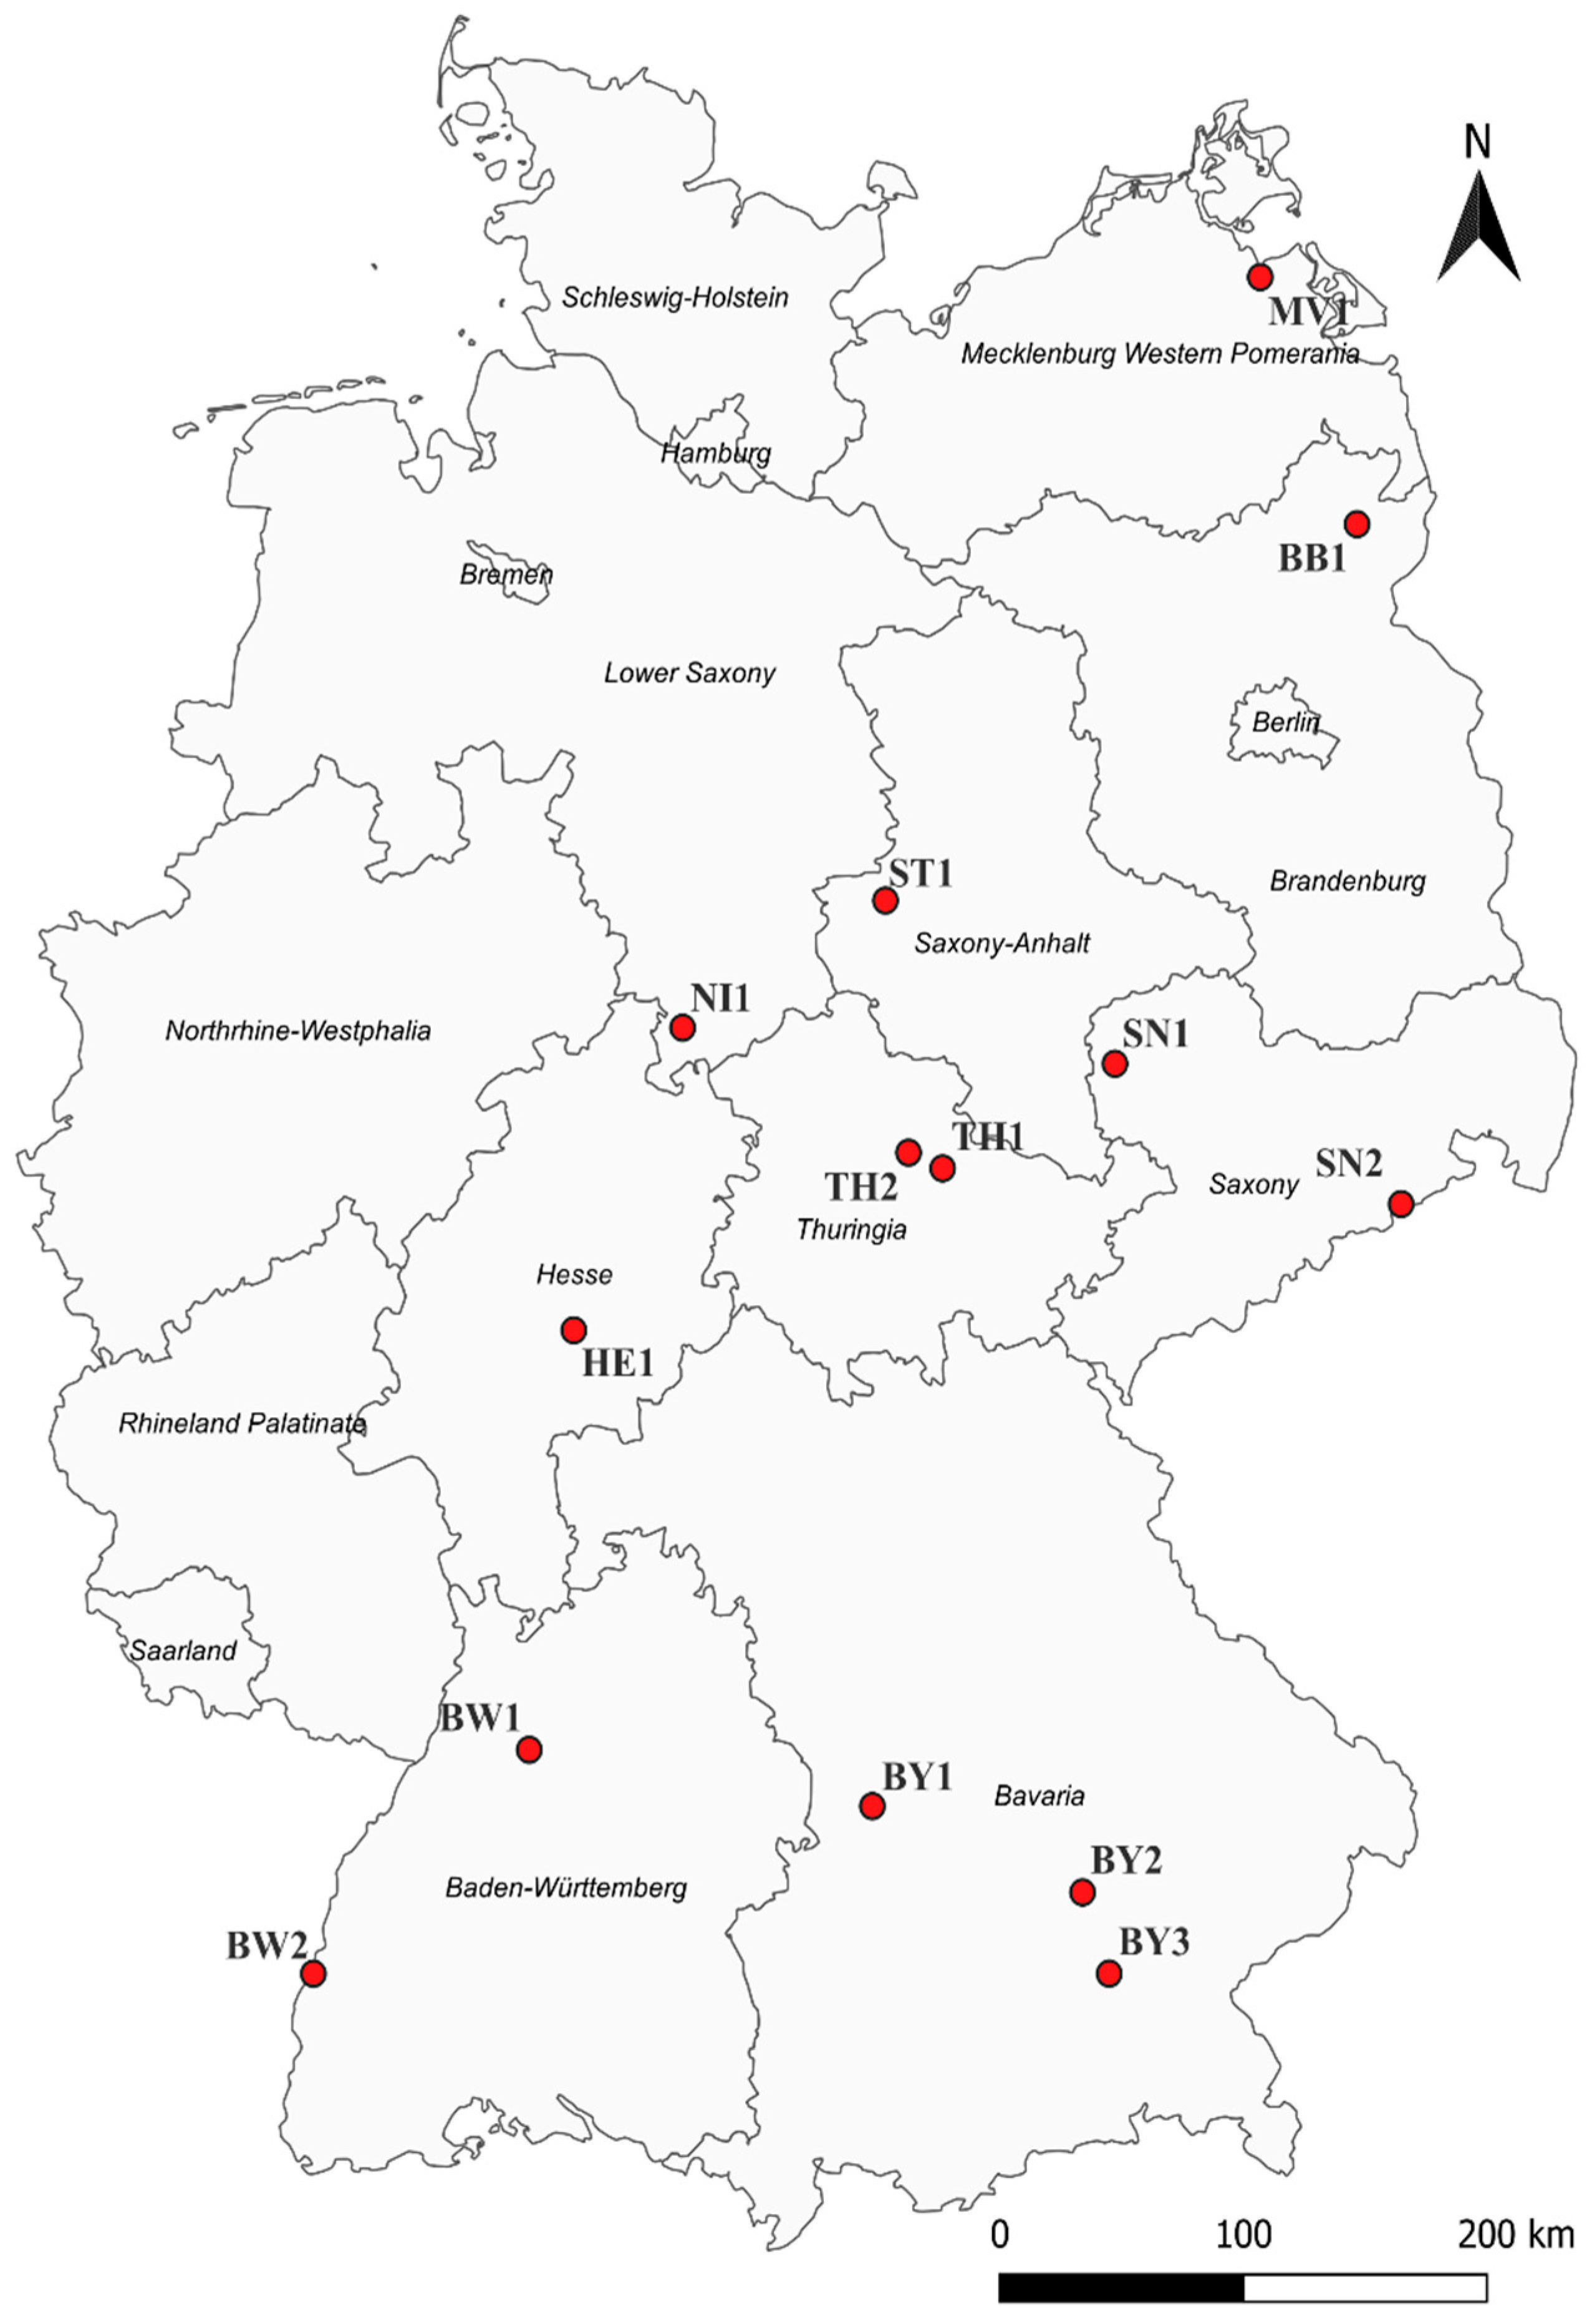
Figure 1. Map of Germany with the intensive monitoring plots (red dots). The names of the plots are derived from the respective federal state. MV1: Mecklenburg Western Pomerania; BB1: Brandenburg; ST1: Saxony-Anhalt; NI1: Lower Saxony; SN1 and SN2: Saxony; TH1 and TH2: Thuringia; HE1: Hesse; BW1 and BW2: Baden-Württemberg; BY1, BY2, and BY3: Bavaria.
Forests 16 01387 g001
Figure 2. Phenolic groups (Ortho-dihydroxyphenols, Folin-positive Compounds, Vanillin-positive Compounds, and Procyanidins) and identified single phenols with known content (Neochlorogenic Acid, Chlorogenic Acid, Verbascoside, Rutin, Kaempferol-3-rutinoside, Oleuropein, Kaempferol-3-glucoside, Ligstroside, Pinoresinol-4-glucoside), plotted logarithmically. Folin-positive compounds and ortho-dihydroxyphenols have a content around ten times higher than other phenolic groups and single phenols. Number of samples (N): NPhenolic Groups = 860; NPinoresinol-4-glucoside = 206; Nall other Single Phenolic Compounds = 555. DM: Dry mass. Boxplots show the interquartile range (box), median (line within the box), and whiskers representing 1.5 × the interquartile range (IQR). Circles (◦) indicate moderate outliers (1.5–3 × IQR), and stars (*) indicate extreme outliers (>3 × IQR).
Forests 16 01387 g002
Figure 3. Boxplots for the contents of the four phenolic groups in the five crown damage classes across all years and sites. Statistical analysis (Kruskal–Wallis test, p < 0.050) revealed no significant differences between the crown levels. (A) (Green): Total phenolic content (p = 0.070). (B) (Red): Vanillin-positive compounds (p = 0.464). (C) (Blue): Procyanidins (p = 0.057). (D) (Violet): Ortho-dihydroxyphenols (p = 0.401). N: Number of samples. DM: Dry mass. Boxplots show the interquartile range (box), median (line within the box), and whiskers representing 1.5 × the interquartile range (IQR). Circles (◦) indicate moderate outliers (1.5–3 × IQR), and stars (*) indicate extreme outliers (>3 × IQR).
Forests 16 01387 g003
Figure 4. Boxplots for the contents of the four phenolic groups in the four observation years across all crown damage classes and sites. In 2019, we observed only IBF BB1. (A) (Green): Total phenolic content. (B) (Red): Vanillin-positive compounds. (C) (Blue): Procyanidins. (D) (Violet): Ortho-dihydroxyphenols. N: Number of samples. DM: Dry mass. Different letters indicate significant differences between years (Kruskal–Wallis test, p < 0.05). Boxplots show the interquartile range (box), median (line within the box), and whiskers representing 1.5 × the interquartile range (IQR). Circles (◦) indicate moderate outliers (1.5–3 × IQR) and stars (*) indicate extreme outliers (>3 × IQR).
Forests 16 01387 g004
Figure 5. Boxplots for the contents of the 4 phenolic groups at the 14 intensive monitoring plots across all years and crown damage classes. (A) (Green): Total phenolic content. (B) (Red): Vanillin-positive compounds. (C) (Blue): Procyanidins. (D) (Violet): Ortho-dihydroxyphenols. N: Number of samples. DM: Dry mass. Boxplots show the interquartile range (box), median (line within the box), and whiskers representing 1.5 × the interquartile range (IQR). Circles (◦) indicate moderate outliers (1.5–3 × IQR) and stars (*) indicate extreme outliers (>3 × IQR). Significant differences are not labelled for clarity. (See Tables S1–S4 in Supplementary Materials for significant differences).
Forests 16 01387 g005
Figure 6. Heat map of phenolic parameters clustered by average values per plot. Data is from sampling year 2021. Values were normalised raw data (mean-centred and scaled by standard deviation; z-scores). Different letters indicate significant differences between plots (Kruskal–Wallis test, p < 0.05).
Forests 16 01387 g006
Figure 7. Heat map of phenolic parameters by year for monitoring plot BB1. Values are normalised raw data (mean-centred and scaled by standard deviation; z-scores). Different letters indicate significant differences between years (Kruskal–Wallis test, p < 0.05).
Forests 16 01387 g007
Table 1. Number of leaf samples analysed in each monitoring area (IBF) for each year. Columns indicate the year of sampling, subdivided into ‘Groups’ and ‘Single’. ‘Groups’ refers to the photometric analysis of phenolic groups (total phenols, vanillin-positive compounds, procyanidins, and ortho-dihydroxyphenols). ‘Single’ refers to the HPLC analysis of individual low-molecular-weight phenolic compounds, which is a subset of the corresponding ‘Groups’ samples. Rows indicate monitoring areas, abbreviated by their site codes.
Year2019202020212022
IBFGroupsSingleGroupsSingleGroupsSingleGroupsSingle
BB11515151529292929
BW1----30223021
BW2------30-
BY1--15153010308
BY2--151513103010
BY3----12103010
HE1----30302914
MV1--151530302525
NI1----30122811
SN1--151530212715
SN2----30103010
ST1----30202929
TH1--151530302715
TH2----3010279
Table 2. Correlation coefficients (Spearman-Rho) of phenolic groups (grey background) and individual phenolic compounds (white background). Selection of the ten highest correlation coefficients per parameter. All correlations are significant at the 0.01 level (two-tailed). TPH: Folin-positive compounds (total phenols); ODHP: ortho-dihydroxyphenols; PC: procyanidins; VAN: vanillin-positive compounds; Unknown: unknown individual phenolic compounds.
TPHODHPPCVAN
ODHP0.877TPH0.877Verbascoside0.442Rutin0.347
Chlorogenic acid0.676Verbascoside0.774Unknown 6230.372TPH0.344
Rutin0.634Chlorogenic acid0.689Unknown 7310.360Kaempferol-3-rutinoside0.282
Isoquercitrin0.608Unknown 6230.681Rutin0.318Pinoresinol-4-glu0.215
Unknown 6230.601Unknown 7310.6388-hydroxy-pinores-glu0.312Unknown 6230.208
Verbascoside0.577Rutin0.586ODHP0.299ODHP0.201
Kaempferol-3-rutinoside0.514Unknown 371_010.563Chlorogenic acid0.263Unknown 7190.189
Unknown 170.512Unknown 020.521Unknown 170.258Unknown 6010.180
Unknown 010.507Unknown 040.513Kaempferol-3-rutinoside0.246PC0.173
Unknown 7310.502Unknown 170.507TPH0.235Unknown 5510.159
Table 3. Main effects and interaction effects of location (L, all 14 monitoring plots), year (Y, 2020–2022), and crown damage class (CDC) for the phenolic parameters, calculated as effect-size measures (semi partial omega-squared) for F-tests from analysis of variance (ANOVA on ranks).
Phenolic Parameter LYL × YCDCL × CDCY × CDCL × Y × CDC
TPH c0.072a0.000 0.072a0.002 0.018b0.005 0.020a
ODHP c0.048a0.005b0.038a0.002 0.035a0.006b0.013
PC c0.052a0.028a0.060a0.002 0.000 0.001 −0.001
VAN c0.080a0.007a0.054a0.001 0.008 0.003 −0.015
Chlorogenic acid d0.056a0.009b0.028a0.002 −0.001 0.004 −0.004
Isoquercitrin d0.052a0.046a0.050a−0.002 0.014 −0.004 −0.003
Kaempferol-3-glucoside d0.034a0.058a0.043a0.000 −0.003 −0.005 −0.008
Kaempferol-3-rutinoside d0.089a0.023a0.040a0.004 0.005 −0.006 0.010
Ligstroside d0.048a0.068a0.019b−0.002 −0.010 −0.006 −0.011
Neochlorogenic acid d0.071a0.002 0.023b0.006 0.006 0.003 −0.007
Oleuropein d0.043a0.026a0.047a0.004 0.011 −0.007 −0.008
Rutin d0.017b0.013a0.098a0.005 0.019 −0.006 −0.001
Verbascoside d0.055a0.039a0.042a−0.002 0.019 −0.002 0.003
Unknown-01 d0.071a0.051a0.054a−0.001 0.038a−0.002 0.016
Unknown-02 d0.121a−0.002 0.047a0.002 0.002 −0.004 −0.001
Unknown-04 d0.126a0.012a0.080a−0.001 0.021b0.000 −0.010
Unknown-05 d0.115a−0.001 0.075a0.005 0.019 0.007 −0.003
Unknown-12 e0.075a0.009b0.137a0.003 −0.003 0.003 −0.007
Unknown-13 e0.046b0.062a0.106a−0.003 0.002 0.004 −0.009
Unknown-14 f0.252an.a. n.a. 0.004 0.015 n.a. n.a.
Unknown-15 e0.090a0.104a0.040a0.018a0.002 −0.003 0.001
Unknown-16 e0.043a0.028a0.126a0.009b0.004 0.002 0.002
Unknown-17 e0.101a0.002 0.037a−0.002 0.010 −0.004 −0.016
Unknown-aesculin-like e0.033a0.004 0.079a0.006 0.030b−0.003 −0.002
Unknown-342 e0.043a0.025a0.019b0.035a0.010 −0.004 −0.003
Unknown-371-01 e0.100a0.058a0.015b0.008b0.010 −0.003 −0.014
Unknown-371-03 e0.051a0.085a0.018b0.014a0.023b0.000 −0.002
Unknown-551 e0.097a0.020a0.048a0.001 0.016 0.008b−0.005
Unknown-555 e0.054a0.018a0.017b0.000 0.009 −0.004 −0.006
Unknown-601 e0.120a0.055a0.078a−0.005 0.010 −0.004 −0.019
Unknown-623 d0.099a0.032a0.019b0.003 −0.004 0.000 −0.011
Unknown-693 e0.050a0.013a0.011 0.006 −0.002 −0.004 −0.005
Unknown-719 g0.065b0.000 0.004 0.001 −0.014 0.000 0.026b
Unknown-731 d0.051a0.032a0.055a0.008b0.005 −0.006 −0.006
Unknown-755 e0.000 0.001 −0.006 −0.006 −0.043 −0.003 −0.030
Unknown-quercetin-like f0.037bn.a. n.a. −0.007 0.050 n.a. n.a.
Effects significant at a p < 0.01 and b p < 0.05; nonparametric ANOVA on ranks. Number of observations used for calculation: c 824, d 521, e 446, f 244 (data available only for one year), g 319.
Disclaimer/Publisher’s Note: The statements, opinions and data contained in all publications are solely those of the individual author(s) and contributor(s) and not of MDPI and/or the editor(s). MDPI and/or the editor(s) disclaim responsibility for any injury to people or property resulting from any ideas, methods, instructions or products referred to in the content.