Abstract
Soils act as sources or sinks for three major greenhouse gases (CO2, CH4, and N2O). Approximately 20% of global CO2 emissions are released from soils through the soil respiration process. Soil respiration (soil CO2 emission) can account for over 85% of ecosystem respiration. The aim of this study was to compare managed and unmanaged stands of pedunculate oak (Quercus robur L.) in order to investigate the impact of forest management on soil CO2 emissions. We selected one managed and two unmanaged stands. The first stand (S1) represents a managed middle-aged stand, which is the optimal stage of development. The second stand (S2) belongs to the over-mature stage of development in an old-growth oak forest, while the third stand (S3) belongs to the decay stage of development in an old-growth oak forest. The closed chambers method was used for air sampling and the air samples were analyzed using gas chromatography (GC). Multiple regression models that include soil temperature (ST), soil moisture (SM), and their interaction provide a better explanation for variation in soil CO2 emission (SCDE) (higher R2 values) compared to regression models that only involve two variables (ST and SM). The study showed that SCDE in the decay stage of old-growth forest (S3) was significantly lower (p < 0.001) compared to the other two stands (S1 and S2). S3 is characterized by very low canopy cover and intensive natural regeneration, unlike S1 and S2. However, there were no significant differences in SCDE between the managed middle-aged stand (S1) and the over-mature (old-growth) stand (S2). Over a long-term rotation period in pedunculate oak forests, forest management practices that involve the periodic implementation of moderate silvicultural interventions can be deemed acceptable in terms of maintaining the carbon balance in the soil.
1. Introduction
The increase in greenhouse gases (GHGs) in the atmosphere such as CO2 is a result of anthropogenic activities that have a significant impact on climate change [1]. Soils act as sinks or sources for principal GHGs such as CO2, CH4, and N2O [2,3]. Around 20% of global CO2 emissions are released from soils [3]. The emission of CO2 from soil is released through soil respiration processes involving root, microbial, and faunal respiration [3]. The agents contributing to soil CO2 emission are autotrophic organisms (plants are the most important autotrophs) and heterotrophic organisms (soil microorganisms and soil macrofauna) [4]. Root respiration is related to phenological patterns and the photosynthetic rate of plants [5]. Generally, the production of CO2 from soil originates as a result of the oxidation of soil organic matter decomposition by heterotrophic soil organisms (heterotrophic respiration) and plant root respiration (autotrophic respiration) [6]. Global soil CO2 emission is estimated to be around 70 Pg C y−1 [7,8]. The amount of CO2 emitted from soil is approximately ten times higher than the CO2 emissions released from burning fossil fuels [9]. Soil CO2 emission can account for over 85% of the total ecosystem respiration [10]. The average annual soil CO2 emission (soil respiration) was 69% of total ecosystem respiration and 55% of gross primary productivity in various forest ecosystems in Europe [11].
Soil organic matter consists of a complex mixture of materials that are in varying stages of decomposition ranging from recently added plant residues to highly decomposed material such as humus. The amounts of soil organic carbon are strongly related to the content of soil organic matter [12]. The soil organic carbon budget (2400 Gt) is approximately three times larger than the atmospheric carbon budget (800 Gt) [13]. Forest ecosystems store vast amounts of carbon and play a crucial role in managing soil carbon stock [14]. Labile and stable organic carbon are the two forms of organic carbon in soil [14]. The process that drives the CO2 emission between soil and atmosphere is the oxidation of labile organic carbon in the soil [14]. Soil moisture and temperature are the major microsite factors affecting soil CO2 emission [2,15,16].
The application of silvicultural interventions can lead to changes in microsite conditions within stands [17]. Regeneration cutting and thinning in forests and plantations induce a significant change in above-ground biomass and carbon stock [18,19,20,21]. However, the effect of harvesting on soil CO2 emission varies [20]. Cutting down trees in stands causes a change in canopy coverage which is related to changes in soil temperature and moisture [22]. Thinning in stands can lead to changes in soil temperature, soil water content, root density, and root activity which are directly linked to variations in soil CO2 emission [23]. Additionally, soil compaction caused by forest machinery can increase the CO2 concentration in forest soils compared to non-compacted soil [24]. The soil in managed forests has a higher deficit of carbon content compared to soil in unmanaged forests due to activities during forest management [25]. In managed forests, the higher CO2 emission from soil is a result of increased net primary production and decomposition of organic matter compared to unmanaged forests [26]. Anthropogenic activities in various land uses can cause a two-fold increase in soil CO2 emissions compared to reference soil. The conversion of unmanaged ecosystems to managed ecosystems mostly induces a decrease in soil organic carbon [27].
This study focuses on comparing managed and unmanaged forest stands to investigate the influence of forest management on soil CO2 emission (SCDE) in the Srem region, the Republic of Serbia. In this region, Quercus robur L. is the most dominant tree species, forming pure and mixed forests. Since this type of research has not been conducted in the Republic of Serbia before, the obtained results will provide a clearer understanding of the effects of forest management on soil CO2 emission (SCDE). The goals of this study were to (1) determine the dynamics of SCDE under managed and unmanaged forest stands during different seasons; (2) compare the differences in SCDE between managed and unmanaged forest stands; and (3) explore the impacts of the main factors of SCDE (soil temperature (ST) and soil moisture (SM)) on the variation of SCDE.
2. Materials and Methods
2.1. The Study Design
The two-year study was carried out in Quercus robur L. lowland forests from June 2021 to October 2022 in the Srem region, Serbia (Figure 1). The climate of this region is moderate–continental. During the observation period from 1991 to 2020, the mean annual temperature was 11.8 °C, and the mean annual precipitation amounted to 617.1 mm [28]. In 2021, the total amount of precipitation was 726.6 mm, while in 2022, the total precipitation was 160 mm less than the previous year. During the study period, the highest monthly average temperature (24.4 °C) was recorded in July 2021 [28]. The study location was chosen in the flooded zone. During the study period, there were no recorded floods in this zone.
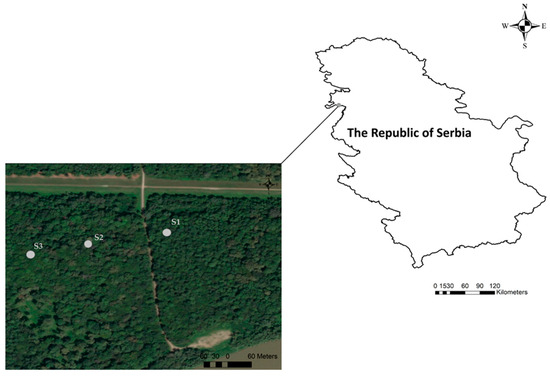
Figure 1.
The location of the examined stands: S1—optimal stage (middle-aged stand)—managed stand; S2—over-mature stage (unmanaged stand); S3—decay stage (unmanaged stand).
The goal of this study was to compare soil CO2 emission (SCDE) within the same type of soil among managed and unmanaged stands. To evaluate the effects of forest management on soil CO2 emission (SCDE), we selected one managed and two unmanaged stands within the study location (Table 1). We selected managed stand that was closest to the strict nature reserve (two unmanaged stands). All three stands were chosen based on similar edaphic conditions and the approximately equal distance of stands from the river.

Table 1.
Structural attributes of examined pedunculate oak stands within habitat type of Carpino-Fraxino-Quercetum roboris Miš. et Broz 1962. subass. inundatum.
All three selected stands belong to the habitat type of pedunculate oak, narrow-leaved ash, and hornbeam in flooded zone—Carpino-Fraxino-Quercetum roboris Miš. et Broz 1962. subass. inundatum [29]. All studied stands are situated on flat terrain. Additionally, the research equipment in each stand was located approximately 600 m from the Sava River. The examined stands were selected within same habitat and soil type, but their structural attributes were distinctly different (Table 1).
2.1.1. Characteristics of the Examined Forest Stands
The first stand examined within the study location was S1 (44°54′58.11″ N; 19°14′46.63″ E) which is middle-aged stand (managed stand) (Figure A1). Based on structural attributes described in Table 1, the current state of this stand can be defined as optimal stage of stand development. In terms of total stand volume, narrow-leaved ash (Fraxinus angustifolia Vahl.) is the dominant species in this stand, compared to Quercus robur L. and Carpinus betulus L. The canopy coverage value of this stand is estimated to be 0.7. Silvicultural interventions, specifically moderate thinning (removing less than 25 percent), were conducted in this stand during the previous period. Based on the value of canopy coverage, this stand has recovered from logging that was carried out in the previous period.
We selected two unmanaged stands of different successional stages in old-growth pedunculate oak forests that belong to the strict nature reserve named ’Stara Vratična’. The conservation status of the strict nature reserve was defined in 1978, when 10.3 hectares were designated for strict protection [30].
The second stand (S2) (44°54′57.39″ N; 19°14′38.12″ E) was selected in the over-mature stage of old-growth pedunculate oak forest (Figure A2). In terms of total stand volume, the pedunculate oak (Quercus robur L.) is the dominant species in this stand, compared to other species such as Fraxinus angustifolia Vahl. and Carpinus betulus L. The oldest pedunculate oak trees have reached at least 400 years old [30]. Many of these trees are devitalized and hollow. The estimated canopy coverage value for this stand is 0.6. Natural regeneration has not been observed in this stand. Additionally, the stand is characterized by sparse ground vegetation.
The third stand (S3) (44°54′56.42″ N; 19°14′33.11″ E) is also situated in strict nature reserve, where individually very old and dying trees of pedunculate oak can be found (decay stage) (Figure A3). This stand has an open canopy (0.1), but the ground layer is rich with seedlings of Fraxinus angustifolia Vahl., Acer campestre L, Carpinus betulus L., Crataegus monogyina Jacq., Cornus sanguinea L., Ulmus laevis Pall., and Acer tataricum L. that occurred spontaneously. The seedlings of Quercus robur L. were not found in this stand. In this part of the reserve, the process of natural stand regeneration has spontaneously begun. This stand shows typical characteristics of a very late successional stage of forest including natural regeneration and big dying trees.
2.1.2. The Soil Properties in Habitat Type of Carpino-Fraxino-Quercetum roboris Miš. et Broz 1962. Subass. inundatum
The examined stands belong to the same habitat type, and they are approximately equal distance from the riverbank. These stands are located in a flooded zone where the formation of soil significantly depends on its position relative to the river. In this zone, the soil profile was opened within the habitat type of Carpino-Fraxino-Quercetum roboris Miš. et Broz 1962. subass. inundatum to determine soil properties (Figure A4). Physical and chemical properties were determined for each horizon [31]. According to the official soil classification of the Republic of Serbia, Humofluvisol was determined as the soil type (WRB: Fluvisol, humic) [32,33]. The properties of Humofluvisol (WRB: Fluvisol, humic) for each horizon are given in Table 2. The Aa horizon represents a humus-accumulative horizon developed in hydromorphic conditions caused by periodic flooding. The C horizon is formed of parent material consisting of fluvial deposits. The impacts of periodic floods in the past have resulted in a shallow Aa horizon. Considering the different characteristics of the stands, notably higher abundance of dead wood was recorded in S2 compared to the other two stands (S1 and S3).

Table 2.
Physical and chemical properties of Humofluvisol (WRB: Fluvisol, humic).
2.2. Data Collection and Analysis
Air sampling was performed using the closed chambers method to measure soil CO2 emission (SCDE) within the examined stands. The device for collecting air samples consists of a removable PVC chamber and a fixed PVC collar that is permanently installed in the soil [34]. Air sampling was conducted using five chambers positioned at representative places in each stand [31]. The chambers were evenly distributed in representative places within each stand. All chambers within each stand were installed under homogeneous site conditions [31]. During the installation of chambers, we avoided the edges of stands, trails, areas with varying canopy cover, and locations with unusual microtopography in each stand.
In each examined stand, the five PVC collars were pushed into the soil at a depth of 10 cm during the study period. The insertion of collars can cause soil disturbance [35]. In order to stabilize the soil CO2 emission (SCDE), the first air sampling was conducted two weeks after inserting the collars [35]. The air sampling protocol was presented by Karaklić et al. (2023) [36] and similar protocol was also presented by Ming et al. (2018) [37]. Before air sampling, PVC chambers were installed on the surface of the collars. Air within each chamber was continuously homogenized using a small integrated fan, while a gas extraction valve was installed on the top of the chamber. Air sampling was conducted three times at equal time intervals using a syringe. During each soil gas sampling, 10 mL of gas was collected at 15, 30, and 45 min after chamber closure. The sampled gas was then injected into glass vials.
The collection of samples was performed before noon, between 8:00 and 11:00 a.m. [14]. In each stand, air samples were taken two or three times a month. Due to snow cover and frozen soils, the air sampling was not conducted throughout the winter [31]. On every sampling date, a total of 45 gas samples were collected (3 forest stands × 5 chambers per stand × 3 sampling times per chamber). There were 25 observations during the study period (2021–2022) and we collected and analyzed a total of 1125 samples.
The concentration of CO2 was measured with a gas chromatograph system (Agilent 8890, Agilent Technologies, Santa Clara, CA, USA) equipped with a flame ionization detector (FID). The gas chromatograph (GC) was calibrated using ultra-high purity CO2 standard. The soil CO2 emission (SCDE) was calculated using following equation [38,39]:
where SCDE is soil CO2 emission, ρ is density of CO2 in the standard state, V is volume of the chamber, A is bottom area of the chamber, ΔCO2/Δt is linear increase in the CO2 concentration inside the chamber during the sampling time, T is the absolute temperature at the time of sampling and T0 is absolute temperature in the standard state.
SCDE = ρ × V/A × ΔCO2/Δt × T0/T
The values of soil CO2 emission (SCDE) are expressed in g CO2 m−2 d−1 [40]. During air sampling, a soil thermometer was used to measure the soil temperature at a depth of 5 cm and the gravimetric method was used to determine the soil moisture [36].
2.3. Statistical Analyses
Multiple linear regression was used to evaluate the effects of soil temperature (ST) and soil moisture (SM) on soil CO2 emission (SCDE) during different seasons [41,42]. Multiple linear regression analyses were performed as follows:
where SCDE is soil CO2 emission (g CO2 m−2 d−1), ST is soil temperature (°C), SM is soil moisture (%), and a, b, c, and d are the regression coefficients.
SCDE = a + bST + cSM
SCDE = a + bST + cW + dST × SM
A one-way analysis of variance (ANOVA) with Tukey’s HSD test was performed to test differences in soil CO2 emission (SCDE) between examined stands. R statistical software (version 4.0.2) was used for all statistical analyses. The graphs were created using “ggplot2” (version 3.3.2) [43] and “scatterplot3d” (version 0.3-41) [44] packages in the R environment.
3. Results
3.1. Dynamics of SCDE
Observed SCDE within S1, S2, and S3 during 2021 showed values ranging from 2.00 to 27.10 g CO2 m−2 d−1, 5.70–22.28 g CO2 m−2 d−1, and 2.21–20.34 g CO2 m−2 d−1, respectively (Figure 2). SCDE exhibited similar dynamics across all three stands. At the beginning of the study period, SCDE increased and reached its peak on 23 June. During the first week of July, SCDE decreased, then increased again in the middle of July. Within S2 and S3, SCDE decreased from the middle of July to the first week of August. At the beginning of September, SCDE decreased slightly within S1 compared to the other two stands. Lower SCDE was recorded within S3 compared to S1 and S2 in the last week of September 2021.
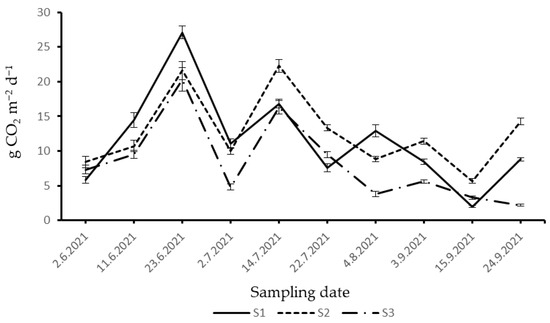
Figure 2.
Dynamics of SCDE in 2021: (S1)—optimal stage (middle-aged stand); (S2)—over-mature stage; (S3)—decay stage.
During 2022, SCDE in S1, S2, and S3 ranged from 1.93 to 20.63 g CO2 m−2 d−1, 2.55–19.43 g CO2 m−2 d−1, and 0.1–13.64 g CO2 m−2 d−1, respectively (Figure 3). At the beginning of the spring season, there was a rise in SCDE in all three stands. Furthermore, SCDE decreased until the middle of May in all three stands. In the last week of May, SCDE was higher in S1 and S2 compared to S3.
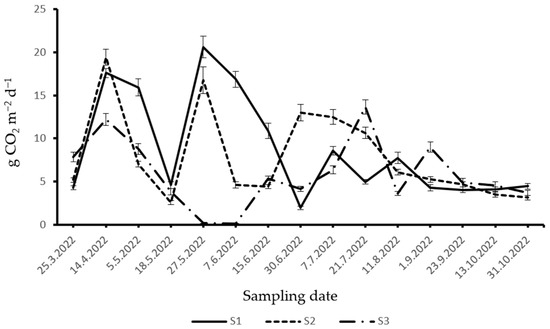
Figure 3.
Dynamics of SCDE in 2022: (S1)—optimal stage (middle-aged stand); (S2)—over-mature stage; (S3)—decay stage.
In June, a decrease in SCDE was observed in S1. From the end of June to the middle of August, there were alternating increases and decreases in SCDE in this stand. At the end of June, SCDE was higher in S2 compared to the other two examined stands. Furthermore, SCDE in S2 showed a decreasing trend until the end of the summer period in 2022. SCDE in S3 had alternating increases and decreases during the summer period in 2022.
During the autumn season, SCDE was mostly uniform in S1, while a slight decrease was recorded in S2. A decreasing trend was observed in SCDE in S3 during the autumn of 2022.
3.2. Seasonal Variations in SCDE Between Examined Stands
Seasonal variations in SCDE are shown in Figure 4. In the spring season, SCDE was significantly higher (p < 0.05) in S1 than in S3. However, there was no significant difference (p > 0.05) in SCDE between S1 and S2 during spring. During the summer period, SCDE was significantly lower (p < 0.05) in S3 compared to the other two stands. Significantly higher SCDE (p < 0.05) was recorded in S2 during the autumn season compared to S1 and S3.
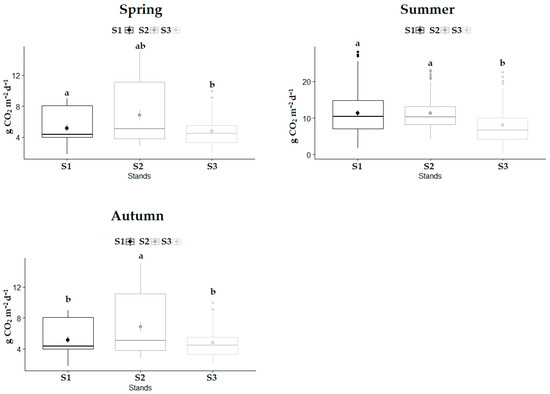
Figure 4.
Seasonal variations in SCDE for each stand during study period: (S1)—variation in SCDE in optimal stage; (S2)—variation in SCDE in over-mature stage; (S3)—variation in SCDE in decay stage. Significant differences in SCDE between the stands were determined using a one-way analysis of variance (ANOVA) with Tukey’s HSD test (p < 0.05). The differences in SCDE are displayed as different lowercase letters above the box plots. The middle line within the box represents the median value of the dataset, while the dot represents mean value.
3.3. The Effects of Stand Developmental Stage on SCDE
During the study period, the mean SCDE in S1, S2, and S3 were 9.84 g CO2 m−2 d−1, 9.82 g CO2 m−2 d−1, and 6.84 g CO2 m−2 d−1, respectively (Figure 5). The lowest mean SCDE was observed in the decay stage (S3). The optimal stage (S1) and over-mature stage had significantly higher values of SCDE (p < 0.001) compared to the decay stage (S3). There were no significant differences in SCDE between S1 and S2. Out of the three stands examined, the lowest coefficient of variation (CV) was 57.85%, which was found in S2. The highest CV value was obtained in S3 (69.70%), while the CV value amounted to 65.01% for S1.
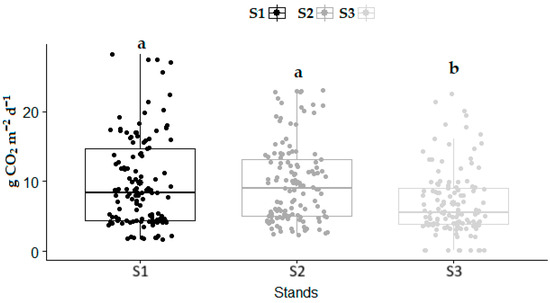
Figure 5.
SCDE variation between examined stands during the whole study period: (S1)—variation in SCDE in optimal stage; (S2)—variation in SCDE in over-mature stage; and (S3)—variation in SCDE in decay stage. Significant differences in SCDE between the stands were determined using a one-way analysis of variance (ANOVA) with Tukey’s HSD test (p < 0.001). The differences in SCDE are displayed as different lowercase letters above the box plots. The middle line within the box represents the median value of the dataset.
3.4. Seasonal Influences of ST and SM on SCDE
The combined influence of ST and SM on SCDE in the examined stands is illustrated in Figure 6 for each season. The results of regression analyses for each stand are shown in Table A1 (Appendix A).
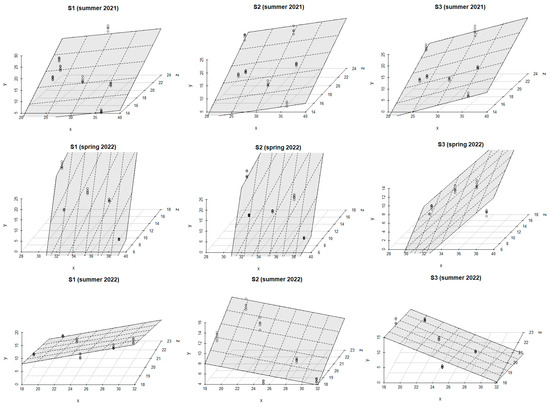
Figure 6.
The combined effect of ST and SM on SCDE for the different seasons during the study period (model: E = a + bST + cSM): y-axis (SCDE (g CO2 m−2 day−1)); x-axis (SM (%)); and z-axis (ST (°C)).
ST was the main driver affecting SCDE in all three stands (S1, S2, S3) during the summer of 2021. As ST rose, SCDE in S1 increased more noticeably compared to S2 and S3. The combined effect of ST and SM on SCDE was similar in all three stands during the summer of 2021. The values of R2 ranged from 0.44 to 0.52 (p < 0.001) for both models.
A similar influence of ST and SM on SCDE was recorded in S1 and S2 during the spring of 2022. For both stands, the R2 values of the regression models ranged from 0.63 to 0.96 (p < 0.001). In S3, the main factor influencing SCDE was SM, as the rise in SM was followed by an increase in SCDE. High values of R2 were obtained for both regression models within this stand (R2 = 0.66, p < 0.001, and R2 = 0.97, p < 0.001).
During the summer of 2022, SCDE was primarily controlled by SM in S1, while ST had the strongest impact on SCDE in S2. The increase in these microclimatic factors led to higher SCDE in both stands. However, an increase in SM induced a reduction in SCDE in S3. High R2 values for regression models were obtained in all stands and ranged from 0.80 to 0.93 (p < 0.001).
4. Discussion
Forest management directly affects soil organic carbon stock. Also, forest management can stimulate litter decomposition and litter quality can be altered by choosing the species (chemical quality of litter and its quantity) and thinning intensity [45]. The contribution of autotrophic and heterotrophic components to total soil respiration varies with thinning intensity depending on dead roots and harvest residues from felled trees [46]. Additionally, the contributions of these components to total soil respiration significantly depend on precipitation conditions, vegetation density, microbial biomass, and root biomass [5]. The intensive management in forests affected higher soil respiration due to the rise of net primary production and the decomposition of soil organic carbon [26]. The mean diameter was the crucial structural parameter in the unmanaged beech forest, explaining 10%–19% of the variation in soil CO2 emission during the growing season [47].
Although the autotrophic and heterotrophic components were not measured separately, seasonal variations in soil CO2 emission can be attributed to their different contributions to total soil respiration during the study period. Our results showed that the optimal stage (S1) had significantly higher soil CO2 emissions compared to the decay stage (S3) during spring and summer. This can be explained by the greater root biomass that respires in this stand. However, there was no significant difference in emission between S1 and S2 during these seasons. Throughout autumn, significantly higher soil CO2 emission was observed in S2 compared to other stands. The higher contribution of heterotrophic respiration to total soil respiration can be explained by the increased microbial decomposition activity resulting from the accumulation of above-ground litter in older stands [48,49]. The higher values of soil CO2 emission during spring and summer periods can be attributed to higher root activity and more intensive decomposition of organic matter unlike the autumn season [40,50]. Autotrophic respiration is greatly influenced by the phenological patterns of tree species [5]. Stands S1 and S3 had significantly lower soil CO2 emissions compared to the old-growth stand (S2) in the autumn season. This can be attributed to a decrease in autotrophic soil respiration in S1 and S3 at the end of the vegetation period, as well as higher heterotrophic soil respiration in S2 due to the greater accumulation of dead organic matter in this stand.
Various characteristics of a stand, including stand canopy, successional stages of the stand, litter depth, amount of dead wood, soil microbial activity, number of trees per hectare, mean diameter of the stand, root density, as well as soil properties, can affect the trend of soil CO2 emission during the year [23,46,47,51]. Taking into account the different characteristics of the examined stands, the varying dynamics of soil CO2 emission can be explained by the unique characteristics of each stand.
The impact of the main drivers (soil temperature and soil moisture) on soil CO2 emission can vary throughout different seasons [40,52]. Soil CO2 emission was primarily controlled by soil temperature except in early summer in a Chinese mountain area [15]. Soil temperature and moisture had varying effects on soil CO2 emission during different periods of study conducted in the black soil zone in northeast China [53]. In the Mediterranean ecosystem, soil CO2 emission was predominantly controlled by soil temperature when the soil moisture value was over 10%. However, below this value, soil CO2 emission was controlled by soil moisture [54]. The study focusing on urban ecosystems in India showed that the interaction of soil temperature and moisture with nutrient availability significantly controls the seasonal variation in soil CO2 emission [27]. In our study, soil CO2 emission was primarily controlled by soil temperature in all three stands during the summer of 2021. However, in 2022, soil temperature and moisture had varying effects on emissions depending on the season. In our previous study, we found that the influence of soil temperature and moisture on soil CO2 emission varied between managed and unmanaged stands of pedunculate oak over the 2-year study period [55].
Our results showed that soil CO2 emission in the decay stage (S3) was significantly lower compared to the other two stands (S1 and S2) during the entire study period. This can be explained by significantly different characteristics of the examined stands. The third stand (S3) is characterized by very low canopy cover (few big dying trees per hectare) and very intensive natural regeneration. On the other hand, there were no significant differences between the optimal stage (S1) and the over-mature stage (S2), because these stands had similar values of canopy cover as well as a low level of natural regeneration. Additionally, the application of moderate silvicultural interventions (thinning) in the middle-aged stand (S1) during the previous period did not cause significant increases in soil CO2 emission compared to the reference old-growth stand (S2). In a previous study conducted in pedunculate oak stands, it was found that a 4-year-old stand that was artificially regenerated had significantly higher soil CO2 emission compared to a natural 70-year-old stand [31]. Additionally, the study showed that an artificially regenerated 14-year-old stand had a similar response to soil CO2 emission as a natural 70-year-old stand [31]. Although artificial regeneration of a stand can initially lead to an increase in soil CO2 emission compared to natural regeneration, over time, a stand that is artificially established can exhibit a similar effect on soil CO2 emission as an older natural stand.
Soil respiration also known as soil CO2 emission can significantly contribute to total ecosystem respiration [10]. We found that soil CO2 emission within S3 (decay stage) was statistically lower compared to the other examined stands. Additionally, this stand is characterized by natural regeneration in large groups which has high potential for carbon sequestration. Forests have a larger amount of carbon per unit area [56], as well as higher net ecosystem production compared to grassland and cropland [57,58]. Net biome productivity in European grasslands was estimated at −104 ± 73 g C m2 year−1 [59]. Hence, the regeneration of old forests and the establishment of new young stands are very important in terms of carbon sequestration. The planned rotation length for pedunculate oak in the Srem forest region is typically between 160 and 200 years [60]. Furthermore, the planned regeneration period for these forests is usually 20 years, but modern forest management techniques have significantly reduced this timeframe. The largest areas of pedunculate oak forests in the Srem forest region are classified under the fifth, sixth, and eighth age classes (each class covers 20 years) [61]. Considering that most stands in this region are in the later stages of development, regeneration of these forests in the future should be carried out in a shorter timeframe.
Based on a synthesis of 53 published studies [62], forest thinning can significantly increase soil temperature and soil respiration. In some plantations, soil CO2 emission increased with thinning intensity [63,64]. In these plantations, the negative effects of thinning include reduced soil carbon storage and increased organic matter decomposition due to higher temperatures [64]. However, thinning did not have a significant effect on soil organic carbon stock [62]. The disturbance caused by logging operations led to a short-term increase in soil CO2 emission [65]. On the other hand, some authors suggest that soil respiration was decreased by forest thinning probably as a result of a decrease in root density [23,66]. In our case, the managed stand (S1) was thinned a few years ago. According to the value of canopy coverage, this stand has recovered from logging. Therefore, there were no significant differences in soil CO2 emission between the managed stand (S1) and the over-mature stand (unmanaged stand) (S2). Similar results were obtained in Larix kaempferi (Lam.) Carr. stands. In these stands, there were no significant differences between thinned and unthinned stands six months after thinning [67].
During the rotation period, it is acceptable to implement moderate silvicultural interventions, especially in middle-aged stands (which represent the longest period of development in even-aged stands). The implementation of moderate thinning intensity over a long period of rotation can be considered acceptable for maintaining carbon balance in the soil. This is because stabilization in soil CO2 emission can be anticipated soon after moderate thinning.
5. Conclusions
Regression models that include soil temperature, soil moisture, and their interaction provide a better explanation for variation in soil CO2 emission compared to models that only involve two variables (soil temperature and moisture). During the summer of 2021, soil temperature was the dominant driver affecting soil CO2 emission in all three stands that were examined. However, the influence of soil temperature and moisture had varying effects on soil CO2 emission during different seasons in 2022. The managed middle-aged stand (S1) had significantly higher CO2 emissions compared to the decay stage of an old-growth stand (S3) during spring and summer. Throughout autumn, significantly higher emission was observed in the over-mature stage of an old-growth stand (S2) compared to the other stands (S1 and S3).
The decay stage of an old-growth stand (S3) has significantly lower CO2 emissions compared to the over-mature stage of an old-growth stand (S2) and a managed middle-aged stand (S1). This difference in emission can be ascribed to the different characteristics of the stands, i.e., the decay stage of an old-growth stand is characterized by very low canopy cover and intensive natural regeneration compared to the other two stands. On the other hand, there were no differences in soil CO2 between the middle-aged (managed) stand (S1) and the reference over-mature (old-growth) stand (S3). During the long-term management of pedunculate oak forests (sustainable forest management), the implementation of necessary silvicultural interventions of moderate intensity should not have a significant impact on the loss of soil carbon through the emission of CO2 from the soil.
Author Contributions
V.K., Z.G. and M.S. designed the experiment; V.K., Z.G., I.G., Z.N. and M.K. collected samples; M.S., V.K. and Z.G. performed laboratory analyses; V.K. wrote this paper; and S.O. provided some suggestions to improve the paper quality. All authors have read and agreed to the published version of the manuscript.
Funding
This research was funded by the Ministry of Science, Technological Development, and Innovation of the Republic of Serbia (Grants No. 451-03-136/2025-03/200197).
Data Availability Statement
The data presented in this study are available from the corresponding author upon request.
Acknowledgments
We acknowledge the “Vojvodinašume” public enterprise and the Institute for Nature Conservation of Vojvodina Province.
Conflicts of Interest
The authors declare no conflicts of interest.
Appendix A

Table A1.
Results of multiple linear regression for each stand during different seasons.
Table A1.
Results of multiple linear regression for each stand during different seasons.
| Stand/Season | Model | Regression Equations | Coefficients | N | R2 | R2adj | p-Value | |||
|---|---|---|---|---|---|---|---|---|---|---|
| a | b | c | d | |||||||
| S1/Summer 2021 | 1. | SCDE = a + bST + cSM | −29.000 ** | 1.900 *** | 0.214 | 35 | 0.52 | 0.49 | <0.001 | |
| 2. | SCDE = a + bST + cSM + dST × SM | −42.770 | 2.591 | 0.629 | −0.021 | 35 | 0.52 | 0.47 | <0.001 | |
| S2/Summer 2021 | 1. | SCDE = a + bST + cSM | −24.788 *** | 1.595 * | 0.269 ’ | 35 | 0.47 | 0.43 | <0.001 | |
| 2. | SCDE = a + bST + cSM + dST × SM | −96.702 ’ | 5.213 * | 2.431 | −0.110 | 35 | 0.51 | 0.46 | <0.001 | |
| S3/Summer 2021 | 1. | SCDE = a + bST + cSM | −36.082 *** | 1.589 *** | 0.558 ** | 35 | 0.44 | 0.40 | <0.001 | |
| 2. | SCDE = a + bST + cSM + dST × SM | −92.921 | 4.449 | 2.266 ’ | −0.087 | 35 | 0.46 | 0.41 | <0.001 | |
| S1/Spring 2022 | 1. | SCDE = a + bST + cSM | −385.711 *** | 9.216 *** | 8.408 *** | 25 | 0.95 | 0.95 | <0.001 | |
| 2. | SCDE = a + bST + cSM + dST × SM | −363.709 *** | 7.570 *** | 7.787 *** | 0.048 ’ | 25 | 0.96 | 0.96 | <0.001 | |
| S2/Spring 2022 | 1. | SCDE = a + bST + cSM | −337.025 *** | 7.694 *** | 7.458 *** | 25 | 0.63 | 0.60 | <0.001 | |
| 2. | SCDE = a + bST + cSM + dST × SM | −371.467 *** | 10.271 ** | 8.430 *** | −0.075 | 25 | 0.65 | 0.60 | <0.001 | |
| S3/Spring 2022 | 1. | SCDE = a + bST + cSM | −63.316 ’ | 0.911 | 1.742 * | 25 | 0.66 | 0.63 | <0.001 | |
| 2. | SCDE = a + bST + cSM + dST × SM | 32.530 * | −6.257 *** | −0.961 ** | 0.209 *** | 25 | 0.97 | 0.97 | <0.001 | |
| S1/Summer 2022 | 1. | SCDE = a + bST + cSM | 24.387 *** | −1.440 *** | 0.525 *** | 30 | 0.89 | 0.88 | <0.001 | |
| 2. | SCDE = a + bST + cSM + dST × SM | −41.034 * | 1.960 ’ | 3.469 *** | −0.154 ** | 30 | 0.93 | 0.92 | <0.001 | |
| S2/Summer 2022 | 1. | SCDE = a + bST + cSM | −9.317 | 1.265 *** | −0.300 ** | 30 | 0.80 | 0.78 | <0.001 | |
| 2. | SCDE = a + bST + cSM+ dST × SM | −11.447 | 1.376 | −0.204 | −0.005 | 30 | 0.80 | 0.78 | <0.001 | |
| S3/Summer 2022 | 1. | SCDE = a + bST + cSM | 60.547 *** | −1.476 *** | −1.053 *** | 30 | 0.85 | 0.84 | <0.001 | |
| 2. | SCDE = a + bST + cSM + dST × SM | 134.874 *** | −5.339 *** | −4.397 *** | 0.175 *** | 30 | 0.90 | 0.89 | <0.001 | |
Significant codes: *** (0.001); ** (0.01); * (0.05); ’ (0.1).
Appendix B
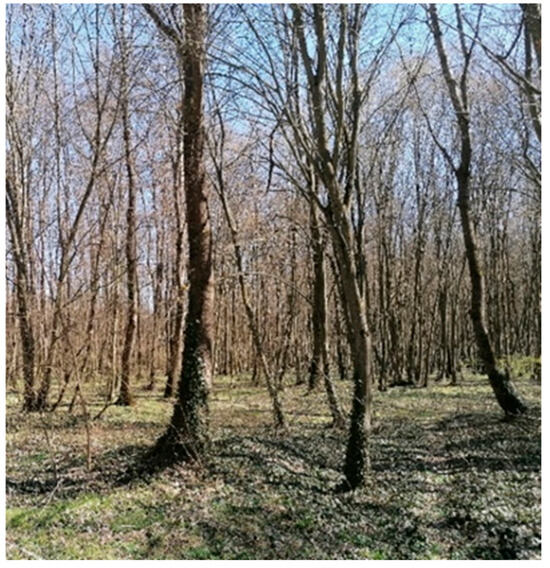
Figure A1.
Optimal stage (middle-aged stand) within habitat type of Carpino-Fraxino-Quercetum roboris Miš. et Broz 1962. subass. inundatum.
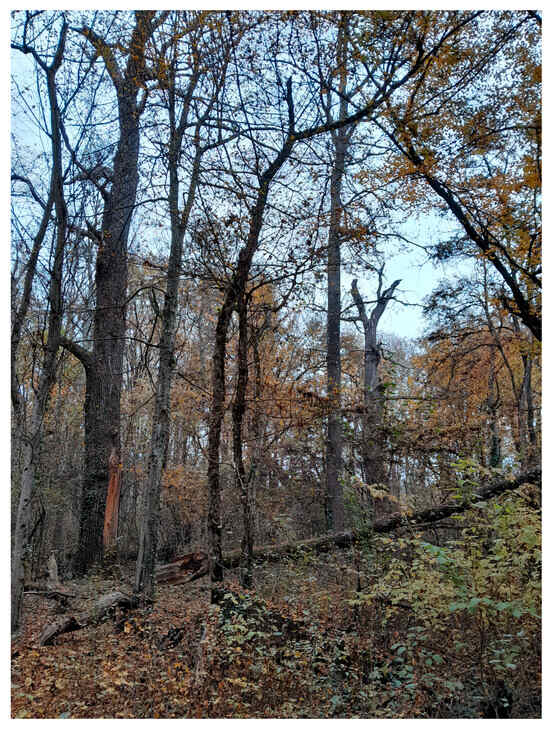
Figure A2.
Over-mature stage within habitat type of Carpino-Fraxino-Quercetum roboris Miš. et Broz 1962. subass. inundatum.
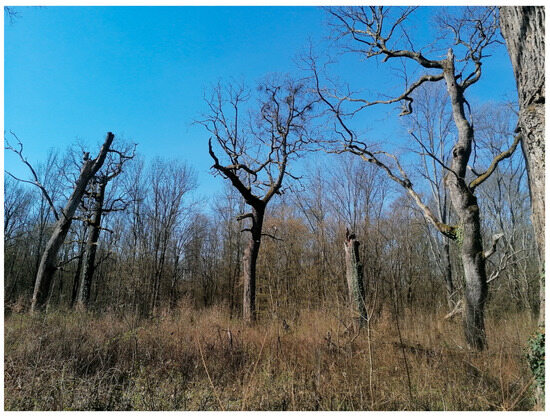
Figure A3.
Decay stage within habitat type of Carpino-Fraxino-Quercetum roboris Miš. et Broz 1962. subass. inundatum.
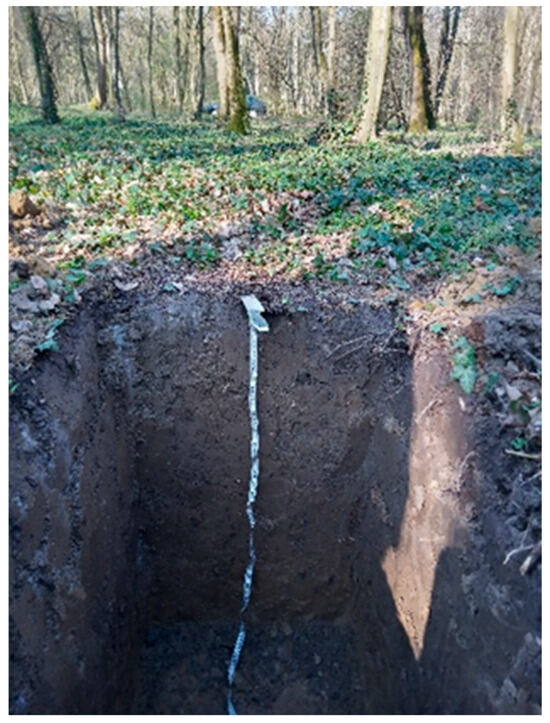
Figure A4.
Soil profile within habitat type of Carpino-Fraxino-Quercetum roboris Miš. et Broz 1962. subass. inundatum.
References
- Dignac, M.F.; Derrien, D.; Barré, P.; Barot, S.; Cécillon, L.; Chenu, C.; Chevallier, T.; Freschet, G.T.; Garnier, P.; Guenet, B.; et al. Increasing soil carbon storage: Mechanisms, effects of agricultural practices and proxies. A review. Agron. Sustain. Dev. 2017, 37, 14. [Google Scholar] [CrossRef]
- Oertel, C.; Matschullat, J.; Zurba, K.; Zimmermann, F.; Erasmi, S. Greenhouse gas emissions from soils—A review. Geochemistry 2016, 76, 327–352. [Google Scholar] [CrossRef]
- Lubbers, I.M.; Van Groenigen, K.J.; Fonte, S.J.; Six, J.; Brussaard, L.; Van Groenigen, J.W. Greenhouse-gas emissions from soils increased by earthworms. Nat. Clim. Chang. 2013, 3, 187–194. [Google Scholar] [CrossRef]
- Kuzyakov, Y. Sources of CO2 efflux from soil and review of partitioning methods. Soil Biol. Biochem. 2006, 38, 425–448. [Google Scholar] [CrossRef]
- Kumari, T.; Singh, R.; Verma, P.; Raghubanshi, A.S. Monsoon-phase regulates the decoupling of auto-and heterotrophic respiration by mediating soil nutrient availability and root biomass in tropical grassland. CATENA 2022, 209, 105808. [Google Scholar] [CrossRef]
- Zhao, Z.M.; Shi, F.X. Contribution of root respiration to spatial-temporal variation of soil respiration in a Haloxylon ammodendrons ecosystem in Gurbantunggut Basin. Acta Ecol. Sin. 2017, 37, 392–398. [Google Scholar] [CrossRef]
- Wang, Z.Y.; Xie, J.B.; Wang, Y.G.; Li, Y. Biotic and abiotic contribution to diurnal soil CO2 fluxes from saline/alkaline soils. Sci. Rep. 2020, 10, 5396. [Google Scholar] [CrossRef]
- Samardžić, M.; Galić, Z.; Orlović, S.; Kovač, M.; Andreeva, I.; Vasenev, I. Environmental assessment of greenhouse gases’ emission in poplar plantation under extreme climate conditions of winter 2019/2020. Topola 2021, 208, 15–19. [Google Scholar] [CrossRef]
- Raich, J.W.; Schlesinger, W.H. The global carbon dioxide flux in soil respiration and its relationship to vegetation and climate. Tellus B 1992, 44, 81–99. [Google Scholar] [CrossRef]
- Knohl, A.; Søe, A.R.; Kutsch, W.L.; Göckede, M.; Buchmann, N. Representative estimates of soil and ecosystem respiration in an old beech forest. Plant Soil 2008, 302, 189–202. [Google Scholar] [CrossRef]
- Janssens, I.A.; Lankreijer, H.; Matteucci, G.; Kowalski, A.S.; Buchmann, N.; Epron, D.; Pilegaard, K.; Kutsch, W.; Longdoz, B.; Grünwald, T.; et al. Productivity overshadows temperature in determining soil and ecosystem respiration across European forests. Glob. Change Biol. 2001, 7, 269–278. [Google Scholar] [CrossRef]
- Ontl, T.A.; Schulte, L.A. Soil carbon storage. Nat. Educ. Knowl. 2012, 3, 35. [Google Scholar]
- Jobbágy, E.G.; Jackson, R.B. The vertical distribution of soil organic carbon and its relation to climate and vegetation. Ecol. Appl. 2000, 10, 423–436. [Google Scholar] [CrossRef]
- Köster, K.; Püttsepp, Ü.; Pumpanen, J. Comparison of soil CO2 flux between uncleared and cleared windthrow areas in Estonia and Latvia. For. Ecol. Manag. 2011, 262, 65–70. [Google Scholar] [CrossRef]
- Li, H.J.; Yan, J.X.; Yue, X.F.; Wang, M.B. Significance of soil temperature and moisture for soil respiration in a Chinese mountain area. Agric. For. Meteorol. 2008, 148, 490–503. [Google Scholar] [CrossRef]
- Teramoto, M.; Liang, N.; Zeng, J.; Saigusa, N.; Takahashi, Y. Long-term chamber measurements reveal strong impacts of soil temperature on seasonal and inter-annual variation in understory CO2 fluxes in a Japanese larch (Larix kaempferi Sarg.) forest. Agric. For. Meteorol. 2017, 247, 194–206. [Google Scholar] [CrossRef]
- Ma, S.; Concilio, A.; Oakley, B.; North, M.; Chen, J. Spatial variability in microclimate in a mixed-conifer forest before and after thinning and burning treatments. For. Ecol. Manag. 2010, 259, 904–915. [Google Scholar] [CrossRef]
- Klašnja, B.; Orlović, S.; Galić, Z.; Drekić, M.; Vasić, V. Poplar biomass of high density short rotation plantations as raw material for energy production. Wood Res. 2008, 53, 27–38. [Google Scholar]
- Klašnja, B.; Orlović, S.; Galić, Z. Energy potential of poplar plantations in two spacing and two rotations. Šumarski List 2012, 3–4, 161–167. [Google Scholar]
- Peng, Y.; Thomas, S.C.; Tian, D. Forest management and soil respiration: Implications for carbon sequestration. Environ. Rev. 2008, 16, 93–111. [Google Scholar] [CrossRef]
- Matović, B.; Pekeč, S.; Vidović, D.; Drekić, M.; Višacki, V.; Kesić, L.; Perendija, N.; Vaštag, E.; Orlović, S.; Stojnić, S. Management practice effects on biomass and soil carbon stock in European beech (Fagus sylvatica L.) forests on Fruška Gora Mountain, Serbia. Topola/Poplar 2024, 214, 17–34. [Google Scholar] [CrossRef]
- Guo, J.; Yang, Y.; Chen, G.; Xie, J.; Gao, R.; Qian, W. Effects of clear-cutting and slash burning on soil respiration in Chinese fir and evergreen broadleaved forests in mid-subtropical China. Plant Soil 2010, 333, 249–261. [Google Scholar] [CrossRef]
- Tang, J.; Qi, Y.; Xu, M.; Misson, L.; Goldstein, A.H. Forest thinning and soil respiration in a ponderosa pine plantation in the Sierra Nevada. Tree Physiol. 2005, 25, 57–66. [Google Scholar] [CrossRef] [PubMed]
- Staněk, L.; Neruda, J.; Ulrich, R. Changes in the concentration of CO2 in forest soils resulting from the traffic of logging machines. J. For. Sci. 2025, 71, 250–267. [Google Scholar] [CrossRef]
- Noormets, A.; Epron, D.; Domec, J.C.; McNulty, S.G.; Fox, T.; Sun, G.; King, J.S. Effects of forest management on productivity and carbon sequestration: A review and hypothesis. For. Ecol. Manag. 2015, 355, 124–140. [Google Scholar] [CrossRef]
- Tang, X.; Fan, S.; Qi, L.; Guan, F.; Du, M.; Zhang, H. Soil respiration and net ecosystem production in relation to intensive management in Moso bamboo forests. CATENA 2016, 137, 219–228. [Google Scholar] [CrossRef]
- Upadhyay, S.; Singh, R.; Verma, P.; Raghubanshi, A.S. Spatio-temporal variability in soil CO2 efflux and regulatory physicochemical parameters from the tropical urban natural and anthropogenic land use classes. J. Environ. Manag. 2021, 295, 113141. [Google Scholar] [CrossRef] [PubMed]
- Republic Hydrometeorological Service of Serbia. Available online: https://www.hidmet.gov.rs/ (accessed on 25 December 2023).
- Jović, D.; Jović, N.; Jovanović, B.; Tomić, Z.; Banković, S.; Medarević, M.; Knežević, M.; Grbić, P.; Živanov, N.; Ivanišević, P. Forest Types of Ravni Srem—Atlas; University of Belgrade—Faculty of Forestry: Belgrade, Serbia, 1994. [Google Scholar]
- Pejaković, Đ. Protected areas in the forest estate Sremska Mitrovica. In 250 Years of Ravni Srem forestry; Tomović, Z., Ed.; Public Enterprise “Vojvodinašume”: Novi Sad, Serbia, 2008; pp. 29–38. [Google Scholar]
- Karaklić, V.; Samardžić, M.; Orlović, S.; Zorić, M.; Kesić, L.; Perendija, N.; Galić, Z. Effect of stand age on soil CO2 emissions in pedunculate oak (Quercus robur L.) forests. Forests 2024, 15, 1574. [Google Scholar] [CrossRef]
- Pavlović, P.; Kostić, N.; Karadžić, B.; Mitrović, M. The Soils of Serbia; Springer: Amsterdam, The Netherlands, 2017; pp. 1–225. [Google Scholar] [CrossRef]
- FAO. World Reference Base for Soil Resources 2014, Update 2015; World Soil Resources Reports 106; FAO: Rome, Italy, 2015. [Google Scholar]
- Avilov, K.V.; Barkov, A.V.; Vasenev, I.I.; Vasenev, I.V.; Vizirskaja, M.M.; Paskarev, A.A.; Terekhov, V.A.; Kurbatova, A.J.; Samardzhich, M. Device for Measuring Emission of Greenhouse Gas from Soil and Plants; Russian Federation’s Federal Service for Intellectual property: Moscow, Russia, 2014; No. RU 2 518 979 C1.
- Buchmann, N. Biotic and abiotic factors controlling soil respiration rates in Picea abies stands. Soil Biol. Biochem. 2000, 32, 1625–1635. [Google Scholar] [CrossRef]
- Karaklić, V.; Galić, Z.; Samardžić, M.; Kesić, L.; Orlović, S.; Zorić, M. Carbon dioxide (CO2) emissions from soils during the regeneration of pedunculate oak (Quercus robur L.) stand in the summer period. Šumarski List 2023, 147, 227–237. [Google Scholar] [CrossRef]
- Ming, A.; Yang, Y.; Liu, S.; Wang, H.; Li, Y.; Li, H.; Nong, Y.; Cai, D.; Jia, H.; Tao, Y.; et al. Effects of near natural forest management on soil greenhouse gas flux in Pinus massoniana (Lamb.) and Cunninghamia lanceolata (Lamb.) Hook. plantations. Forests 2018, 9, 229. [Google Scholar] [CrossRef]
- Iqbal, J.; Ronggui, H.; Lijun, D.; Lan, L.; Shan, L.; Tao, C.; Leilei, R. Differences in soil CO2 flux between different land use types in mid-subtropical China. Soil Biol. Biochem. 2008, 40, 2324–2333. [Google Scholar] [CrossRef]
- Jacinthe, P.A.; Lal, R.; Kimble, J.M. Carbon budget and seasonal carbon dioxide emission from a central Ohio Luvisol as influenced by wheat residue amendment. Soil Tillage Res. 2002, 67, 147–157. [Google Scholar] [CrossRef]
- Sarzhanov, A.D.; Vasenev, I.V.; Vasenev, I.I.; Sotnikova, L.Y.; Ryzhkov, V.O.; Morin, T. Carbon stocks and CO2 emissions of urban and natural soils in Central Chernozemic region of Russia. CATENA 2017, 158, 131–140. [Google Scholar] [CrossRef]
- Jia, B.; Zhou, G.; Wang, Y.; Wang, F.; Wang, X. Effects of temperature and soil water-content on soil respiration of grazed and ungrazed Leymus chinensis steppes, Inner Mongolia. J. Arid. Environ. 2006, 67, 60–76. [Google Scholar] [CrossRef]
- Cui, Y.B.; Feng, J.G.; Liao, L.G.; Yu, R.; Zhang, X.; Liu, Y.H.; Yang, L.-Y.; Zhao, J.-F.; Tan, Z.-H. Controls of temporal variations on soil respiration in a tropical lowland rainforest in Hainan Island, China. Trop. Conserv. Sci. 2020, 13, 1940082920914902. [Google Scholar] [CrossRef]
- Wickham, H. ggplot2: Elegant Graphics for Data Analysis; Springer: New York, NY, USA, 2016. [Google Scholar]
- Ligges, U.; Mächler, M. Scatterplot3d—An R package for visualizing multivariate data. J. Stat. Softw. 2003, 8, 1–20. [Google Scholar] [CrossRef]
- Jandl, R.; Lindner, M.; Vesterdal, L.; Bauwens, B.; Baritz, R.; Hagedorn, F.; Jonson, D.W.; Minkkinen, K.; Byrne, K.A. 2007: How strongly can forest management influence soil carbon sequestration? Geoderma 2007, 137, 253–268. [Google Scholar] [CrossRef]
- Cheng, X.; Kang, F.; Han, H.; Liu, H.; Zhang, Y. Effect of thinning on partitioned soil respiration in a young Pinus tabulaeformis plantation during growing season. Agric. For. Meteorol. 2015, 214, 473–482. [Google Scholar] [CrossRef]
- Søe, A.R.; Buchmann, N. Spatial and temporal variations in soil respiration in relation to stand structure and soil parameters in an unmanaged beech forest. Tree Physiol. 2005, 25, 1427–1436. [Google Scholar] [CrossRef] [PubMed]
- Saiz, G.; Byrne, K.A.; Butterbach-Bahl, K.; Kiese, R.; Blujdea, V.; Farrell, E.P. Stand age-related effects on soil respiration in a first rotation Sitka spruce chronosequence in central Ireland. Glob. Change Biol. 2006, 12, 1007–1020. [Google Scholar] [CrossRef]
- Gao, J.; Zhang, Y.; Song, Q.; Lin, Y.; Zhou, R.; Dong, Y.; Zhou, L.; Li, J.; Jin, Y.; Zhou, W.; et al. Stand age-related effects on soil respiration in rubber plantations (Hevea brasiliensis) in southwest China. Eur. J. Soil Sci. 2019, 70, 1221–1233. [Google Scholar] [CrossRef]
- Nevedrov, N.P.; Sarzhanov, D.A.; Protsenko, E.P.; Vasenev, I.I. Seasonal dynamics of CO2 emission from soils of Kursk. Eurasian Soil Sci. 2021, 54, 80–88. [Google Scholar] [CrossRef]
- Tang, X.L.; Zhou, G.Y.; Liu, S.G.; Zhang, D.Q.; Liu, S.Z.; Li, J.; Zhou, C.Y. Dependence of soil respiration on soil temperature and soil moisture in successional forests in southern China. J. Integr. Plant Biol. 2006, 48, 654–663. [Google Scholar] [CrossRef]
- Brito, L.F.; Azenha, M.V.; Janusckiewicz, E.R.; Cardoso, A.S.; Morgado, E.S.; Malheiros, E.B.; La Scala, N.; Reis, R.A.; Ruggieri, A.C. Seasonal fluctuation of soil carbon dioxide emission in differently managed pastures. Agron. J. 2015, 107, 957–962. [Google Scholar] [CrossRef]
- Wei, S.; Zhang, X.; McLaughlin, N.B.; Liang, A.; Jia, S.; Chen, X.; Chen, X. Effect of soil temperature and soil moisture on CO2 flux from eroded landscape positions on black soil in Northeast China. Soil Tillage Res. 2014, 144, 119–125. [Google Scholar] [CrossRef]
- Almagro, M.; López, J.; Querejeta, J.I.; Martínez-Mena, M. Temperature dependence of soil CO2 efflux is strongly modulated by seasonal patterns of moisture availability in a Mediterranean ecosystem. Soil Biol. Biochem. 2009, 41, 594–605. [Google Scholar] [CrossRef]
- Galić, Z.; Karaklić, V.; Marković, S.B.; Kiš, A.; Samardžić, M. Forest soil CO2 emission in Quercus robur level II monitoring site. Open Geosci. 2024, 16, 20220723. [Google Scholar] [CrossRef]
- Houghton, R.A.; Goodale, C.L. Effects of land-use change on the carbon balance of terrestrial ecosystems. Ecosyst. Land Use Chang. 2004, 153, 85–98. [Google Scholar]
- Cao, S.; He, Y.; Zhang, L.; Sun, Q.; Zhang, Y.; Li, H.; Wei, X.; Liu, Y. Spatiotemporal dynamics of vegetation net ecosystem productivity and its response to drought in Northwest China. GIScience Remote Sens. 2023, 60, 2194597. [Google Scholar] [CrossRef]
- Horwath, W. Carbon cycling and formation of soil organic matter. In Soil Microbiology, Ecology and Biochemistry, 3rd ed.; Paul, E.A., Ed.; Elsevier: Amsterdam, The Netherlands, 2007; pp. 303–339. [Google Scholar]
- Soussana, J.F.; Allard, V.; Pilegaard, K.; Ambus, P.; Amman, C.; Campbell, C.; Ceschia, E.; Clifton-Brown, J.; Czobel, S.; Domingues, R.; et al. Full accounting of the greenhouse gas (CO2, N2O, CH4) budget of nine European grassland sites. Agric. Ecosyst. Environ. 2007, 121, 121–134. [Google Scholar] [CrossRef]
- Rađević, V.; Pap, P.; Vasić, V. Management of the common oak forests in Ravni Srem: Yesterday, today, tomorrow. Topola 2020, 206, 41–52. Available online: https://www.journalpoplar.ilfe.org/sites/default/files/07Radjevic_et_al.pdf (accessed on 5 September 2024). [CrossRef]
- Development Plan of Srem Forest Area. Available online: https://psp.vojvodina.gov.rs/wp-content/uploads/2021/01/Plan-razvoja-Sremskog-sumskog-podrucja-knjiga-1.pdf (accessed on 5 September 2024).
- Zhang, X.; Guan, D.; Li, W.; Sun, D.; Jin, C.; Yuan, F.; Wang, A.; Wu, J. The effects of forest thinning on soil carbon stocks and dynamics: A meta-analysis. For. Ecol. Manag. 2018, 429, 36–43. [Google Scholar] [CrossRef]
- Cheng, X.; Han, H.; Kang, F.; Liu, K.; Song, Y.; Zhou, B.; Li, Y. Short-term effects of thinning on soil respiration in a pine (Pinus tabulaeformis) plantation. Biol. Fertil. Soils 2014, 50, 357–367. [Google Scholar] [CrossRef]
- He, Z.B.; Chen, L.F.; Du, J.; Zhu, X.; Lin, P.F.; Li, J.; Xiang, Y.Z. Responses of soil organic carbon, soil respiration, and associated soil properties to long-term thinning in a semiarid spruce plantation in northwestern China. Land Degrad. Dev. 2018, 29, 4387–4396. [Google Scholar] [CrossRef]
- Mazza, G.; Agnelli, A.E.; Cantiani, P.; Chiavetta, U.; Doukalianou, F.; Kitikidou, K.; Milios, E.; Orfanoudakis, M.; Radoglou, K.; Lagomarsino, A. Short-term effects of thinning on soil CO2, N2O and CH4 fluxes in Mediterranean forest ecosystems. Sci. Total Environ. 2019, 651, 713–724. [Google Scholar] [CrossRef] [PubMed]
- Jónsson, J.Á.; Sigurðsson, B.D. Effects of early thinning and fertilization on soil temperature and soil respiration in a poplar plantation. Icel. Agric. Sci. 2010, 23, 97–109. Available online: https://hdl.handle.net/1946/19929 (accessed on 5 September 2024).
- Masyagina, O.V.; Prokushkin, S.G.; Koike, T. The influence of thinning on the ecological conditions and soil respiration in a larch forest on Hokkaido Island. Eurasian Soil Sci. 2010, 43, 693–700. [Google Scholar] [CrossRef]
Disclaimer/Publisher’s Note: The statements, opinions and data contained in all publications are solely those of the individual author(s) and contributor(s) and not of MDPI and/or the editor(s). MDPI and/or the editor(s) disclaim responsibility for any injury to people or property resulting from any ideas, methods, instructions or products referred to in the content. |
© 2025 by the authors. Licensee MDPI, Basel, Switzerland. This article is an open access article distributed under the terms and conditions of the Creative Commons Attribution (CC BY) license (https://creativecommons.org/licenses/by/4.0/).